Zip Codes with the Highest Percentage of Households with Income Below $10,000 in Warner Robins, GA
RELATED REPORTS & OPTIONS
Household Income | $0-10k
Warner Robins
Compare Zip Codes
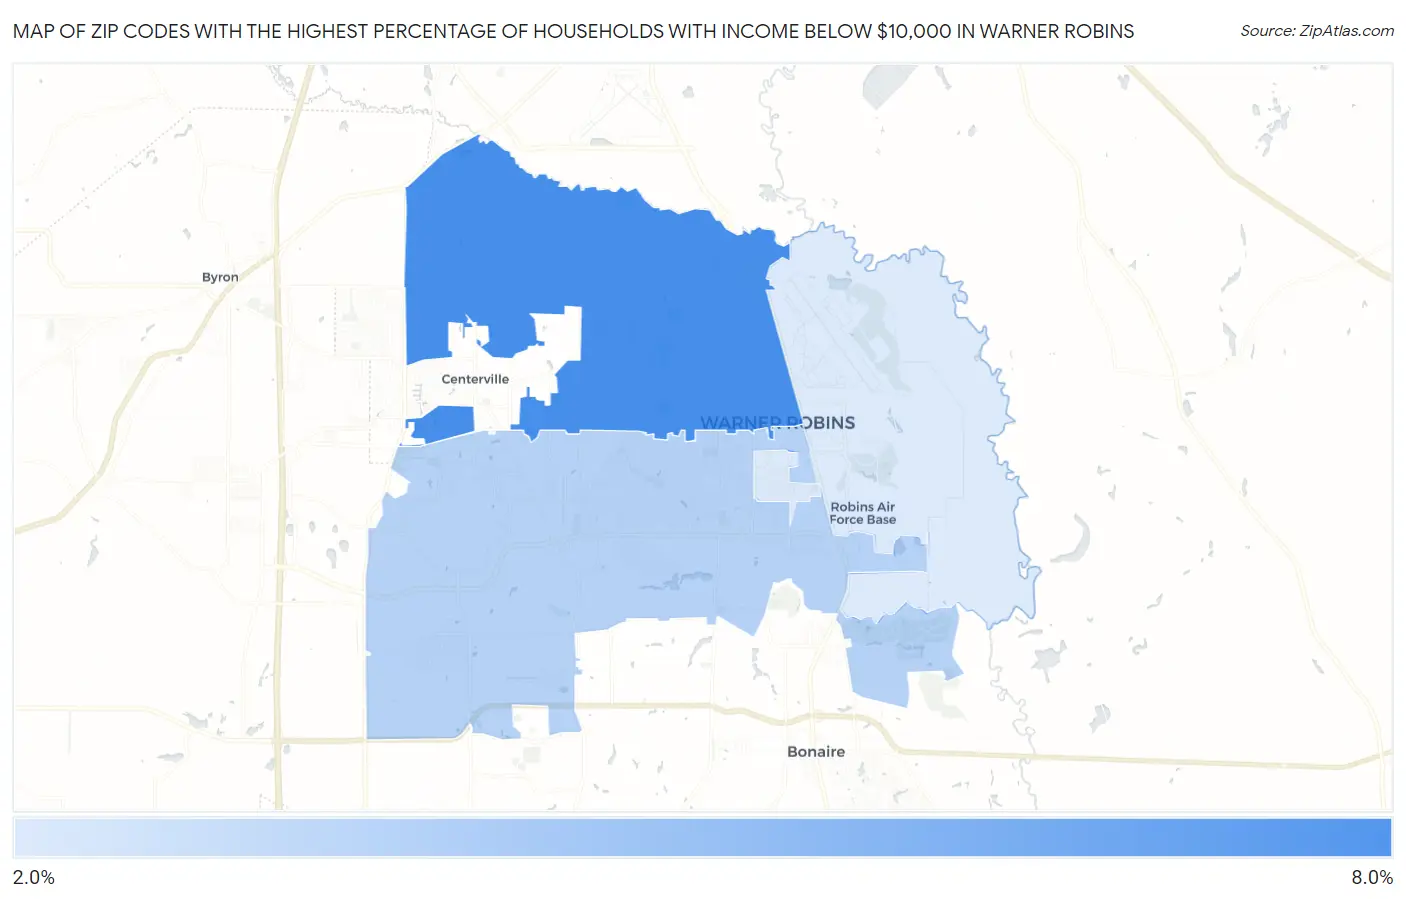
Map of Zip Codes with the Highest Percentage of Households with Income Below $10,000 in Warner Robins
2.2%
6.8%
Zip Codes with the Highest Percentage of Households with Income Below $10,000 in Warner Robins, GA
| Zip Code | Households with Income < $10k | vs State | vs National | |
| 1. | 31093 | 6.8% | 5.4%(+1.40)#253 | 4.9%(+1.90)#7,330 |
| 2. | 31088 | 3.4% | 5.4%(-2.00)#496 | 4.9%(-1.50)#17,602 |
| 3. | 31098 | 2.2% | 5.4%(-3.20)#598 | 4.9%(-2.70)#23,043 |
1
Common Questions
What are the Top Zip Codes with the Highest Percentage of Households with Income Below $10,000 in Warner Robins, GA?
Top Zip Codes with the Highest Percentage of Households with Income Below $10,000 in Warner Robins, GA are:
What zip code has the Highest Percentage of Households with Income Below $10,000 in Warner Robins, GA?
31093 has the Highest Percentage of Households with Income Below $10,000 in Warner Robins, GA with 6.8%.
What is the Percentage of Households with Income Below $10,000 in Warner Robins, GA?
Percentage of Households with Income Below $10,000 in Warner Robins is 4.7%.
What is the Percentage of Households with Income Below $10,000 in Georgia?
Percentage of Households with Income Below $10,000 in Georgia is 5.4%.
What is the Percentage of Households with Income Below $10,000 in the United States?
Percentage of Households with Income Below $10,000 in the United States is 4.9%.