Zip Codes with the Highest Percentage of Population with a Degree in Visual and Performing Arts in Warner Robins, GA
RELATED REPORTS & OPTIONS
Visual and Performing Arts
Warner Robins
Compare Zip Codes
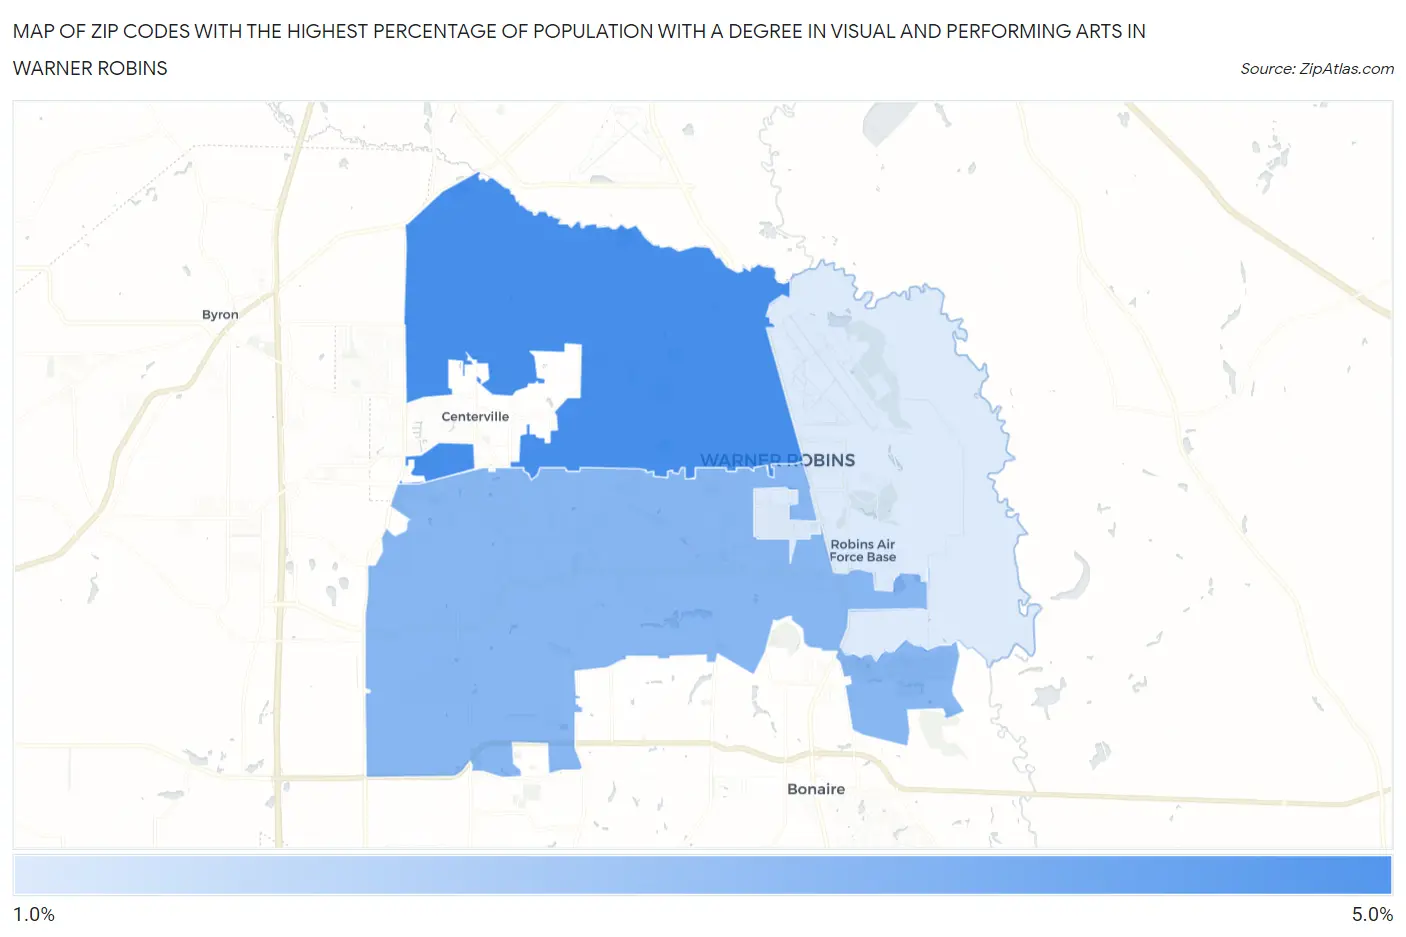
Map of Zip Codes with the Highest Percentage of Population with a Degree in Visual and Performing Arts in Warner Robins
1.3%
4.0%
Zip Codes with the Highest Percentage of Population with a Degree in Visual and Performing Arts in Warner Robins, GA
| Zip Code | % Graduates | vs State | vs National | |
| 1. | 31093 | 4.0% | 3.8%(+0.226)#188 | 4.3%(-0.235)#9,206 |
| 2. | 31088 | 2.9% | 3.8%(-0.932)#283 | 4.3%(-1.39)#13,254 |
| 3. | 31098 | 1.3% | 3.8%(-2.45)#403 | 4.3%(-2.91)#18,634 |
1
Common Questions
What are the Top Zip Codes with the Highest Percentage of Population with a Degree in Visual and Performing Arts in Warner Robins, GA?
Top Zip Codes with the Highest Percentage of Population with a Degree in Visual and Performing Arts in Warner Robins, GA are:
What zip code has the Highest Percentage of Population with a Degree in Visual and Performing Arts in Warner Robins, GA?
31093 has the Highest Percentage of Population with a Degree in Visual and Performing Arts in Warner Robins, GA with 4.0%.
What is the Percentage of Population with a Degree in Visual and Performing Arts in Warner Robins, GA?
Percentage of Population with a Degree in Visual and Performing Arts in Warner Robins is 3.0%.
What is the Percentage of Population with a Degree in Visual and Performing Arts in Georgia?
Percentage of Population with a Degree in Visual and Performing Arts in Georgia is 3.8%.
What is the Percentage of Population with a Degree in Visual and Performing Arts in the United States?
Percentage of Population with a Degree in Visual and Performing Arts in the United States is 4.3%.