Zip Codes with the Highest Percentage of Population Employed in Accommodation & Food Services in Warner Robins, GA
RELATED REPORTS & OPTIONS
Accommodation & Food Services
Warner Robins
Compare Zip Codes
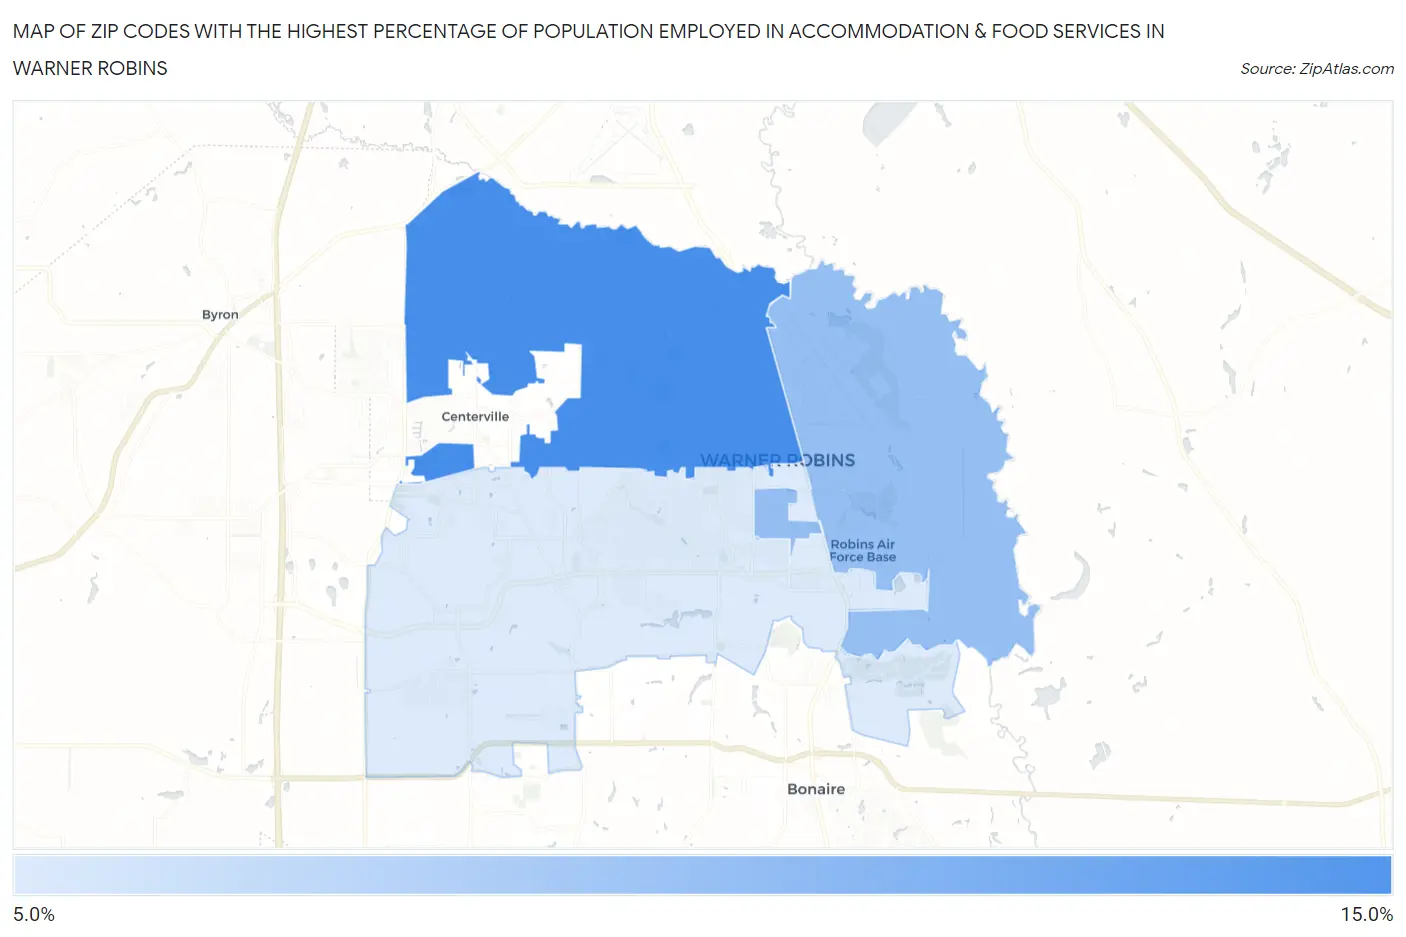
Map of Zip Codes with the Highest Percentage of Population Employed in Accommodation & Food Services in Warner Robins
6.7%
11.4%
Zip Codes with the Highest Percentage of Population Employed in Accommodation & Food Services in Warner Robins, GA
| Zip Code | % Employed | vs State | vs National | |
| 1. | 31093 | 11.4% | 7.2%(+4.18)#67 | 6.9%(+4.50)#3,249 |
| 2. | 31098 | 8.9% | 7.2%(+1.72)#145 | 6.9%(+2.05)#6,075 |
| 3. | 31088 | 6.7% | 7.2%(-0.472)#298 | 6.9%(-0.147)#11,098 |
1
Common Questions
What are the Top Zip Codes with the Highest Percentage of Population Employed in Accommodation & Food Services in Warner Robins, GA?
Top Zip Codes with the Highest Percentage of Population Employed in Accommodation & Food Services in Warner Robins, GA are:
What zip code has the Highest Percentage of Population Employed in Accommodation & Food Services in Warner Robins, GA?
31093 has the Highest Percentage of Population Employed in Accommodation & Food Services in Warner Robins, GA with 11.4%.
What is the Percentage of Population Employed in Accommodation & Food Services in Warner Robins, GA?
Percentage of Population Employed in Accommodation & Food Services in Warner Robins is 8.3%.
What is the Percentage of Population Employed in Accommodation & Food Services in Georgia?
Percentage of Population Employed in Accommodation & Food Services in Georgia is 7.2%.
What is the Percentage of Population Employed in Accommodation & Food Services in the United States?
Percentage of Population Employed in Accommodation & Food Services in the United States is 6.9%.