Zip Codes with the Highest Percentage of Population Employed in Architecture & Engineering in Warner Robins, GA
RELATED REPORTS & OPTIONS
Architecture & Engineering
Warner Robins
Compare Zip Codes
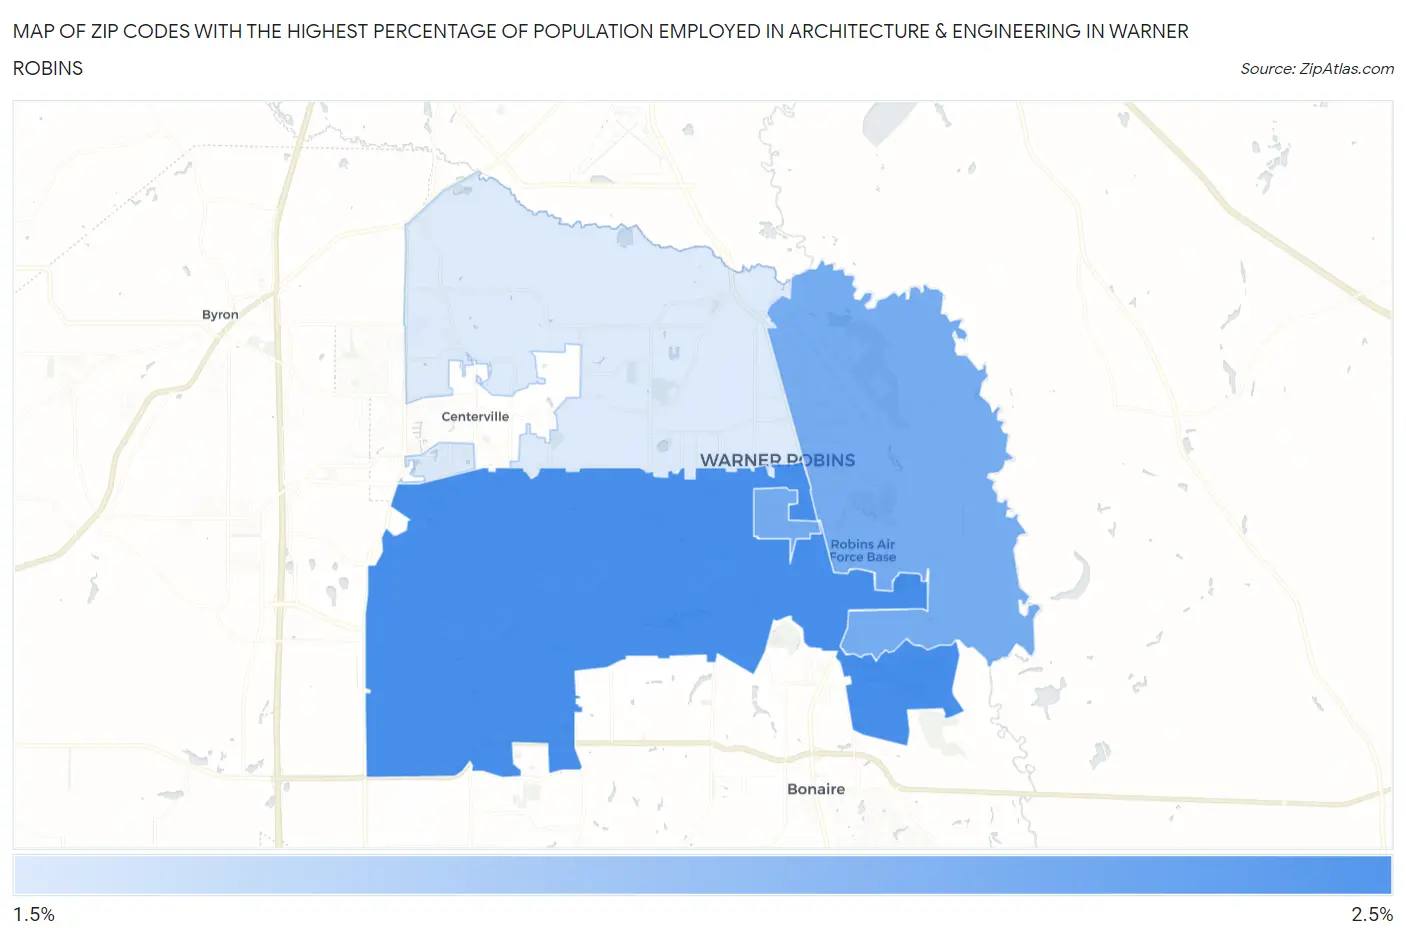
Map of Zip Codes with the Highest Percentage of Population Employed in Architecture & Engineering in Warner Robins
2.3%
2.4%
Zip Codes with the Highest Percentage of Population Employed in Architecture & Engineering in Warner Robins, GA
| Zip Code | % Employed | vs State | vs National | |
| 1. | 31088 | 2.4% | 1.8%(+0.622)#129 | 2.1%(+0.268)#7,399 |
| 2. | 31098 | 2.4% | 1.8%(+0.586)#133 | 2.1%(+0.232)#7,562 |
| 3. | 31093 | 2.3% | 1.8%(+0.507)#145 | 2.1%(+0.153)#7,925 |
1
Common Questions
What are the Top Zip Codes with the Highest Percentage of Population Employed in Architecture & Engineering in Warner Robins, GA?
Top Zip Codes with the Highest Percentage of Population Employed in Architecture & Engineering in Warner Robins, GA are:
What zip code has the Highest Percentage of Population Employed in Architecture & Engineering in Warner Robins, GA?
31088 has the Highest Percentage of Population Employed in Architecture & Engineering in Warner Robins, GA with 2.4%.
What is the Percentage of Population Employed in Architecture & Engineering in Warner Robins, GA?
Percentage of Population Employed in Architecture & Engineering in Warner Robins is 3.6%.
What is the Percentage of Population Employed in Architecture & Engineering in Georgia?
Percentage of Population Employed in Architecture & Engineering in Georgia is 1.8%.
What is the Percentage of Population Employed in Architecture & Engineering in the United States?
Percentage of Population Employed in Architecture & Engineering in the United States is 2.1%.