Zip Codes with the Highest Percentage of Households with Income Below $10,000 in Dalton, GA
RELATED REPORTS & OPTIONS
Household Income | $0-10k
Dalton
Compare Zip Codes
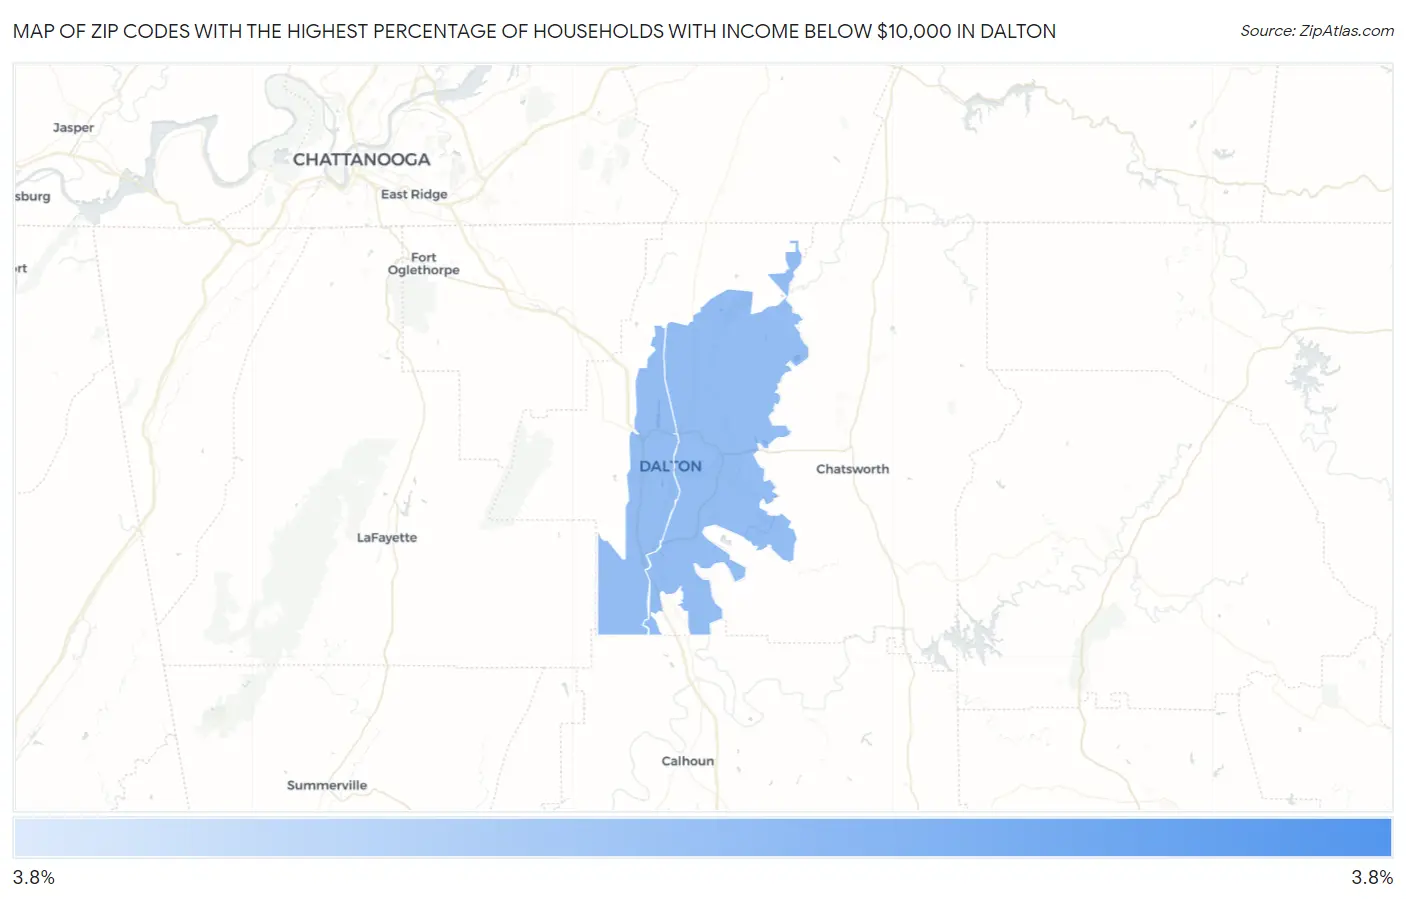
Map of Zip Codes with the Highest Percentage of Households with Income Below $10,000 in Dalton
3.8%
3.8%
Zip Codes with the Highest Percentage of Households with Income Below $10,000 in Dalton, GA
| Zip Code | Households with Income < $10k | vs State | vs National | |
| 1. | 30721 | 3.8% | 5.4%(-1.60)#467 | 4.9%(-1.10)#15,973 |
| 2. | 30720 | 3.8% | 5.4%(-1.60)#468 | 4.9%(-1.10)#16,042 |
1
Common Questions
What are the Top Zip Codes with the Highest Percentage of Households with Income Below $10,000 in Dalton, GA?
Top Zip Codes with the Highest Percentage of Households with Income Below $10,000 in Dalton, GA are:
What zip code has the Highest Percentage of Households with Income Below $10,000 in Dalton, GA?
30721 has the Highest Percentage of Households with Income Below $10,000 in Dalton, GA with 3.8%.
What is the Percentage of Households with Income Below $10,000 in Dalton, GA?
Percentage of Households with Income Below $10,000 in Dalton is 4.4%.
What is the Percentage of Households with Income Below $10,000 in Georgia?
Percentage of Households with Income Below $10,000 in Georgia is 5.4%.
What is the Percentage of Households with Income Below $10,000 in the United States?
Percentage of Households with Income Below $10,000 in the United States is 4.9%.