Palestinian vs Hmong Disability Age Under 5

COMPARE

Palestinian
Race
Ancestry
AfghanAfricanAlaska NativeAlaskan AthabascanAlbanianAleutAlsatianAmericanApacheArabArapahoArgentineanArmenianAssyrian/Chaldean/SyriacAustralianAustrianBahamianBangladeshiBarbadianBasqueBelgianBelizeanBermudanBhutaneseBlackfeetBolivianBrazilianBritishBritish West IndianBulgarianBurmeseCajunCambodianCanadianCape VerdeanCarpatho RusynCelticCentral AmericanCentral American IndianCherokeeCheyenneChickasawChileanChineseChippewaChoctawColombianColvilleComancheCosta RicanCreeCreekCroatianCrowCubanCypriotCzechCzechoslovakianDanishDelawareDominicanDutchDutch West IndianEastern EuropeanEcuadorianEgyptianEnglishEstonianEthiopianEuropeanFijianFilipinoFinnishFrenchFrench American IndianFrench CanadianGermanGerman RussianGhanaianGreekGuamanian/ChamorroGuatemalanGuyaneseHaitianHonduranHopiHoumaHungarianIcelanderIndian (Asian)IndonesianInupiatIranianIraqiIrishIroquoisIsraeliItalianJamaicanJapaneseJordanianKenyanKiowaKoreanLaotianLatvianLebaneseLiberianLithuanianLumbeeLuxembourgerMacedonianMalaysianMalteseMarshalleseMenomineeMexicanMexican American IndianMongolianMoroccanNative HawaiianNavajoNepaleseNew ZealanderNicaraguanNigerianNorthern EuropeanNorwegianOkinawanOsageOttawaPaiutePakistaniPalestinianPanamanianParaguayanPennsylvania GermanPeruvianPimaPolishPortuguesePotawatomiPuebloPuerto RicanPuget Sound SalishRomanianRussianSalvadoranSamoanScandinavianScotch-IrishScottishSeminoleSenegaleseSerbianShoshoneSierra LeoneanSiouxSlavicSlovakSloveneSomaliSouth AfricanSouth AmericanSouth American IndianSoviet UnionSpaniardSpanishSpanish AmericanSpanish American IndianSri LankanSubsaharan AfricanSudaneseSwedishSwissSyrianTaiwaneseThaiTlingit-HaidaTohono O'OdhamTonganTrinidadian and TobagonianTsimshianTurkishU.S. Virgin IslanderUgandanUkrainianUruguayanUteVenezuelanVietnameseWelshWest IndianYakamaYaquiYugoslavianYumanYup'ikZimbabwean
Immigration
NonimmigrantsImmigrantsAfghanistanAfricaAlbaniaArgentinaArmeniaAsiaAustraliaAustriaBahamasBangladeshBarbadosBelarusBelgiumBelizeBoliviaBosnia and HerzegovinaBrazilBulgariaBurma/MyanmarCabo VerdeCambodiaCameroonCanadaCaribbeanCentral AmericaChileChinaColombiaCongoCosta RicaCroatiaCubaCzechoslovakiaDenmarkDominicaDominican RepublicEastern AfricaEastern AsiaEastern EuropeEcuadorEgyptEl SalvadorEnglandEritreaEthiopiaEuropeFijiFranceGermanyGhanaGreeceGrenadaGuatemalaGuyanaHaitiHondurasHong KongHungaryIndiaIndonesiaIranIraqIrelandIsraelItalyJamaicaJapanJordanKazakhstanKenyaKoreaKuwaitLaosLatin AmericaLatviaLebanonLiberiaLithuaniaMalaysiaMexicoMicronesiaMiddle AfricaMoldovaMoroccoNepalNetherlandsNicaraguaNigeriaNorth AmericaNorth MacedoniaNorthern AfricaNorthern EuropeNorwayOceaniaPakistanPanamaPeruPhilippinesPolandPortugalRomaniaRussiaSaudi ArabiaScotlandSenegalSerbiaSierra LeoneSingaporeSomaliaSouth AfricaSouth AmericaSouth Central AsiaSouth Eastern AsiaSouthern EuropeSpainSri LankaSt. Vincent and the GrenadinesSudanSwedenSwitzerlandSyriaTaiwanThailandTrinidad and TobagoTurkeyUgandaUkraineUruguayUzbekistanVenezuelaVietnamWest IndiesWestern AfricaWestern AsiaWestern EuropeYemenZaireZimbabweAzores
Hmong
Race
Ancestry
AfghanAfricanAlaska NativeAlaskan AthabascanAlbanianAleutAlsatianAmericanApacheArabArapahoArgentineanArmenianAssyrian/Chaldean/SyriacAustralianAustrianBahamianBangladeshiBarbadianBasqueBelgianBelizeanBermudanBhutaneseBlackfeetBolivianBrazilianBritishBritish West IndianBulgarianBurmeseCajunCambodianCanadianCape VerdeanCarpatho RusynCelticCentral AmericanCentral American IndianCherokeeCheyenneChickasawChileanChineseChippewaChoctawColombianColvilleComancheCosta RicanCreeCreekCroatianCrowCubanCypriotCzechCzechoslovakianDanishDelawareDominicanDutchDutch West IndianEastern EuropeanEcuadorianEgyptianEnglishEstonianEthiopianEuropeanFijianFilipinoFinnishFrenchFrench American IndianFrench CanadianGermanGerman RussianGhanaianGreekGuamanian/ChamorroGuatemalanGuyaneseHaitianHmongHonduranHopiHoumaHungarianIcelanderIndian (Asian)IndonesianInupiatIranianIraqiIrishIroquoisIsraeliItalianJamaicanJapaneseJordanianKenyanKiowaKoreanLaotianLatvianLebaneseLiberianLithuanianLumbeeLuxembourgerMacedonianMalaysianMalteseMarshalleseMenomineeMexicanMexican American IndianMongolianMoroccanNative HawaiianNavajoNepaleseNew ZealanderNicaraguanNigerianNorthern EuropeanNorwegianOkinawanOsageOttawaPaiutePakistaniPanamanianParaguayanPennsylvania GermanPeruvianPimaPolishPortuguesePotawatomiPuebloPuerto RicanPuget Sound SalishRomanianRussianSalvadoranSamoanScandinavianScotch-IrishScottishSeminoleSenegaleseSerbianShoshoneSierra LeoneanSiouxSlavicSlovakSloveneSomaliSouth AfricanSouth AmericanSouth American IndianSoviet UnionSpaniardSpanishSpanish AmericanSpanish American IndianSri LankanSubsaharan AfricanSudaneseSwedishSwissSyrianTaiwaneseThaiTlingit-HaidaTohono O'OdhamTonganTrinidadian and TobagonianTsimshianTurkishU.S. Virgin IslanderUgandanUkrainianUruguayanUteVenezuelanVietnameseWelshWest IndianYakamaYaquiYugoslavianYumanYup'ikZimbabwean
Immigration
NonimmigrantsImmigrantsAfghanistanAfricaAlbaniaArgentinaArmeniaAsiaAustraliaAustriaBahamasBangladeshBarbadosBelarusBelgiumBelizeBoliviaBosnia and HerzegovinaBrazilBulgariaBurma/MyanmarCabo VerdeCambodiaCameroonCanadaCaribbeanCentral AmericaChileChinaColombiaCongoCosta RicaCroatiaCubaCzechoslovakiaDenmarkDominicaDominican RepublicEastern AfricaEastern AsiaEastern EuropeEcuadorEgyptEl SalvadorEnglandEritreaEthiopiaEuropeFijiFranceGermanyGhanaGreeceGrenadaGuatemalaGuyanaHaitiHondurasHong KongHungaryIndiaIndonesiaIranIraqIrelandIsraelItalyJamaicaJapanJordanKazakhstanKenyaKoreaKuwaitLaosLatin AmericaLatviaLebanonLiberiaLithuaniaMalaysiaMexicoMicronesiaMiddle AfricaMoldovaMoroccoNepalNetherlandsNicaraguaNigeriaNorth AmericaNorth MacedoniaNorthern AfricaNorthern EuropeNorwayOceaniaPakistanPanamaPeruPhilippinesPolandPortugalRomaniaRussiaSaudi ArabiaScotlandSenegalSerbiaSierra LeoneSingaporeSomaliaSouth AfricaSouth AmericaSouth Central AsiaSouth Eastern AsiaSouthern EuropeSpainSri LankaSt. Vincent and the GrenadinesSudanSwedenSwitzerlandSyriaTaiwanThailandTrinidad and TobagoTurkeyUgandaUkraineUruguayUzbekistanVenezuelaVietnamWest IndiesWestern AfricaWestern AsiaWestern EuropeYemenZaireZimbabweAzores
Disability Age Under 5
Income
Poverty
Unemployment
Labor Participation
Family Structure
Vehicle Availability
Education Level
Disability

Disability Age Under 5 Comparison

Palestinians

Hmong

Average
Exceptional
1.2%
DISABILITY AGE UNDER 5
43.0/ 100
METRIC RATING
184th/ 347
METRIC RANK
1.1%
DISABILITY AGE UNDER 5
98.0/ 100
METRIC RATING
79th/ 347
METRIC RANK

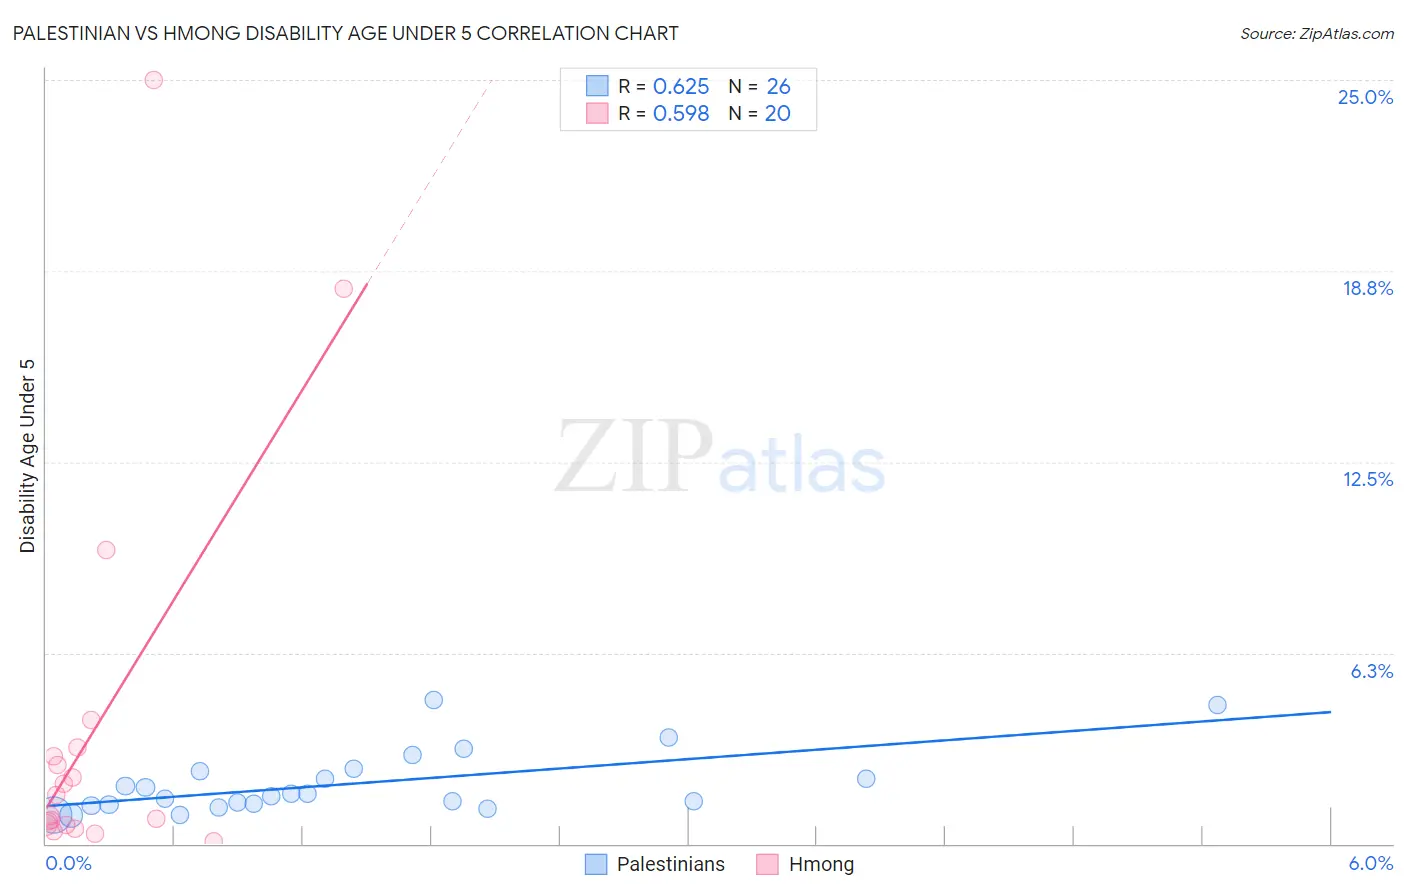
Palestinian vs Hmong Disability Age Under 5 Correlation Chart

The statistical analysis conducted on geographies consisting of 140,188,705 people shows a significant positive correlation between the proportion of Palestinians and percentage of population with a disability under the age of 5 in the United States with a correlation coefficient (R) of 0.625 and weighted average of 1.2%. Similarly, the statistical analysis conducted on geographies consisting of 22,687,572 people shows a substantial positive correlation between the proportion of Hmong and percentage of population with a disability under the age of 5 in the United States with a correlation coefficient (R) of 0.598 and weighted average of 1.1%, a difference of 10.4%.
Palestinian vs Hmong Disability Age Under 5

Disability Age Under 5 Correlation Summary

MeasurementPalestinianHmong
Minimum0.93%0.097%
Maximum4.7%25.0%
Range3.8%24.9%
Mean2.0%3.9%
Median1.6%1.3%
Interquartile 25% (IQ1)1.3%0.61%
Interquartile 75% (IQ3)2.4%3.0%
Interquartile Range (IQR)1.1%2.4%
Standard Deviation (Sample)1.0%6.5%
Standard Deviation (Population)1.0%6.4%

Similar Demographics by Disability Age Under 5

Demographics Similar to Palestinians by Disability Age Under 5

In terms of disability age under 5, the demographic groups most similar to Palestinians are Immigrants from Saudi Arabia (1.2%, a difference of 0.020%), Immigrants from Western Africa (1.2%, a difference of 0.050%), Cuban (1.2%, a difference of 0.050%), Macedonian (1.2%, a difference of 0.060%), and Immigrants from Peru (1.2%, a difference of 0.060%).
DemographicsRating | RankDisability Age Under 5
Comanche
47.5
/100
|
#177
Average
1.2%
Venezuelans
47.1
/100
|
#178
Average
1.2%
Immigrants | Bahamas
45.2
/100
|
#179
Average
1.2%
Immigrants | Mexico
44.4
/100
|
#180
Average
1.2%
Macedonians
43.7
/100
|
#181
Average
1.2%
Immigrants | Peru
43.7
/100
|
#181
Average
1.2%
Immigrants | Saudi Arabia
43.3
/100
|
#183
Average
1.2%
Palestinians
43.0
/100
|
#184
Average
1.2%
Immigrants | Western Africa
42.5
/100
|
#185
Average
1.2%
Cubans
42.5
/100
|
#186
Average
1.2%
Immigrants | Haiti
40.2
/100
|
#187
Average
1.3%
Haitians
39.9
/100
|
#188
Fair
1.3%
Peruvians
37.6
/100
|
#189
Fair
1.3%
Immigrants | Laos
36.6
/100
|
#190
Fair
1.3%
Mexican American Indians
36.6
/100
|
#191
Fair
1.3%

Demographics Similar to Hmong by Disability Age Under 5

In terms of disability age under 5, the demographic groups most similar to Hmong are West Indian (1.1%, a difference of 0.020%), Immigrants from Trinidad and Tobago (1.1%, a difference of 0.020%), Turkish (1.1%, a difference of 0.040%), Immigrants from Denmark (1.1%, a difference of 0.14%), and Immigrants from Jordan (1.1%, a difference of 0.16%).
DemographicsRating | RankDisability Age Under 5
Burmese
98.5
/100
|
#72
Exceptional
1.1%
Immigrants | Sri Lanka
98.5
/100
|
#73
Exceptional
1.1%
Jordanians
98.5
/100
|
#74
Exceptional
1.1%
Immigrants | Pakistan
98.4
/100
|
#75
Exceptional
1.1%
Immigrants | Burma/Myanmar
98.2
/100
|
#76
Exceptional
1.1%
Immigrants | Denmark
98.1
/100
|
#77
Exceptional
1.1%
West Indians
98.0
/100
|
#78
Exceptional
1.1%
Hmong
98.0
/100
|
#79
Exceptional
1.1%
Immigrants | Trinidad and Tobago
98.0
/100
|
#80
Exceptional
1.1%
Turks
98.0
/100
|
#81
Exceptional
1.1%
Immigrants | Jordan
97.9
/100
|
#82
Exceptional
1.1%
Immigrants | Syria
97.9
/100
|
#83
Exceptional
1.1%
Immigrants | Zaire
97.8
/100
|
#84
Exceptional
1.1%
Sudanese
97.7
/100
|
#85
Exceptional
1.1%
Okinawans
97.6
/100
|
#86
Exceptional
1.1%