Zip Codes with the Highest Percentage of Households with Income Below $10,000 in Wilmington, DE

RELATED REPORTS & OPTIONS

Household Income | $0-10k
Population
Families and Households
Female Fertility
Female Fertility (Unmarried)
Race (Community Size)
Race (Percentage)
Ancestry (Community Size)
AfricanAlbanianAlsatianAmericanArabArgentineanArmenianAustralianAustrianBarbadianBelgianBhutaneseBlackfeetBolivianBritishBritish West IndianBulgarianBurmeseCanadianCelticCentral AmericanCentral American IndianCherokeeChileanChippewaColombianCosta RicanCroatianCubanCzechCzechoslovakianDanishDelawareDominicanDutchEastern EuropeanEcuadorianEgyptianEnglishEstonianEthiopianEuropeanFilipinoFinnishFrenchFrench CanadianGermanGhanaianGreekGuatemalanGuyaneseHaitianHonduranHungarianIndian (Asian)IranianIrishIsraeliItalianJamaicanKenyanKoreanLaotianLatvianLebaneseLithuanianMexicanMongolianNative HawaiianNigerianNorthern EuropeanNorwegianPakistaniPanamanianPennsylvania GermanPeruvianPolishPortuguesePuerto RicanRomanianRussianSalvadoranSamoanScandinavianScotch-IrishScottishSerbianSlavicSlovakSloveneSouth AfricanSouth AmericanSouth American IndianSpaniardSpanishSri LankanSubsaharan AfricanSwedishSwissThaiTrinidadian and TobagonianTurkishUkrainianUruguayanVenezuelanVietnameseWelshWest Indian
Ancestry (Percentage)
AfricanAlbanianAlsatianAmericanArabArgentineanArmenianAustralianAustrianBarbadianBelgianBhutaneseBlackfeetBolivianBritishBritish West IndianBulgarianBurmeseCanadianCelticCentral AmericanCentral American IndianCherokeeChileanChippewaColombianCosta RicanCroatianCubanCzechCzechoslovakianDanishDelawareDominicanDutchEastern EuropeanEcuadorianEgyptianEnglishEstonianEthiopianEuropeanFilipinoFinnishFrenchFrench CanadianGermanGhanaianGreekGuatemalanGuyaneseHaitianHonduranHungarianIndian (Asian)IranianIrishIsraeliItalianJamaicanKenyanKoreanLaotianLatvianLebaneseLithuanianMexicanMongolianNative HawaiianNigerianNorthern EuropeanNorwegianPakistaniPanamanianPennsylvania GermanPeruvianPolishPortuguesePuerto RicanRomanianRussianSalvadoranSamoanScandinavianScotch-IrishScottishSerbianSlavicSlovakSloveneSouth AfricanSouth AmericanSouth American IndianSpaniardSpanishSri LankanSubsaharan AfricanSwedishSwissThaiTrinidadian and TobagonianTurkishUkrainianUruguayanVenezuelanVietnameseWelshWest Indian
Immigrant Origin (Total)
Immigrant Origin (Percentage)
Income
Income (Families)
Income (Households)
Poverty
Poverty (Families)
Unemployment
Employment Occupations
Employment Industries
Employer Class
Commute Time
Commute Means
School Enrollment
Education by Degree Field
Occupancy
Finances
Physical Characteristics
Wilmington
Compare Zip Codes
Comparison Subject

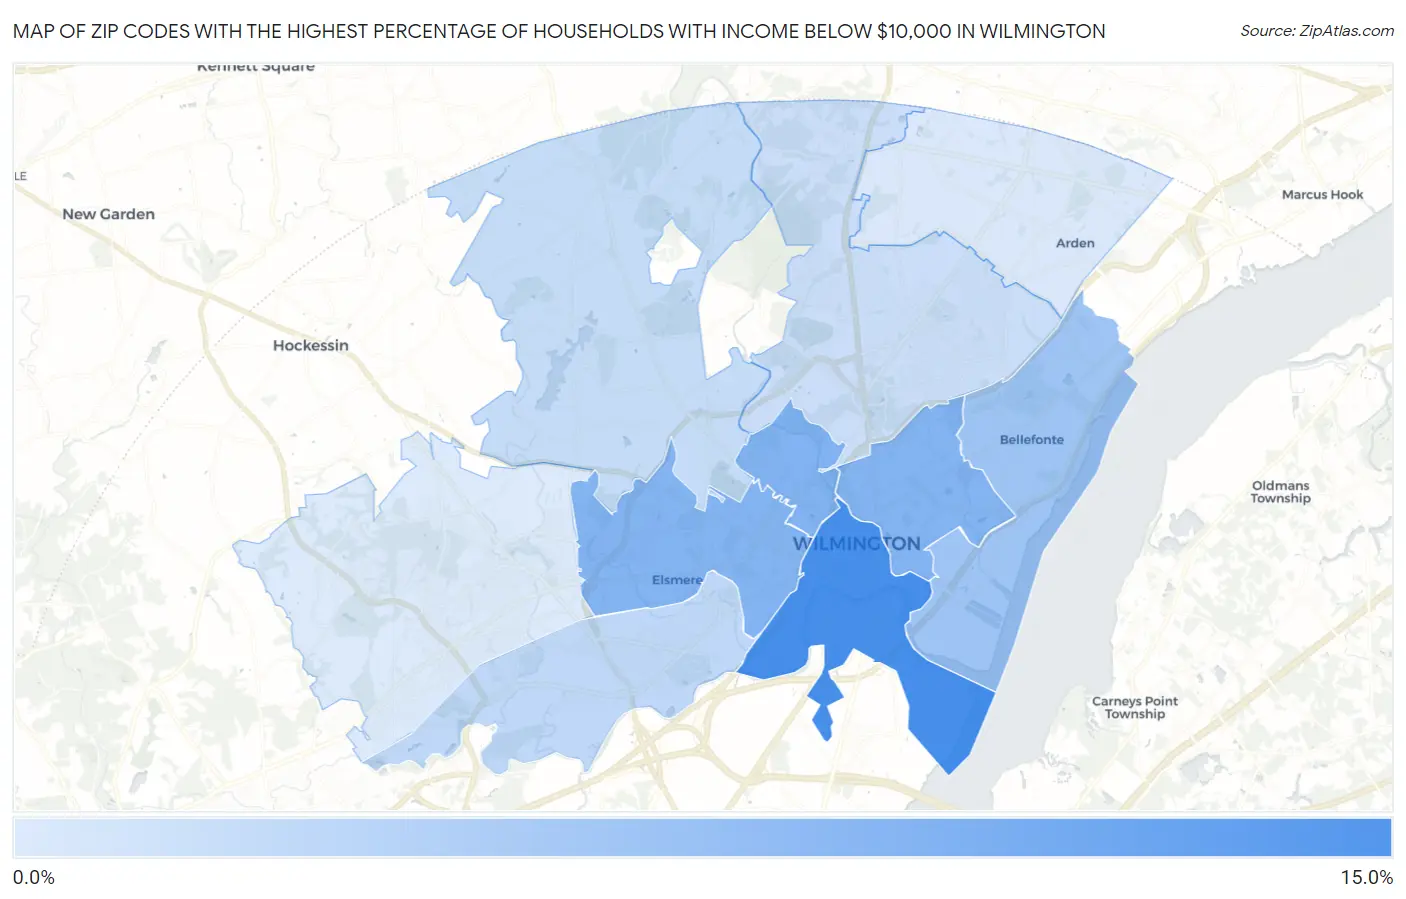
Map of Zip Codes with the Highest Percentage of Households with Income Below $10,000 in Wilmington

0.0%
15.0%
Zip Codes with the Highest Percentage of Households with Income Below $10,000 in Wilmington Map

Zip Codes with the Highest Percentage of Households with Income Below $10,000 in Wilmington, DE

Zip Code Households with Income < $10k vs State vs National
1.1980112.3%4.3%(+8.00)#14.9%(+7.40)#2,330
2.198068.5%4.3%(+4.20)#34.9%(+3.60)#4,941
3.198058.4%4.3%(+4.10)#44.9%(+3.50)#5,022
4.198028.4%4.3%(+4.10)#54.9%(+3.50)#5,033
5.198096.6%4.3%(+2.30)#104.9%(+1.70)#7,744
6.198044.5%4.3%(+0.200)#194.9%(-0.400)#13,406
7.198074.1%4.3%(-0.200)#254.9%(-0.800)#14,986
8.198033.8%4.3%(-0.500)#294.9%(-1.10)#16,063
9.198102.9%4.3%(-1.40)#354.9%(-2.00)#19,852
10.198082.7%4.3%(-1.60)#394.9%(-2.20)#20,676

Common Questions

What are the Top 5 Zip Codes with the Highest Percentage of Households with Income Below $10,000 in Wilmington, DE?
Top 5 Zip Codes with the Highest Percentage of Households with Income Below $10,000 in Wilmington, DE are:
#1
12.3%
#2
8.5%
#3
8.4%
#4
8.4%
#5
6.6%
What zip code has the Highest Percentage of Households with Income Below $10,000 in Wilmington, DE?
19801 has the Highest Percentage of Households with Income Below $10,000 in Wilmington, DE with 12.3%.
What is the Percentage of Households with Income Below $10,000 in Wilmington, DE?
Percentage of Households with Income Below $10,000 in Wilmington is 10.1%.
What is the Percentage of Households with Income Below $10,000 in Delaware?
Percentage of Households with Income Below $10,000 in Delaware is 4.3%.
What is the Percentage of Households with Income Below $10,000 in the United States?
Percentage of Households with Income Below $10,000 in the United States is 4.9%.