Zip Codes with the Highest Percentage of Immigrants from Eastern Asia in Wilmington, DE
RELATED REPORTS & OPTIONS
Eastern Asia
Wilmington
Compare Zip Codes
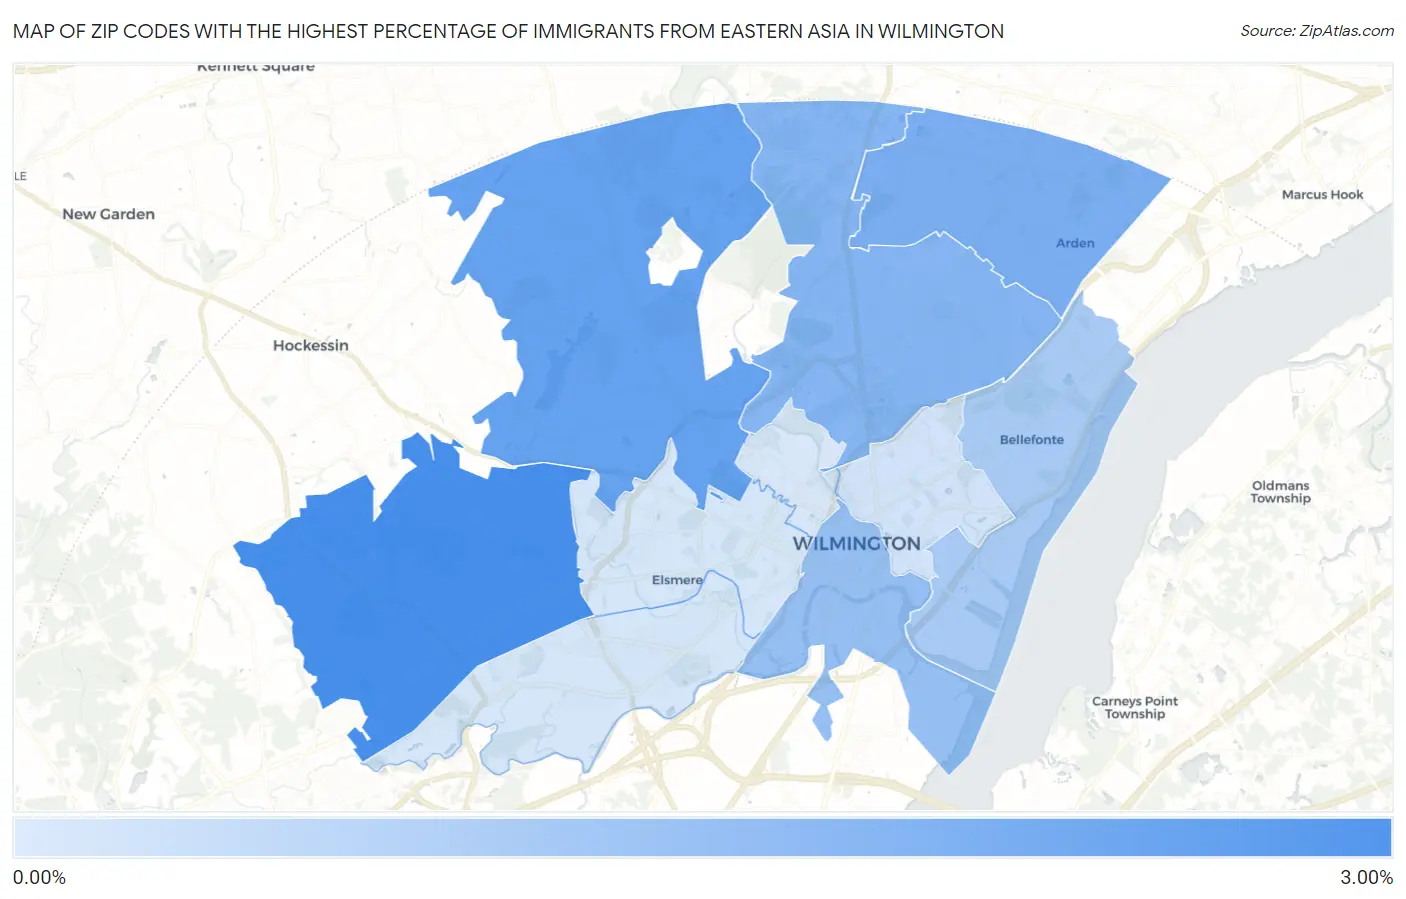
Map of Zip Codes with the Highest Percentage of Immigrants from Eastern Asia in Wilmington
0.078%
2.82%
Zip Codes with the Highest Percentage of Immigrants from Eastern Asia in Wilmington, DE
| Zip Code | Eastern Asia | vs State | vs National | |
| 1. | 19808 | 2.82% | 0.94%(+1.88)#2 | 1.28%(+1.55)#1,405 |
| 2. | 19807 | 2.26% | 0.94%(+1.32)#5 | 1.28%(+0.980)#1,777 |
| 3. | 19810 | 1.85% | 0.94%(+0.911)#9 | 1.28%(+0.574)#2,176 |
| 4. | 19803 | 1.63% | 0.94%(+0.694)#10 | 1.28%(+0.357)#2,467 |
| 5. | 19801 | 1.32% | 0.94%(+0.385)#11 | 1.28%(+0.048)#3,001 |
| 6. | 19809 | 1.00% | 0.94%(+0.065)#15 | 1.28%(-0.271)#3,880 |
| 7. | 19802 | 0.23% | 0.94%(-0.709)#26 | 1.28%(-1.05)#9,796 |
| 8. | 19805 | 0.12% | 0.94%(-0.820)#31 | 1.28%(-1.16)#11,776 |
| 9. | 19804 | 0.11% | 0.94%(-0.828)#32 | 1.28%(-1.16)#11,941 |
| 10. | 19806 | 0.078% | 0.94%(-0.861)#35 | 1.28%(-1.20)#12,663 |
1
Common Questions
What are the Top 5 Zip Codes with the Highest Percentage of Immigrants from Eastern Asia in Wilmington, DE?
Top 5 Zip Codes with the Highest Percentage of Immigrants from Eastern Asia in Wilmington, DE are:
What zip code has the Highest Percentage of Immigrants from Eastern Asia in Wilmington, DE?
19808 has the Highest Percentage of Immigrants from Eastern Asia in Wilmington, DE with 2.82%.
What is the Percentage of Immigrants from Eastern Asia in Wilmington, DE?
Percentage of Immigrants from Eastern Asia in Wilmington is 0.39%.
What is the Percentage of Immigrants from Eastern Asia in Delaware?
Percentage of Immigrants from Eastern Asia in Delaware is 0.94%.
What is the Percentage of Immigrants from Eastern Asia in the United States?
Percentage of Immigrants from Eastern Asia in the United States is 1.28%.