Zip Codes with the Highest Percentage of Households Heated by Fuel Oil / Kerosene in Wilmington, DE
RELATED REPORTS & OPTIONS
Fuel Oil Heating
Wilmington
Compare Zip Codes
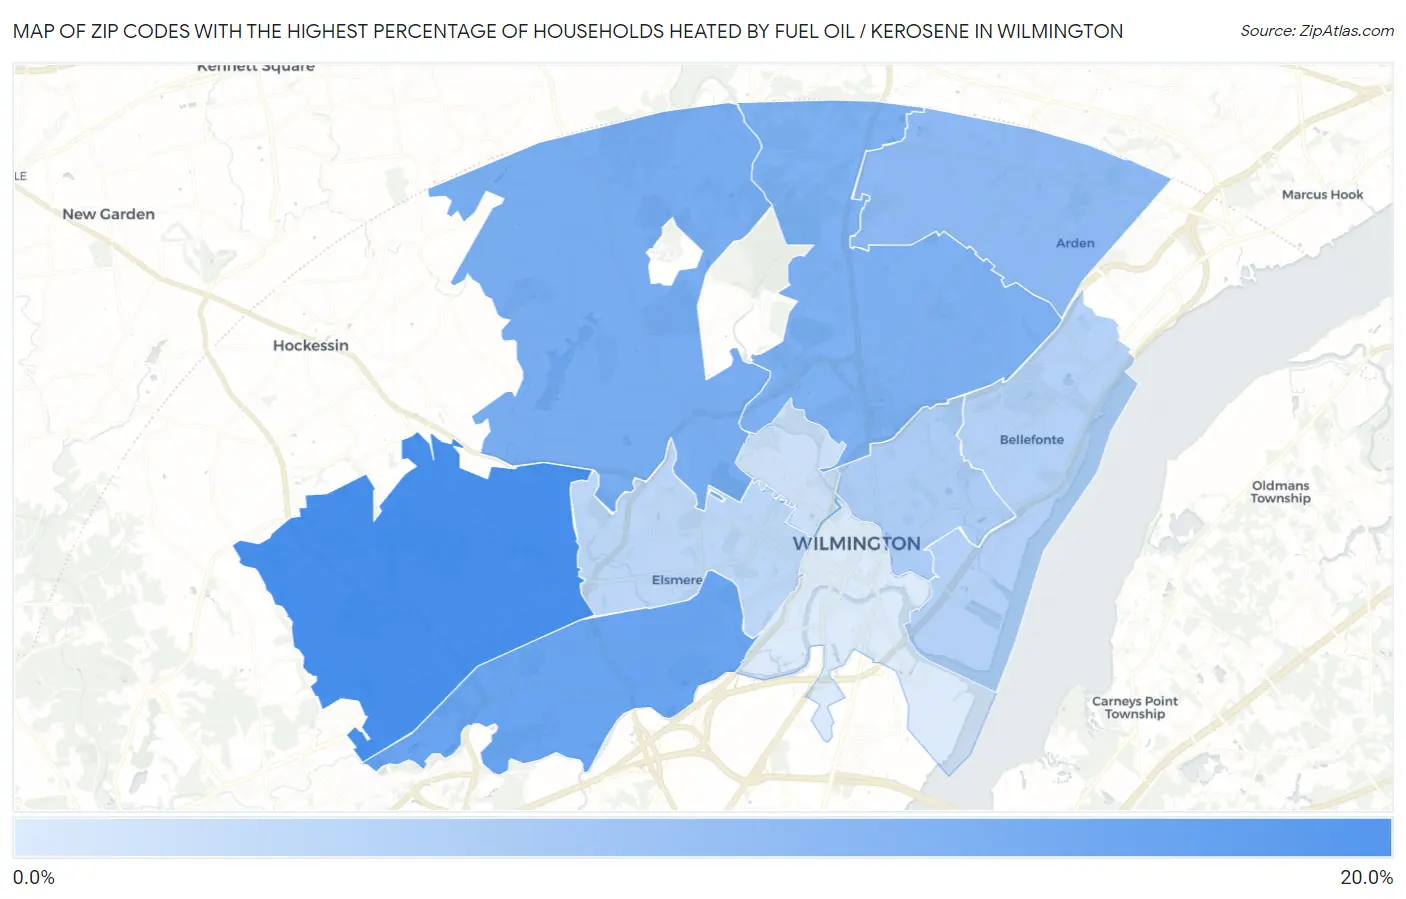
Map of Zip Codes with the Highest Percentage of Households Heated by Fuel Oil / Kerosene in Wilmington
2.9%
19.7%
Zip Codes with the Highest Percentage of Households Heated by Fuel Oil / Kerosene in Wilmington, DE
| Zip Code | Fuel Oil Heating | vs State | vs National | |
| 1. | 19808 | 19.7% | 10.1%(+9.60)#11 | 4.2%(+15.5)#4,319 |
| 2. | 19804 | 15.6% | 10.1%(+5.50)#14 | 4.2%(+11.4)#4,895 |
| 3. | 19807 | 14.0% | 10.1%(+3.90)#18 | 4.2%(+9.80)#5,168 |
| 4. | 19803 | 13.1% | 10.1%(+3.00)#19 | 4.2%(+8.90)#5,317 |
| 5. | 19810 | 11.7% | 10.1%(+1.60)#26 | 4.2%(+7.50)#5,634 |
| 6. | 19802 | 8.1% | 10.1%(-2.00)#41 | 4.2%(+3.90)#6,665 |
| 7. | 19809 | 7.2% | 10.1%(-2.90)#44 | 4.2%(+3.00)#7,025 |
| 8. | 19805 | 6.2% | 10.1%(-3.90)#47 | 4.2%(+2.00)#7,475 |
| 9. | 19806 | 4.6% | 10.1%(-5.50)#53 | 4.2%(+0.400)#8,377 |
| 10. | 19801 | 2.9% | 10.1%(-7.20)#56 | 4.2%(-1.30)#9,769 |
1
Common Questions
What are the Top 5 Zip Codes with the Highest Percentage of Households Heated by Fuel Oil / Kerosene in Wilmington, DE?
Top 5 Zip Codes with the Highest Percentage of Households Heated by Fuel Oil / Kerosene in Wilmington, DE are:
What zip code has the Highest Percentage of Households Heated by Fuel Oil / Kerosene in Wilmington, DE?
19808 has the Highest Percentage of Households Heated by Fuel Oil / Kerosene in Wilmington, DE with 19.7%.
What is the Percentage of Households Heated by Fuel Oil / Kerosene in Wilmington, DE?
Percentage of Households Heated by Fuel Oil / Kerosene in Wilmington is 5.9%.
What is the Percentage of Households Heated by Fuel Oil / Kerosene in Delaware?
Percentage of Households Heated by Fuel Oil / Kerosene in Delaware is 10.1%.
What is the Percentage of Households Heated by Fuel Oil / Kerosene in the United States?
Percentage of Households Heated by Fuel Oil / Kerosene in the United States is 4.2%.