Zip Codes with the Highest Percentage of Population with a Degree in Psychology in Wilmington, DE
RELATED REPORTS & OPTIONS
Psychology
Wilmington
Compare Zip Codes
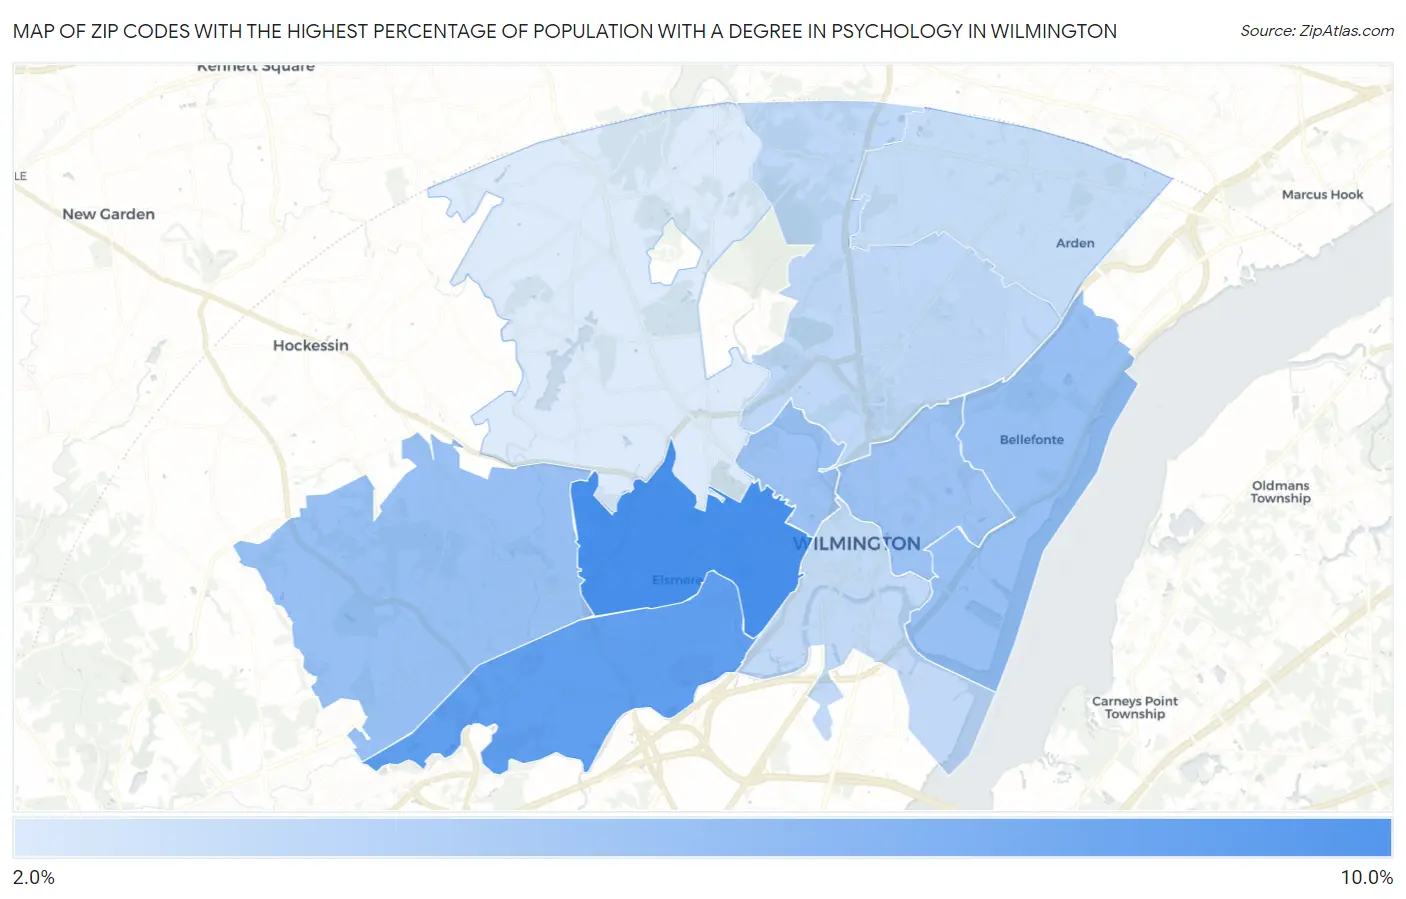
Map of Zip Codes with the Highest Percentage of Population with a Degree in Psychology in Wilmington
2.6%
9.6%
Zip Codes with the Highest Percentage of Population with a Degree in Psychology in Wilmington, DE
| Zip Code | % Graduates | vs State | vs National | |
| 1. | 19805 | 9.6% | 4.9%(+4.77)#3 | 5.1%(+4.58)#2,704 |
| 2. | 19804 | 8.4% | 4.9%(+3.49)#6 | 5.1%(+3.30)#3,746 |
| 3. | 19809 | 5.8% | 4.9%(+0.929)#17 | 5.1%(+0.747)#8,575 |
| 4. | 19808 | 5.8% | 4.9%(+0.897)#18 | 5.1%(+0.714)#8,693 |
| 5. | 19802 | 5.6% | 4.9%(+0.760)#20 | 5.1%(+0.578)#9,094 |
| 6. | 19806 | 5.6% | 4.9%(+0.758)#21 | 5.1%(+0.576)#9,102 |
| 7. | 19803 | 3.9% | 4.9%(-0.924)#38 | 5.1%(-1.11)#15,133 |
| 8. | 19801 | 3.9% | 4.9%(-1.02)#40 | 5.1%(-1.20)#15,440 |
| 9. | 19810 | 3.6% | 4.9%(-1.26)#42 | 5.1%(-1.44)#16,290 |
| 10. | 19807 | 2.6% | 4.9%(-2.30)#49 | 5.1%(-2.48)#19,428 |
1
Common Questions
What are the Top 5 Zip Codes with the Highest Percentage of Population with a Degree in Psychology in Wilmington, DE?
Top 5 Zip Codes with the Highest Percentage of Population with a Degree in Psychology in Wilmington, DE are:
What zip code has the Highest Percentage of Population with a Degree in Psychology in Wilmington, DE?
19805 has the Highest Percentage of Population with a Degree in Psychology in Wilmington, DE with 9.6%.
What is the Percentage of Population with a Degree in Psychology in Wilmington, DE?
Percentage of Population with a Degree in Psychology in Wilmington is 6.9%.
What is the Percentage of Population with a Degree in Psychology in Delaware?
Percentage of Population with a Degree in Psychology in Delaware is 4.9%.
What is the Percentage of Population with a Degree in Psychology in the United States?
Percentage of Population with a Degree in Psychology in the United States is 5.1%.