Zip Codes with the Highest Percentage of Households Without a Vehicle in Wilmington, DE
RELATED REPORTS & OPTIONS
Households without a Cars
Wilmington
Compare Zip Codes
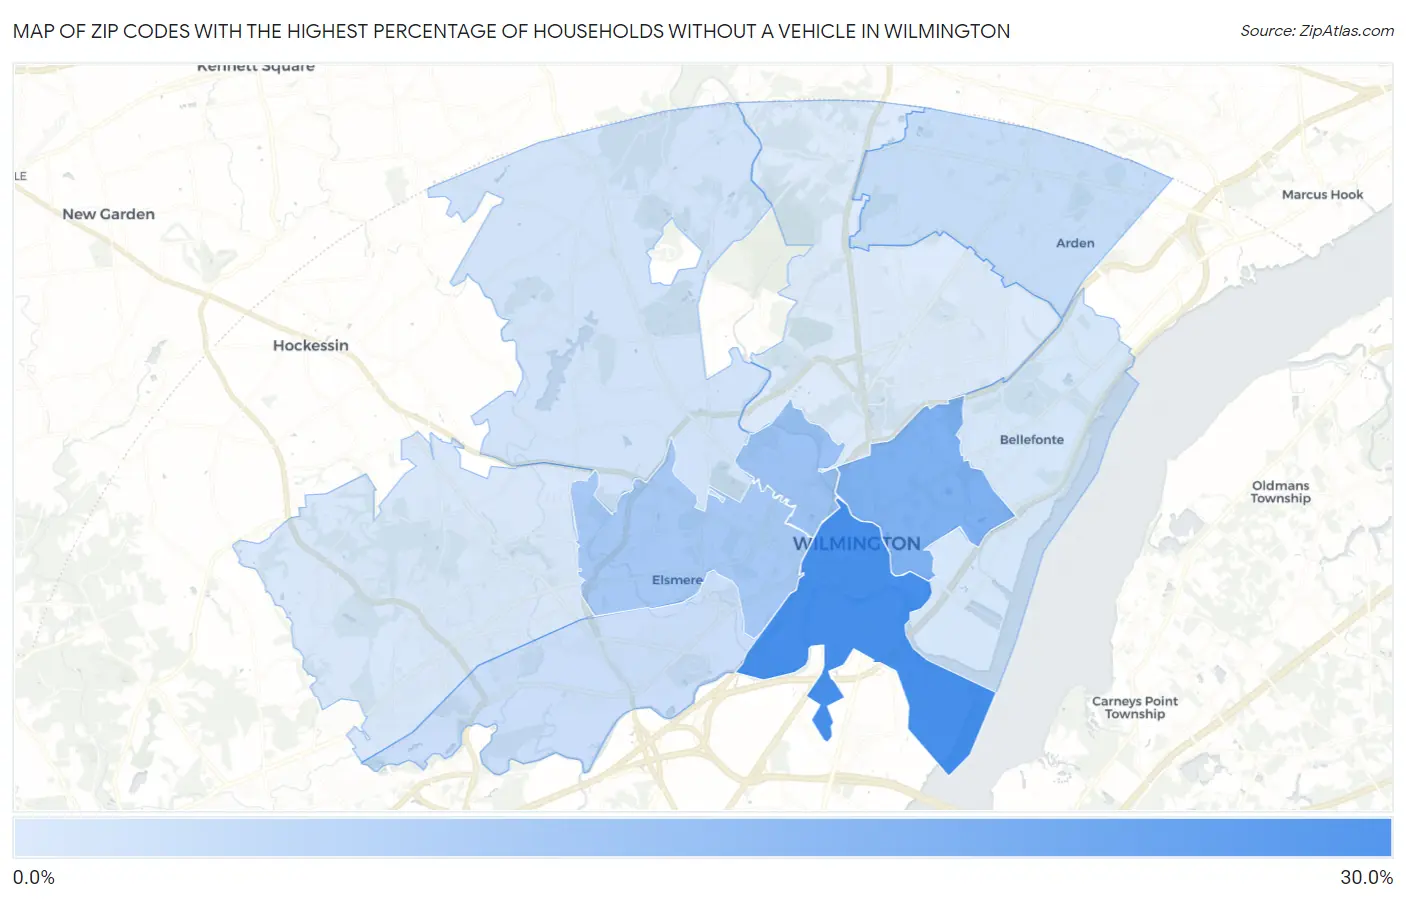
Map of Zip Codes with the Highest Percentage of Households Without a Vehicle in Wilmington
2.4%
29.4%
Zip Codes with the Highest Percentage of Households Without a Vehicle in Wilmington, DE
| Zip Code | Housholds Without a Car | vs State | vs National | |
| 1. | 19801 | 29.4% | 6.1%(+23.3)#1 | 8.3%(+21.1)#830 |
| 2. | 19802 | 18.7% | 6.1%(+12.6)#3 | 8.3%(+10.4)#1,679 |
| 3. | 19806 | 13.3% | 6.1%(+7.20)#4 | 8.3%(+5.00)#2,977 |
| 4. | 19805 | 11.8% | 6.1%(+5.70)#5 | 8.3%(+3.50)#3,660 |
| 5. | 19810 | 6.2% | 6.1%(+0.100)#17 | 8.3%(-2.10)#10,017 |
| 6. | 19804 | 5.4% | 6.1%(-0.700)#18 | 8.3%(-2.90)#11,881 |
| 7. | 19807 | 4.1% | 6.1%(-2.00)#22 | 8.3%(-4.20)#15,483 |
| 8. | 19809 | 3.4% | 6.1%(-2.70)#36 | 8.3%(-4.90)#17,678 |
| 9. | 19808 | 3.1% | 6.1%(-3.00)#39 | 8.3%(-5.20)#18,703 |
| 10. | 19803 | 2.4% | 6.1%(-3.70)#45 | 8.3%(-5.90)#21,070 |
1
Common Questions
What are the Top 5 Zip Codes with the Highest Percentage of Households Without a Vehicle in Wilmington, DE?
Top 5 Zip Codes with the Highest Percentage of Households Without a Vehicle in Wilmington, DE are:
What zip code has the Highest Percentage of Households Without a Vehicle in Wilmington, DE?
19801 has the Highest Percentage of Households Without a Vehicle in Wilmington, DE with 29.4%.
What is the Percentage of Households Without a Vehicle in Wilmington, DE?
Percentage of Households Without a Vehicle in Wilmington is 20.4%.
What is the Percentage of Households Without a Vehicle in Delaware?
Percentage of Households Without a Vehicle in Delaware is 6.1%.
What is the Percentage of Households Without a Vehicle in the United States?
Percentage of Households Without a Vehicle in the United States is 8.3%.