Zip Codes with the Highest Percentage of Population Employed in Computer & Mathematics in Wilmington, DE
RELATED REPORTS & OPTIONS
Computer & Mathematics
Wilmington
Compare Zip Codes
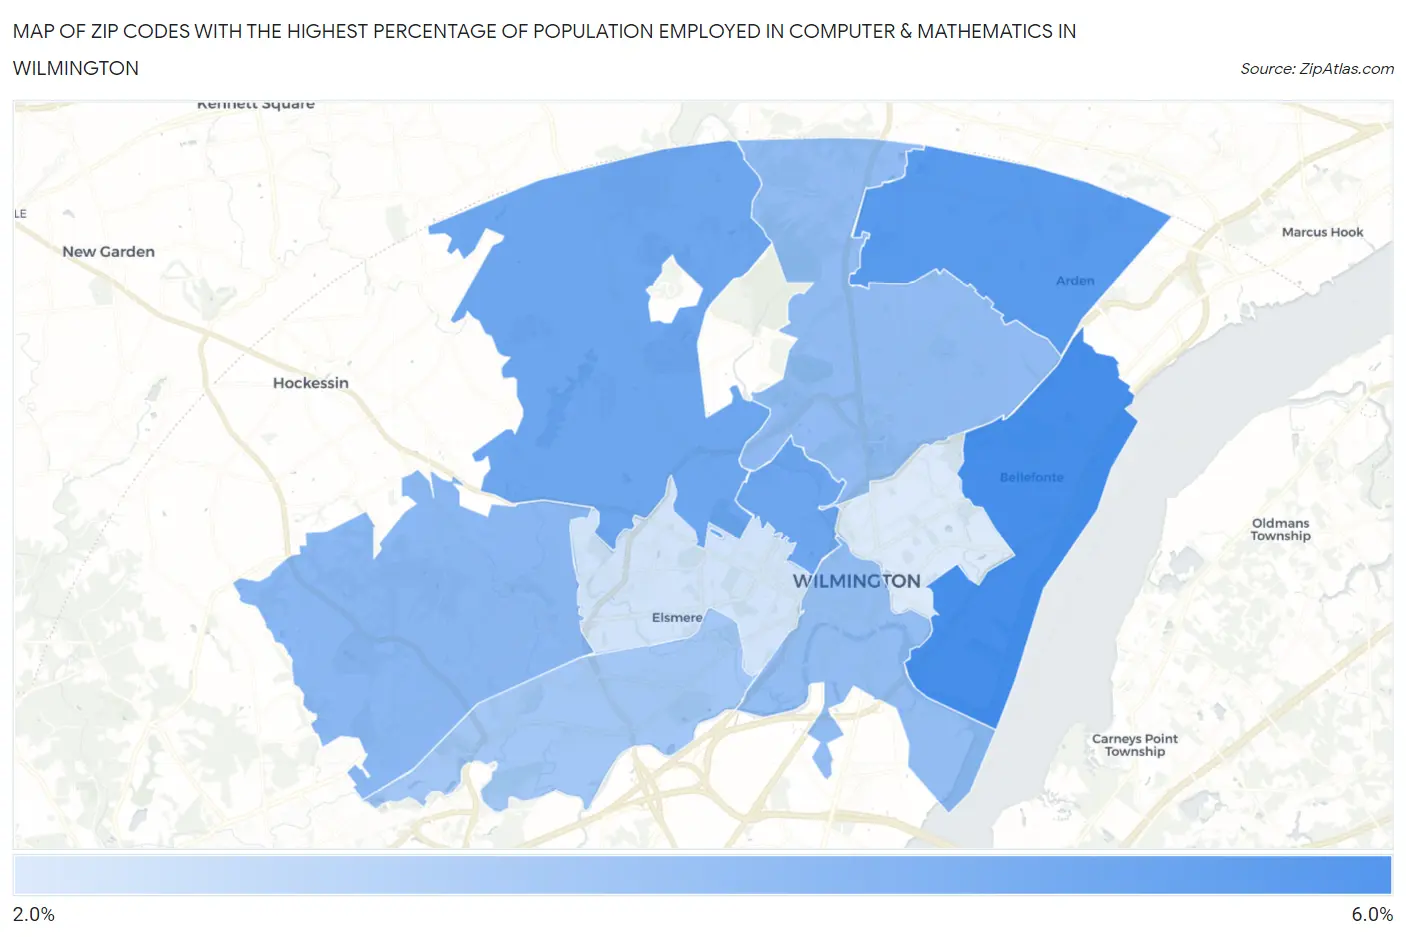
Map of Zip Codes with the Highest Percentage of Population Employed in Computer & Mathematics in Wilmington
2.3%
5.1%
Zip Codes with the Highest Percentage of Population Employed in Computer & Mathematics in Wilmington, DE
| Zip Code | % Employed | vs State | vs National | |
| 1. | 19809 | 5.1% | 3.4%(+1.70)#8 | 3.5%(+1.53)#3,298 |
| 2. | 19810 | 4.7% | 3.4%(+1.38)#13 | 3.5%(+1.21)#3,738 |
| 3. | 19807 | 4.3% | 3.4%(+0.976)#15 | 3.5%(+0.806)#4,374 |
| 4. | 19806 | 4.3% | 3.4%(+0.960)#16 | 3.5%(+0.789)#4,407 |
| 5. | 19808 | 3.8% | 3.4%(+0.462)#17 | 3.5%(+0.291)#5,441 |
| 6. | 19803 | 3.7% | 3.4%(+0.329)#18 | 3.5%(+0.159)#5,769 |
| 7. | 19801 | 3.6% | 3.4%(+0.286)#19 | 3.5%(+0.116)#5,867 |
| 8. | 19804 | 3.3% | 3.4%(-0.023)#21 | 3.5%(-0.193)#6,679 |
| 9. | 19805 | 2.5% | 3.4%(-0.835)#28 | 3.5%(-1.01)#9,565 |
| 10. | 19802 | 2.3% | 3.4%(-1.05)#31 | 3.5%(-1.22)#10,433 |
1
Common Questions
What are the Top 5 Zip Codes with the Highest Percentage of Population Employed in Computer & Mathematics in Wilmington, DE?
Top 5 Zip Codes with the Highest Percentage of Population Employed in Computer & Mathematics in Wilmington, DE are:
What zip code has the Highest Percentage of Population Employed in Computer & Mathematics in Wilmington, DE?
19809 has the Highest Percentage of Population Employed in Computer & Mathematics in Wilmington, DE with 5.1%.
What is the Percentage of Population Employed in Computer & Mathematics in Wilmington, DE?
Percentage of Population Employed in Computer & Mathematics in Wilmington is 3.0%.
What is the Percentage of Population Employed in Computer & Mathematics in Delaware?
Percentage of Population Employed in Computer & Mathematics in Delaware is 3.4%.
What is the Percentage of Population Employed in Computer & Mathematics in the United States?
Percentage of Population Employed in Computer & Mathematics in the United States is 3.5%.