Zip Codes with the Highest Percentage of Population Employed in Computer & Mathematics in Grand Junction, CO
RELATED REPORTS & OPTIONS
Computer & Mathematics
Grand Junction
Compare Zip Codes
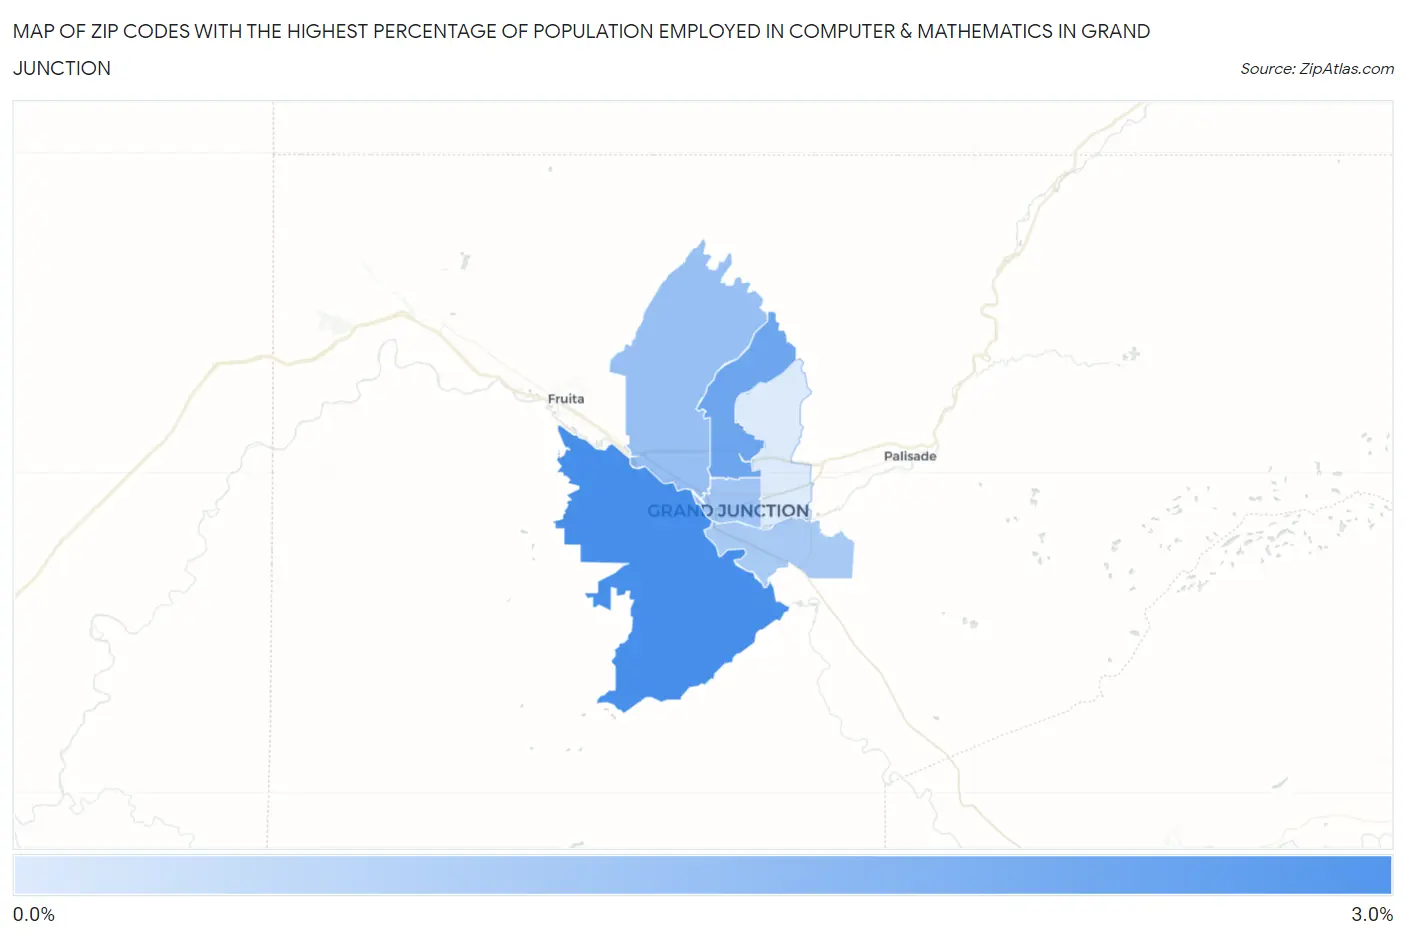
Map of Zip Codes with the Highest Percentage of Population Employed in Computer & Mathematics in Grand Junction
0.63%
2.7%
Zip Codes with the Highest Percentage of Population Employed in Computer & Mathematics in Grand Junction, CO
| Zip Code | % Employed | vs State | vs National | |
| 1. | 81507 | 2.7% | 4.8%(-2.04)#208 | 3.5%(-0.811)#8,772 |
| 2. | 81506 | 2.1% | 4.8%(-2.61)#232 | 3.5%(-1.38)#11,129 |
| 3. | 81505 | 1.6% | 4.8%(-3.17)#269 | 3.5%(-1.94)#13,898 |
| 4. | 81501 | 1.4% | 4.8%(-3.31)#281 | 3.5%(-2.08)#14,691 |
| 5. | 81503 | 1.4% | 4.8%(-3.39)#287 | 3.5%(-2.16)#15,139 |
| 6. | 81504 | 0.63% | 4.8%(-4.13)#327 | 3.5%(-2.90)#19,706 |
1
Common Questions
What are the Top 5 Zip Codes with the Highest Percentage of Population Employed in Computer & Mathematics in Grand Junction, CO?
Top 5 Zip Codes with the Highest Percentage of Population Employed in Computer & Mathematics in Grand Junction, CO are:
What zip code has the Highest Percentage of Population Employed in Computer & Mathematics in Grand Junction, CO?
81507 has the Highest Percentage of Population Employed in Computer & Mathematics in Grand Junction, CO with 2.7%.
What is the Percentage of Population Employed in Computer & Mathematics in Grand Junction, CO?
Percentage of Population Employed in Computer & Mathematics in Grand Junction is 1.7%.
What is the Percentage of Population Employed in Computer & Mathematics in Colorado?
Percentage of Population Employed in Computer & Mathematics in Colorado is 4.8%.
What is the Percentage of Population Employed in Computer & Mathematics in the United States?
Percentage of Population Employed in Computer & Mathematics in the United States is 3.5%.