Zip Codes with the Highest Percentage of Guamanian / Chamorro Population in Lompoc, CA
RELATED REPORTS & OPTIONS
Guamanian / Chamorro
Lompoc
Compare Zip Codes
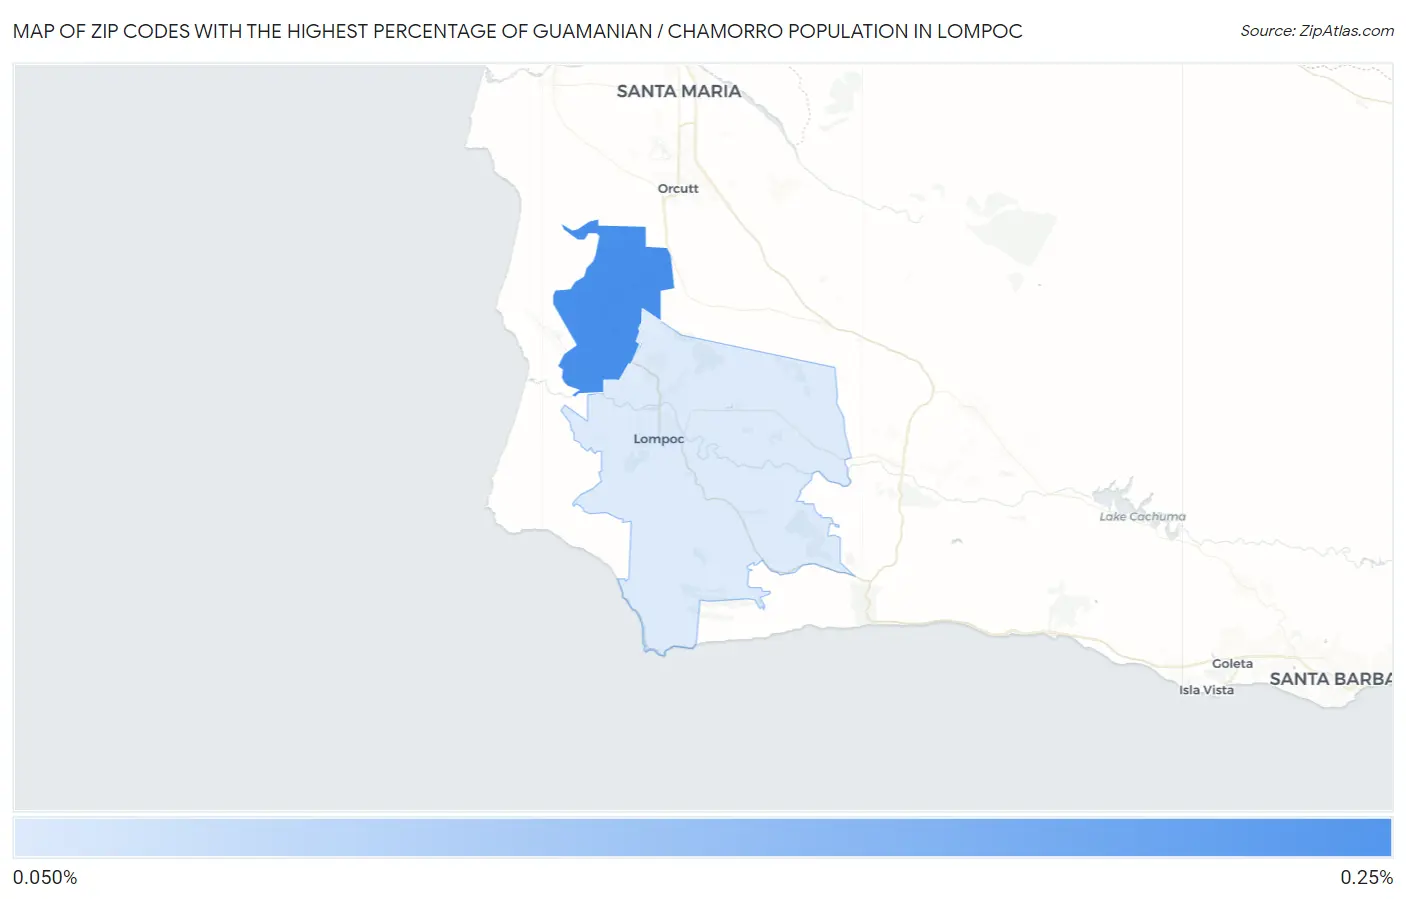
Map of Zip Codes with the Highest Percentage of Guamanian / Chamorro Population in Lompoc
0.099%
0.24%
Zip Codes with the Highest Percentage of Guamanian / Chamorro Population in Lompoc, CA
| Zip Code | Guamanian / Chamorro | vs State | vs National | |
| 1. | 93437 | 0.24% | 0.12%(+0.128)#180 | 0.047%(+0.198)#869 |
| 2. | 93436 | 0.099% | 0.12%(-0.018)#371 | 0.047%(+0.052)#1,692 |
1
Common Questions
What are the Top Zip Codes with the Highest Percentage of Guamanian / Chamorro Population in Lompoc, CA?
Top Zip Codes with the Highest Percentage of Guamanian / Chamorro Population in Lompoc, CA are:
What zip code has the Highest Percentage of Guamanian / Chamorro Population in Lompoc, CA?
93437 has the Highest Percentage of Guamanian / Chamorro Population in Lompoc, CA with 0.24%.
What is the Percentage of Guamanian / Chamorro Population in Lompoc, CA?
Percentage of Guamanian / Chamorro Population in Lompoc is 0.12%.
What is the Percentage of Guamanian / Chamorro Population in California?
Percentage of Guamanian / Chamorro Population in California is 0.12%.
What is the Percentage of Guamanian / Chamorro Population in the United States?
Percentage of Guamanian / Chamorro Population in the United States is 0.047%.