Zip Codes with the Highest Percentage of Population Employed in Installation, Maintenance & Repair in Lompoc, CA
RELATED REPORTS & OPTIONS
Installation, Maintenance & Repair
Lompoc
Compare Zip Codes
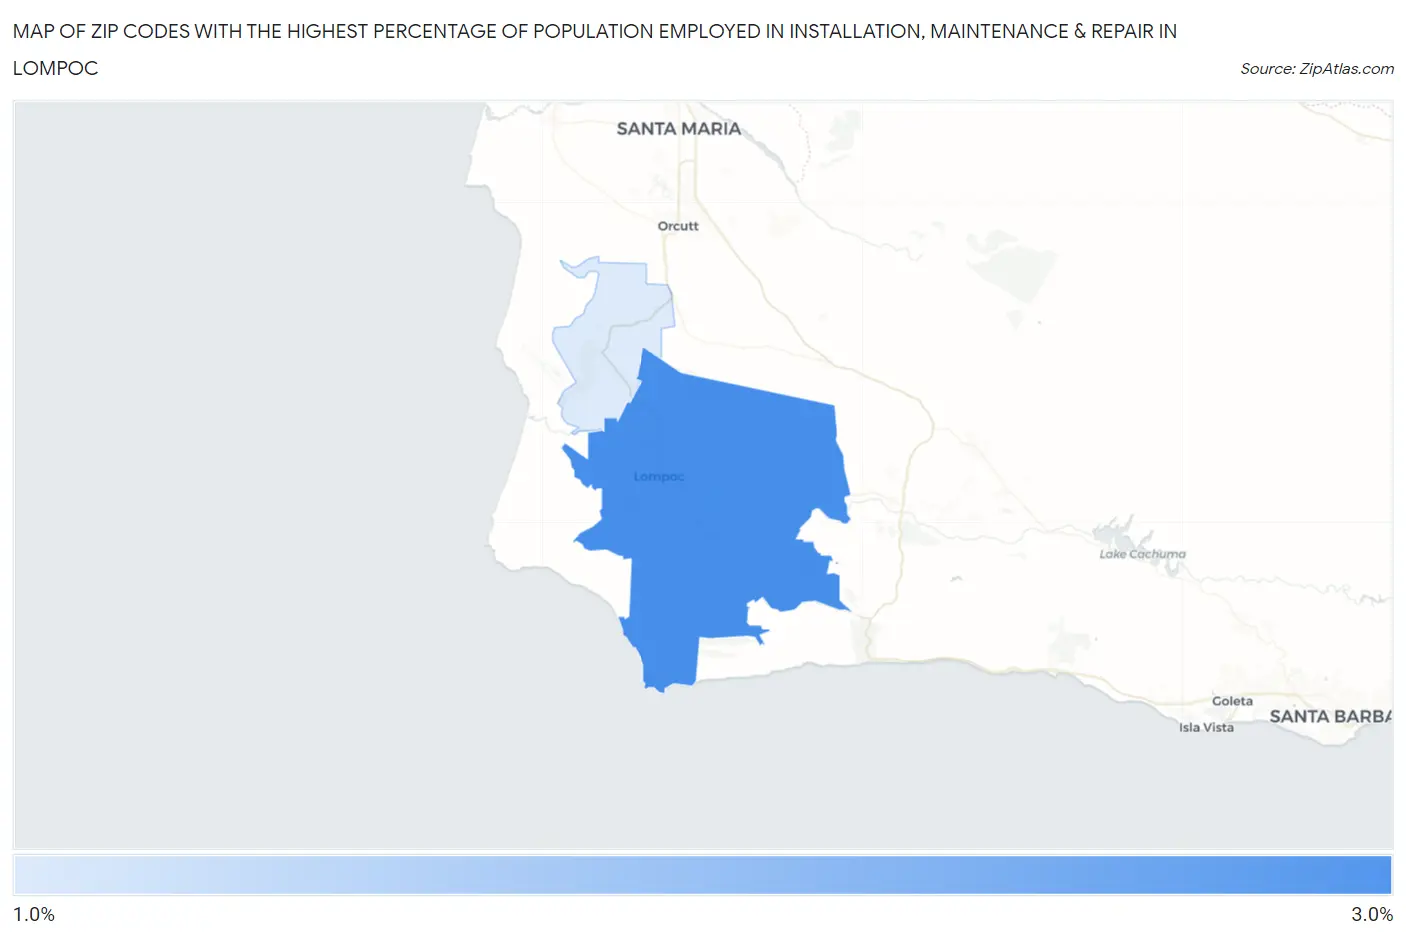
Map of Zip Codes with the Highest Percentage of Population Employed in Installation, Maintenance & Repair in Lompoc
1.1%
2.6%
Zip Codes with the Highest Percentage of Population Employed in Installation, Maintenance & Repair in Lompoc, CA
| Zip Code | % Employed | vs State | vs National | |
| 1. | 93436 | 2.6% | 2.6%(+0.033)#756 | 3.1%(-0.478)#19,118 |
| 2. | 93437 | 1.1% | 2.6%(-1.50)#1,233 | 3.1%(-2.01)#25,755 |
1
Common Questions
What are the Top Zip Codes with the Highest Percentage of Population Employed in Installation, Maintenance & Repair in Lompoc, CA?
Top Zip Codes with the Highest Percentage of Population Employed in Installation, Maintenance & Repair in Lompoc, CA are:
What zip code has the Highest Percentage of Population Employed in Installation, Maintenance & Repair in Lompoc, CA?
93436 has the Highest Percentage of Population Employed in Installation, Maintenance & Repair in Lompoc, CA with 2.6%.
What is the Percentage of Population Employed in Installation, Maintenance & Repair in Lompoc, CA?
Percentage of Population Employed in Installation, Maintenance & Repair in Lompoc is 2.3%.
What is the Percentage of Population Employed in Installation, Maintenance & Repair in California?
Percentage of Population Employed in Installation, Maintenance & Repair in California is 2.6%.
What is the Percentage of Population Employed in Installation, Maintenance & Repair in the United States?
Percentage of Population Employed in Installation, Maintenance & Repair in the United States is 3.1%.