Zip Codes with the Most Births per 1,000 Women Receiving Public Assitance in Lompoc, CA

RELATED REPORTS & OPTIONS

Highest Birth Rate | Public Income
Population
Families and Households
Female Fertility
Female Fertility (Unmarried)
Race (Community Size)
Race (Percentage)
Ancestry (Community Size)
Ancestry (Percentage)
Immigrant Origin (Total)
Immigrant Origin (Percentage)
Income
Income (Families)
Income (Households)
Poverty
Poverty (Families)
Unemployment
Employment Occupations
Employment Industries
Employer Class
Commute Time
Commute Means
School Enrollment
Education by Degree Field
Occupancy
Finances
Physical Characteristics
Lompoc
States
California Cities
AlamedaAlhambraAnaheimAntiochApple ValleyArcadiaAuburnBakersfieldBerkeleyBeverly HillsBreaBuena ParkBurbankCamarilloCanoga ParkCanyon CountryCarlsbadCarsonCastro ValleyChicoChinoChula VistaCitrus HeightsClovisComptonConcordCoronaCosta MesaCovinaCulver CityDaly CityDanvilleDavisDesert Hot SpringsDowneyEl CajonEl MonteElk GroveEncinoEscondidoEurekaFairfieldFontanaFremontFresnoFullertonGarden GroveGardenaGlendaleGlendoraGrass ValleyHaywardHemetHesperiaHuntington BeachIndioInglewoodIrvineLa MesaLa PuenteLake ElsinoreLakewoodLancasterLemooreLivermoreLodiLompocLong BeachLos AltosLos AngelesLos GatosMaderaMantecaMenifeeMercedMission ViejoModestoMonterey ParkMoreno ValleyMountain ViewMurrietaNapaNewport BeachNorth HollywoodNorthridgeNovatoOaklandOceansideOntarioOrangeOrovilleOxnardPalm DesertPalm SpringsPalmdalePalo AltoPasadenaPerrisPetalumaPleasantonPomonaRancho CordovaRancho CucamongaReddingRedlandsRedondo BeachRedwood CityRialtoRichmondRiversideRocklinRosevilleSacramentoSalinasSan BernardinoSan ClementeSan DiegoSan FranciscoSan GabrielSan JacintoSan JoseSan LeandroSan Luis ObispoSan MarcosSan MateoSan PedroSan RafaelSan RamonSanta AnaSanta BarbaraSanta ClaraSanta ClaritaSanta CruzSanta MariaSanta MonicaSanta RosaSherman OaksSimi ValleySpring ValleyStocktonSunnyvaleTemeculaThousand OaksTorranceTrabuco CanyonTracyTurlockTustinUplandVacavilleValenciaVallejoVan NuysVenturaVictorvilleVisaliaVistaWalnut CreekWest CovinaWest SacramentoWhittierWoodlandWoodland HillsYorba LindaYuba City
Compare Zip Codes
Comparison Subject

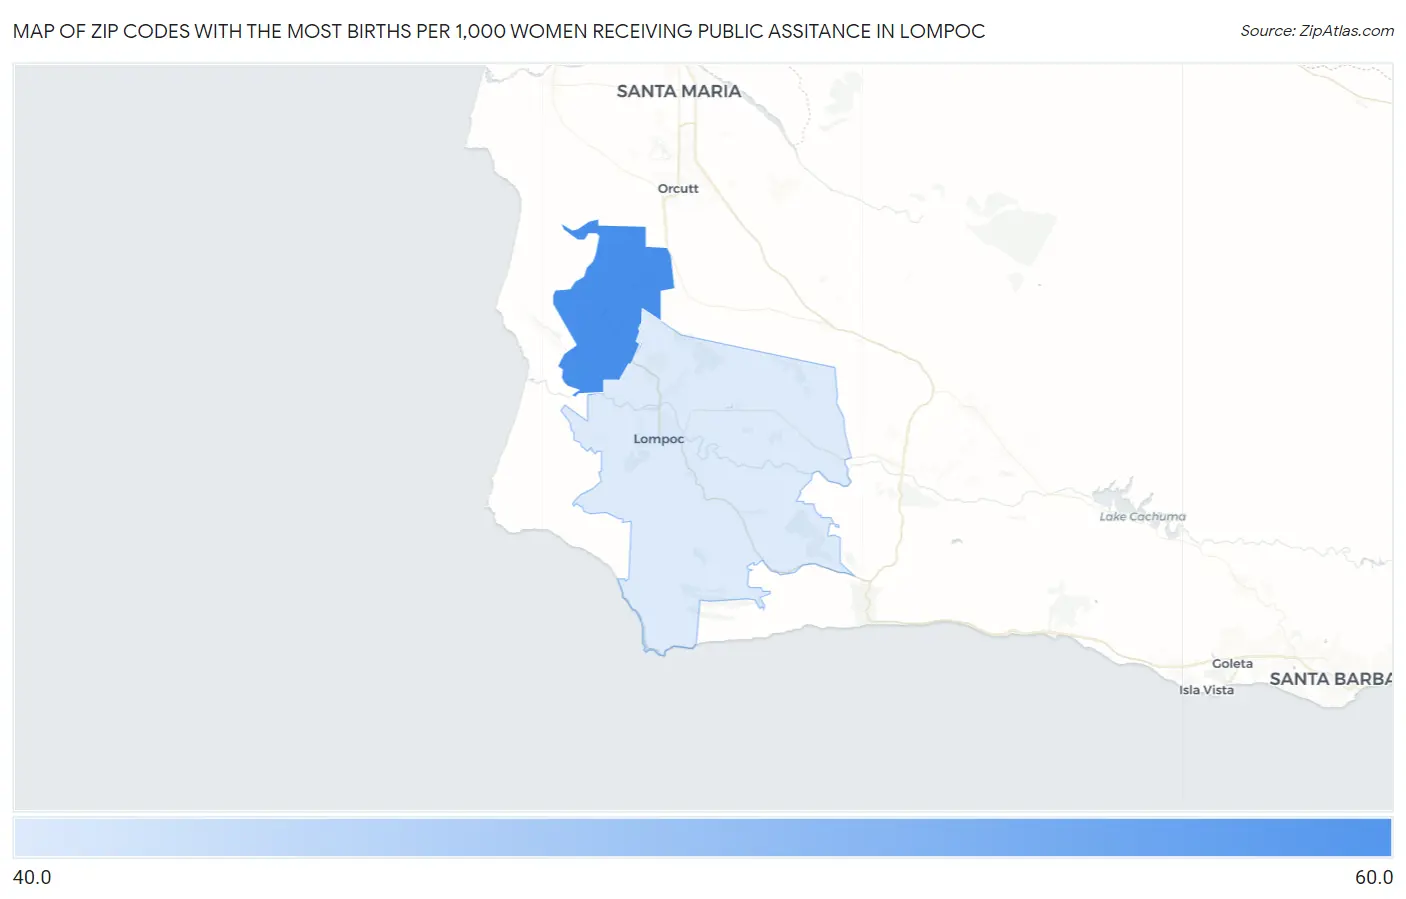
Map of Zip Codes with the Most Births per 1,000 Women Receiving Public Assitance in Lompoc

0.0
60.0
Zip Codes with the Most Births per 1,000 Women Receiving Public Assitance in Lompoc Map

Zip Codes with the Most Births per 1,000 Women Receiving Public Assitance in Lompoc, CA

Zip Code Births / 1,000 Women vs State vs National
1.9343752.048.0(+4.00)#59252.0(=0.000)#13,037
2.9343644.048.0(-4.00)#80152.0(-8.00)#15,587

Common Questions

What are the Top Zip Codes with the Most Births per 1,000 Women Receiving Public Assitance in Lompoc, CA?
Top Zip Codes with the Most Births per 1,000 Women Receiving Public Assitance in Lompoc, CA are:
#1
52.0
#2
44.0
What zip code has the Most Births per 1,000 Women Receiving Public Assitance in Lompoc, CA?
93437 has the Most Births per 1,000 Women Receiving Public Assitance in Lompoc, CA with 52.0.
What is the Number of Births per 1,000 Women Receiving Public Assitance in Lompoc, CA?
Number of Births per 1,000 Women Receiving Public Assitance in Lompoc is 47.0.
What is the Number of Births per 1,000 Women Receiving Public Assitance in California?
Number of Births per 1,000 Women Receiving Public Assitance in California is 48.0.
What is the Number of Births per 1,000 Women Receiving Public Assitance in the United States?
Number of Births per 1,000 Women Receiving Public Assitance in the United States is 52.0.