Zip Codes with the Highest Percentage of Population Employed in Health Diagnosing & Treating in Rochester, NH
RELATED REPORTS & OPTIONS
Health Diagnosing & Treating
Rochester
Compare Zip Codes
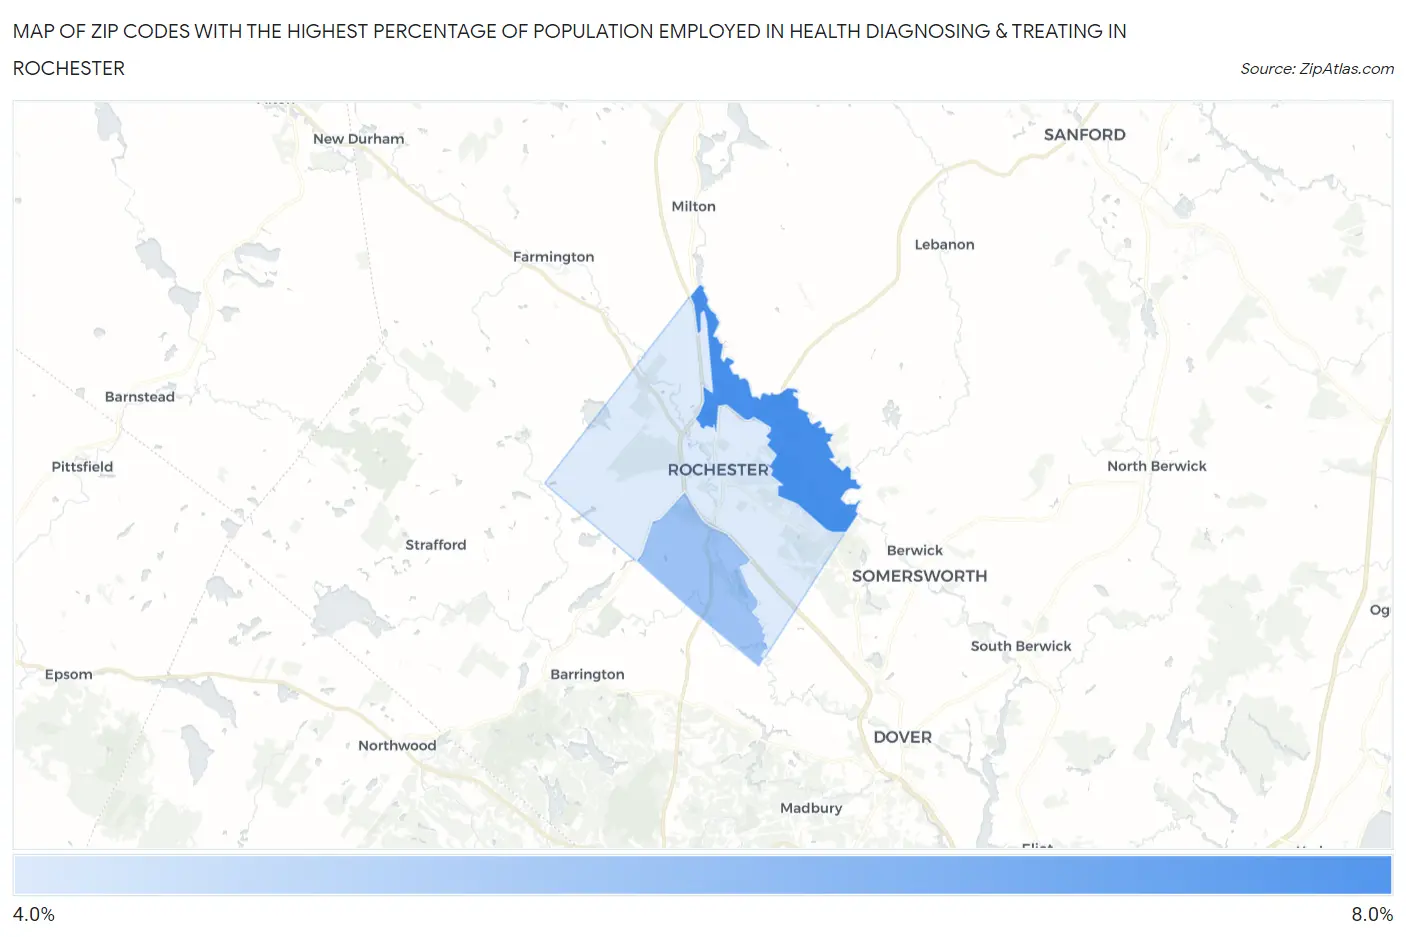
Map of Zip Codes with the Highest Percentage of Population Employed in Health Diagnosing & Treating in Rochester
4.7%
7.8%
Zip Codes with the Highest Percentage of Population Employed in Health Diagnosing & Treating in Rochester, NH
| Zip Code | % Employed | vs State | vs National | |
| 1. | 03868 | 7.8% | 6.7%(+1.03)#69 | 6.2%(+1.52)#8,092 |
| 2. | 03839 | 6.0% | 6.7%(-0.722)#130 | 6.2%(-0.237)#13,840 |
| 3. | 03867 | 4.7% | 6.7%(-2.01)#168 | 6.2%(-1.52)#18,767 |
1
Common Questions
What are the Top Zip Codes with the Highest Percentage of Population Employed in Health Diagnosing & Treating in Rochester, NH?
Top Zip Codes with the Highest Percentage of Population Employed in Health Diagnosing & Treating in Rochester, NH are:
What zip code has the Highest Percentage of Population Employed in Health Diagnosing & Treating in Rochester, NH?
03868 has the Highest Percentage of Population Employed in Health Diagnosing & Treating in Rochester, NH with 7.8%.
What is the Percentage of Population Employed in Health Diagnosing & Treating in Rochester, NH?
Percentage of Population Employed in Health Diagnosing & Treating in Rochester is 5.4%.
What is the Percentage of Population Employed in Health Diagnosing & Treating in New Hampshire?
Percentage of Population Employed in Health Diagnosing & Treating in New Hampshire is 6.7%.
What is the Percentage of Population Employed in Health Diagnosing & Treating in the United States?
Percentage of Population Employed in Health Diagnosing & Treating in the United States is 6.2%.