Zip Codes with the Highest Percentage of Population Employed in Health Diagnosing & Treating in Homosassa, FL
RELATED REPORTS & OPTIONS
Health Diagnosing & Treating
Homosassa
Compare Zip Codes
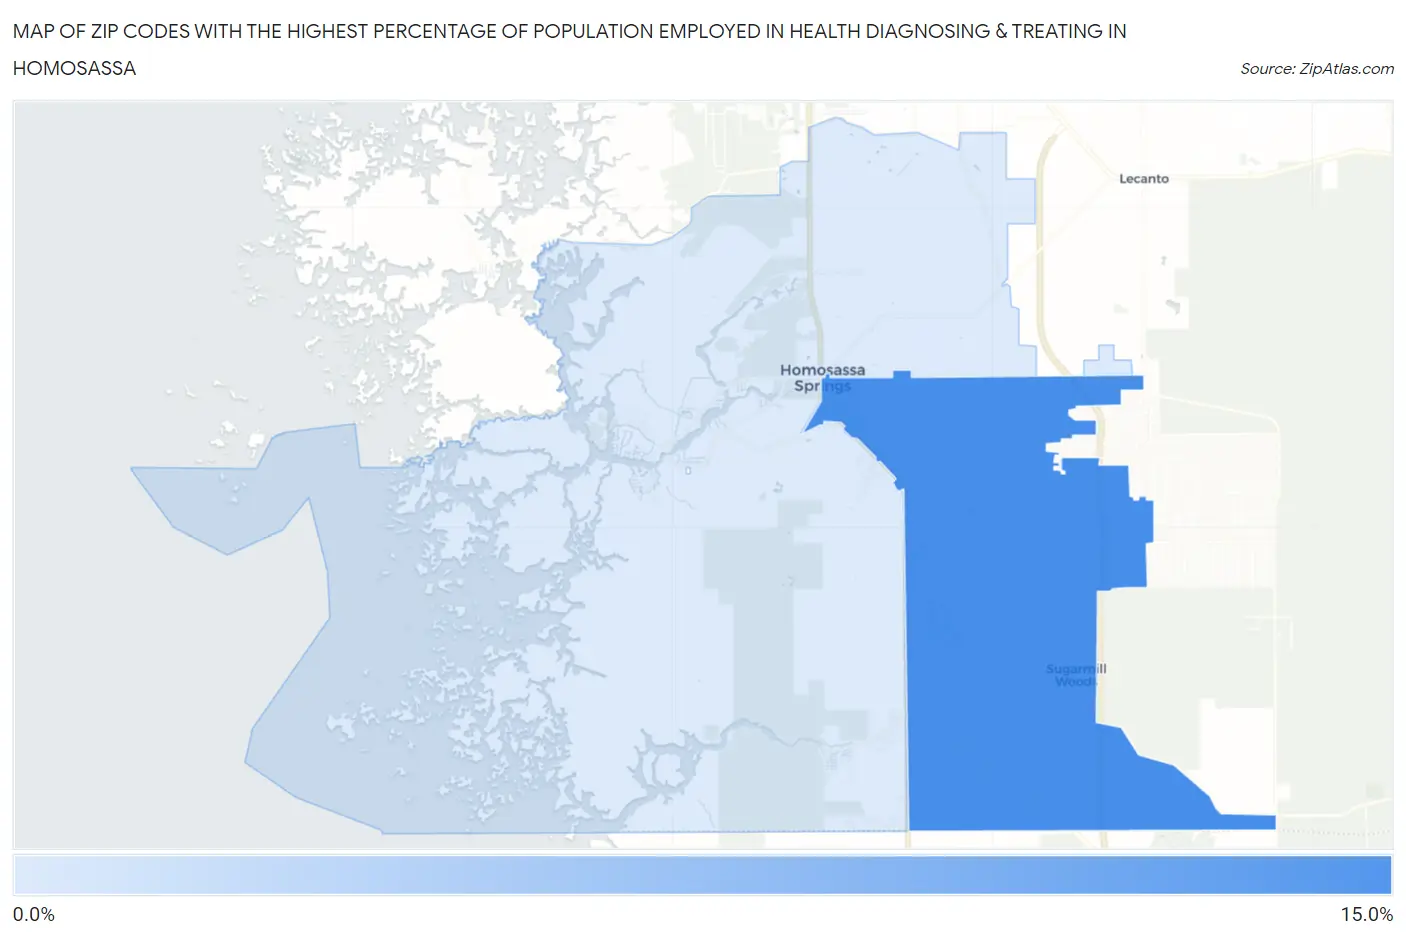
Map of Zip Codes with the Highest Percentage of Population Employed in Health Diagnosing & Treating in Homosassa
4.1%
10.2%
Zip Codes with the Highest Percentage of Population Employed in Health Diagnosing & Treating in Homosassa, FL
| Zip Code | % Employed | vs State | vs National | |
| 1. | 34446 | 10.2% | 6.4%(+3.75)#93 | 6.2%(+3.96)#3,641 |
| 2. | 34448 | 4.1% | 6.4%(-2.32)#762 | 6.2%(-2.11)#20,951 |
1
Common Questions
What are the Top Zip Codes with the Highest Percentage of Population Employed in Health Diagnosing & Treating in Homosassa, FL?
Top Zip Codes with the Highest Percentage of Population Employed in Health Diagnosing & Treating in Homosassa, FL are:
What zip code has the Highest Percentage of Population Employed in Health Diagnosing & Treating in Homosassa, FL?
34446 has the Highest Percentage of Population Employed in Health Diagnosing & Treating in Homosassa, FL with 10.2%.
What is the Percentage of Population Employed in Health Diagnosing & Treating in Homosassa, FL?
Percentage of Population Employed in Health Diagnosing & Treating in Homosassa is 4.0%.
What is the Percentage of Population Employed in Health Diagnosing & Treating in Florida?
Percentage of Population Employed in Health Diagnosing & Treating in Florida is 6.4%.
What is the Percentage of Population Employed in Health Diagnosing & Treating in the United States?
Percentage of Population Employed in Health Diagnosing & Treating in the United States is 6.2%.