Zip Codes with the Highest Percentage of Population with a Degree in Education in Danville, VA
RELATED REPORTS & OPTIONS
Education
Danville
Compare Zip Codes
Map of Zip Codes with the Highest Percentage of Population with a Degree in Education in Danville
10.9%
17.1%
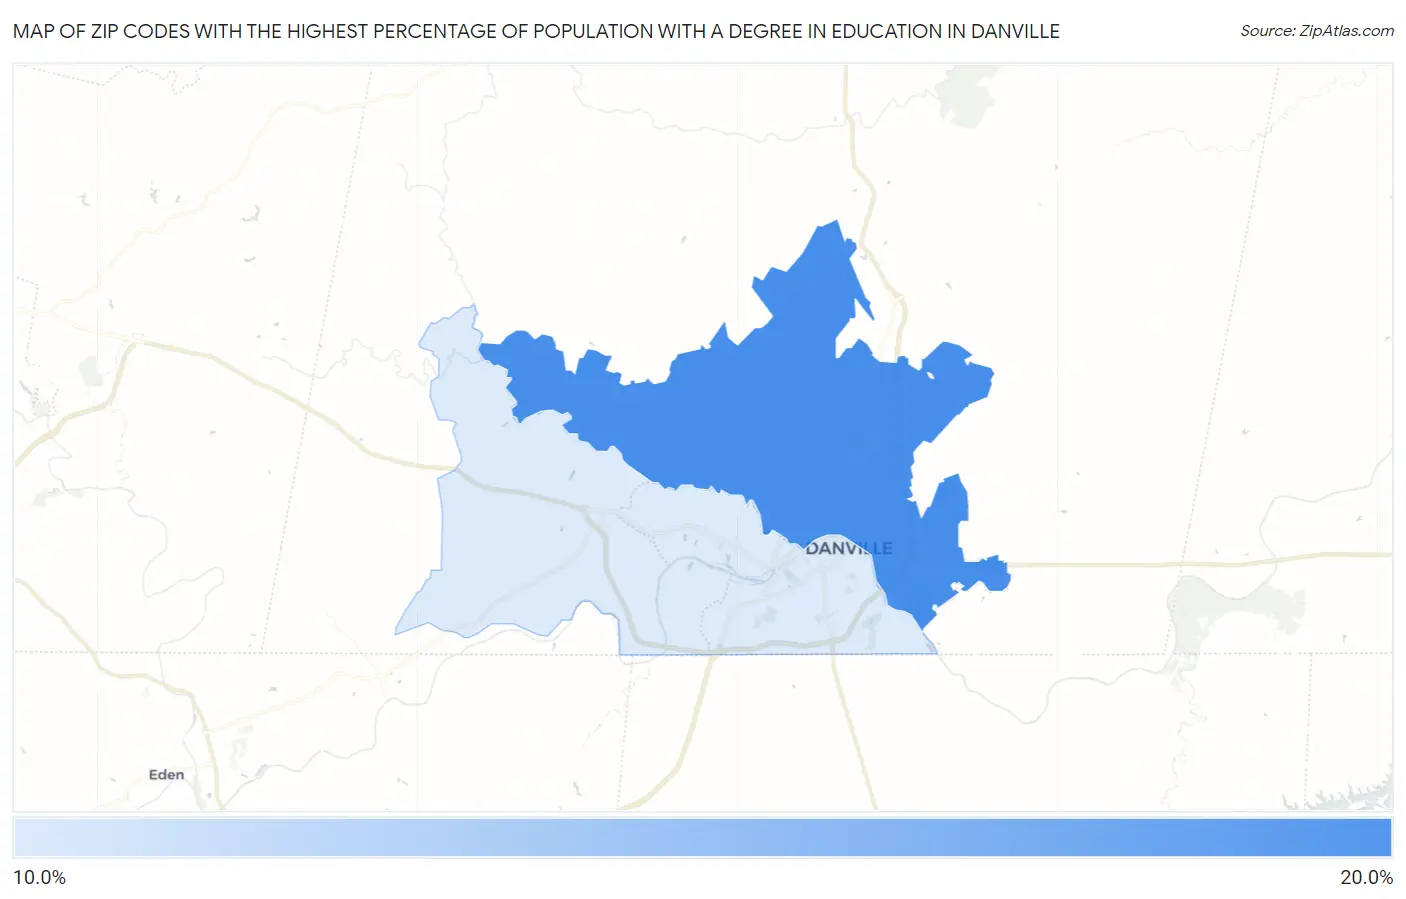
Zip Codes with the Highest Percentage of Population with a Degree in Education in Danville, VA
| Zip Code | % Graduates | vs State | vs National | |
| 1. | 24540 | 17.1% | 8.7%(+8.44)#201 | 11.1%(+6.06)#13,283 |
| 2. | 24541 | 10.9% | 8.7%(+2.21)#406 | 11.1%(-0.174)#21,123 |
1
Common Questions
What are the Top Zip Codes with the Highest Percentage of Population with a Degree in Education in Danville, VA?
Top Zip Codes with the Highest Percentage of Population with a Degree in Education in Danville, VA are:
What zip code has the Highest Percentage of Population with a Degree in Education in Danville, VA?
24540 has the Highest Percentage of Population with a Degree in Education in Danville, VA with 17.1%.
What is the Percentage of Population with a Degree in Education in Danville, VA?
Percentage of Population with a Degree in Education in Danville is 13.3%.
What is the Percentage of Population with a Degree in Education in Virginia?
Percentage of Population with a Degree in Education in Virginia is 8.7%.
What is the Percentage of Population with a Degree in Education in the United States?
Percentage of Population with a Degree in Education in the United States is 11.1%.