Zip Codes with the Highest Percentage of Population Employed in Arts, Media & Entertainment in Chantilly, VA
RELATED REPORTS & OPTIONS
Arts, Media & Entertainment
Chantilly
Compare Zip Codes
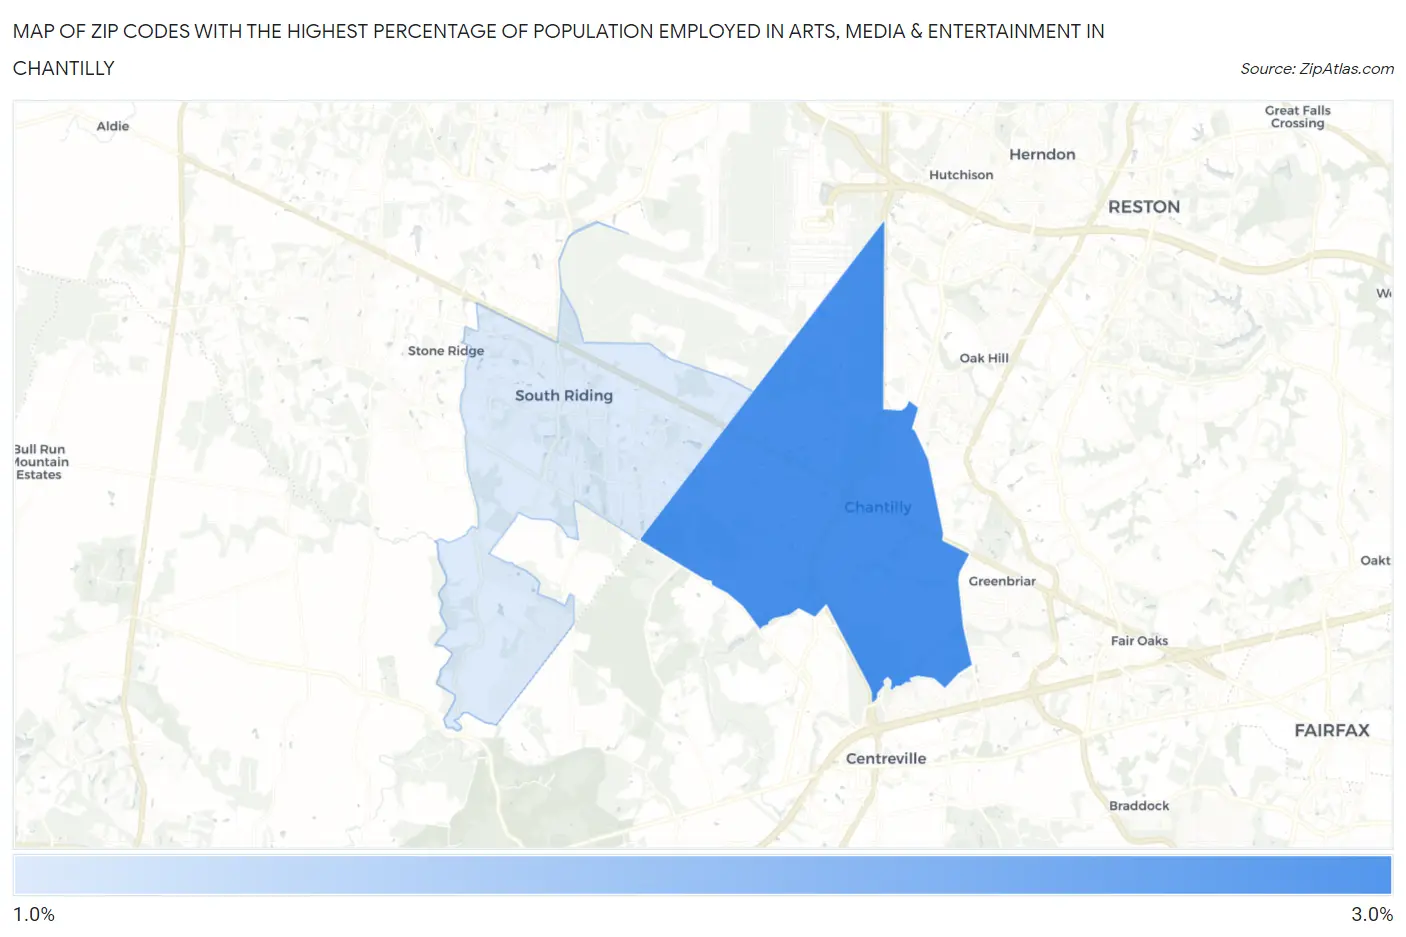
Map of Zip Codes with the Highest Percentage of Population Employed in Arts, Media & Entertainment in Chantilly
2.0%
2.6%
Zip Codes with the Highest Percentage of Population Employed in Arts, Media & Entertainment in Chantilly, VA
| Zip Code | % Employed | vs State | vs National | |
| 1. | 20151 | 2.6% | 2.1%(+0.523)#170 | 2.1%(+0.533)#5,254 |
| 2. | 20152 | 2.0% | 2.1%(-0.095)#240 | 2.1%(-0.085)#7,941 |
1
Common Questions
What are the Top Zip Codes with the Highest Percentage of Population Employed in Arts, Media & Entertainment in Chantilly, VA?
Top Zip Codes with the Highest Percentage of Population Employed in Arts, Media & Entertainment in Chantilly, VA are:
What zip code has the Highest Percentage of Population Employed in Arts, Media & Entertainment in Chantilly, VA?
20151 has the Highest Percentage of Population Employed in Arts, Media & Entertainment in Chantilly, VA with 2.6%.
What is the Percentage of Population Employed in Arts, Media & Entertainment in Chantilly, VA?
Percentage of Population Employed in Arts, Media & Entertainment in Chantilly is 2.4%.
What is the Percentage of Population Employed in Arts, Media & Entertainment in Virginia?
Percentage of Population Employed in Arts, Media & Entertainment in Virginia is 2.1%.
What is the Percentage of Population Employed in Arts, Media & Entertainment in the United States?
Percentage of Population Employed in Arts, Media & Entertainment in the United States is 2.1%.