Zip Codes with the Highest Percentage of Population Employed in Computer, Engineering & Science in Chantilly, VA
RELATED REPORTS & OPTIONS
Computer, Engineering & Science
Chantilly
Compare Zip Codes
Map of Zip Codes with the Highest Percentage of Population Employed in Computer, Engineering & Science in Chantilly
16.1%
25.9%
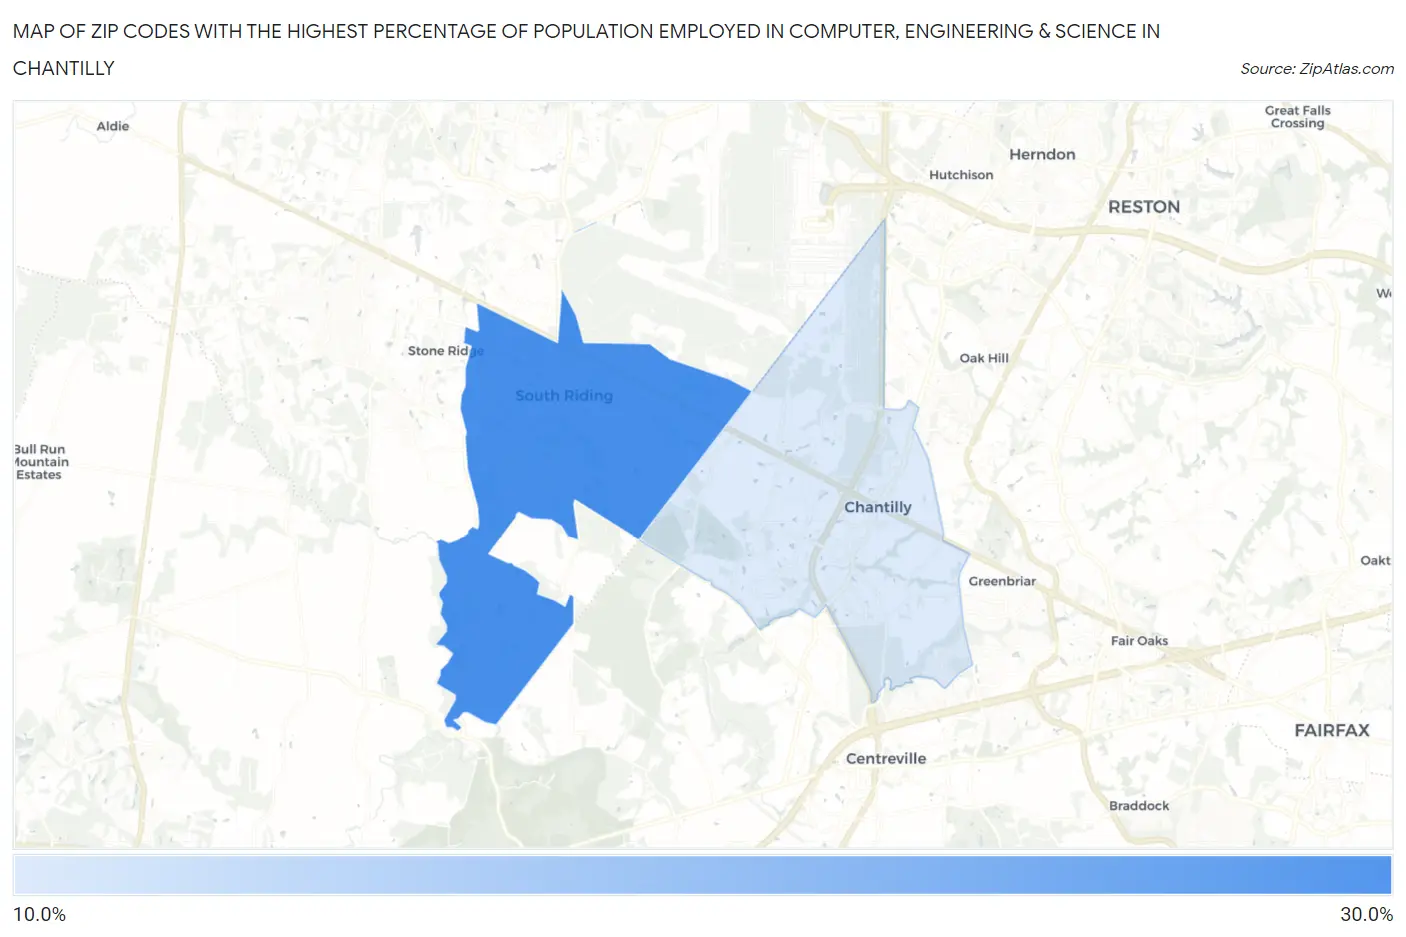
Zip Codes with the Highest Percentage of Population Employed in Computer, Engineering & Science in Chantilly, VA
| Zip Code | % Employed | vs State | vs National | |
| 1. | 20152 | 25.9% | 9.8%(+16.0)#7 | 6.8%(+19.1)#256 |
| 2. | 20151 | 16.1% | 9.8%(+6.24)#61 | 6.8%(+9.30)#948 |
1
Common Questions
What are the Top Zip Codes with the Highest Percentage of Population Employed in Computer, Engineering & Science in Chantilly, VA?
Top Zip Codes with the Highest Percentage of Population Employed in Computer, Engineering & Science in Chantilly, VA are:
What zip code has the Highest Percentage of Population Employed in Computer, Engineering & Science in Chantilly, VA?
20152 has the Highest Percentage of Population Employed in Computer, Engineering & Science in Chantilly, VA with 25.9%.
What is the Percentage of Population Employed in Computer, Engineering & Science in Chantilly, VA?
Percentage of Population Employed in Computer, Engineering & Science in Chantilly is 16.1%.
What is the Percentage of Population Employed in Computer, Engineering & Science in Virginia?
Percentage of Population Employed in Computer, Engineering & Science in Virginia is 9.8%.
What is the Percentage of Population Employed in Computer, Engineering & Science in the United States?
Percentage of Population Employed in Computer, Engineering & Science in the United States is 6.8%.