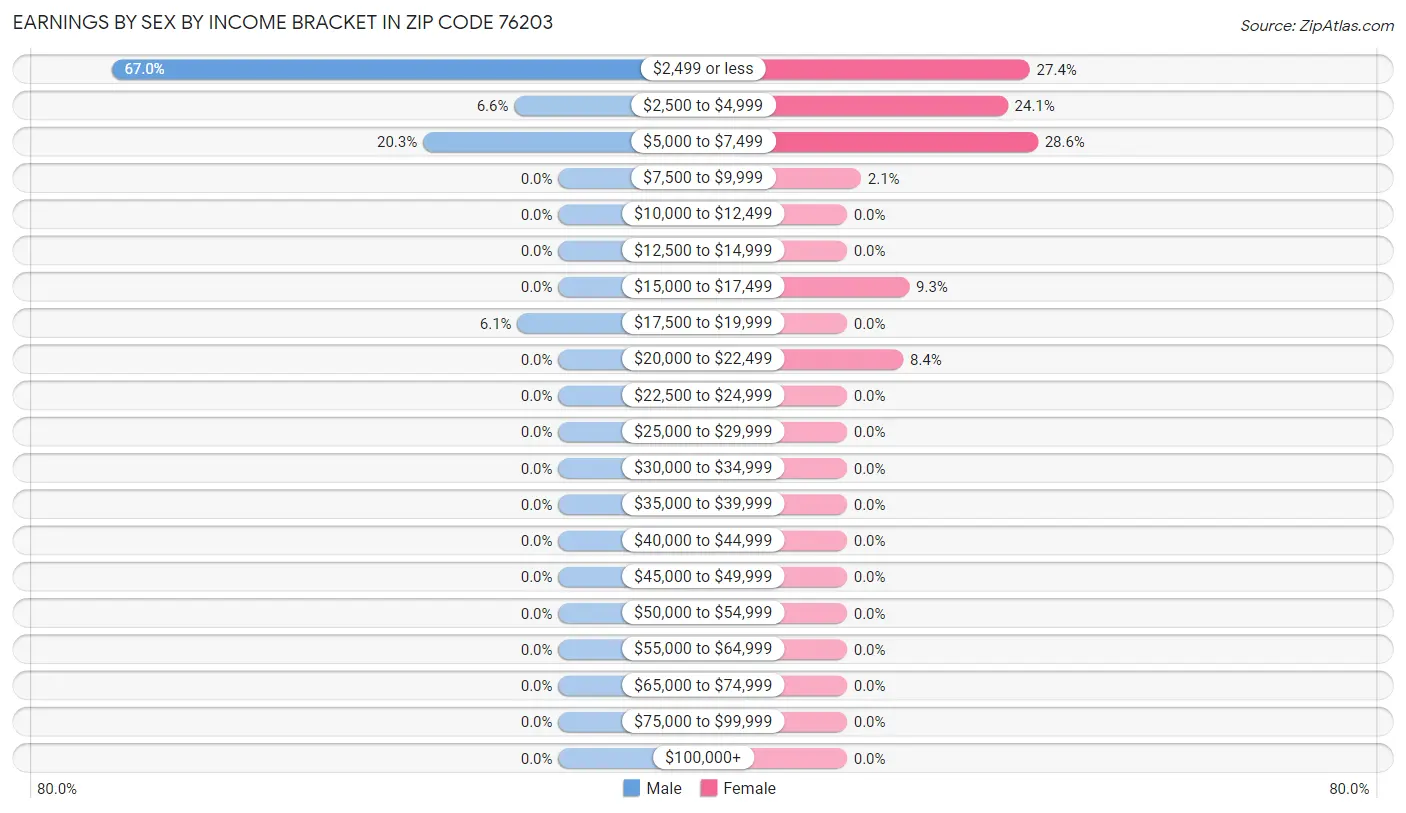
Earnings by Sex by Income Bracket in Zip Code 76203
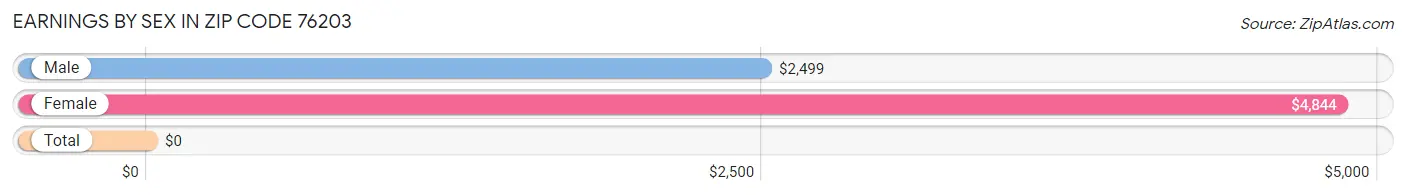
The most common earnings brackets in Zip Code 76203 are $2,499 or less for men (142 | 67.0%) and $5,000 to $7,499 for women (95 | 28.6%).
Income
Male
Female
$2,499 or less
142 (67.0%)
91 (27.4%)
$2,500 to $4,999
14 (6.6%)
80 (24.1%)
$5,000 to $7,499
43 (20.3%)
95 (28.6%)
$7,500 to $9,999
0 (0.0%)
7 (2.1%)
$10,000 to $12,499
0 (0.0%)
0 (0.0%)
$12,500 to $14,999
0 (0.0%)
0 (0.0%)
$15,000 to $17,499
0 (0.0%)
31 (9.3%)
$17,500 to $19,999
13 (6.1%)
0 (0.0%)
$20,000 to $22,499
0 (0.0%)
28 (8.4%)
$22,500 to $24,999
0 (0.0%)
0 (0.0%)
$25,000 to $29,999
0 (0.0%)
0 (0.0%)
$30,000 to $34,999
0 (0.0%)
0 (0.0%)
$35,000 to $39,999
0 (0.0%)
0 (0.0%)
$40,000 to $44,999
0 (0.0%)
0 (0.0%)
$45,000 to $49,999
0 (0.0%)
0 (0.0%)
$50,000 to $54,999
0 (0.0%)
0 (0.0%)
$55,000 to $64,999
0 (0.0%)
0 (0.0%)
$65,000 to $74,999
0 (0.0%)
0 (0.0%)
$75,000 to $99,999
0 (0.0%)
0 (0.0%)
$100,000+
0 (0.0%)
0 (0.0%)
Total
212 (100.0%)
332 (100.0%)
Earnings by Sex by Educational Attainment in Zip Code 76203
Educational Attainment
Male Income
Female Income
Less than High School
-
-
High School Diploma
-
-
College or Associate's Degree
-
-
Bachelor's Degree
-
-
Graduate Degree
-
-
Total
-
-
Family Income in Zip Code 76203
Family Income Brackets in Zip Code 76203
Income Bracket
# Families
% Families
Less than $10,000
0
0.0%
$10,000 to $14,999
0
0.0%
$15,000 to $24,999
0
0.0%
$25,000 to $34,999
0
0.0%
$35,000 to $49,999
0
0.0%
$50,000 to $74,999
0
0.0%
$75,000 to $99,999
0
0.0%
$100,000 to $149,999
0
0.0%
$150,000 to $199,999
0
0.0%
$200,000+
0
0.0%
Family Income by Famaliy Size in Zip Code 76203
Income Bracket
# Families
Median Income
2-Person Families
0 (0.0%)
$0
3-Person Families
0 (0.0%)
$0
4-Person Families
0 (0.0%)
$0
5-Person Families
0 (0.0%)
$0
6-Person Families
0 (0.0%)
$0
7+ Person Families
0 (0.0%)
$0
Total
0 (0.0%)
$0
Family Income by Number of Earners in Zip Code 76203
Number of Earners
# Families
Median Income
No Earners
0 (0.0%)
$0
1 Earner
0 (0.0%)
$0
2 Earners
0 (0.0%)
$0
3+ Earners
0 (0.0%)
$0
Total
0 (0.0%)
$0
Household Income in Zip Code 76203
Household Income Brackets in Zip Code 76203
Income Bracket
# Households
% Households
Less than $10,000
0
0.0%
$10,000 to $14,999
0
0.0%
$15,000 to $24,999
0
0.0%
$25,000 to $34,999
0
0.0%
$35,000 to $49,999
0
0.0%
$50,000 to $74,999
0
0.0%
$75,000 to $99,999
0
0.0%
$100,000 to $149,999
0
0.0%
$150,000 to $199,999
0
0.0%
$200,000+
0
0.0%
Household Income by Householder Age in Zip Code 76203
Income Bracket
# Households
Median Income
15 to 24 Years
0 (0.0%)
$0
25 to 44 Years
0 (0.0%)
$0
45 to 64 Years
0 (0.0%)
$0
65+ Years
0 (0.0%)
$0
Total
0 (0.0%)
$0
Poverty in Zip Code 76203
Income Below Poverty by Sex and Age in Zip Code 76203
Age Bracket
Male
Female
Under 5 Years
0 (0.0%)
0 (0.0%)
5 Years
0 (0.0%)
0 (0.0%)
6 to 11 Years
0 (0.0%)
0 (0.0%)
12 to 14 Years
0 (0.0%)
0 (0.0%)
15 Years
0 (0.0%)
0 (0.0%)
16 and 17 Years
0 (0.0%)
0 (0.0%)
18 to 24 Years
0 (0.0%)
0 (0.0%)
25 to 34 Years
0 (0.0%)
0 (0.0%)
35 to 44 Years
0 (0.0%)
0 (0.0%)
45 to 54 Years
0 (0.0%)
0 (0.0%)
55 to 64 Years
0 (0.0%)
0 (0.0%)
65 to 74 Years
0 (0.0%)
0 (0.0%)
75 Years and over
0 (0.0%)
0 (0.0%)
Total
0 (0.0%)
0 (0.0%)
Income Above Poverty by Sex and Age in Zip Code 76203
Age Bracket
Male
Female
Under 5 Years
0 (0.0%)
0 (0.0%)
5 Years
0 (0.0%)
0 (0.0%)
6 to 11 Years
0 (0.0%)
0 (0.0%)
12 to 14 Years
0 (0.0%)
0 (0.0%)
15 Years
0 (0.0%)
0 (0.0%)
16 and 17 Years
0 (0.0%)
0 (0.0%)
18 to 24 Years
0 (0.0%)
0 (0.0%)
25 to 34 Years
0 (0.0%)
0 (0.0%)
35 to 44 Years
0 (0.0%)
0 (0.0%)
45 to 54 Years
0 (0.0%)
0 (0.0%)
55 to 64 Years
0 (0.0%)
0 (0.0%)
65 to 74 Years
0 (0.0%)
0 (0.0%)
75 Years and over
0 (0.0%)
0 (0.0%)
Total
0 (0.0%)
0 (0.0%)
Income Below Poverty Among Married-Couple Families in Zip Code 76203
Children
Above Poverty
Below Poverty
No Children
0 (0.0%)
0 (0.0%)
1 or 2 Children
0 (0.0%)
0 (0.0%)
3 or 4 Children
0 (0.0%)
0 (0.0%)
5 or more Children
0 (0.0%)
0 (0.0%)
Total
0 (0.0%)
0 (0.0%)
Income Below Poverty Among Single-Parent Households in Zip Code 76203
Children
Single Father
Single Mother
No Children
0 (0.0%)
0 (0.0%)
1 or 2 Children
0 (0.0%)
0 (0.0%)
3 or 4 Children
0 (0.0%)
0 (0.0%)
5 or more Children
0 (0.0%)
0 (0.0%)
Total
0 (0.0%)
0 (0.0%)
Income Below Poverty Among Married-Couple vs Single-Parent Households in Zip Code 76203
Children
Married-Couple Families
Single-Parent Households
No Children
0 (0.0%)
0 (0.0%)
1 or 2 Children
0 (0.0%)
0 (0.0%)
3 or 4 Children
0 (0.0%)
0 (0.0%)
5 or more Children
0 (0.0%)
0 (0.0%)
Total
0 (0.0%)
0 (0.0%)
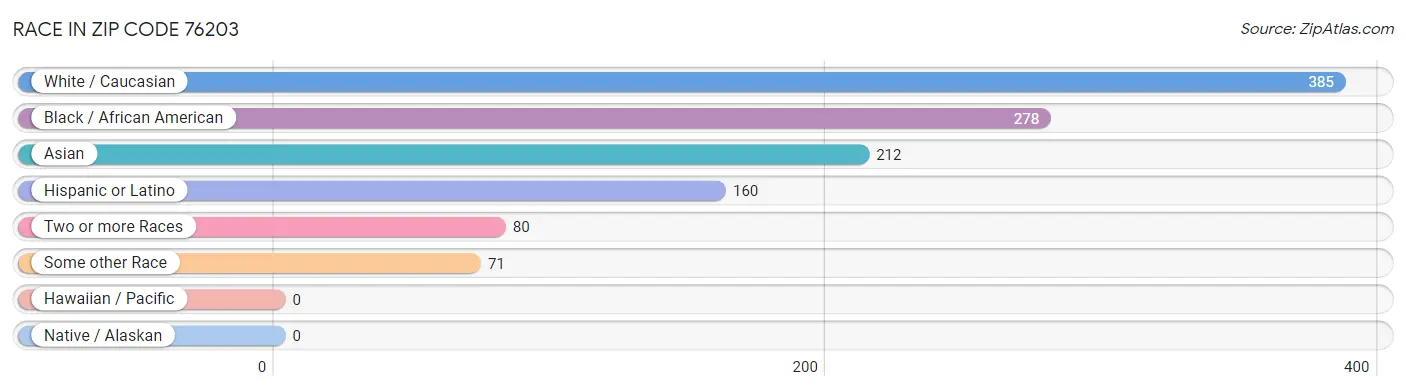
Race in Zip Code 76203
The most populous races in Zip Code 76203 are White / Caucasian (385 | 37.5%), Black / African American (278 | 27.1%), and Asian (212 | 20.7%).
Race
# Population
% Population
Asian
212
20.7%
Black / African American
278
27.1%
Hawaiian / Pacific
0
0.0%
Hispanic or Latino
160
15.6%
Native / Alaskan
0
0.0%
White / Caucasian
385
37.5%
Two or more Races
80
7.8%
Some other Race
71
6.9%
Total
1,026
100.0%
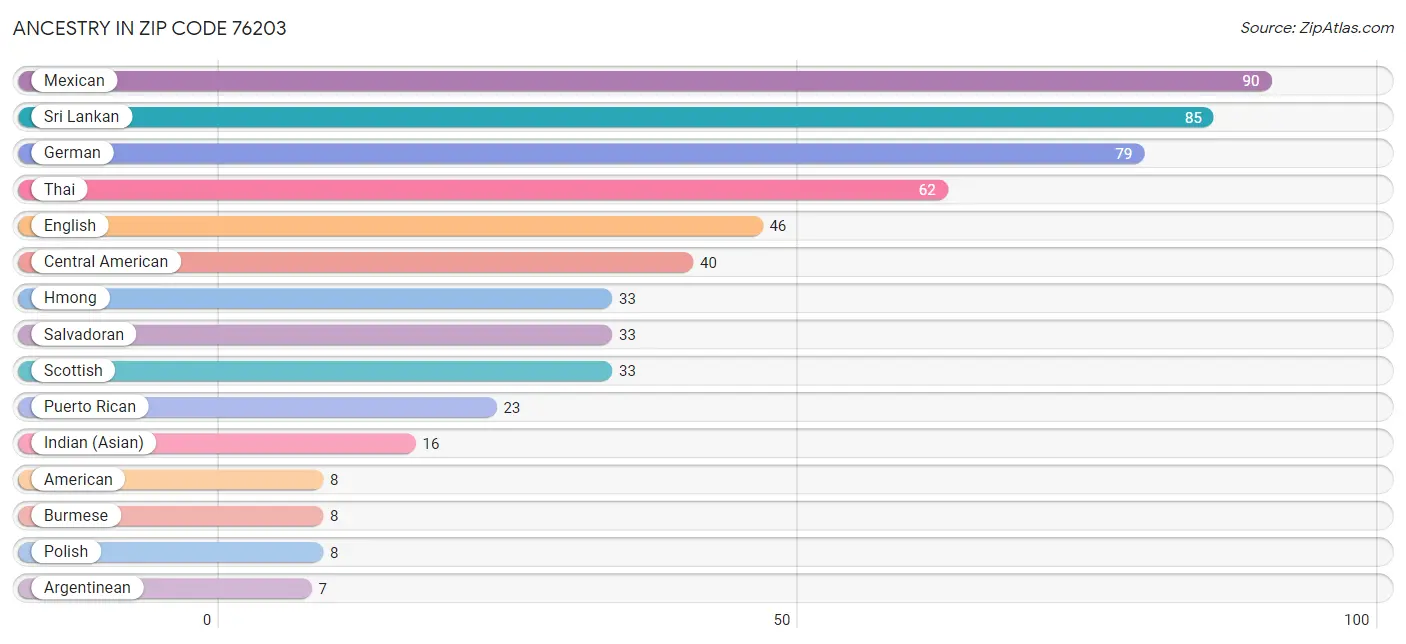
Ancestry in Zip Code 76203
The most populous ancestries reported in Zip Code 76203 are Mexican (90 | 8.8%), Sri Lankan (85 | 8.3%), German (79 | 7.7%), Thai (62 | 6.0%), and English (46 | 4.5%), together accounting for 35.3% of all Zip Code 76203 residents.
Ancestry
# Population
% Population
American
8
0.8%
Argentinean
7
0.7%
Burmese
8
0.8%
Central American
40
3.9%
English
46
4.5%
German
79
7.7%
Hmong
33
3.2%
Honduran
7
0.7%
Indian (Asian)
16
1.6%
Mexican
90
8.8%
Polish
8
0.8%
Puerto Rican
23
2.2%
Salvadoran
33
3.2%
Scottish
33
3.2%
South American
7
0.7%
Sri Lankan
85
8.3%
Thai
62
6.0%
View All 17 Rows
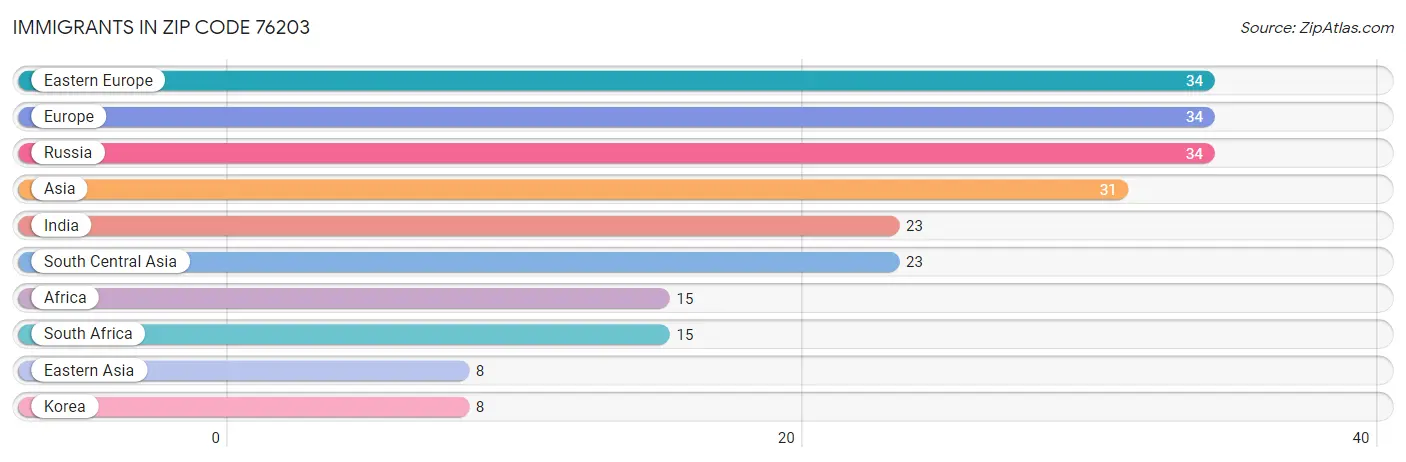
Immigrants in Zip Code 76203
The most numerous immigrant groups reported in Zip Code 76203 came from Eastern Europe (34 | 3.3%), Europe (34 | 3.3%), Russia (34 | 3.3%), Asia (31 | 3.0%), and India (23 | 2.2%), together accounting for 15.2% of all Zip Code 76203 residents.
Immigration Origin
# Population
% Population
Africa
15
1.5%
Asia
31
3.0%
Eastern Asia
8
0.8%
Eastern Europe
34
3.3%
Europe
34
3.3%
India
23
2.2%
Korea
8
0.8%
Russia
34
3.3%
South Africa
15
1.5%
South Central Asia
23
2.2%
View All 10 Rows
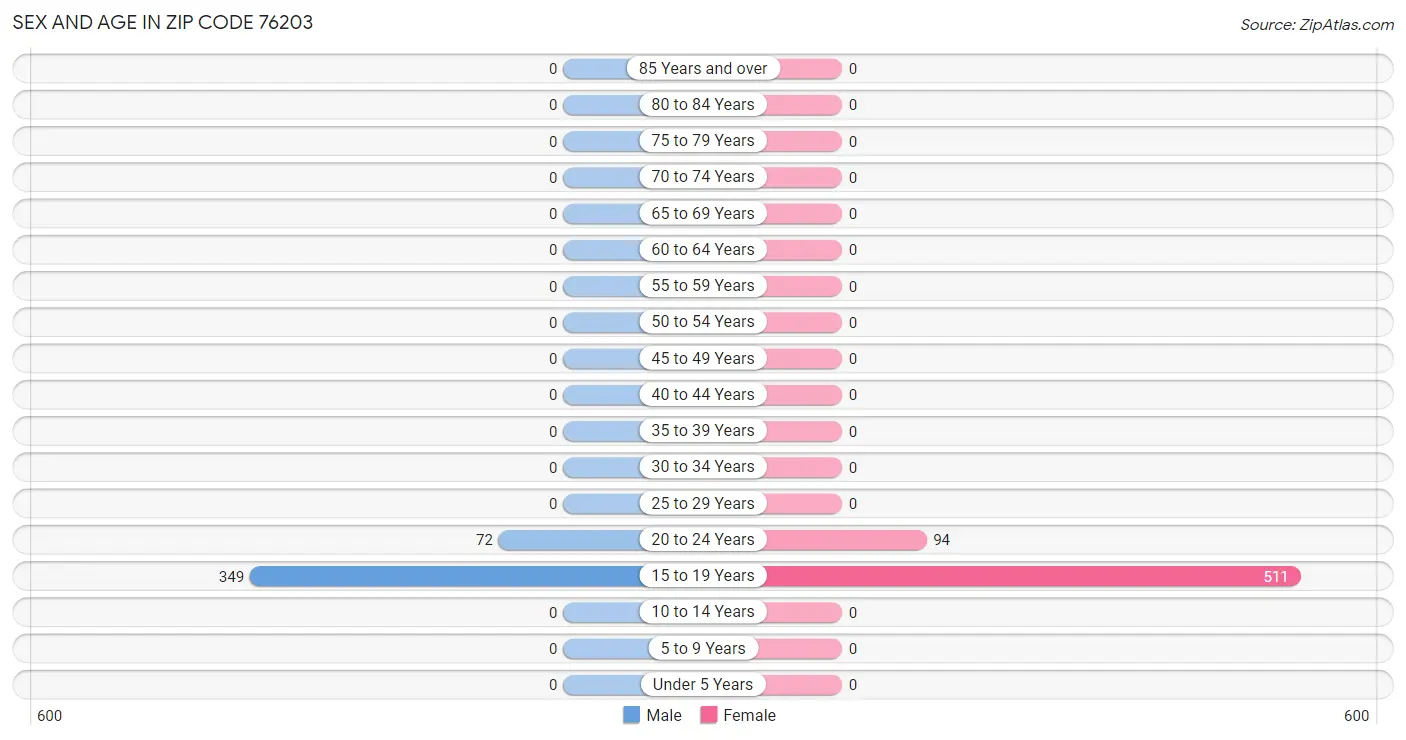
Sex and Age in Zip Code 76203
Sex and Age in Zip Code 76203
The most populous age groups in Zip Code 76203 are 15 to 19 Years (349 | 82.9%) for men and 15 to 19 Years (511 | 84.5%) for women.
Age Bracket
Male
Female
Under 5 Years
0 (0.0%)
0 (0.0%)
5 to 9 Years
0 (0.0%)
0 (0.0%)
10 to 14 Years
0 (0.0%)
0 (0.0%)
15 to 19 Years
349 (82.9%)
511 (84.5%)
20 to 24 Years
72 (17.1%)
94 (15.5%)
25 to 29 Years
0 (0.0%)
0 (0.0%)
30 to 34 Years
0 (0.0%)
0 (0.0%)
35 to 39 Years
0 (0.0%)
0 (0.0%)
40 to 44 Years
0 (0.0%)
0 (0.0%)
45 to 49 Years
0 (0.0%)
0 (0.0%)
50 to 54 Years
0 (0.0%)
0 (0.0%)
55 to 59 Years
0 (0.0%)
0 (0.0%)
60 to 64 Years
0 (0.0%)
0 (0.0%)
65 to 69 Years
0 (0.0%)
0 (0.0%)
70 to 74 Years
0 (0.0%)
0 (0.0%)
75 to 79 Years
0 (0.0%)
0 (0.0%)
80 to 84 Years
0 (0.0%)
0 (0.0%)
85 Years and over
0 (0.0%)
0 (0.0%)
Total
421 (100.0%)
605 (100.0%)
Families and Households in Zip Code 76203
Median Family Size in Zip Code 76203
Family Type
# Families
Family Size
Married-Couple
0 (0.0%)
-
Single Male/Father
0 (0.0%)
-
Single Female/Mother
0 (0.0%)
-
Total Families
0 (0.0%)
-
Median Household Size in Zip Code 76203
Household Type
# Households
Household Size
Married-Couple
0 (0.0%)
-
Single Male/Father
0 (0.0%)
-
Single Female/Mother
0 (0.0%)
-
Non-family
0 (0.0%)
-
Total Households
0 (0.0%)
-
Household Size by Marriage Status in Zip Code 76203
Household Size
Family Households
Nonfamily Households
1-Person Households
-
0 (0.0%)
2-Person Households
0 (0.0%)
0 (0.0%)
3-Person Households
0 (0.0%)
0 (0.0%)
4-Person Households
0 (0.0%)
0 (0.0%)
5-Person Households
0 (0.0%)
0 (0.0%)
6-Person Households
0 (0.0%)
0 (0.0%)
7+ Person Households
0 (0.0%)
0 (0.0%)
Total
0 (0.0%)
0 (0.0%)
Female Fertility in Zip Code 76203
Fertility by Age in Zip Code 76203
Age Bracket
Women with Births
Births / 1,000 Women
15 to 19 years
0 (0.0%)
0.0
20 to 34 years
0 (0.0%)
0.0
35 to 50 years
0 (0.0%)
0.0
Total
0 (0.0%)
0.0
Fertility by Age by Marriage Status in Zip Code 76203
Age Bracket
Married
Unmarried
15 to 19 years
0 (0.0%)
0 (0.0%)
20 to 34 years
0 (0.0%)
0 (0.0%)
35 to 50 years
0 (0.0%)
0 (0.0%)
Total
0 (0.0%)
0 (0.0%)
Fertility by Education in Zip Code 76203
Educational Attainment
Women with Births
Births / 1,000 Women
Less than High School
0 (0.0%)
0.0
High School Diploma
0 (0.0%)
0.0
College or Associate's Degree
0 (0.0%)
0.0
Bachelor's Degree
0 (0.0%)
0.0
Graduate Degree
0 (0.0%)
0.0
Total
0 (0.0%)
0.0
Fertility by Education by Marriage Status in Zip Code 76203
Educational Attainment
Married
Unmarried
Less than High School
0 (0.0%)
0 (0.0%)
High School Diploma
0 (0.0%)
0 (0.0%)
College or Associate's Degree
0 (0.0%)
0 (0.0%)
Bachelor's Degree
0 (0.0%)
0 (0.0%)
Graduate Degree
0 (0.0%)
0 (0.0%)
Total
0 (0.0%)
0 (0.0%)
Employment Characteristics in Zip Code 76203
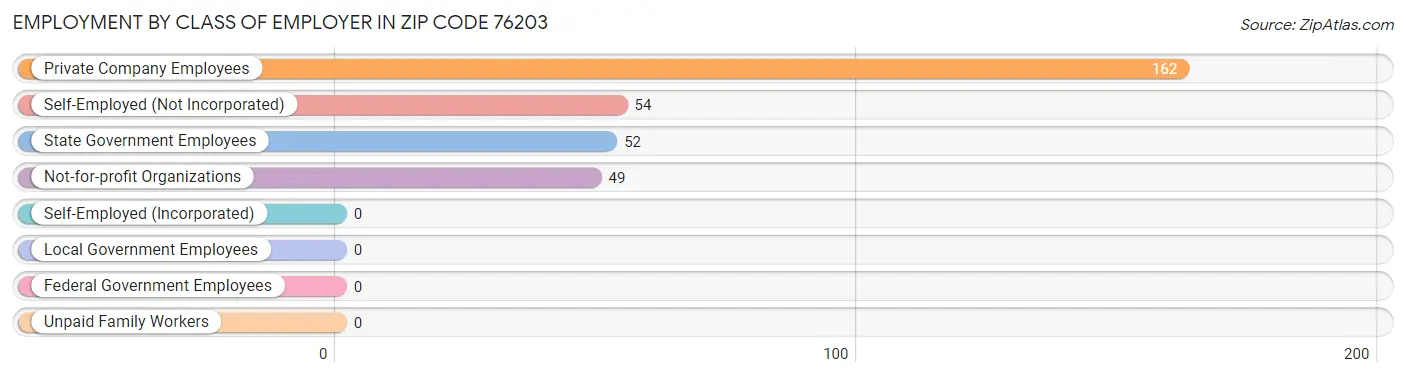
Employment by Class of Employer in Zip Code 76203
Among the 317 employed individuals in Zip Code 76203, private company employees (162 | 51.1%), self-employed (not incorporated) (54 | 17.0%), and state government employees (52 | 16.4%) make up the most common classes of employment.
Employer Class
# Employees
% Employees
Private Company Employees
162
51.1%
Self-Employed (Incorporated)
0
0.0%
Self-Employed (Not Incorporated)
54
17.0%
Not-for-profit Organizations
49
15.5%
Local Government Employees
0
0.0%
State Government Employees
52
16.4%
Federal Government Employees
0
0.0%
Unpaid Family Workers
0
0.0%
Total
317
100.0%
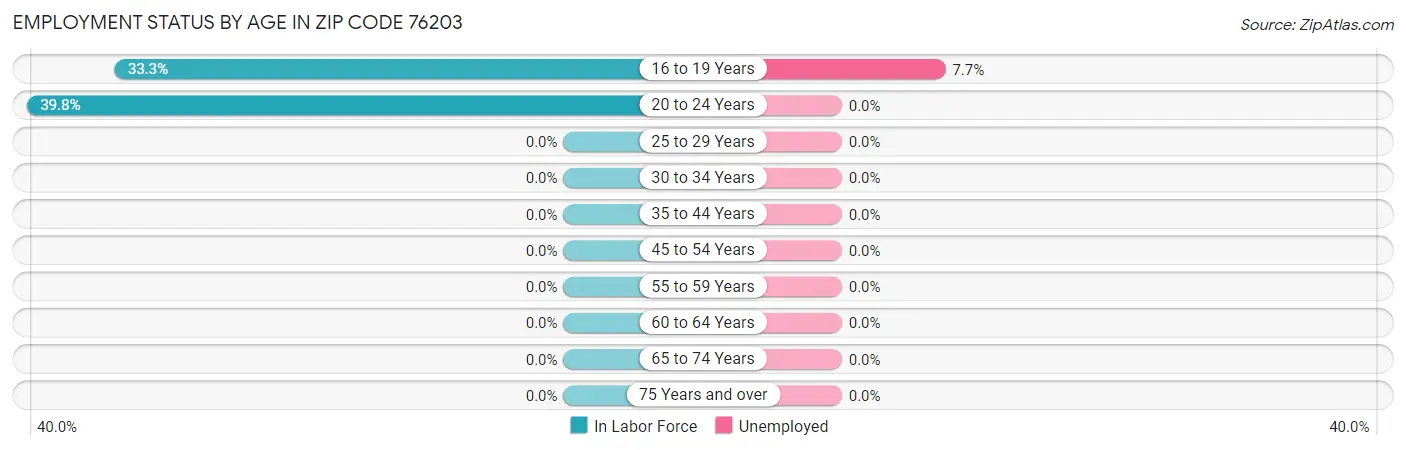
Employment Status by Age in Zip Code 76203
According to the labor force statistics for Zip Code 76203, out of the total population over 16 years of age (1,026), 34.3% or 352 individuals are in the labor force, with 6.3% or 22 of them unemployed. The age group with the highest labor force participation rate is 20 to 24 years, with 39.8% or 66 individuals in the labor force. Within the labor force, the 16 to 19 years age range has the highest percentage of unemployed individuals, with 7.7% or 22 of them being unemployed.
Age Bracket
In Labor Force
Unemployed
16 to 19 Years
286 (33.3%)
22 (7.7%)
20 to 24 Years
66 (39.8%)
0 (0.0%)
25 to 29 Years
0 (0.0%)
0 (0.0%)
30 to 34 Years
0 (0.0%)
0 (0.0%)
35 to 44 Years
0 (0.0%)
0 (0.0%)
45 to 54 Years
0 (0.0%)
0 (0.0%)
55 to 59 Years
0 (0.0%)
0 (0.0%)
60 to 64 Years
0 (0.0%)
0 (0.0%)
65 to 74 Years
0 (0.0%)
0 (0.0%)
75 Years and over
0 (0.0%)
0 (0.0%)
Total
352 (34.3%)
22 (6.3%)
Employment Status by Educational Attainment in Zip Code 76203
Educational Attainment
In Labor Force
Unemployed
Less than High School
0 (0.0%)
0 (0.0%)
High School Diploma
0 (0.0%)
0 (0.0%)
College / Associate Degree
0 (0.0%)
0 (0.0%)
Bachelor's Degree or higher
0 (0.0%)
0 (0.0%)
Total
0 (0.0%)
0 (0.0%)
Employment Occupations by Sex in Zip Code 76203
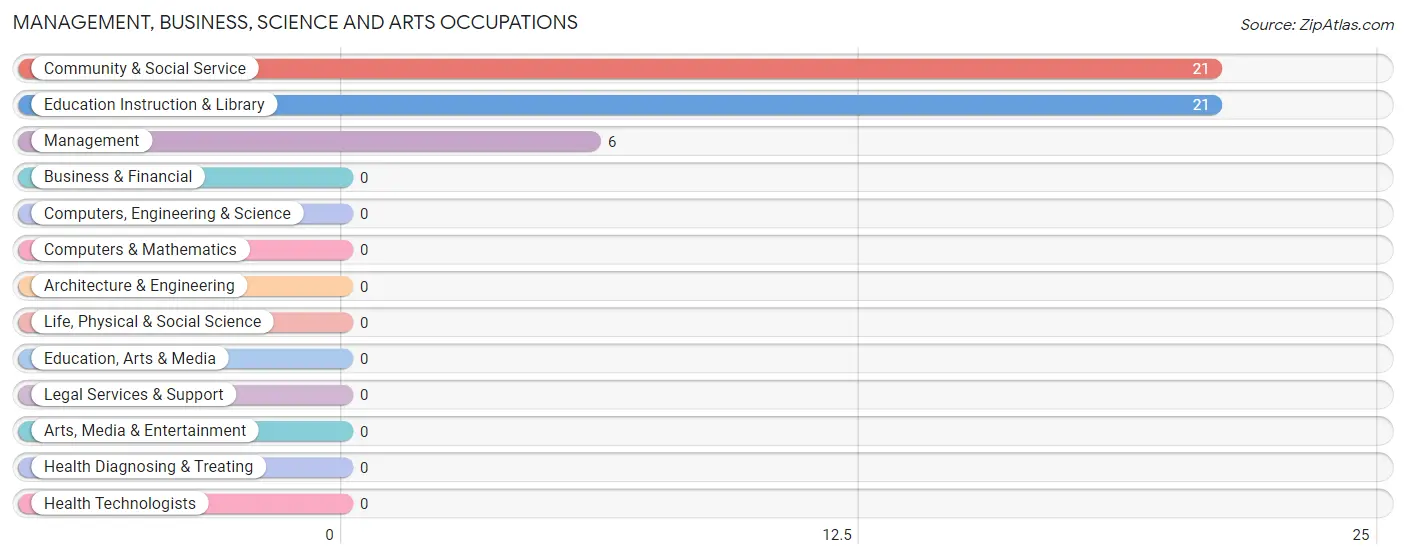
Management, Business, Science and Arts Occupations
The most common Management, Business, Science and Arts occupations in Zip Code 76203 are Community & Social Service (21 | 6.4%), Education Instruction & Library (21 | 6.4%), and Management (6 | 1.8%).
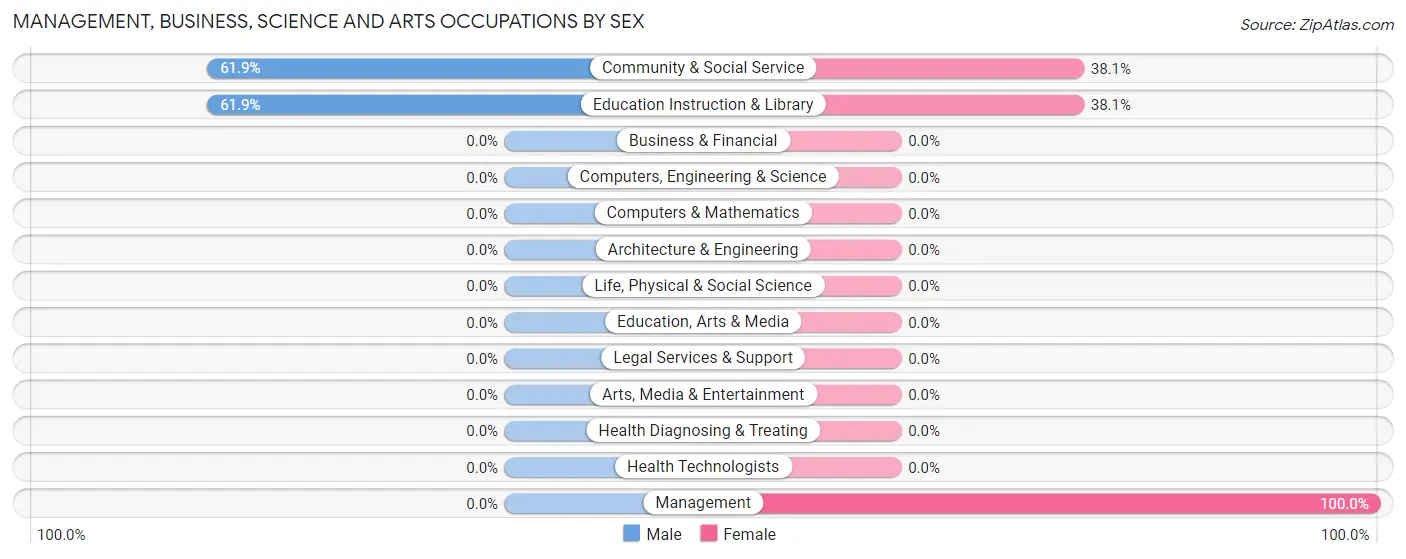
Management, Business, Science and Arts Occupations by Sex
Within the Management, Business, Science and Arts occupations in Zip Code 76203, the most male-oriented occupations are Community & Social Service (61.9%), and Education Instruction & Library (61.9%), while the most female-oriented occupations are Management (100.0%), Community & Social Service (38.1%), and Education Instruction & Library (38.1%).
Occupation
Male
Female
Management
0 (0.0%)
6 (100.0%)
Business & Financial
0 (0.0%)
0 (0.0%)
Computers, Engineering & Science
0 (0.0%)
0 (0.0%)
Computers & Mathematics
0 (0.0%)
0 (0.0%)
Architecture & Engineering
0 (0.0%)
0 (0.0%)
Life, Physical & Social Science
0 (0.0%)
0 (0.0%)
Community & Social Service
13 (61.9%)
8 (38.1%)
Education, Arts & Media
0 (0.0%)
0 (0.0%)
Legal Services & Support
0 (0.0%)
0 (0.0%)
Education Instruction & Library
13 (61.9%)
8 (38.1%)
Arts, Media & Entertainment
0 (0.0%)
0 (0.0%)
Health Diagnosing & Treating
0 (0.0%)
0 (0.0%)
Health Technologists
0 (0.0%)
0 (0.0%)
Total (Category)
13 (48.1%)
14 (51.8%)
Total (Overall)
103 (31.2%)
227 (68.8%)
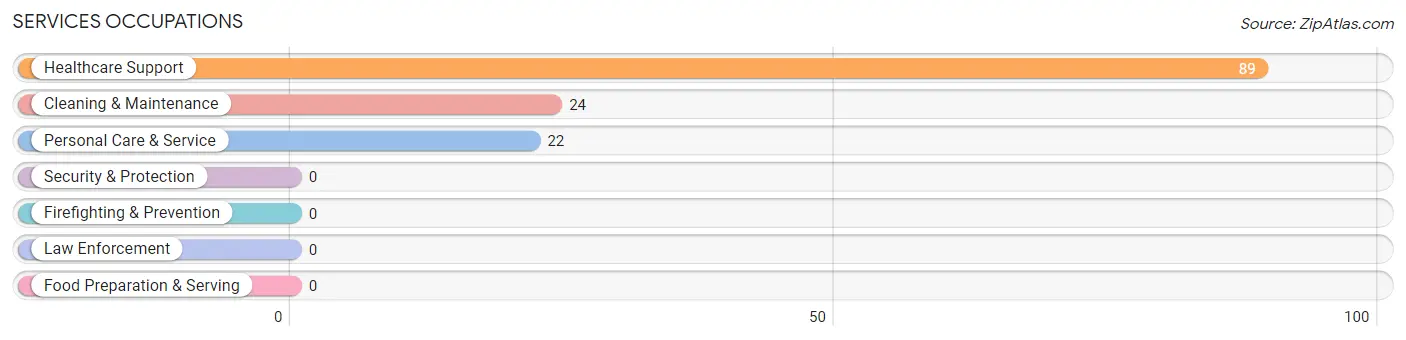
Services Occupations
The most common Services occupations in Zip Code 76203 are Healthcare Support (89 | 27.0%), Cleaning & Maintenance (24 | 7.3%), and Personal Care & Service (22 | 6.7%).
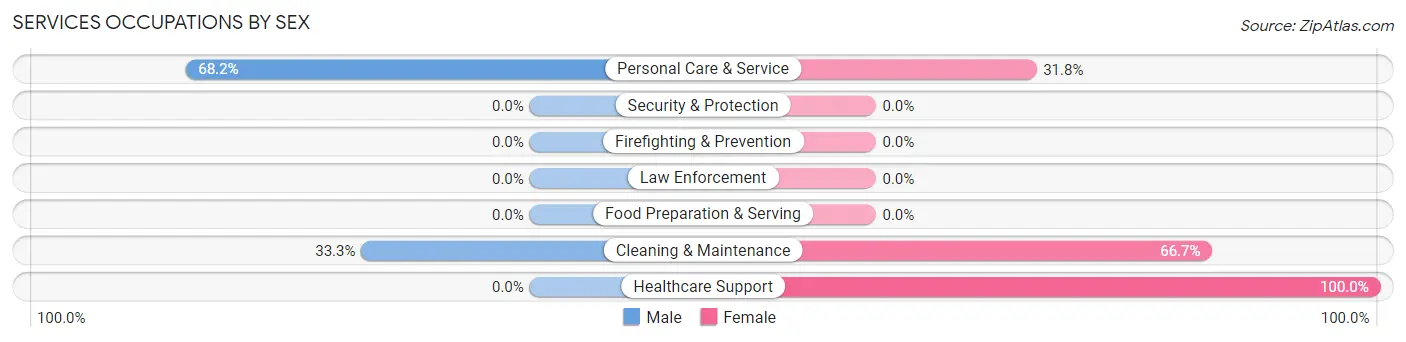
Services Occupations by Sex
Within the Services occupations in Zip Code 76203, the most male-oriented occupations are Personal Care & Service (68.2%), and Cleaning & Maintenance (33.3%), while the most female-oriented occupations are Healthcare Support (100.0%), Cleaning & Maintenance (66.7%), and Personal Care & Service (31.8%).
Occupation
Male
Female
Healthcare Support
0 (0.0%)
89 (100.0%)
Security & Protection
0 (0.0%)
0 (0.0%)
Firefighting & Prevention
0 (0.0%)
0 (0.0%)
Law Enforcement
0 (0.0%)
0 (0.0%)
Food Preparation & Serving
0 (0.0%)
0 (0.0%)
Cleaning & Maintenance
8 (33.3%)
16 (66.7%)
Personal Care & Service
15 (68.2%)
7 (31.8%)
Total (Category)
23 (17.0%)
112 (83.0%)
Total (Overall)
103 (31.2%)
227 (68.8%)
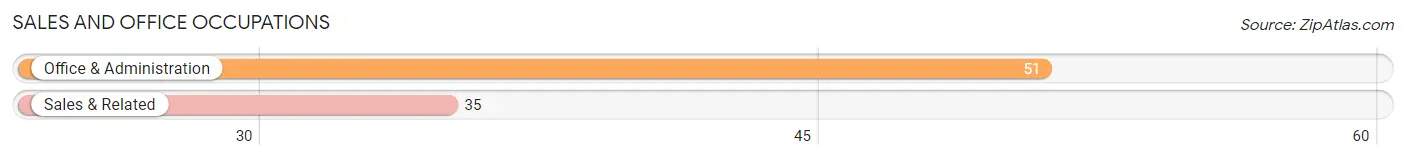
Sales and Office Occupations
The most common Sales and Office occupations in Zip Code 76203 are Office & Administration (51 | 15.4%), and Sales & Related (35 | 10.6%).
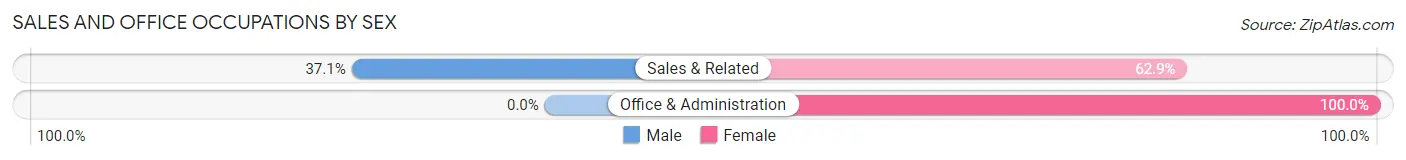
Sales and Office Occupations by Sex
Occupation
Male
Female
Sales & Related
13 (37.1%)
22 (62.9%)
Office & Administration
0 (0.0%)
51 (100.0%)
Total (Category)
13 (15.1%)
73 (84.9%)
Total (Overall)
103 (31.2%)
227 (68.8%)
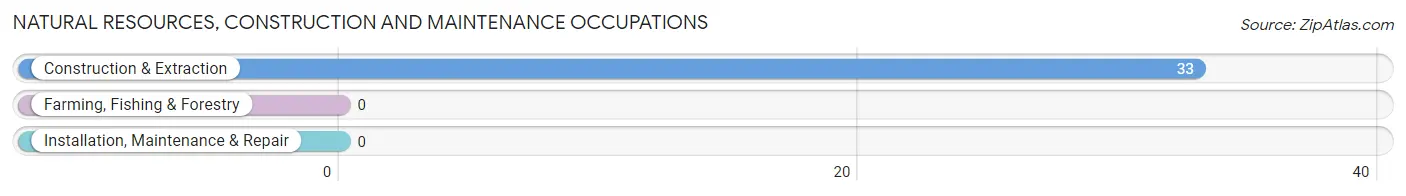
Natural Resources, Construction and Maintenance Occupations
The most common Natural Resources, Construction and Maintenance occupations in Zip Code 76203 are , and Construction & Extraction (33 | 10.0%).
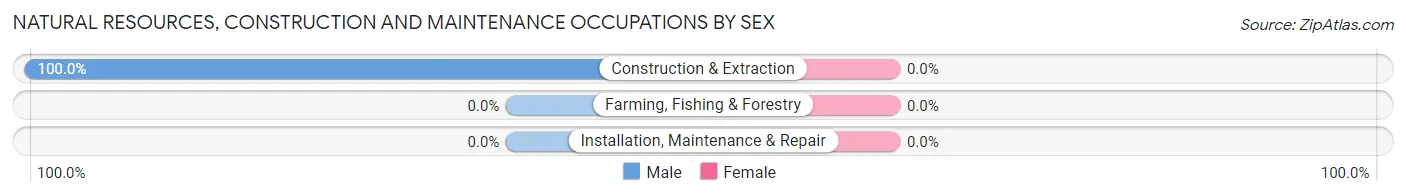
Natural Resources, Construction and Maintenance Occupations by Sex
Occupation
Male
Female
Farming, Fishing & Forestry
0 (0.0%)
0 (0.0%)
Construction & Extraction
33 (100.0%)
0 (0.0%)
Installation, Maintenance & Repair
0 (0.0%)
0 (0.0%)
Total (Category)
33 (100.0%)
0 (0.0%)
Total (Overall)
103 (31.2%)
227 (68.8%)
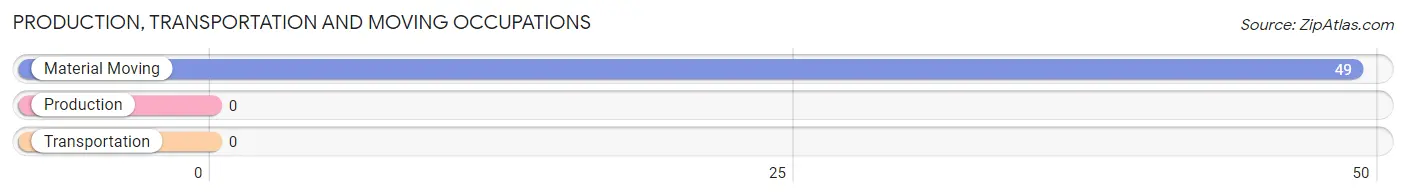
Production, Transportation and Moving Occupations
The most common Production, Transportation and Moving occupations in Zip Code 76203 are , and Material Moving (49 | 14.8%).
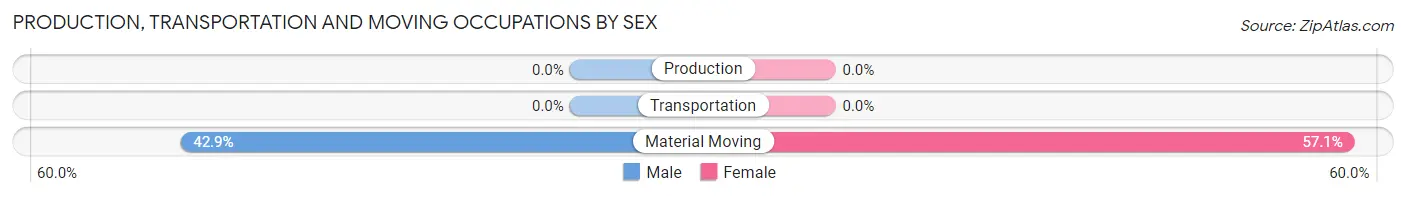
Production, Transportation and Moving Occupations by Sex
Occupation
Male
Female
Production
0 (0.0%)
0 (0.0%)
Transportation
0 (0.0%)
0 (0.0%)
Material Moving
21 (42.9%)
28 (57.1%)
Total (Category)
21 (42.9%)
28 (57.1%)
Total (Overall)
103 (31.2%)
227 (68.8%)
Employment Industries by Sex in Zip Code 76203
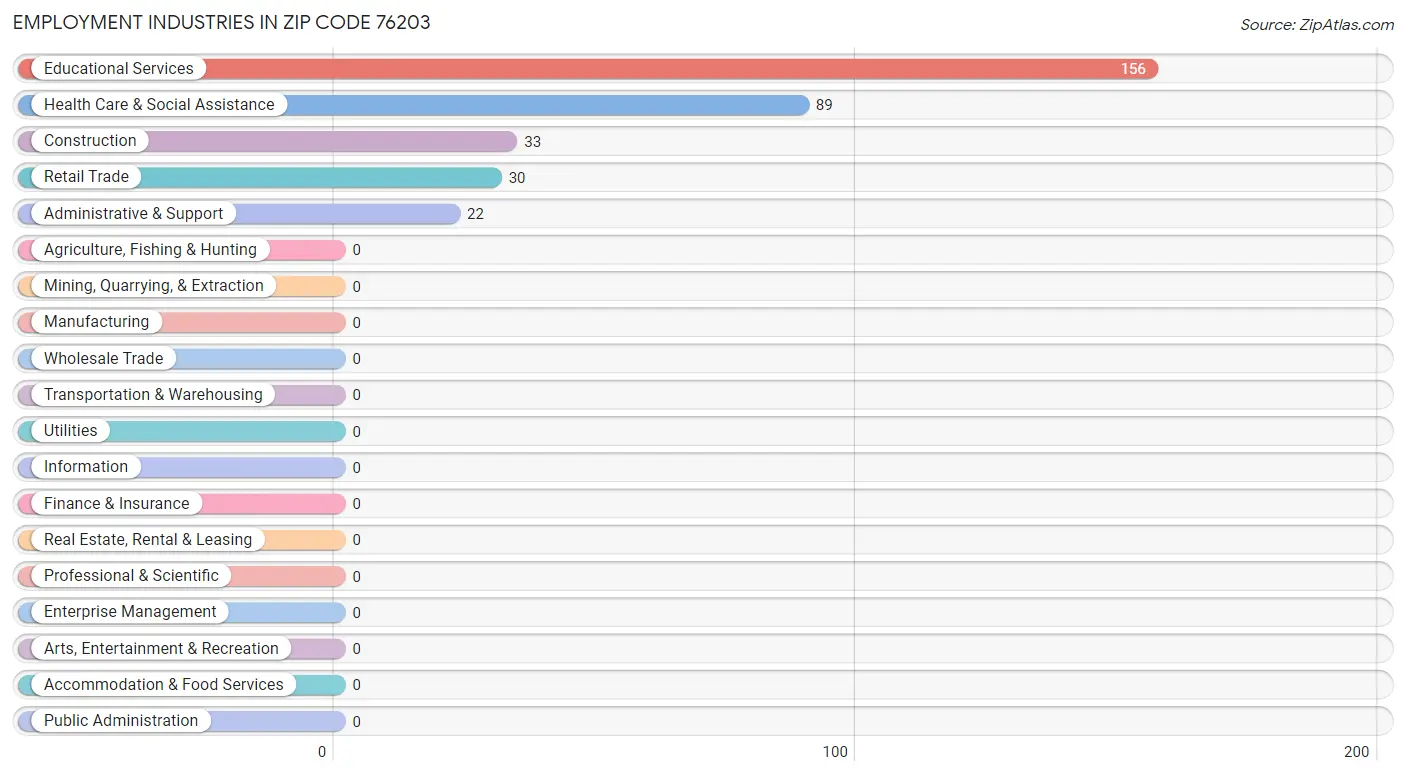
Employment Industries in Zip Code 76203
The major employment industries in Zip Code 76203 include Educational Services (156 | 47.3%), Health Care & Social Assistance (89 | 27.0%), Construction (33 | 10.0%), Retail Trade (30 | 9.1%), and Administrative & Support (22 | 6.7%).
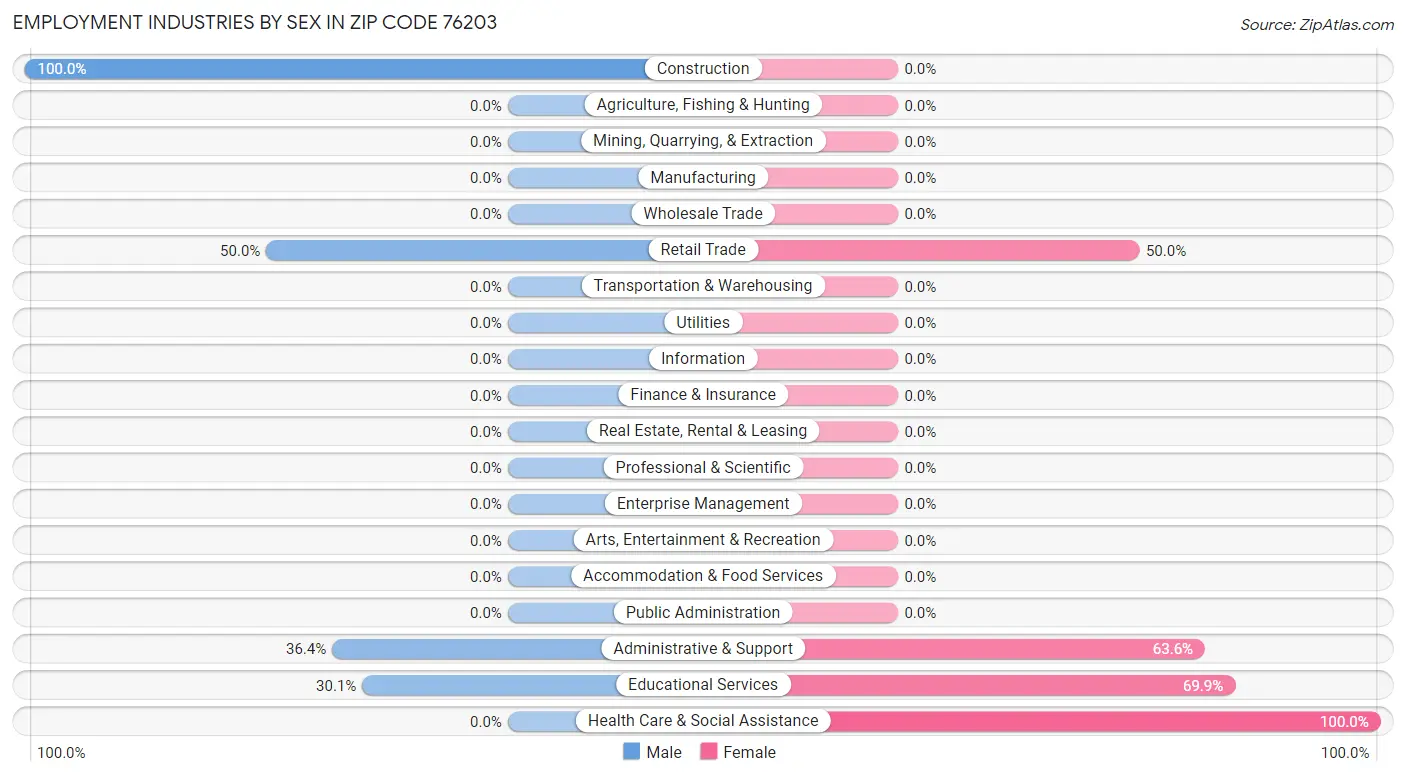
Employment Industries by Sex in Zip Code 76203
The Zip Code 76203 industries that see more men than women are Construction (100.0%), Retail Trade (50.0%), and Administrative & Support (36.4%), whereas the industries that tend to have a higher number of women are Health Care & Social Assistance (100.0%), Educational Services (69.9%), and Administrative & Support (63.6%).
Industry
Male
Female
Agriculture, Fishing & Hunting
0 (0.0%)
0 (0.0%)
Mining, Quarrying, & Extraction
0 (0.0%)
0 (0.0%)
Construction
33 (100.0%)
0 (0.0%)
Manufacturing
0 (0.0%)
0 (0.0%)
Wholesale Trade
0 (0.0%)
0 (0.0%)
Retail Trade
15 (50.0%)
15 (50.0%)
Transportation & Warehousing
0 (0.0%)
0 (0.0%)
Utilities
0 (0.0%)
0 (0.0%)
Information
0 (0.0%)
0 (0.0%)
Finance & Insurance
0 (0.0%)
0 (0.0%)
Real Estate, Rental & Leasing
0 (0.0%)
0 (0.0%)
Professional & Scientific
0 (0.0%)
0 (0.0%)
Enterprise Management
0 (0.0%)
0 (0.0%)
Administrative & Support
8 (36.4%)
14 (63.6%)
Educational Services
47 (30.1%)
109 (69.9%)
Health Care & Social Assistance
0 (0.0%)
89 (100.0%)
Arts, Entertainment & Recreation
0 (0.0%)
0 (0.0%)
Accommodation & Food Services
0 (0.0%)
0 (0.0%)
Public Administration
0 (0.0%)
0 (0.0%)
Total
103 (31.2%)
227 (68.8%)
Education in Zip Code 76203
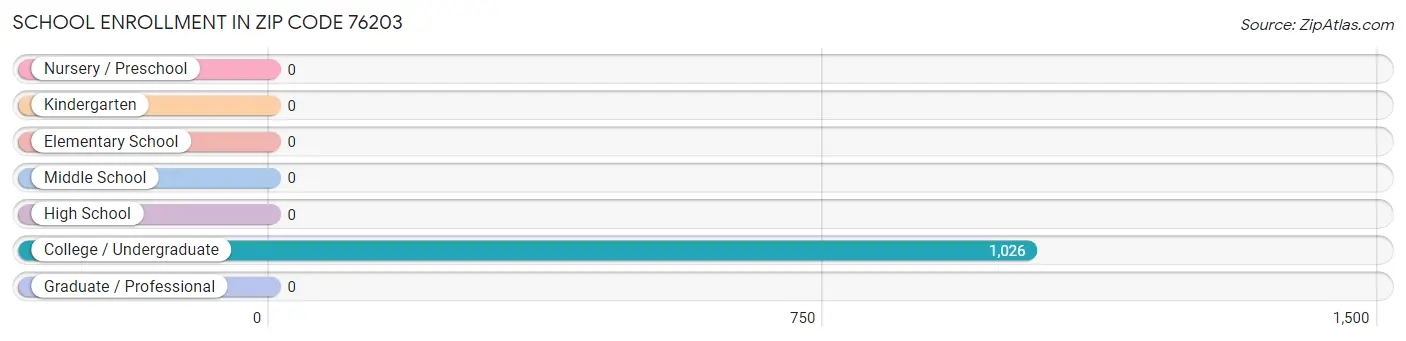
School Enrollment in Zip Code 76203
School Level
# Students
% Students
Nursery / Preschool
0
0.0%
Kindergarten
0
0.0%
Elementary School
0
0.0%
Middle School
0
0.0%
High School
0
0.0%
College / Undergraduate
1,026
100.0%
Graduate / Professional
0
0.0%
Total
1,026
100.0%
School Enrollment by Age by Funding Source in Zip Code 76203
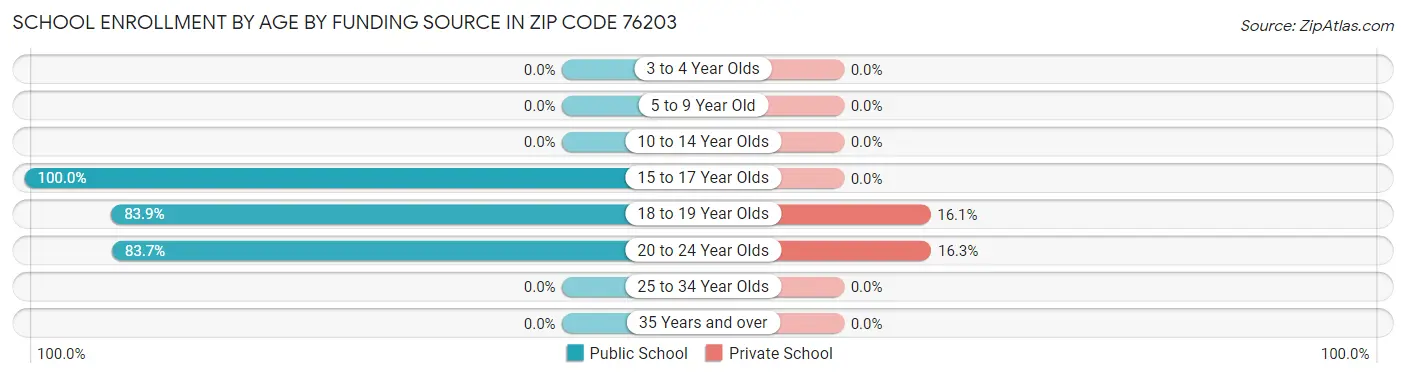
Out of a total of 1,026 students who are enrolled in schools in Zip Code 76203, 98 (9.6%) attend a private institution, while the remaining 928 (90.4%) are enrolled in public schools. The age group of 20 to 24 year olds has the highest likelihood of being enrolled in private schools, with 27 (16.3% in the age bracket) enrolled. Conversely, the age group of 15 to 17 year olds has the lowest likelihood of being enrolled in a private school, with 414 (100.0% in the age bracket) attending a public institution.
Age Bracket
Public School
Private School
3 to 4 Year Olds
0 (0.0%)
0 (0.0%)
5 to 9 Year Old
0 (0.0%)
0 (0.0%)
10 to 14 Year Olds
0 (0.0%)
0 (0.0%)
15 to 17 Year Olds
414 (100.0%)
0 (0.0%)
18 to 19 Year Olds
374 (83.9%)
72 (16.1%)
20 to 24 Year Olds
139 (83.7%)
27 (16.3%)
25 to 34 Year Olds
0 (0.0%)
0 (0.0%)
35 Years and over
0 (0.0%)
0 (0.0%)
Total
928 (90.4%)
98 (9.6%)
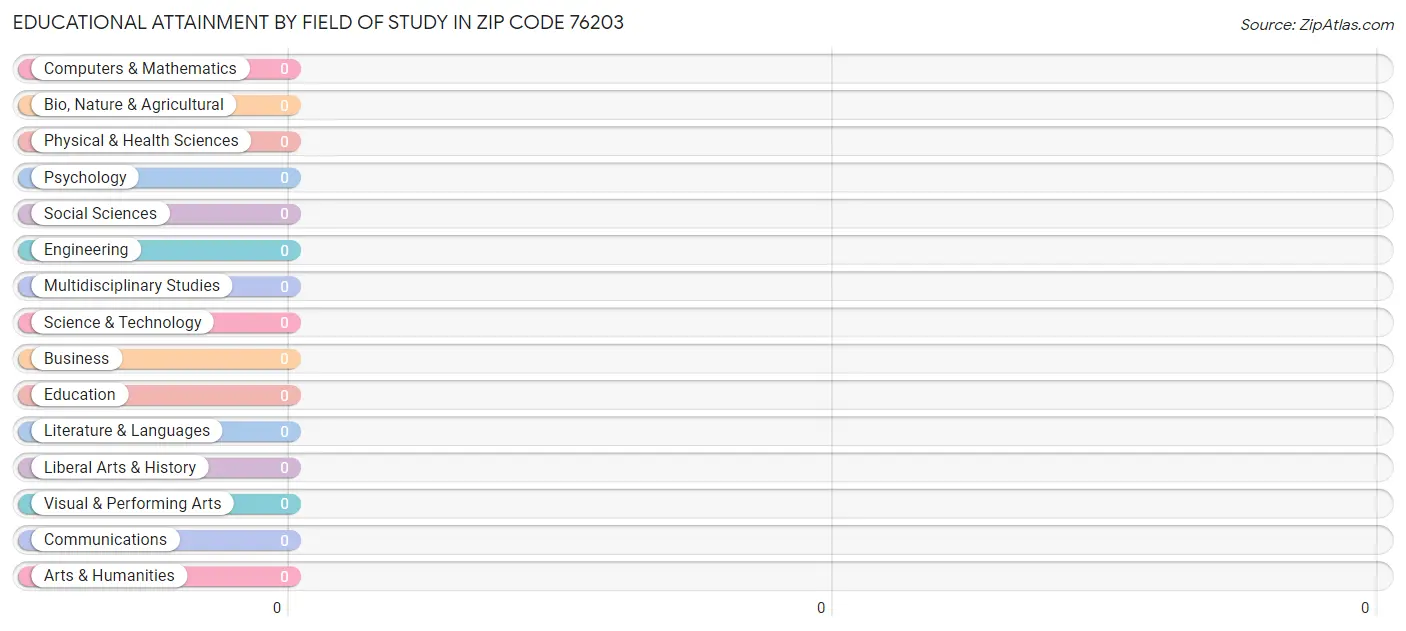
Educational Attainment by Field of Study in Zip Code 76203
Field of Study
# Graduates
% Graduates
Computers & Mathematics
0
0.0%
Bio, Nature & Agricultural
0
0.0%
Physical & Health Sciences
0
0.0%
Psychology
0
0.0%
Social Sciences
0
0.0%
Engineering
0
0.0%
Multidisciplinary Studies
0
0.0%
Science & Technology
0
0.0%
Business
0
0.0%
Education
0
0.0%
Literature & Languages
0
0.0%
Liberal Arts & History
0
0.0%
Visual & Performing Arts
0
0.0%
Communications
0
0.0%
Arts & Humanities
0
0.0%
Total
0
0.0%
Transportation & Commute in Zip Code 76203
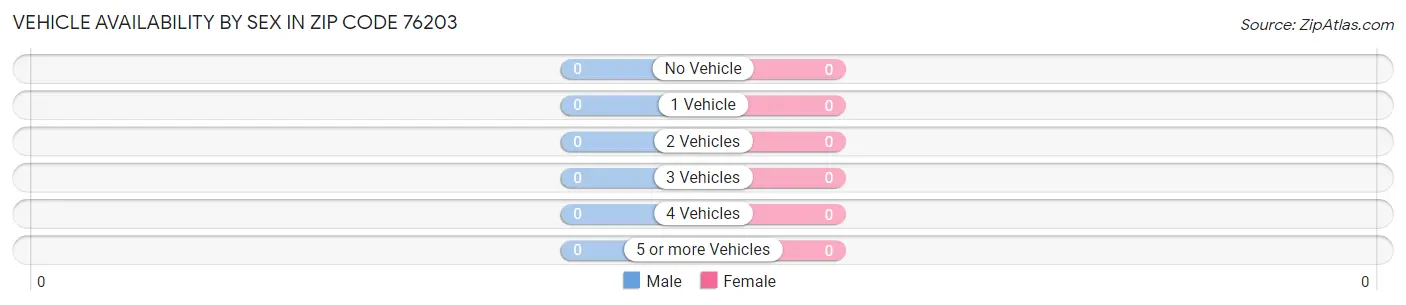
Vehicle Availability by Sex in Zip Code 76203
Vehicles Available
Male
Female
No Vehicle
0 (0.0%)
0 (0.0%)
1 Vehicle
0 (0.0%)
0 (0.0%)
2 Vehicles
0 (0.0%)
0 (0.0%)
3 Vehicles
0 (0.0%)
0 (0.0%)
4 Vehicles
0 (0.0%)
0 (0.0%)
5 or more Vehicles
0 (0.0%)
0 (0.0%)
Total
0 (0.0%)
0 (0.0%)
Commute Time in Zip Code 76203
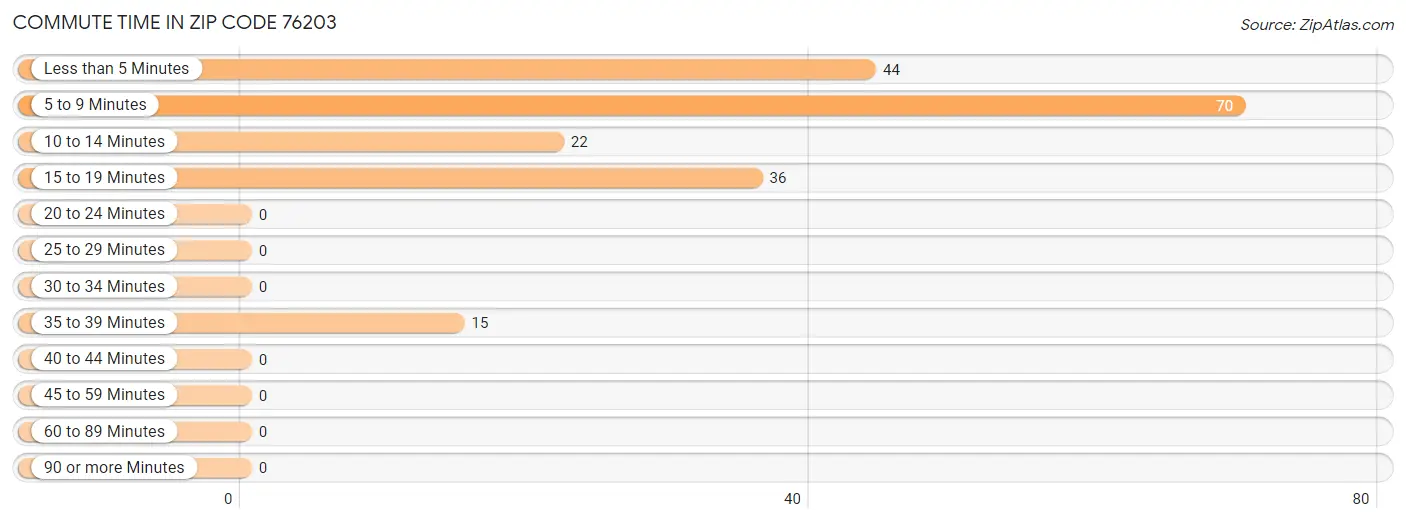
The most frequently occuring commute durations in Zip Code 76203 are 5 to 9 minutes (70 commuters, 37.4%), less than 5 minutes (44 commuters, 23.5%), and 15 to 19 minutes (36 commuters, 19.3%).
Commute Time
# Commuters
% Commuters
Less than 5 Minutes
44
23.5%
5 to 9 Minutes
70
37.4%
10 to 14 Minutes
22
11.8%
15 to 19 Minutes
36
19.3%
20 to 24 Minutes
0
0.0%
25 to 29 Minutes
0
0.0%
30 to 34 Minutes
0
0.0%
35 to 39 Minutes
15
8.0%
40 to 44 Minutes
0
0.0%
45 to 59 Minutes
0
0.0%
60 to 89 Minutes
0
0.0%
90 or more Minutes
0
0.0%
Commute Time by Sex in Zip Code 76203
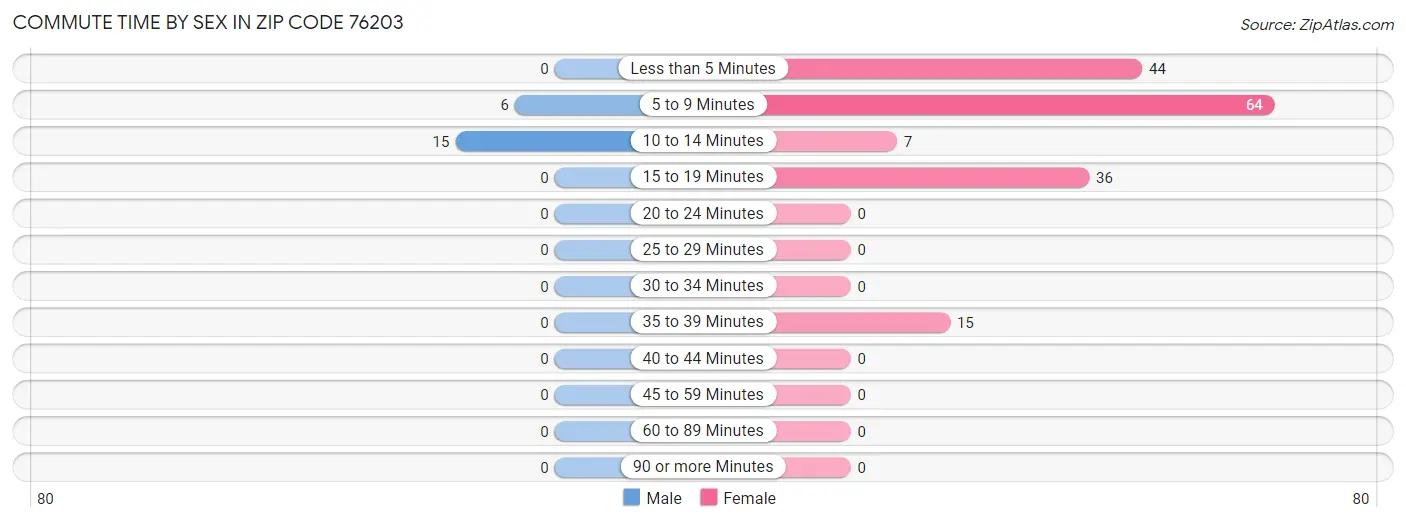
The most common commute times in Zip Code 76203 are 10 to 14 minutes (15 commuters, 71.4%) for males and 5 to 9 minutes (64 commuters, 38.6%) for females.
Commute Time
Male
Female
Less than 5 Minutes
0 (0.0%)
44 (26.5%)
5 to 9 Minutes
6 (28.6%)
64 (38.6%)
10 to 14 Minutes
15 (71.4%)
7 (4.2%)
15 to 19 Minutes
0 (0.0%)
36 (21.7%)
20 to 24 Minutes
0 (0.0%)
0 (0.0%)
25 to 29 Minutes
0 (0.0%)
0 (0.0%)
30 to 34 Minutes
0 (0.0%)
0 (0.0%)
35 to 39 Minutes
0 (0.0%)
15 (9.0%)
40 to 44 Minutes
0 (0.0%)
0 (0.0%)
45 to 59 Minutes
0 (0.0%)
0 (0.0%)
60 to 89 Minutes
0 (0.0%)
0 (0.0%)
90 or more Minutes
0 (0.0%)
0 (0.0%)
Time of Departure to Work by Sex in Zip Code 76203
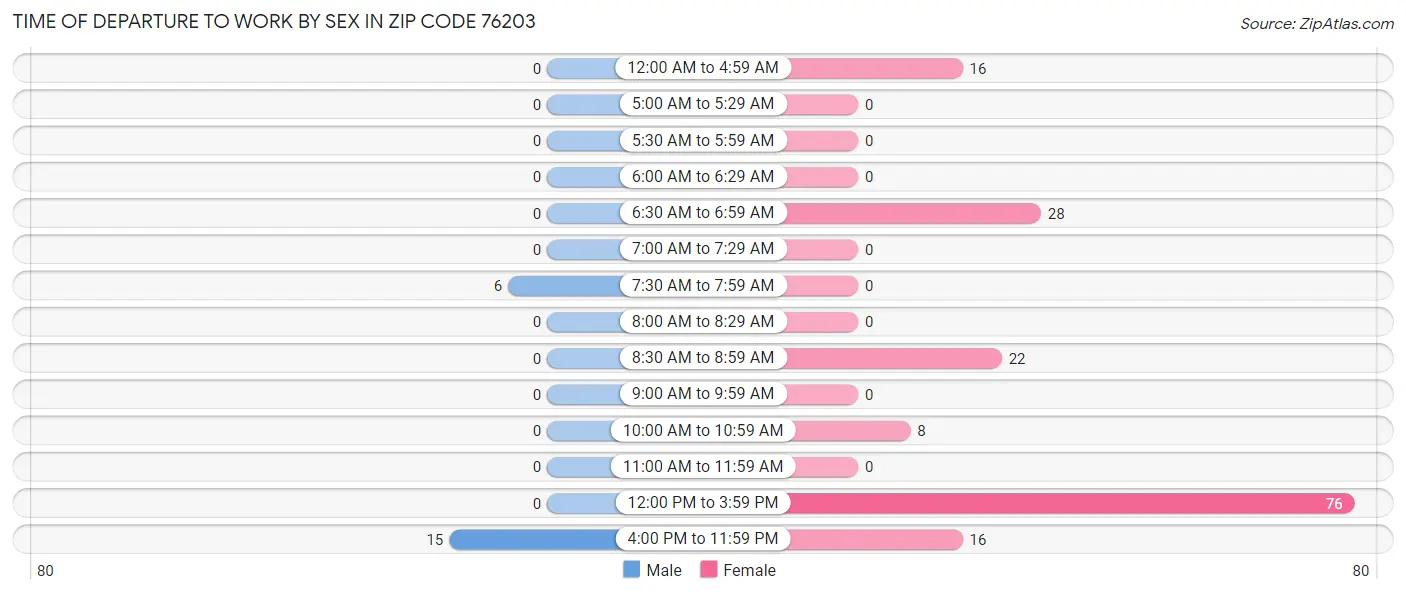
The most frequent times of departure to work in Zip Code 76203 are 4:00 PM to 11:59 PM (15, 71.4%) for males and 12:00 PM to 3:59 PM (76, 45.8%) for females.
Time of Departure
Male
Female
12:00 AM to 4:59 AM
0 (0.0%)
16 (9.6%)
5:00 AM to 5:29 AM
0 (0.0%)
0 (0.0%)
5:30 AM to 5:59 AM
0 (0.0%)
0 (0.0%)
6:00 AM to 6:29 AM
0 (0.0%)
0 (0.0%)
6:30 AM to 6:59 AM
0 (0.0%)
28 (16.9%)
7:00 AM to 7:29 AM
0 (0.0%)
0 (0.0%)
7:30 AM to 7:59 AM
6 (28.6%)
0 (0.0%)
8:00 AM to 8:29 AM
0 (0.0%)
0 (0.0%)
8:30 AM to 8:59 AM
0 (0.0%)
22 (13.3%)
9:00 AM to 9:59 AM
0 (0.0%)
0 (0.0%)
10:00 AM to 10:59 AM
0 (0.0%)
8 (4.8%)
11:00 AM to 11:59 AM
0 (0.0%)
0 (0.0%)
12:00 PM to 3:59 PM
0 (0.0%)
76 (45.8%)
4:00 PM to 11:59 PM
15 (71.4%)
16 (9.6%)
Total
21 (100.0%)
166 (100.0%)
Housing Occupancy in Zip Code 76203
Occupancy by Ownership in Zip Code 76203
Occupancy
# Housing Units
% Housing Units
Owner Occupied Housing Units
0
0.0%
Renter-Occupied Housing Units
0
0.0%
Total Occupied Housing Units
0
0.0%
Occupancy by Household Size in Zip Code 76203
Household Size
# Housing Units
% Housing Units
1-Person Household
0
0.0%
2-Person Household
0
0.0%
3-Person Household
0
0.0%
4+ Person Household
0
0.0%
Total Housing Units
0
0.0%
Occupancy by Ownership by Household Size in Zip Code 76203
Household Size
Owner-occupied
Renter-occupied
1-Person Household
0 (0.0%)
0 (0.0%)
2-Person Household
0 (0.0%)
0 (0.0%)
3-Person Household
0 (0.0%)
0 (0.0%)
4+ Person Household
0 (0.0%)
0 (0.0%)
Total Housing Units
0 (0.0%)
0 (0.0%)
Occupancy by Educational Attainment in Zip Code 76203
Household Size
Owner-occupied
Renter-occupied
Less than High School
0 (0.0%)
0 (0.0%)
High School Diploma
0 (0.0%)
0 (0.0%)
College/Associate Degree
0 (0.0%)
0 (0.0%)
Bachelor's Degree or higher
0 (0.0%)
0 (0.0%)
Occupancy by Age of Householder in Zip Code 76203
Age Bracket
# Households
% Households
Under 35 Years
0
0.0%
35 to 44 Years
0
0.0%
45 to 54 Years
0
0.0%
55 to 64 Years
0
0.0%
65 to 74 Years
0
0.0%
75 to 84 Years
0
0.0%
85 Years and Over
0
0.0%
Total
0
0.0%
Housing Finances in Zip Code 76203
Median Income by Occupancy in Zip Code 76203
Occupancy Type
# Households
Median Income
Owner-Occupied
0 (0.0%)
$0
Renter-Occupied
0 (0.0%)
$0
Average
0 (0.0%)
$0
Occupancy by Householder Income Bracket in Zip Code 76203
Income Bracket
Owner-occupied
Renter-occupied
Less than $5,000
0 (0.0%)
0 (0.0%)
$5,000 to $9,999
0 (0.0%)
0 (0.0%)
$10,000 to $14,999
0 (0.0%)
0 (0.0%)
$15,000 to $19,999
0 (0.0%)
0 (0.0%)
$20,000 to $24,999
0 (0.0%)
0 (0.0%)
$25,000 to $34,999
0 (0.0%)
0 (0.0%)
$35,000 to $49,999
0 (0.0%)
0 (0.0%)
$50,000 to $74,999
0 (0.0%)
0 (0.0%)
$75,000 to $99,999
0 (0.0%)
0 (0.0%)
$100,000 to $149,999
0 (0.0%)
0 (0.0%)
$150,000 or more
0 (0.0%)
0 (0.0%)
Total
0 (0.0%)
0 (0.0%)
Monthly Housing Cost Tiers in Zip Code 76203
Monthly Cost
Owner-occupied
Renter-occupied
Less than $300
0 (0.0%)
0 (0.0%)
$300 to $499
0 (0.0%)
0 (0.0%)
$500 to $799
0 (0.0%)
0 (0.0%)
$800 to $999
0 (0.0%)
0 (0.0%)
$1,000 to $1,499
0 (0.0%)
0 (0.0%)
$1,500 to $1,999
0 (0.0%)
0 (0.0%)
$2,000 to $2,499
0 (0.0%)
0 (0.0%)
$2,500 to $2,999
0 (0.0%)
0 (0.0%)
$3,000 or more
0 (0.0%)
0 (0.0%)
Total
0 (0.0%)
0 (0.0%)
Physical Housing Characteristics in Zip Code 76203
Housing Structures in Zip Code 76203
Structure Type
# Housing Units
% Housing Units
Single Unit, Detached
0
0.0%
Single Unit, Attached
0
0.0%
2 Unit Apartments
0
0.0%
3 or 4 Unit Apartments
0
0.0%
5 to 9 Unit Apartments
0
0.0%
10 or more Apartments
0
0.0%
Mobile Home / Other
0
0.0%
Total
0
0.0%
Housing Structures by Occupancy in Zip Code 76203
Structure Type
Owner-occupied
Renter-occupied
Single Unit, Detached
0 (0.0%)
0 (0.0%)
Single Unit, Attached
0 (0.0%)
0 (0.0%)
2 Unit Apartments
0 (0.0%)
0 (0.0%)
3 or 4 Unit Apartments
0 (0.0%)
0 (0.0%)
5 to 9 Unit Apartments
0 (0.0%)
0 (0.0%)
10 or more Apartments
0 (0.0%)
0 (0.0%)
Mobile Home / Other
0 (0.0%)
0 (0.0%)
Total
0 (0.0%)
0 (0.0%)
Housing Structures by Number of Rooms in Zip Code 76203
Number of Rooms
Owner-occupied
Renter-occupied
1 Room
0 (0.0%)
0 (0.0%)
2 or 3 Rooms
0 (0.0%)
0 (0.0%)
4 or 5 Rooms
0 (0.0%)
0 (0.0%)
6 or 7 Rooms
0 (0.0%)
0 (0.0%)
8 or more Rooms
0 (0.0%)
0 (0.0%)
Total
0 (0.0%)
0 (0.0%)
Housing Structure by Heating Type in Zip Code 76203
Heating Type
Owner-occupied
Renter-occupied
Utility Gas
0 (0.0%)
0 (0.0%)
Bottled, Tank, or LP Gas
0 (0.0%)
0 (0.0%)
Electricity
0 (0.0%)
0 (0.0%)
Fuel Oil or Kerosene
0 (0.0%)
0 (0.0%)
Coal or Coke
0 (0.0%)
0 (0.0%)
All other Fuels
0 (0.0%)
0 (0.0%)
No Fuel Used
0 (0.0%)
0 (0.0%)
Total
0 (0.0%)
0 (0.0%)
Household Vehicle Usage in Zip Code 76203
Vehicles per Household
Owner-occupied
Renter-occupied
No Vehicle
0 (0.0%)
0 (0.0%)
1 Vehicle
0 (0.0%)
0 (0.0%)
2 Vehicles
0 (0.0%)
0 (0.0%)
3 or more Vehicles
0 (0.0%)
0 (0.0%)
Total
0 (0.0%)
0 (0.0%)
Real Estate & Mortgages in Zip Code 76203
Real Estate and Mortgage Overview in Zip Code 76203
Characteristic
Without Mortgage
With Mortgage
Housing Units
0
0
Median Property Value
-
-
Median Household Income
-
-
Monthly Housing Costs
-
-
Real Estate Taxes
-
-
Property Value by Mortgage Status in Zip Code 76203
Property Value
Without Mortgage
With Mortgage
Less than $50,000
0 (0.0%)
0 (0.0%)
$50,000 to $99,999
0 (0.0%)
0 (0.0%)
$100,000 to $299,999
0 (0.0%)
0 (0.0%)
$300,000 to $499,999
0 (0.0%)
0 (0.0%)
$500,000 to $749,999
0 (0.0%)
0 (0.0%)
$750,000 to $999,999
0 (0.0%)
0 (0.0%)
$1,000,000 or more
0 (0.0%)
0 (0.0%)
Total
0 (0.0%)
0 (0.0%)
Household Income by Mortgage Status in Zip Code 76203
Household Income
Without Mortgage
With Mortgage
Less than $10,000
0 (0.0%)
0 (0.0%)
$10,000 to $24,999
0 (0.0%)
0 (0.0%)
$25,000 to $34,999
0 (0.0%)
0 (0.0%)
$35,000 to $49,999
0 (0.0%)
0 (0.0%)
$50,000 to $74,999
0 (0.0%)
0 (0.0%)
$75,000 to $99,999
0 (0.0%)
0 (0.0%)
$100,000 to $149,999
0 (0.0%)
0 (0.0%)
$150,000 or more
0 (0.0%)
0 (0.0%)
Total
0 (0.0%)
0 (0.0%)
Property Value to Household Income Ratio in Zip Code 76203
Value-to-Income Ratio
Without Mortgage
With Mortgage
Less than 2.0x
0 (0.0%)
0 (0.0%)
2.0x to 2.9x
0 (0.0%)
0 (0.0%)
3.0x to 3.9x
0 (0.0%)
0 (0.0%)
4.0x or more
0 (0.0%)
0 (0.0%)
Total
0 (0.0%)
0 (0.0%)
Real Estate Taxes by Mortgage Status in Zip Code 76203
Property Taxes
Without Mortgage
With Mortgage
Less than $800
0 (0.0%)
0 (0.0%)
$800 to $1,499
0 (0.0%)
0 (0.0%)
$800 to $1,499
0 (0.0%)
0 (0.0%)
Total
0 (0.0%)
0 (0.0%)
Health & Disability in Zip Code 76203
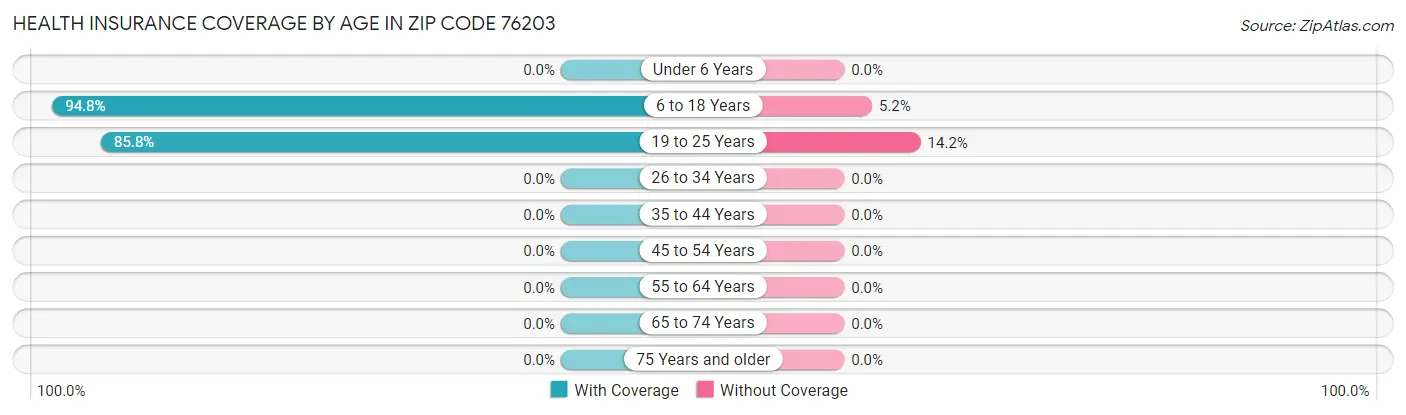
Health Insurance Coverage by Age in Zip Code 76203
Age Bracket
With Coverage
Without Coverage
Under 6 Years
0 (0.0%)
0 (0.0%)
6 to 18 Years
660 (94.8%)
36 (5.2%)
19 to 25 Years
283 (85.8%)
47 (14.2%)
26 to 34 Years
0 (0.0%)
0 (0.0%)
35 to 44 Years
0 (0.0%)
0 (0.0%)
45 to 54 Years
0 (0.0%)
0 (0.0%)
55 to 64 Years
0 (0.0%)
0 (0.0%)
65 to 74 Years
0 (0.0%)
0 (0.0%)
75 Years and older
0 (0.0%)
0 (0.0%)
Total
943 (91.9%)
83 (8.1%)
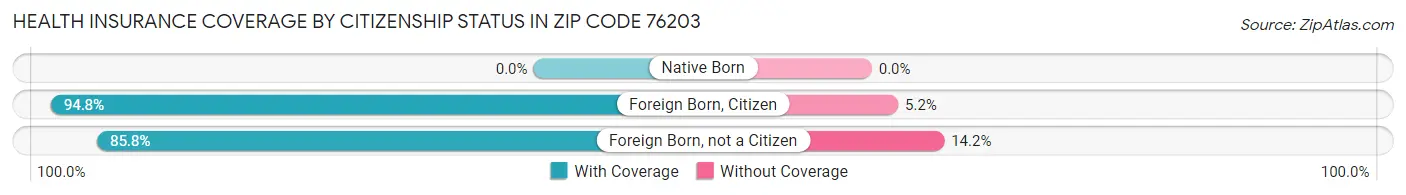
Health Insurance Coverage by Citizenship Status in Zip Code 76203
Citizenship Status
With Coverage
Without Coverage
Native Born
0 (0.0%)
0 (0.0%)
Foreign Born, Citizen
660 (94.8%)
36 (5.2%)
Foreign Born, not a Citizen
283 (85.8%)
47 (14.2%)
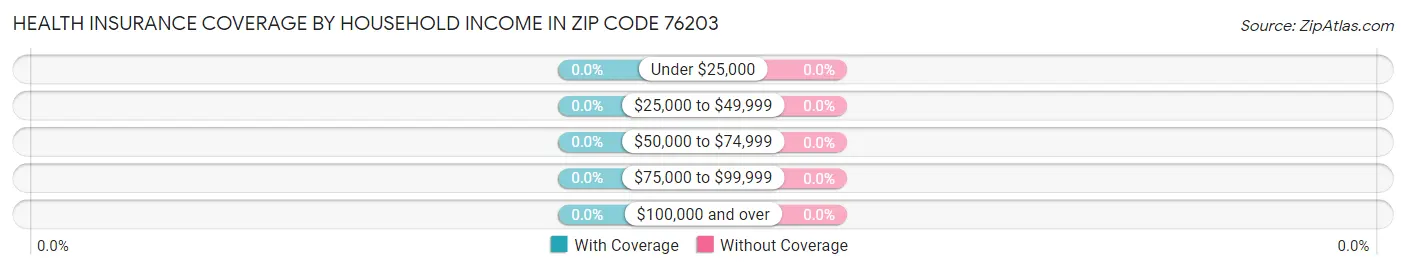
Health Insurance Coverage by Household Income in Zip Code 76203
Household Income
With Coverage
Without Coverage
Under $25,000
0 (0.0%)
0 (0.0%)
$25,000 to $49,999
0 (0.0%)
0 (0.0%)
$50,000 to $74,999
0 (0.0%)
0 (0.0%)
$75,000 to $99,999
0 (0.0%)
0 (0.0%)
$100,000 and over
0 (0.0%)
0 (0.0%)
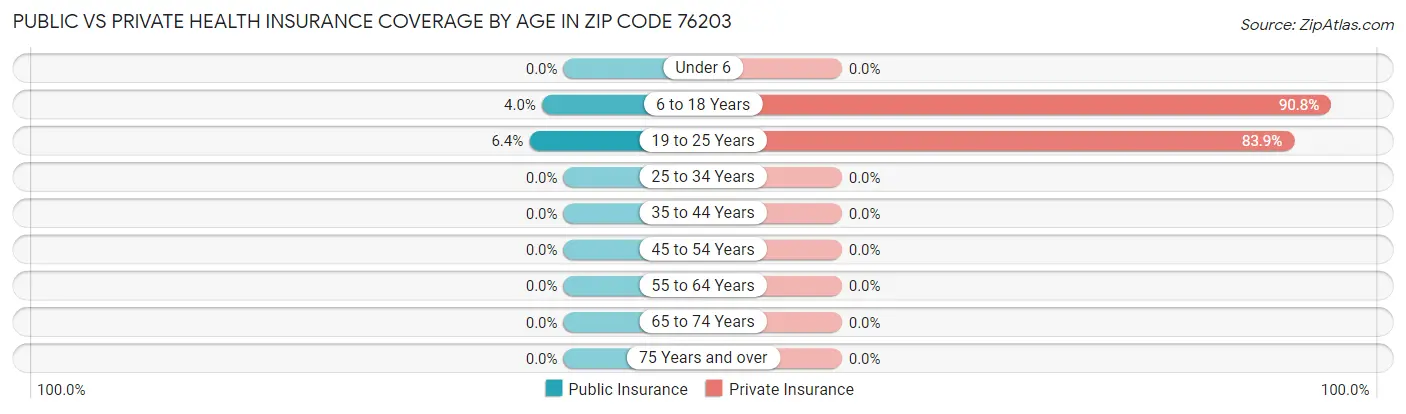
Public vs Private Health Insurance Coverage by Age in Zip Code 76203
Age Bracket
Public Insurance
Private Insurance
Under 6
0 (0.0%)
0 (0.0%)
6 to 18 Years
28 (4.0%)
632 (90.8%)
19 to 25 Years
21 (6.4%)
277 (83.9%)
25 to 34 Years
0 (0.0%)
0 (0.0%)
35 to 44 Years
0 (0.0%)
0 (0.0%)
45 to 54 Years
0 (0.0%)
0 (0.0%)
55 to 64 Years
0 (0.0%)
0 (0.0%)
65 to 74 Years
0 (0.0%)
0 (0.0%)
75 Years and over
0 (0.0%)
0 (0.0%)
Total
49 (4.8%)
909 (88.6%)
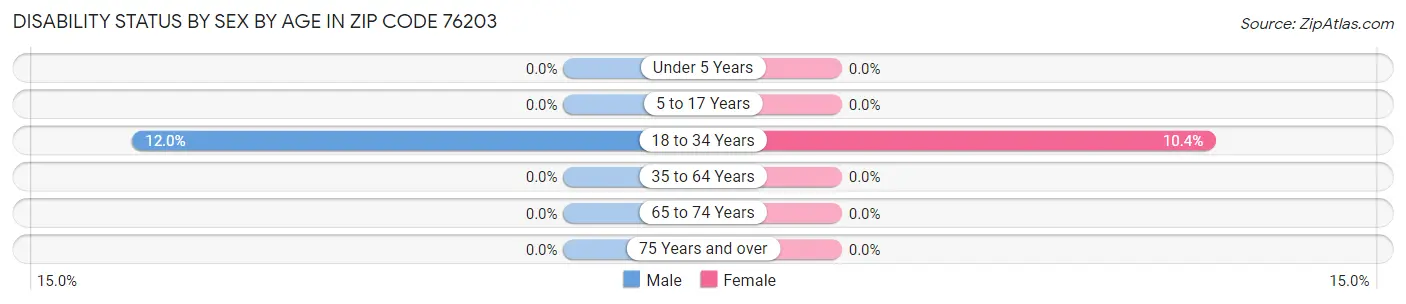
Disability Status by Sex by Age in Zip Code 76203
Age Bracket
Male
Female
Under 5 Years
0 (0.0%)
0 (0.0%)
5 to 17 Years
0 (0.0%)
0 (0.0%)
18 to 34 Years
33 (12.0%)
35 (10.4%)
35 to 64 Years
0 (0.0%)
0 (0.0%)
65 to 74 Years
0 (0.0%)
0 (0.0%)
75 Years and over
0 (0.0%)
0 (0.0%)
Disability Class by Sex by Age in Zip Code 76203
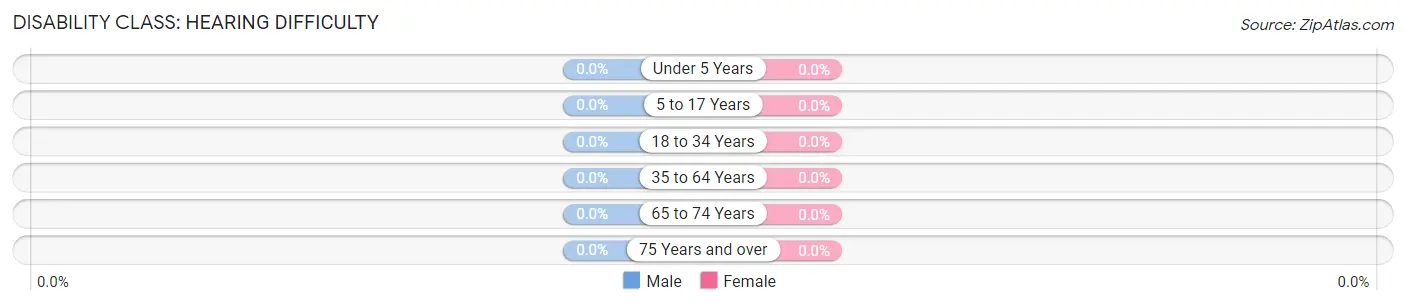
Disability Class: Hearing Difficulty
Age Bracket
Male
Female
Under 5 Years
0 (0.0%)
0 (0.0%)
5 to 17 Years
0 (0.0%)
0 (0.0%)
18 to 34 Years
0 (0.0%)
0 (0.0%)
35 to 64 Years
0 (0.0%)
0 (0.0%)
65 to 74 Years
0 (0.0%)
0 (0.0%)
75 Years and over
0 (0.0%)
0 (0.0%)
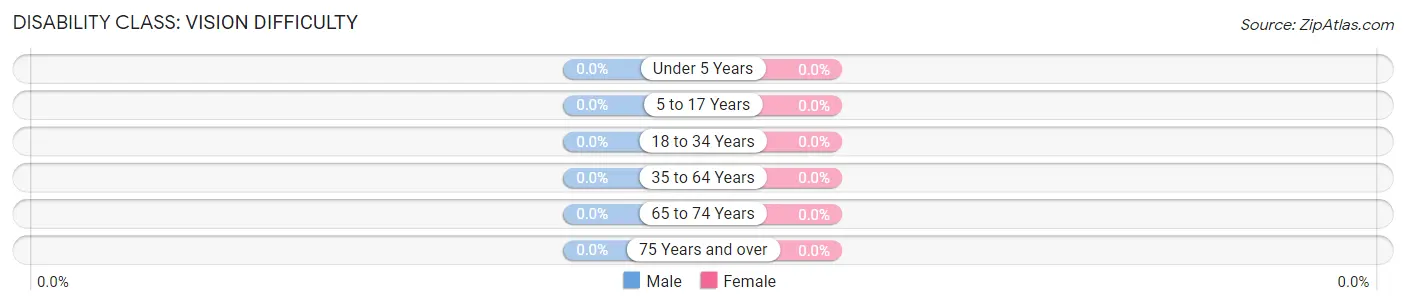
Disability Class: Vision Difficulty
Age Bracket
Male
Female
Under 5 Years
0 (0.0%)
0 (0.0%)
5 to 17 Years
0 (0.0%)
0 (0.0%)
18 to 34 Years
0 (0.0%)
0 (0.0%)
35 to 64 Years
0 (0.0%)
0 (0.0%)
65 to 74 Years
0 (0.0%)
0 (0.0%)
75 Years and over
0 (0.0%)
0 (0.0%)
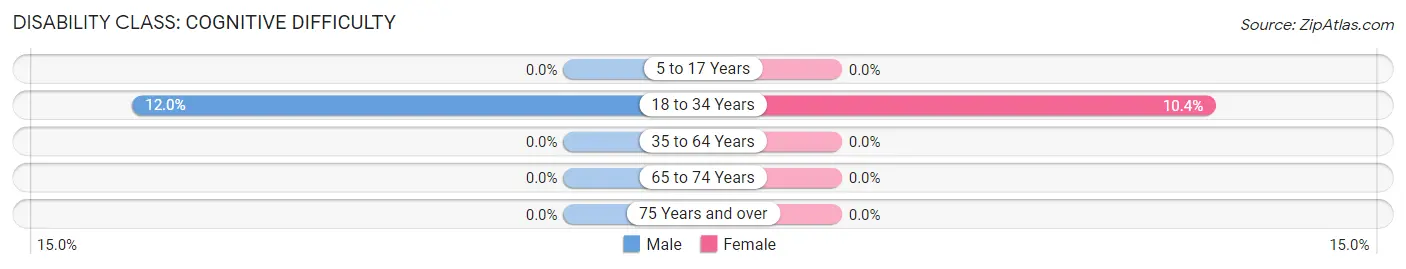
Disability Class: Cognitive Difficulty
Age Bracket
Male
Female
5 to 17 Years
0 (0.0%)
0 (0.0%)
18 to 34 Years
33 (12.0%)
35 (10.4%)
35 to 64 Years
0 (0.0%)
0 (0.0%)
65 to 74 Years
0 (0.0%)
0 (0.0%)
75 Years and over
0 (0.0%)
0 (0.0%)
Disability Class: Ambulatory Difficulty
Age Bracket
Male
Female
5 to 17 Years
0 (0.0%)
0 (0.0%)
18 to 34 Years
0 (0.0%)
0 (0.0%)
35 to 64 Years
0 (0.0%)
0 (0.0%)
65 to 74 Years
0 (0.0%)
0 (0.0%)
75 Years and over
0 (0.0%)
0 (0.0%)
Disability Class: Self-Care Difficulty
Age Bracket
Male
Female
5 to 17 Years
0 (0.0%)
0 (0.0%)
18 to 34 Years
0 (0.0%)
0 (0.0%)
35 to 64 Years
0 (0.0%)
0 (0.0%)
65 to 74 Years
0 (0.0%)
0 (0.0%)
75 Years and over
0 (0.0%)
0 (0.0%)
Technology Access in Zip Code 76203
Computing Device Access in Zip Code 76203
Device Type
# Households
% Households
Desktop or Laptop
0
0.0%
Smartphone
0
0.0%
Tablet
0
0.0%
No Computing Device
0
0.0%
Total
0
0.0%
Internet Access in Zip Code 76203
Internet Type
# Households
% Households
Dial-Up Internet
0
0.0%
Broadband Home
0
0.0%
Cellular Data Only
0
0.0%
Satellite Internet
0
0.0%
No Internet
0
0.0%
Total
0
0.0%
Common Questions
What is Per Capita Income in Zip Code 76203?
Per Capita income in Zip Code 76203 is $3,563.
What is Income or Wage Gap in Zip Code 76203?
Income or Wage Gap in Zip Code 76203 is 48.4%.
Women in Zip Code 76203 earn 51.6 cents for every dollar earned by a man.
What is the Total Population of Zip Code 76203?
Total Population of Zip Code 76203 is 1,026.
What is the Total Male Population of Zip Code 76203?
Total Male Population of Zip Code 76203 is 421.
What is the Total Female Population of Zip Code 76203?
Total Female Population of Zip Code 76203 is 605.
What is the Ratio of Males per 100 Females in Zip Code 76203?
There are 69.59 Males per 100 Females in Zip Code 76203.
What is the Ratio of Females per 100 Males in Zip Code 76203?
There are 143.71 Females per 100 Males in Zip Code 76203.
What is the Median Population Age in Zip Code 76203?
Median Population Age in Zip Code 76203 is 18.4 Years.
How Large is the Labor Force in Zip Code 76203?
There are 352 People in the Labor Forcein in Zip Code 76203.
What is the Percentage of People in the Labor Force in Zip Code 76203?
34.3% of People are in the Labor Force in Zip Code 76203.
What is the Unemployment Rate in Zip Code 76203?
Unemployment Rate in Zip Code 76203 is 6.3%.
Report Title
Report Link
HTML Copy & Paste Link
Social Media
Copy and paste the folowing code into any webpage where you would like this interactive chart to display