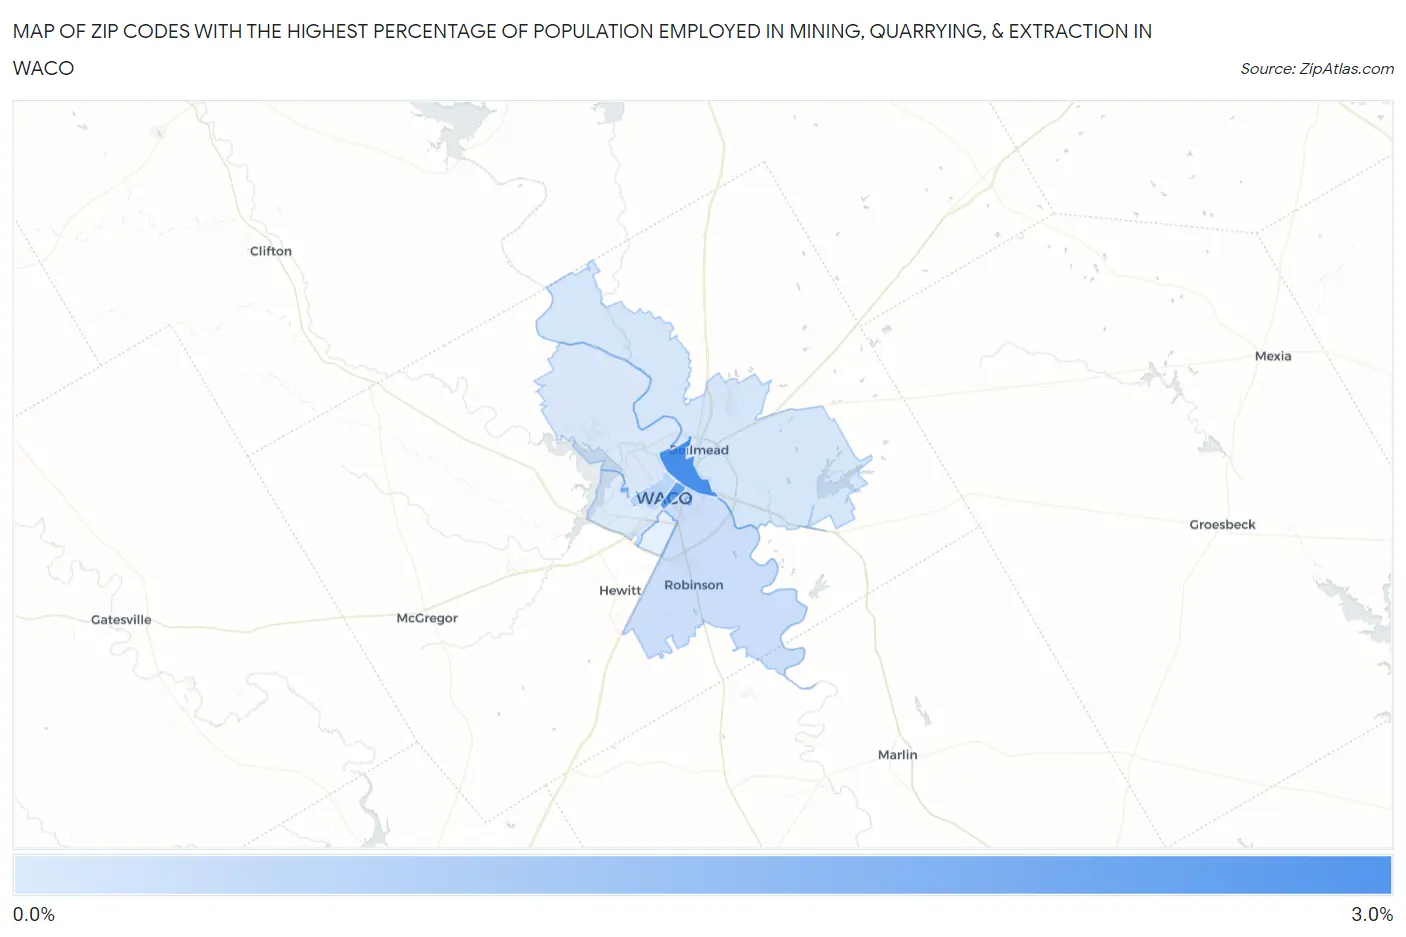
Zip Codes with the Highest Percentage of Population Employed in Mining, Quarrying, & Extraction in Waco, TX
RELATED REPORTS & OPTIONS
Mining, Quarrying, & Extraction
Waco
Compare Zip Codes
Map of Zip Codes with the Highest Percentage of Population Employed in Mining, Quarrying, & Extraction in Waco
0.076%
2.9%
Zip Codes with the Highest Percentage of Population Employed in Mining, Quarrying, & Extraction in Waco, TX
| Zip Code | % Employed | vs State | vs National | |
| 1. | 76704 | 2.9% | 1.9%(+1.05)#506 | 0.44%(+2.47)#2,805 |
| 2. | 76701 | 2.5% | 1.9%(+0.622)#570 | 0.44%(+2.04)#3,157 |
| 3. | 76707 | 0.71% | 1.9%(-1.15)#1,080 | 0.44%(+0.266)#6,312 |
| 4. | 76706 | 0.43% | 1.9%(-1.42)#1,250 | 0.44%(-0.006)#7,568 |
| 5. | 76705 | 0.21% | 1.9%(-1.65)#1,403 | 0.44%(-0.232)#9,434 |
| 6. | 76708 | 0.14% | 1.9%(-1.71)#1,437 | 0.44%(-0.298)#10,208 |
| 7. | 76710 | 0.076% | 1.9%(-1.78)#1,462 | 0.44%(-0.364)#11,212 |
1
Common Questions
What are the Top 5 Zip Codes with the Highest Percentage of Population Employed in Mining, Quarrying, & Extraction in Waco, TX?
Top 5 Zip Codes with the Highest Percentage of Population Employed in Mining, Quarrying, & Extraction in Waco, TX are:
What zip code has the Highest Percentage of Population Employed in Mining, Quarrying, & Extraction in Waco, TX?
76704 has the Highest Percentage of Population Employed in Mining, Quarrying, & Extraction in Waco, TX with 2.9%.
What is the Percentage of Population Employed in Mining, Quarrying, & Extraction in Waco, TX?
Percentage of Population Employed in Mining, Quarrying, & Extraction in Waco is 0.35%.
What is the Percentage of Population Employed in Mining, Quarrying, & Extraction in Texas?
Percentage of Population Employed in Mining, Quarrying, & Extraction in Texas is 1.9%.
What is the Percentage of Population Employed in Mining, Quarrying, & Extraction in the United States?
Percentage of Population Employed in Mining, Quarrying, & Extraction in the United States is 0.44%.