Texarkana, TX Map & Demographics
Texarkana Map
Texarkana Overview
$29,763
PER CAPITA INCOME
$69,379
AVG FAMILY INCOME
$48,054
AVG HOUSEHOLD INCOME
12.8%
WAGE / INCOME GAP [ % ]
87.2¢/ $1
WAGE / INCOME GAP [ $ ]
$11,826
FAMILY INCOME DEFICIT
0.53
INEQUALITY / GINI INDEX
36,156
TOTAL POPULATION
17,510
MALE POPULATION
18,646
FEMALE POPULATION
93.91
MALES / 100 FEMALES
106.49
FEMALES / 100 MALES
37.2
MEDIAN AGE
3.2
AVG FAMILY SIZE
2.4
AVG HOUSEHOLD SIZE
15,910
LABOR FORCE [ PEOPLE ]
55.9%
PERCENT IN LABOR FORCE
5.7%
UNEMPLOYMENT RATE
Income in Texarkana
Income Overview in Texarkana
Per Capita Income in Texarkana is $29,763, while median incomes of families and households are $69,379 and $48,054 respectively.
| Characteristic | Number | Measure |
| Per Capita Income | 36,156 | $29,763 |
| Median Family Income | 8,557 | $69,379 |
| Mean Family Income | 8,557 | $94,794 |
| Median Household Income | 14,295 | $48,054 |
| Mean Household Income | 14,295 | $73,625 |
| Income Deficit | 8,557 | $11,826 |
| Wage / Income Gap (%) | 36,156 | 12.82% |
| Wage / Income Gap ($) | 36,156 | 87.18¢ per $1 |
| Gini / Inequality Index | 36,156 | 0.53 |
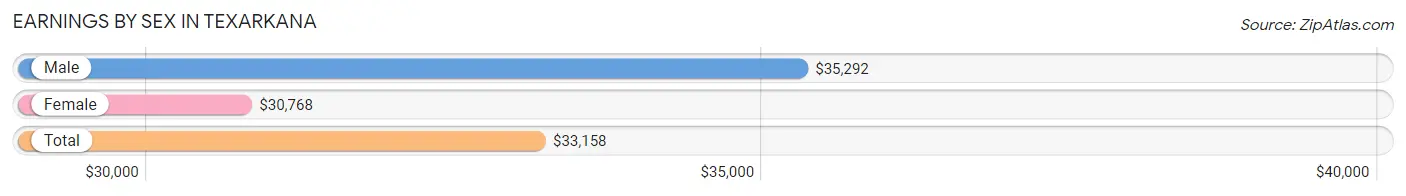
Earnings by Sex in Texarkana
Average Earnings in Texarkana are $33,158, $35,292 for men and $30,768 for women, a difference of 12.8%.
| Sex | Number | Average Earnings |
| Male | 8,335 (50.7%) | $35,292 |
| Female | 8,112 (49.3%) | $30,768 |
| Total | 16,447 (100.0%) | $33,158 |
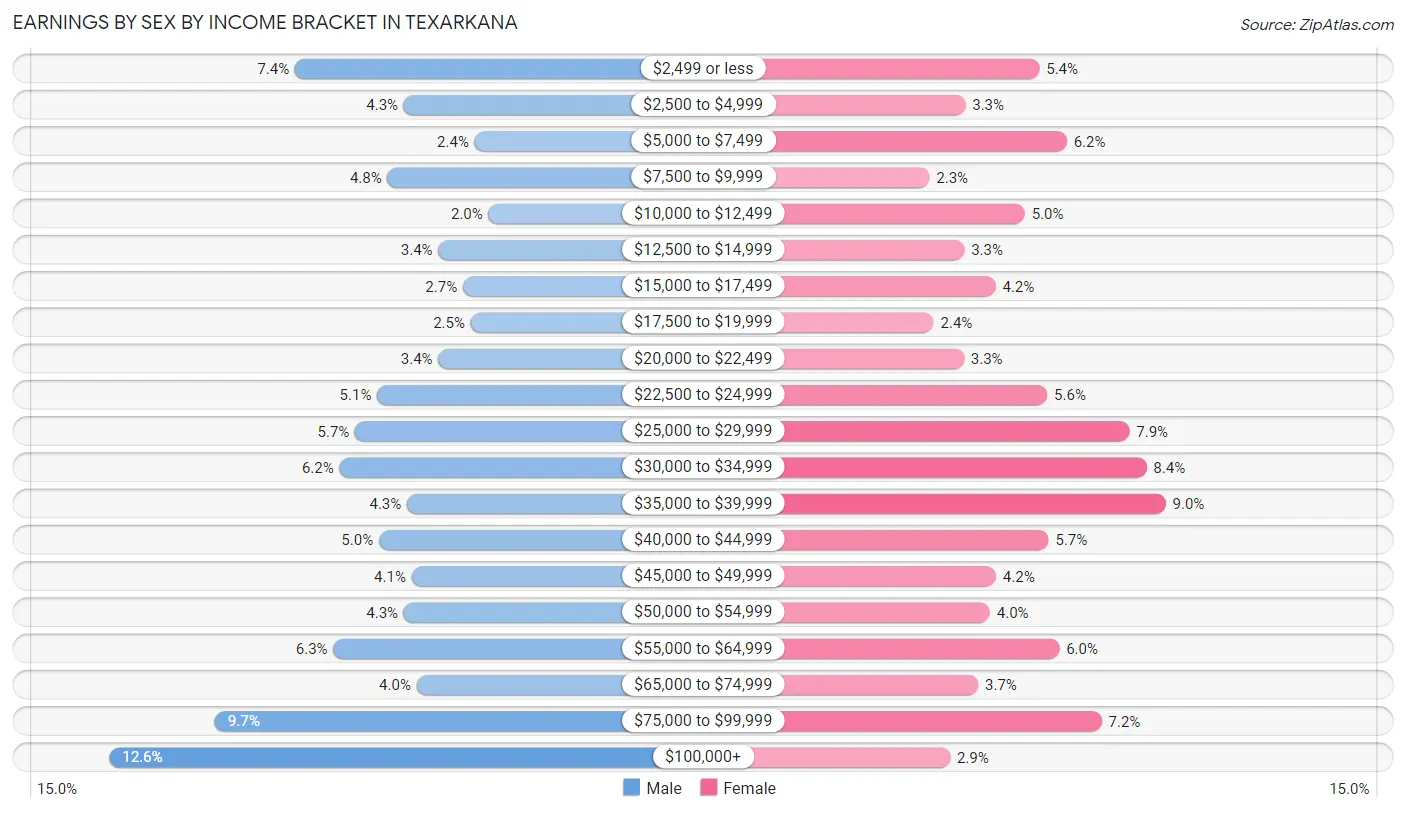
Earnings by Sex by Income Bracket in Texarkana
The most common earnings brackets in Texarkana are $100,000+ for men (1,052 | 12.6%) and $35,000 to $39,999 for women (727 | 9.0%).
| Income | Male | Female |
| $2,499 or less | 617 (7.4%) | 439 (5.4%) |
| $2,500 to $4,999 | 362 (4.3%) | 270 (3.3%) |
| $5,000 to $7,499 | 196 (2.4%) | 501 (6.2%) |
| $7,500 to $9,999 | 400 (4.8%) | 188 (2.3%) |
| $10,000 to $12,499 | 163 (2.0%) | 406 (5.0%) |
| $12,500 to $14,999 | 281 (3.4%) | 268 (3.3%) |
| $15,000 to $17,499 | 223 (2.7%) | 339 (4.2%) |
| $17,500 to $19,999 | 205 (2.5%) | 198 (2.4%) |
| $20,000 to $22,499 | 281 (3.4%) | 267 (3.3%) |
| $22,500 to $24,999 | 424 (5.1%) | 457 (5.6%) |
| $25,000 to $29,999 | 476 (5.7%) | 644 (7.9%) |
| $30,000 to $34,999 | 513 (6.1%) | 683 (8.4%) |
| $35,000 to $39,999 | 354 (4.3%) | 727 (9.0%) |
| $40,000 to $44,999 | 420 (5.0%) | 460 (5.7%) |
| $45,000 to $49,999 | 343 (4.1%) | 340 (4.2%) |
| $50,000 to $54,999 | 362 (4.3%) | 326 (4.0%) |
| $55,000 to $64,999 | 527 (6.3%) | 484 (6.0%) |
| $65,000 to $74,999 | 332 (4.0%) | 299 (3.7%) |
| $75,000 to $99,999 | 804 (9.7%) | 581 (7.2%) |
| $100,000+ | 1,052 (12.6%) | 235 (2.9%) |
| Total | 8,335 (100.0%) | 8,112 (100.0%) |
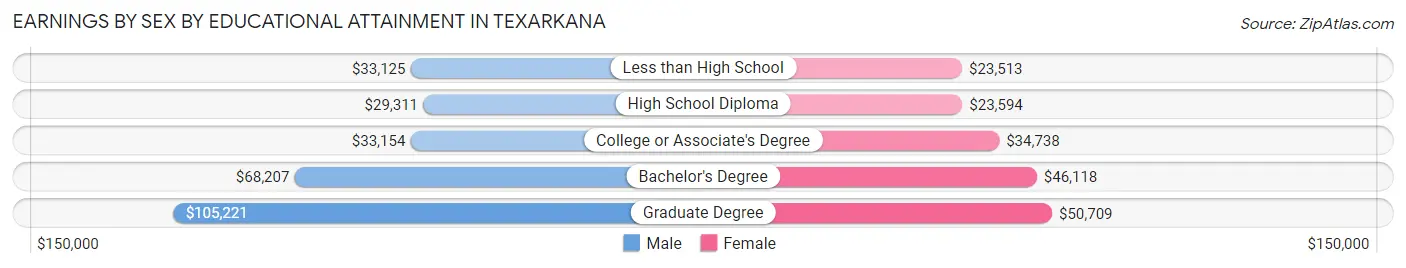
Earnings by Sex by Educational Attainment in Texarkana
Average earnings in Texarkana are $41,194 for men and $33,143 for women, a difference of 19.5%. Men with an educational attainment of graduate degree enjoy the highest average annual earnings of $105,221, while those with high school diploma education earn the least with $29,311. Women with an educational attainment of graduate degree earn the most with the average annual earnings of $50,709, while those with less than high school education have the smallest earnings of $23,513.
| Educational Attainment | Male Income | Female Income |
| Less than High School | $33,125 | $23,513 |
| High School Diploma | $29,311 | $23,594 |
| College or Associate's Degree | $33,154 | $34,738 |
| Bachelor's Degree | $68,207 | $46,118 |
| Graduate Degree | $105,221 | $50,709 |
| Total | $41,194 | $33,143 |
Family Income in Texarkana
Family Income Brackets in Texarkana
According to the Texarkana family income data, there are 1,455 families falling into the $50,000 to $74,999 income range, which is the most common income bracket and makes up 17.0% of all families. Conversely, the $10,000 to $14,999 income bracket is the least frequent group with only 163 families (1.9%) belonging to this category.
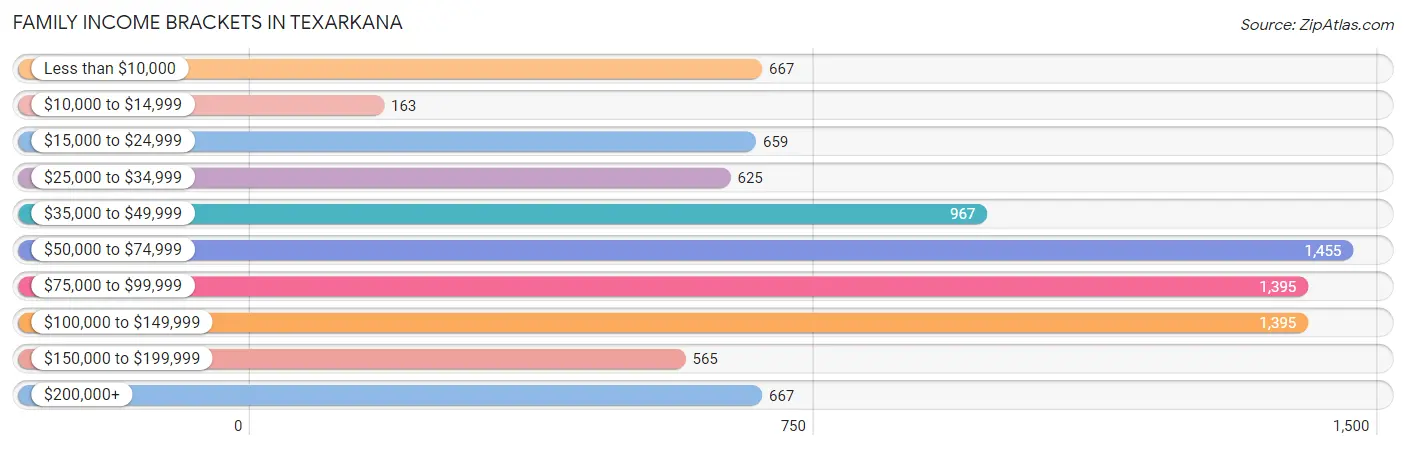
| Income Bracket | # Families | % Families |
| Less than $10,000 | 667 | 7.8% |
| $10,000 to $14,999 | 163 | 1.9% |
| $15,000 to $24,999 | 659 | 7.7% |
| $25,000 to $34,999 | 625 | 7.3% |
| $35,000 to $49,999 | 967 | 11.3% |
| $50,000 to $74,999 | 1,455 | 17.0% |
| $75,000 to $99,999 | 1,395 | 16.3% |
| $100,000 to $149,999 | 1,395 | 16.3% |
| $150,000 to $199,999 | 565 | 6.6% |
| $200,000+ | 667 | 7.8% |
Family Income by Famaliy Size in Texarkana
5-person families (752 | 8.8%) account for the highest median family income in Texarkana with $90,238 per family, while 2-person families (3,890 | 45.5%) have the highest median income of $34,659 per family member.
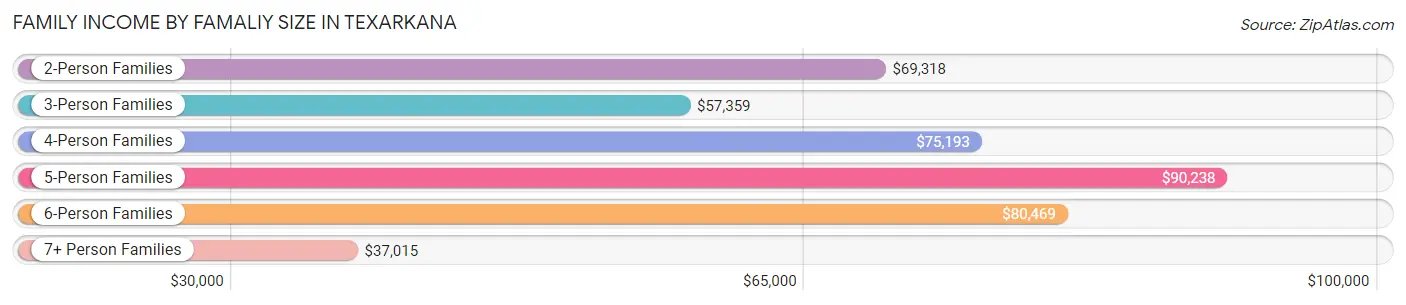
| Income Bracket | # Families | Median Income |
| 2-Person Families | 3,890 (45.5%) | $69,318 |
| 3-Person Families | 2,016 (23.6%) | $57,359 |
| 4-Person Families | 1,405 (16.4%) | $75,193 |
| 5-Person Families | 752 (8.8%) | $90,238 |
| 6-Person Families | 352 (4.1%) | $80,469 |
| 7+ Person Families | 142 (1.7%) | $37,015 |
| Total | 8,557 (100.0%) | $69,379 |
Family Income by Number of Earners in Texarkana
The median family income in Texarkana is $69,379, with families comprising 3+ earners (748) having the highest median family income of $117,281, while families with no earners (1,335) have the lowest median family income of $25,225, accounting for 8.7% and 15.6% of families, respectively.
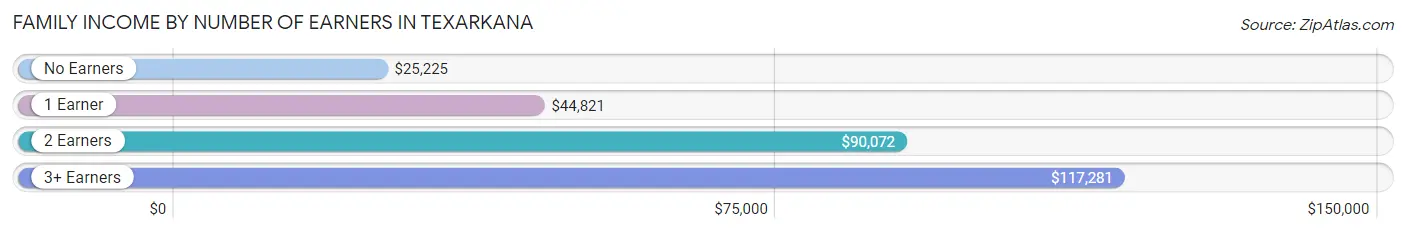
| Number of Earners | # Families | Median Income |
| No Earners | 1,335 (15.6%) | $25,225 |
| 1 Earner | 3,279 (38.3%) | $44,821 |
| 2 Earners | 3,195 (37.3%) | $90,072 |
| 3+ Earners | 748 (8.7%) | $117,281 |
| Total | 8,557 (100.0%) | $69,379 |
Household Income in Texarkana
Household Income Brackets in Texarkana
With 2,187 households falling in the category, the $50,000 to $74,999 income range is the most frequent in Texarkana, accounting for 15.3% of all households. In contrast, only 629 households (4.4%) fall into the $150,000 to $199,999 income bracket, making it the least populous group.
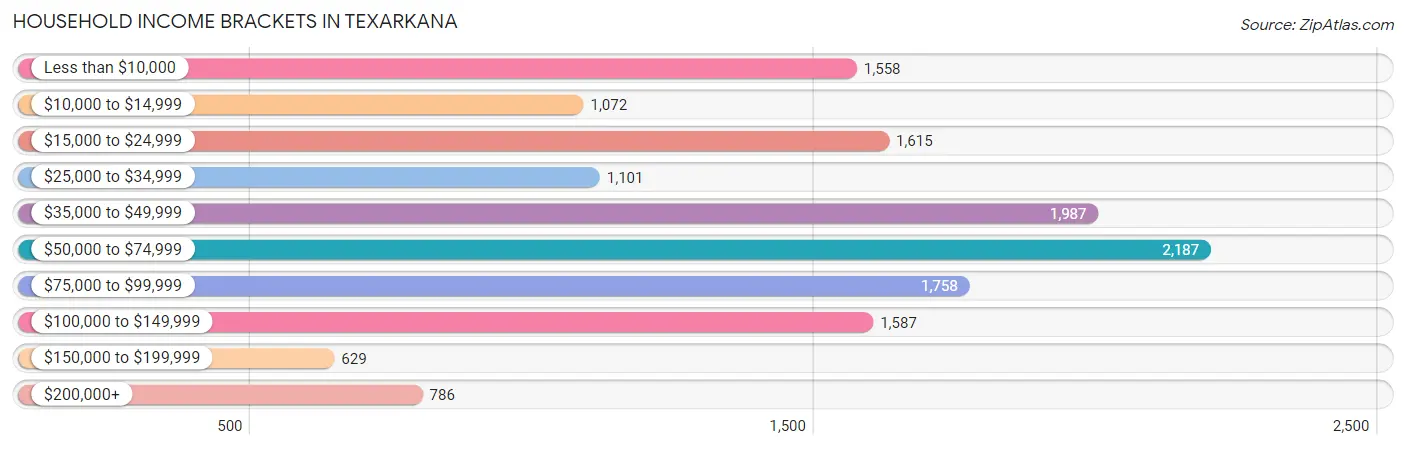
| Income Bracket | # Households | % Households |
| Less than $10,000 | 1,558 | 10.9% |
| $10,000 to $14,999 | 1,072 | 7.5% |
| $15,000 to $24,999 | 1,615 | 11.3% |
| $25,000 to $34,999 | 1,101 | 7.7% |
| $35,000 to $49,999 | 1,987 | 13.9% |
| $50,000 to $74,999 | 2,187 | 15.3% |
| $75,000 to $99,999 | 1,758 | 12.3% |
| $100,000 to $149,999 | 1,587 | 11.1% |
| $150,000 to $199,999 | 629 | 4.4% |
| $200,000+ | 786 | 5.5% |
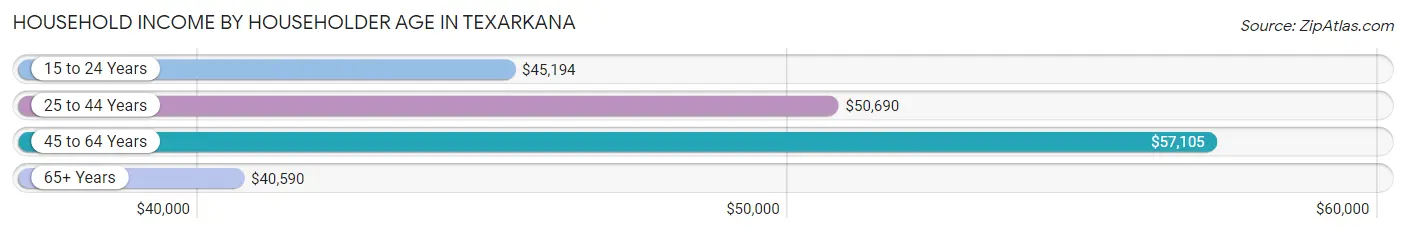
Household Income by Householder Age in Texarkana
The median household income in Texarkana is $48,054, with the highest median household income of $57,105 found in the 45 to 64 years age bracket for the primary householder. A total of 4,412 households (30.9%) fall into this category. Meanwhile, the 65+ years age bracket for the primary householder has the lowest median household income of $40,590, with 4,227 households (29.6%) in this group.
| Income Bracket | # Households | Median Income |
| 15 to 24 Years | 686 (4.8%) | $45,194 |
| 25 to 44 Years | 4,970 (34.8%) | $50,690 |
| 45 to 64 Years | 4,412 (30.9%) | $57,105 |
| 65+ Years | 4,227 (29.6%) | $40,590 |
| Total | 14,295 (100.0%) | $48,054 |
Poverty in Texarkana
Income Below Poverty by Sex and Age in Texarkana
With 21.2% poverty level for males and 22.8% for females among the residents of Texarkana, 6 to 11 year old males and under 5 year old females are the most vulnerable to poverty, with 522 males (39.6%) and 505 females (41.9%) in their respective age groups living below the poverty level.
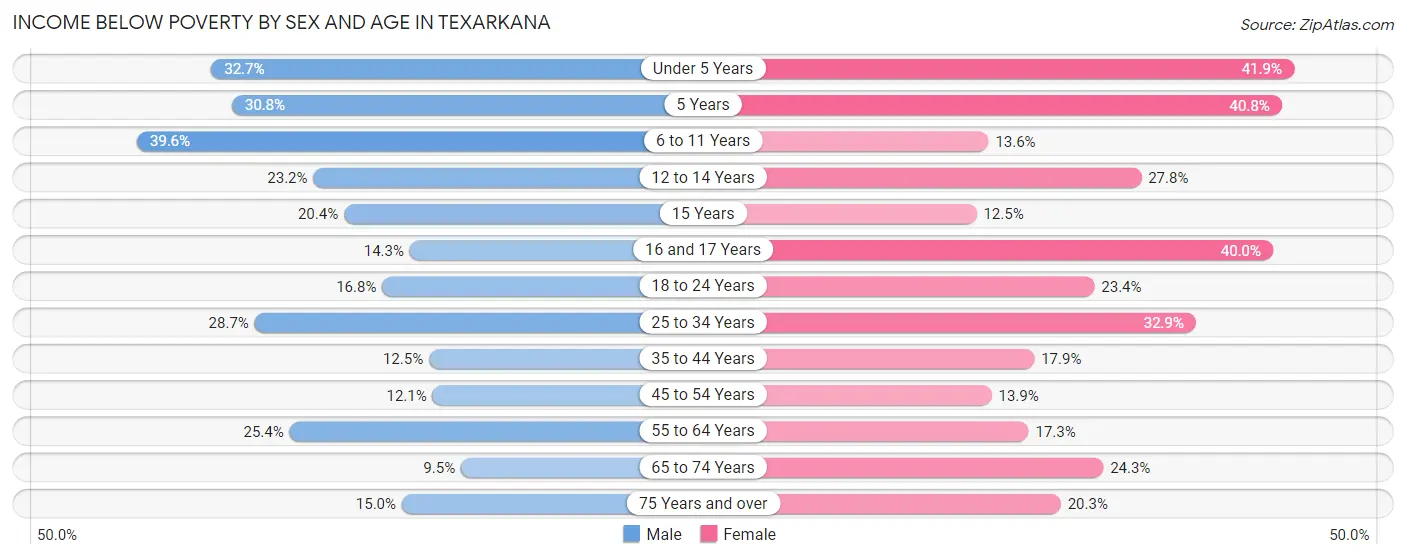
| Age Bracket | Male | Female |
| Under 5 Years | 393 (32.7%) | 505 (41.9%) |
| 5 Years | 96 (30.8%) | 40 (40.8%) |
| 6 to 11 Years | 522 (39.6%) | 246 (13.6%) |
| 12 to 14 Years | 142 (23.2%) | 167 (27.8%) |
| 15 Years | 67 (20.4%) | 19 (12.5%) |
| 16 and 17 Years | 59 (14.2%) | 184 (40.0%) |
| 18 to 24 Years | 273 (16.8%) | 323 (23.4%) |
| 25 to 34 Years | 709 (28.6%) | 787 (32.9%) |
| 35 to 44 Years | 293 (12.5%) | 409 (17.9%) |
| 45 to 54 Years | 197 (12.1%) | 296 (13.9%) |
| 55 to 64 Years | 451 (25.4%) | 391 (17.3%) |
| 65 to 74 Years | 138 (9.5%) | 464 (24.3%) |
| 75 Years and over | 139 (15.0%) | 289 (20.3%) |
| Total | 3,479 (21.2%) | 4,120 (22.8%) |
Income Above Poverty by Sex and Age in Texarkana
According to the poverty statistics in Texarkana, males aged 65 to 74 years and females aged 15 years are the age groups that are most secure financially, with 90.5% of males and 87.5% of females in these age groups living above the poverty line.
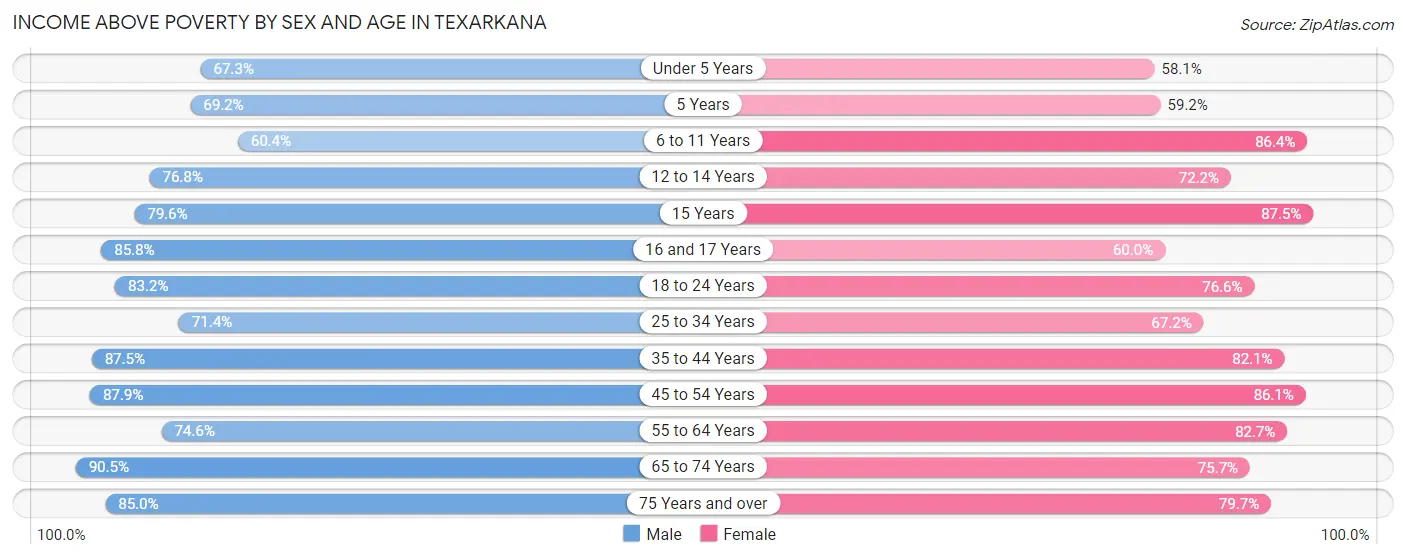
| Age Bracket | Male | Female |
| Under 5 Years | 810 (67.3%) | 699 (58.1%) |
| 5 Years | 216 (69.2%) | 58 (59.2%) |
| 6 to 11 Years | 797 (60.4%) | 1,561 (86.4%) |
| 12 to 14 Years | 470 (76.8%) | 434 (72.2%) |
| 15 Years | 262 (79.6%) | 133 (87.5%) |
| 16 and 17 Years | 355 (85.8%) | 276 (60.0%) |
| 18 to 24 Years | 1,351 (83.2%) | 1,055 (76.6%) |
| 25 to 34 Years | 1,766 (71.4%) | 1,609 (67.1%) |
| 35 to 44 Years | 2,056 (87.5%) | 1,881 (82.1%) |
| 45 to 54 Years | 1,426 (87.9%) | 1,833 (86.1%) |
| 55 to 64 Years | 1,324 (74.6%) | 1,865 (82.7%) |
| 65 to 74 Years | 1,315 (90.5%) | 1,449 (75.7%) |
| 75 Years and over | 788 (85.0%) | 1,133 (79.7%) |
| Total | 12,936 (78.8%) | 13,986 (77.2%) |
Income Below Poverty Among Married-Couple Families in Texarkana
The poverty statistics for married-couple families in Texarkana show that 5.2% or 277 of the total 5,294 families live below the poverty line. Families with 5 or more children have the highest poverty rate of 100.0%, comprising of 25 families. On the other hand, families with no children have the lowest poverty rate of 3.5%, which includes 108 families.
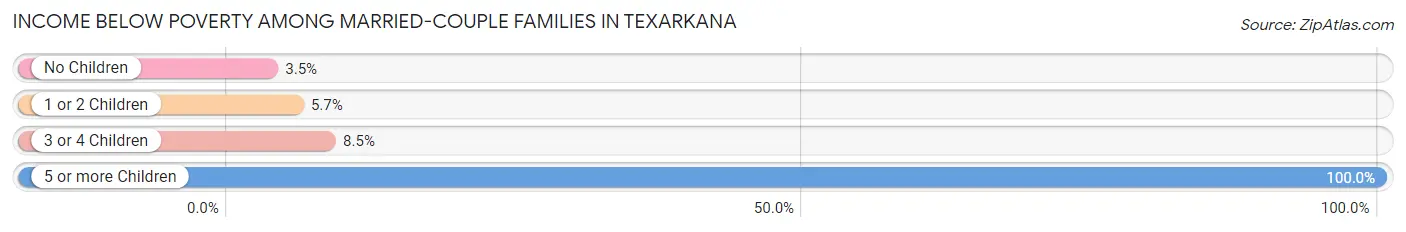
| Children | Above Poverty | Below Poverty |
| No Children | 2,971 (96.5%) | 108 (3.5%) |
| 1 or 2 Children | 1,446 (94.3%) | 88 (5.7%) |
| 3 or 4 Children | 600 (91.5%) | 56 (8.5%) |
| 5 or more Children | 0 (0.0%) | 25 (100.0%) |
| Total | 5,017 (94.8%) | 277 (5.2%) |
Income Below Poverty Among Single-Parent Households in Texarkana
According to the poverty data in Texarkana, 23.7% or 154 single-father households and 40.0% or 1,045 single-mother households are living below the poverty line. Among single-father households, those with 1 or 2 children have the highest poverty rate, with 67 households (35.3%) experiencing poverty. Likewise, among single-mother households, those with 5 or more children have the highest poverty rate, with 57 households (100.0%) falling below the poverty line.
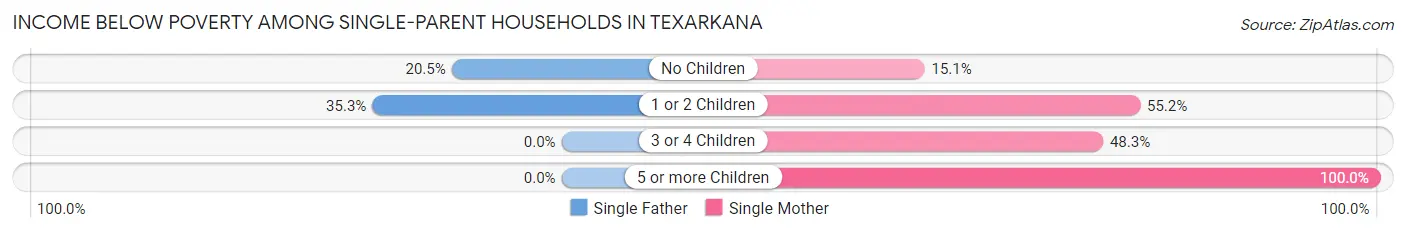
| Children | Single Father | Single Mother |
| No Children | 87 (20.5%) | 151 (15.1%) |
| 1 or 2 Children | 67 (35.3%) | 695 (55.2%) |
| 3 or 4 Children | 0 (0.0%) | 142 (48.3%) |
| 5 or more Children | 0 (0.0%) | 57 (100.0%) |
| Total | 154 (23.7%) | 1,045 (40.0%) |
Income Below Poverty Among Married-Couple vs Single-Parent Households in Texarkana
The poverty data for Texarkana shows that 277 of the married-couple family households (5.2%) and 1,199 of the single-parent households (36.7%) are living below the poverty level. Within the married-couple family households, those with 5 or more children have the highest poverty rate, with 25 households (100.0%) falling below the poverty line. Among the single-parent households, those with 5 or more children have the highest poverty rate, with 57 household (100.0%) living below poverty.
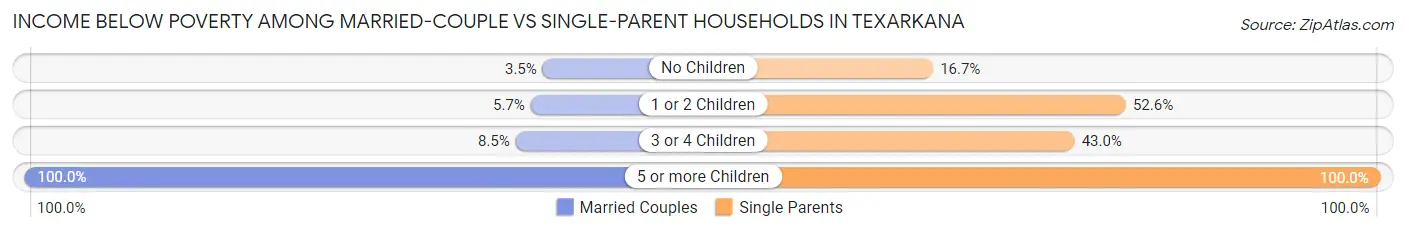
| Children | Married-Couple Families | Single-Parent Households |
| No Children | 108 (3.5%) | 238 (16.7%) |
| 1 or 2 Children | 88 (5.7%) | 762 (52.6%) |
| 3 or 4 Children | 56 (8.5%) | 142 (43.0%) |
| 5 or more Children | 25 (100.0%) | 57 (100.0%) |
| Total | 277 (5.2%) | 1,199 (36.7%) |
Race in Texarkana
The most populous races in Texarkana are White / Caucasian (18,907 | 52.3%), Black / African American (13,779 | 38.1%), and Hispanic or Latino (3,370 | 9.3%).
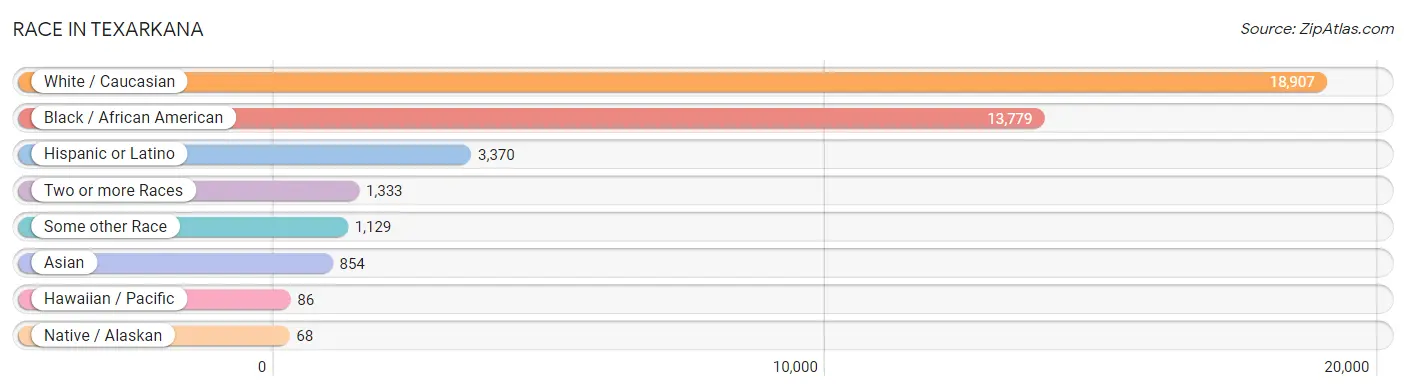
| Race | # Population | % Population |
| Asian | 854 | 2.4% |
| Black / African American | 13,779 | 38.1% |
| Hawaiian / Pacific | 86 | 0.2% |
| Hispanic or Latino | 3,370 | 9.3% |
| Native / Alaskan | 68 | 0.2% |
| White / Caucasian | 18,907 | 52.3% |
| Two or more Races | 1,333 | 3.7% |
| Some other Race | 1,129 | 3.1% |
| Total | 36,156 | 100.0% |
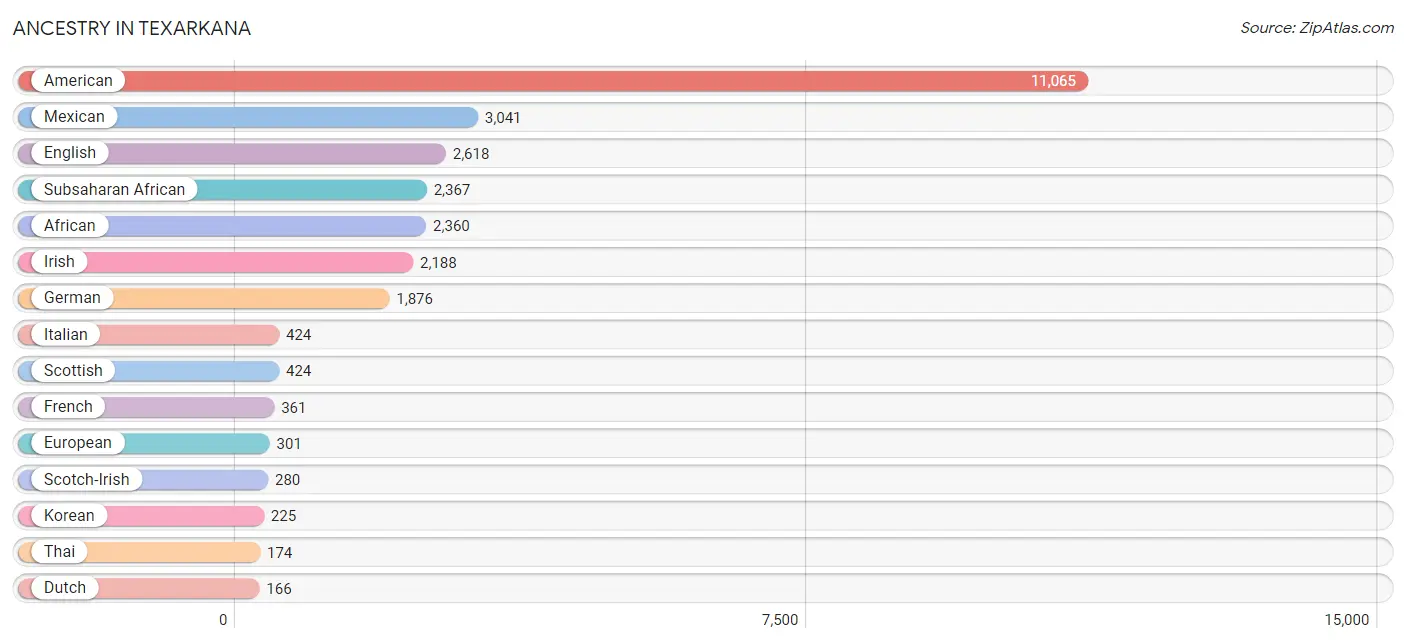
Ancestry in Texarkana
The most populous ancestries reported in Texarkana are American (11,065 | 30.6%), Mexican (3,041 | 8.4%), English (2,618 | 7.2%), Subsaharan African (2,367 | 6.6%), and African (2,360 | 6.5%), together accounting for 59.3% of all Texarkana residents.
| Ancestry | # Population | % Population |
| African | 2,360 | 6.5% |
| American | 11,065 | 30.6% |
| Apache | 47 | 0.1% |
| Arab | 34 | 0.1% |
| Belgian | 10 | 0.0% |
| Bhutanese | 27 | 0.1% |
| Blackfeet | 23 | 0.1% |
| British | 94 | 0.3% |
| Burmese | 154 | 0.4% |
| Central American | 144 | 0.4% |
| Central American Indian | 23 | 0.1% |
| Cherokee | 110 | 0.3% |
| Chickasaw | 37 | 0.1% |
| Choctaw | 69 | 0.2% |
| Czech | 114 | 0.3% |
| Danish | 17 | 0.1% |
| Dutch | 166 | 0.5% |
| Egyptian | 34 | 0.1% |
| English | 2,618 | 7.2% |
| European | 301 | 0.8% |
| French | 361 | 1.0% |
| French Canadian | 53 | 0.2% |
| German | 1,876 | 5.2% |
| Guatemalan | 84 | 0.2% |
| Indian (Asian) | 158 | 0.4% |
| Iranian | 24 | 0.1% |
| Irish | 2,188 | 6.0% |
| Italian | 424 | 1.2% |
| Japanese | 38 | 0.1% |
| Korean | 225 | 0.6% |
| Lithuanian | 68 | 0.2% |
| Mexican | 3,041 | 8.4% |
| Native Hawaiian | 94 | 0.3% |
| Norwegian | 131 | 0.4% |
| Paraguayan | 30 | 0.1% |
| Portuguese | 12 | 0.0% |
| Puerto Rican | 93 | 0.3% |
| Salvadoran | 60 | 0.2% |
| Scandinavian | 84 | 0.2% |
| Scotch-Irish | 280 | 0.8% |
| Scottish | 424 | 1.2% |
| Sioux | 2 | 0.0% |
| South American | 30 | 0.1% |
| Spanish | 35 | 0.1% |
| Sri Lankan | 127 | 0.4% |
| Subsaharan African | 2,367 | 6.6% |
| Swedish | 50 | 0.1% |
| Swiss | 8 | 0.0% |
| Thai | 174 | 0.5% |
| Trinidadian and Tobagonian | 11 | 0.0% |
| Ukrainian | 13 | 0.0% |
| Welsh | 48 | 0.1% |
| West Indian | 37 | 0.1% |
| Yugoslavian | 26 | 0.1% | View All 54 Rows |
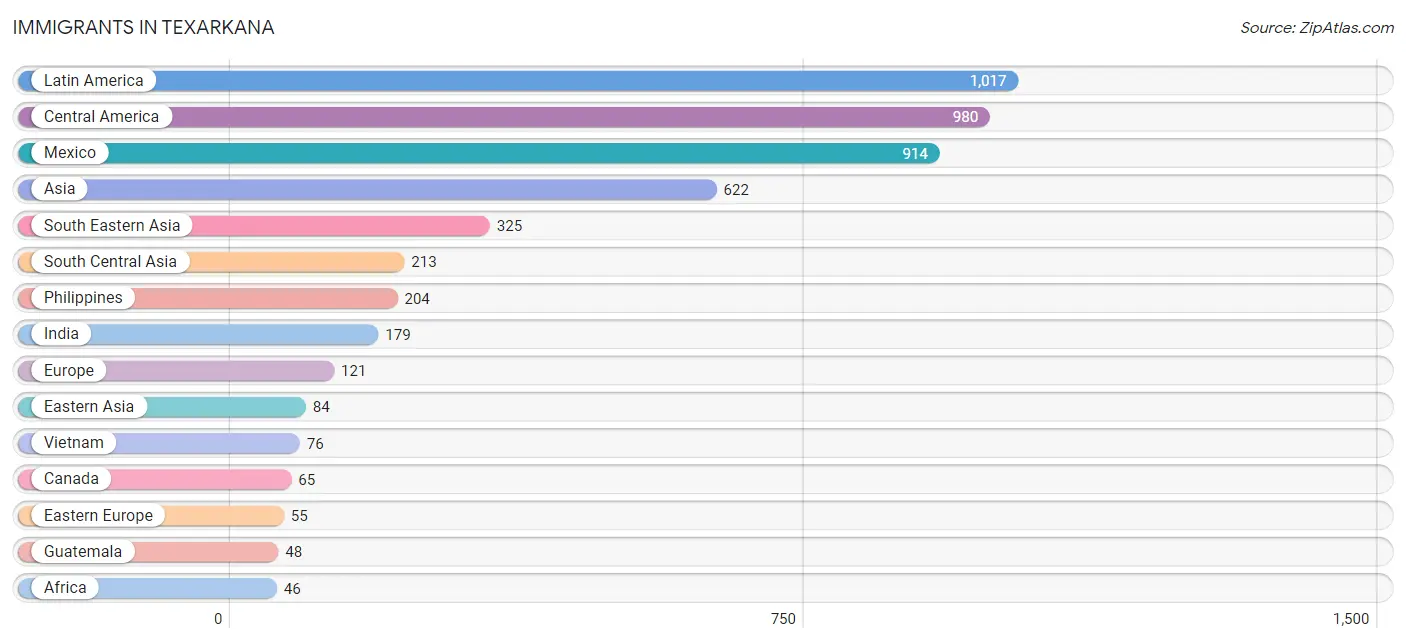
Immigrants in Texarkana
The most numerous immigrant groups reported in Texarkana came from Latin America (1,017 | 2.8%), Central America (980 | 2.7%), Mexico (914 | 2.5%), Asia (622 | 1.7%), and South Eastern Asia (325 | 0.9%), together accounting for 10.7% of all Texarkana residents.
| Immigration Origin | # Population | % Population |
| Africa | 46 | 0.1% |
| Asia | 622 | 1.7% |
| Cambodia | 38 | 0.1% |
| Canada | 65 | 0.2% |
| Caribbean | 37 | 0.1% |
| Central America | 980 | 2.7% |
| China | 46 | 0.1% |
| Eastern Africa | 28 | 0.1% |
| Eastern Asia | 84 | 0.2% |
| Eastern Europe | 55 | 0.2% |
| Egypt | 18 | 0.1% |
| El Salvador | 18 | 0.1% |
| England | 6 | 0.0% |
| Ethiopia | 28 | 0.1% |
| Europe | 121 | 0.3% |
| France | 15 | 0.0% |
| Germany | 28 | 0.1% |
| Guatemala | 48 | 0.1% |
| India | 179 | 0.5% |
| Korea | 38 | 0.1% |
| Latin America | 1,017 | 2.8% |
| Lithuania | 29 | 0.1% |
| Malaysia | 7 | 0.0% |
| Mexico | 914 | 2.5% |
| Nepal | 34 | 0.1% |
| Northern Africa | 18 | 0.1% |
| Northern Europe | 23 | 0.1% |
| Philippines | 204 | 0.6% |
| Serbia | 26 | 0.1% |
| South Central Asia | 213 | 0.6% |
| South Eastern Asia | 325 | 0.9% |
| Taiwan | 15 | 0.0% |
| Vietnam | 76 | 0.2% |
| Western Europe | 43 | 0.1% | View All 34 Rows |
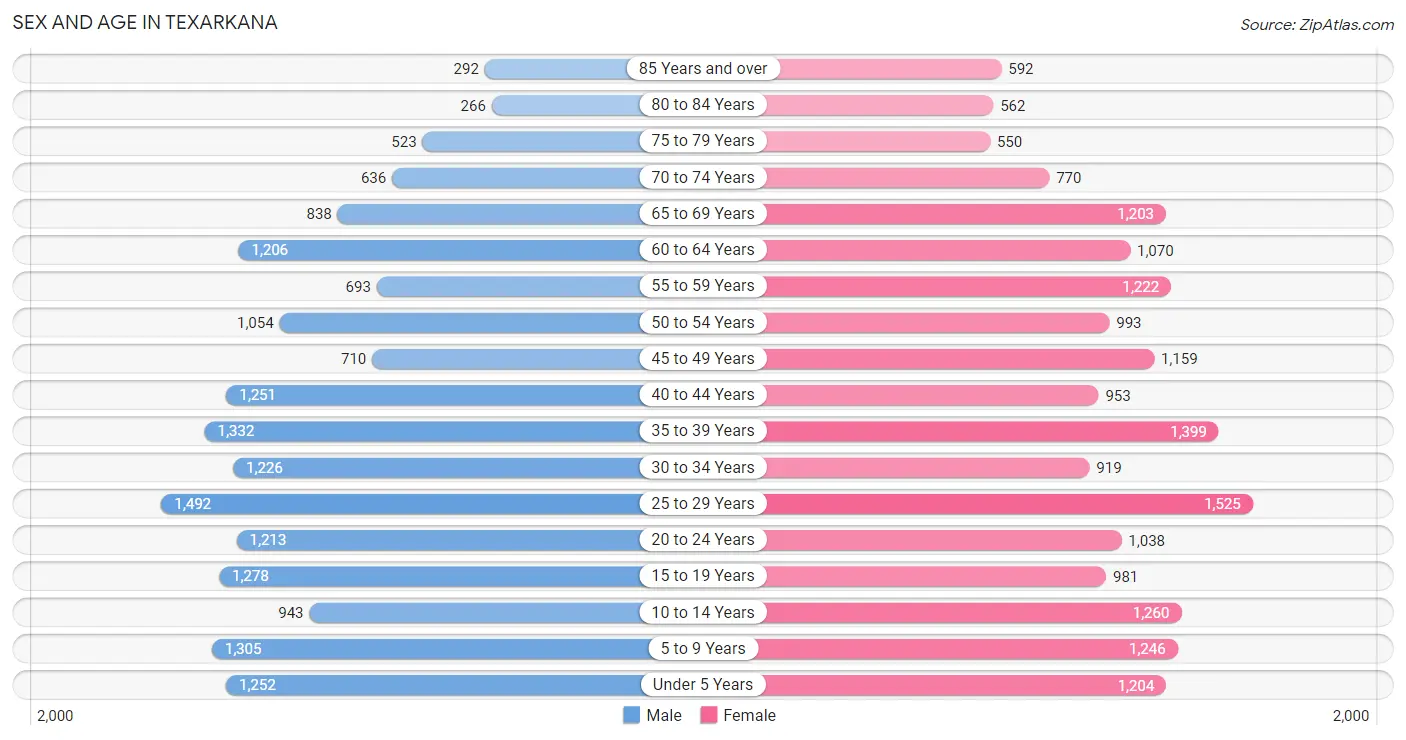
Sex and Age in Texarkana
Sex and Age in Texarkana
The most populous age groups in Texarkana are 25 to 29 Years (1,492 | 8.5%) for men and 25 to 29 Years (1,525 | 8.2%) for women.
| Age Bracket | Male | Female |
| Under 5 Years | 1,252 (7.1%) | 1,204 (6.5%) |
| 5 to 9 Years | 1,305 (7.4%) | 1,246 (6.7%) |
| 10 to 14 Years | 943 (5.4%) | 1,260 (6.8%) |
| 15 to 19 Years | 1,278 (7.3%) | 981 (5.3%) |
| 20 to 24 Years | 1,213 (6.9%) | 1,038 (5.6%) |
| 25 to 29 Years | 1,492 (8.5%) | 1,525 (8.2%) |
| 30 to 34 Years | 1,226 (7.0%) | 919 (4.9%) |
| 35 to 39 Years | 1,332 (7.6%) | 1,399 (7.5%) |
| 40 to 44 Years | 1,251 (7.1%) | 953 (5.1%) |
| 45 to 49 Years | 710 (4.1%) | 1,159 (6.2%) |
| 50 to 54 Years | 1,054 (6.0%) | 993 (5.3%) |
| 55 to 59 Years | 693 (4.0%) | 1,222 (6.6%) |
| 60 to 64 Years | 1,206 (6.9%) | 1,070 (5.7%) |
| 65 to 69 Years | 838 (4.8%) | 1,203 (6.5%) |
| 70 to 74 Years | 636 (3.6%) | 770 (4.1%) |
| 75 to 79 Years | 523 (3.0%) | 550 (2.9%) |
| 80 to 84 Years | 266 (1.5%) | 562 (3.0%) |
| 85 Years and over | 292 (1.7%) | 592 (3.2%) |
| Total | 17,510 (100.0%) | 18,646 (100.0%) |
Families and Households in Texarkana
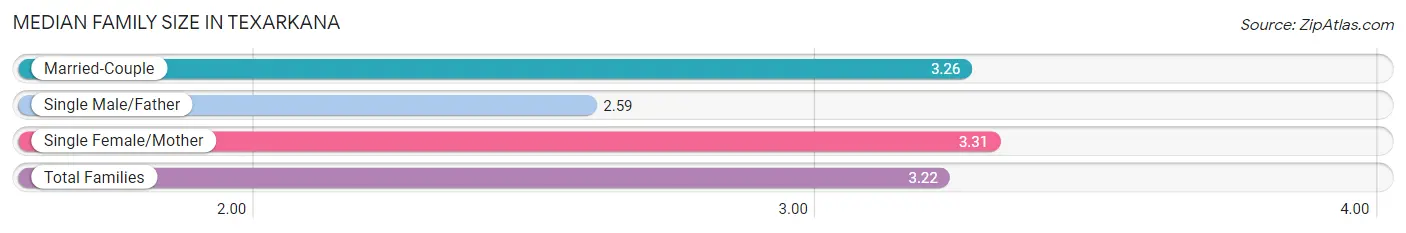
Median Family Size in Texarkana
The median family size in Texarkana is 3.22 persons per family, with single female/mother families (2,612 | 30.5%) accounting for the largest median family size of 3.31 persons per family. On the other hand, single male/father families (651 | 7.6%) represent the smallest median family size with 2.59 persons per family.
| Family Type | # Families | Family Size |
| Married-Couple | 5,294 (61.9%) | 3.26 |
| Single Male/Father | 651 (7.6%) | 2.59 |
| Single Female/Mother | 2,612 (30.5%) | 3.31 |
| Total Families | 8,557 (100.0%) | 3.22 |
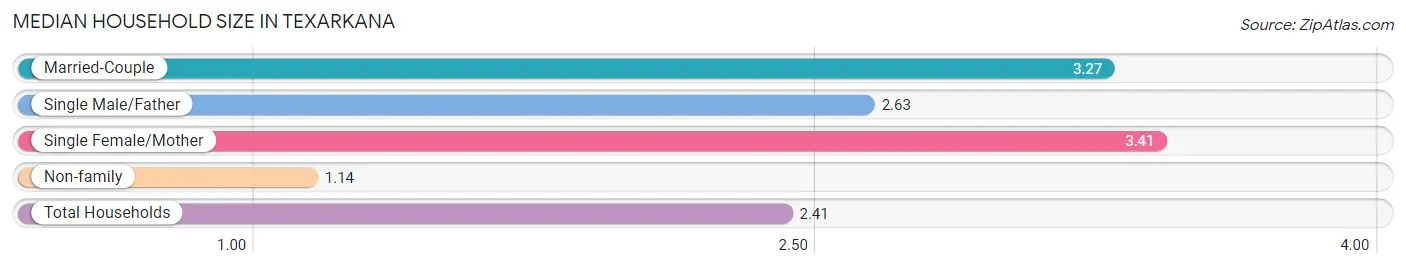
Median Household Size in Texarkana
The median household size in Texarkana is 2.41 persons per household, with single female/mother households (2,612 | 18.3%) accounting for the largest median household size of 3.41 persons per household. non-family households (5,738 | 40.1%) represent the smallest median household size with 1.14 persons per household.
| Household Type | # Households | Household Size |
| Married-Couple | 5,294 (37.0%) | 3.27 |
| Single Male/Father | 651 (4.5%) | 2.63 |
| Single Female/Mother | 2,612 (18.3%) | 3.41 |
| Non-family | 5,738 (40.1%) | 1.14 |
| Total Households | 14,295 (100.0%) | 2.41 |
Household Size by Marriage Status in Texarkana
Out of a total of 14,295 households in Texarkana, 8,557 (59.9%) are family households, while 5,738 (40.1%) are nonfamily households. The most numerous type of family households are 2-person households, comprising 3,836, and the most common type of nonfamily households are 1-person households, comprising 5,172.
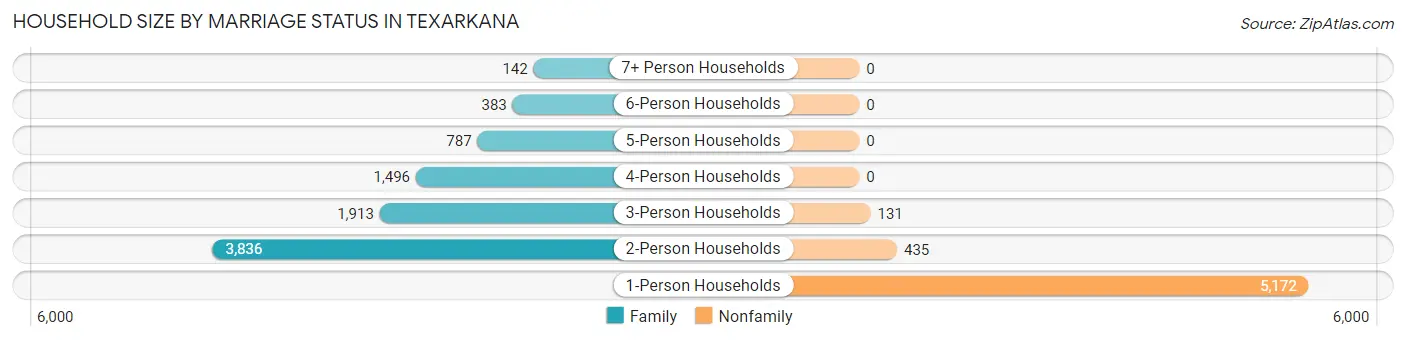
| Household Size | Family Households | Nonfamily Households |
| 1-Person Households | - | 5,172 (36.2%) |
| 2-Person Households | 3,836 (26.8%) | 435 (3.0%) |
| 3-Person Households | 1,913 (13.4%) | 131 (0.9%) |
| 4-Person Households | 1,496 (10.5%) | 0 (0.0%) |
| 5-Person Households | 787 (5.5%) | 0 (0.0%) |
| 6-Person Households | 383 (2.7%) | 0 (0.0%) |
| 7+ Person Households | 142 (1.0%) | 0 (0.0%) |
| Total | 8,557 (59.9%) | 5,738 (40.1%) |
Female Fertility in Texarkana
Fertility by Age in Texarkana
Average fertility rate in Texarkana is 59.0 births per 1,000 women. Women in the age bracket of 20 to 34 years have the highest fertility rate with 116.0 births per 1,000 women. Women in the age bracket of 20 to 34 years acount for 84.0% of all women with births.
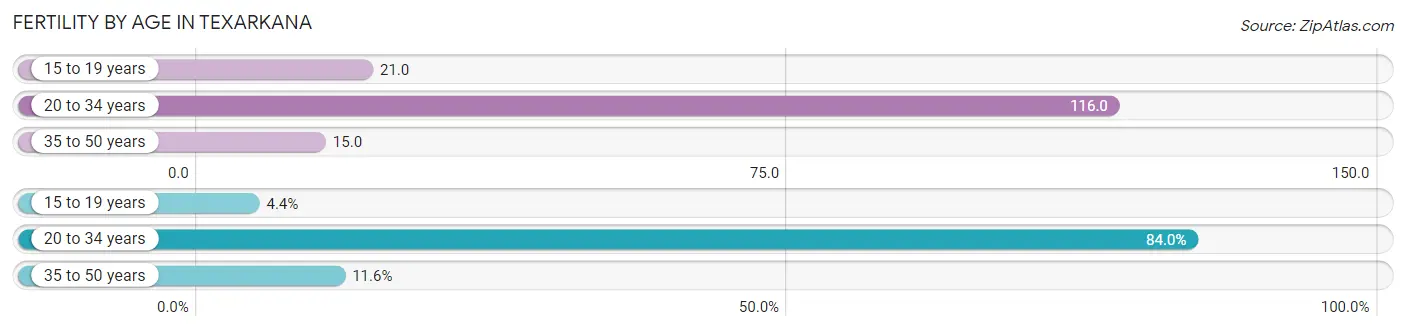
| Age Bracket | Women with Births | Births / 1,000 Women |
| 15 to 19 years | 21 (4.4%) | 21.0 |
| 20 to 34 years | 404 (84.0%) | 116.0 |
| 35 to 50 years | 56 (11.6%) | 15.0 |
| Total | 481 (100.0%) | 59.0 |
Fertility by Age by Marriage Status in Texarkana
26.2% of women with births (481) in Texarkana are married. The highest percentage of unmarried women with births falls into 20 to 34 years age bracket with 87.9% of them unmarried at the time of birth, while the lowest percentage of unmarried women with births belong to 15 to 19 years age bracket with 0.0% of them unmarried.
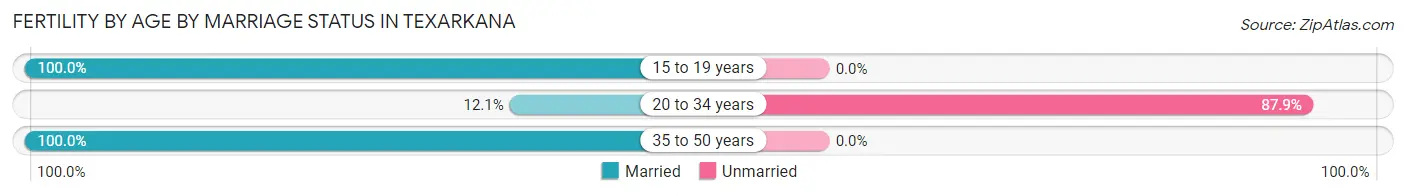
| Age Bracket | Married | Unmarried |
| 15 to 19 years | 21 (100.0%) | 0 (0.0%) |
| 20 to 34 years | 49 (12.1%) | 355 (87.9%) |
| 35 to 50 years | 56 (100.0%) | 0 (0.0%) |
| Total | 126 (26.2%) | 355 (73.8%) |
Fertility by Education in Texarkana
Average fertility rate in Texarkana is 59.0 births per 1,000 women. Women with the education attainment of less than high school have the highest fertility rate of 75.0 births per 1,000 women, while women with the education attainment of graduate degree have the lowest fertility at 17.0 births per 1,000 women. Women with the education attainment of college or associate's degree represent 36.4% of all women with births.
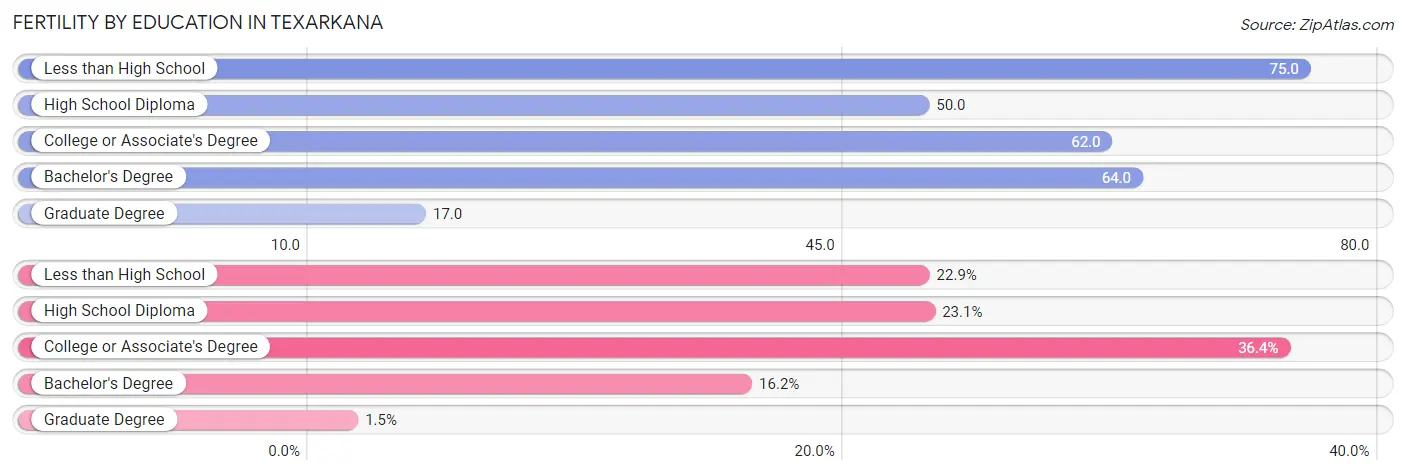
| Educational Attainment | Women with Births | Births / 1,000 Women |
| Less than High School | 110 (22.9%) | 75.0 |
| High School Diploma | 111 (23.1%) | 50.0 |
| College or Associate's Degree | 175 (36.4%) | 62.0 |
| Bachelor's Degree | 78 (16.2%) | 64.0 |
| Graduate Degree | 7 (1.5%) | 17.0 |
| Total | 481 (100.0%) | 59.0 |
Fertility by Education by Marriage Status in Texarkana
73.8% of women with births in Texarkana are unmarried. Women with the educational attainment of graduate degree are most likely to be married with 100.0% of them married at childbirth, while women with the educational attainment of high school diploma are least likely to be married with 100.0% of them unmarried at childbirth.
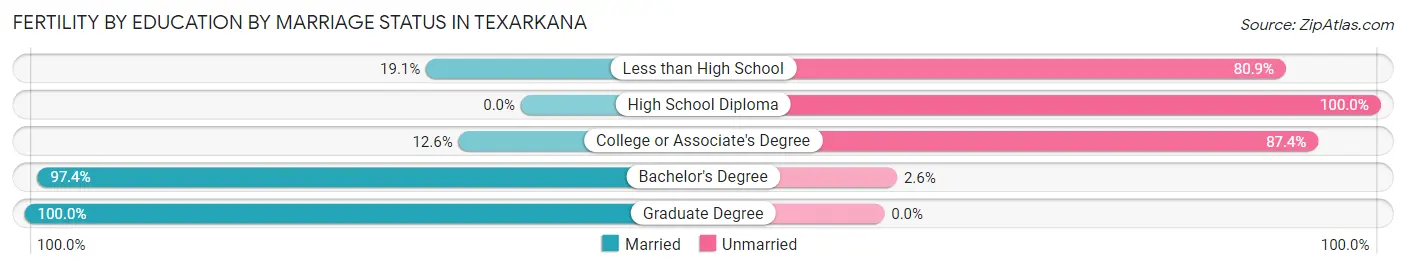
| Educational Attainment | Married | Unmarried |
| Less than High School | 21 (19.1%) | 89 (80.9%) |
| High School Diploma | 0 (0.0%) | 111 (100.0%) |
| College or Associate's Degree | 22 (12.6%) | 153 (87.4%) |
| Bachelor's Degree | 76 (97.4%) | 2 (2.6%) |
| Graduate Degree | 7 (100.0%) | 0 (0.0%) |
| Total | 126 (26.2%) | 355 (73.8%) |
Employment Characteristics in Texarkana
Employment by Class of Employer in Texarkana
Among the 14,924 employed individuals in Texarkana, private company employees (10,964 | 73.5%), not-for-profit organizations (1,028 | 6.9%), and state government employees (911 | 6.1%) make up the most common classes of employment.
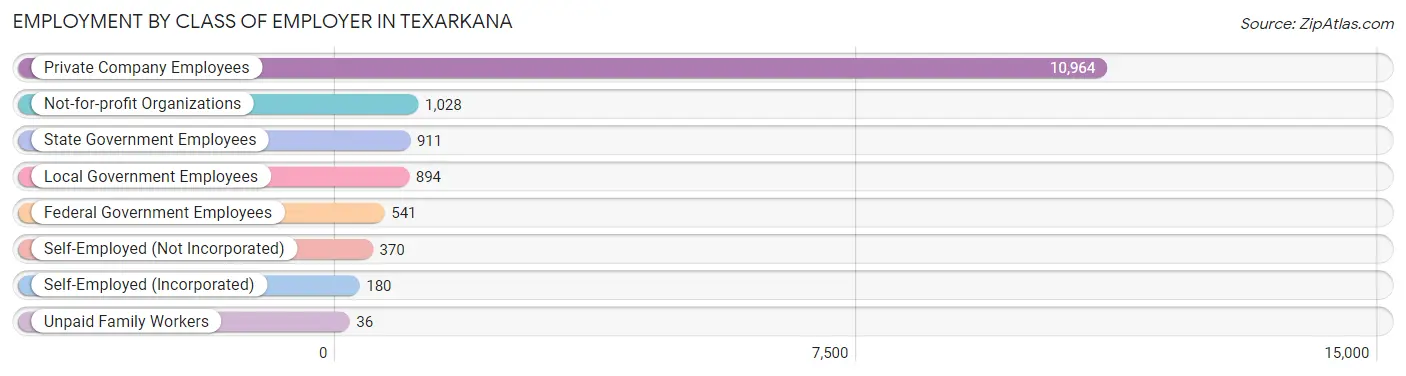
| Employer Class | # Employees | % Employees |
| Private Company Employees | 10,964 | 73.5% |
| Self-Employed (Incorporated) | 180 | 1.2% |
| Self-Employed (Not Incorporated) | 370 | 2.5% |
| Not-for-profit Organizations | 1,028 | 6.9% |
| Local Government Employees | 894 | 6.0% |
| State Government Employees | 911 | 6.1% |
| Federal Government Employees | 541 | 3.6% |
| Unpaid Family Workers | 36 | 0.2% |
| Total | 14,924 | 100.0% |
Employment Status by Age in Texarkana
According to the labor force statistics for Texarkana, out of the total population over 16 years of age (28,462), 55.9% or 15,910 individuals are in the labor force, with 5.7% or 907 of them unemployed. The age group with the highest labor force participation rate is 25 to 29 years, with 79.3% or 2,392 individuals in the labor force. Within the labor force, the 75 years and over age range has the highest percentage of unemployed individuals, with 13.2% or 21 of them being unemployed.
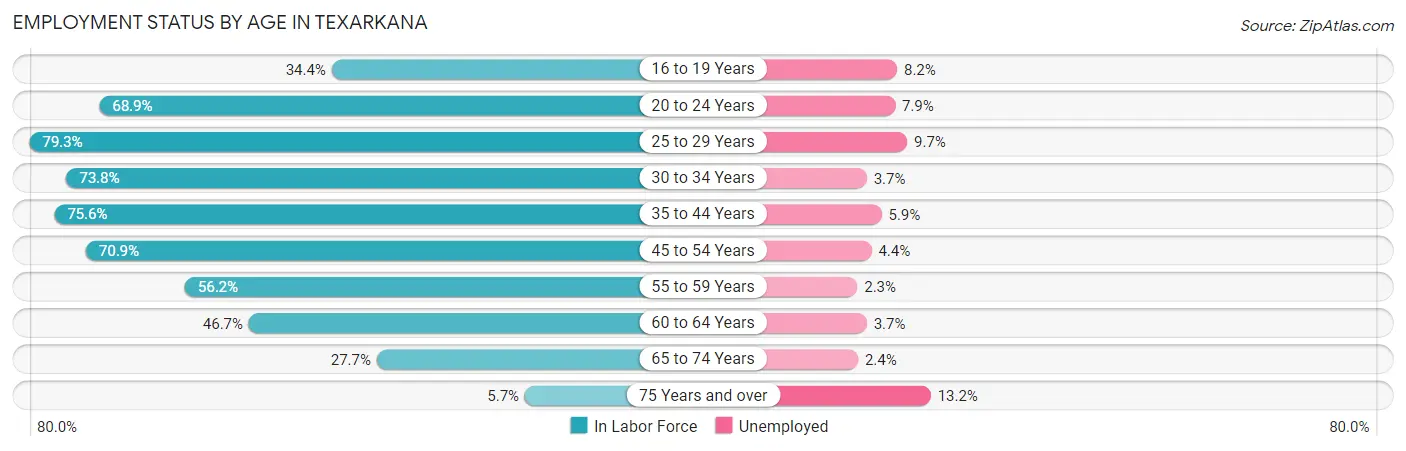
| Age Bracket | In Labor Force | Unemployed |
| 16 to 19 Years | 611 (34.4%) | 50 (8.2%) |
| 20 to 24 Years | 1,551 (68.9%) | 123 (7.9%) |
| 25 to 29 Years | 2,392 (79.3%) | 232 (9.7%) |
| 30 to 34 Years | 1,583 (73.8%) | 59 (3.7%) |
| 35 to 44 Years | 3,731 (75.6%) | 220 (5.9%) |
| 45 to 54 Years | 2,776 (70.9%) | 122 (4.4%) |
| 55 to 59 Years | 1,076 (56.2%) | 25 (2.3%) |
| 60 to 64 Years | 1,063 (46.7%) | 39 (3.7%) |
| 65 to 74 Years | 955 (27.7%) | 23 (2.4%) |
| 75 Years and over | 159 (5.7%) | 21 (13.2%) |
| Total | 15,910 (55.9%) | 907 (5.7%) |
Employment Status by Educational Attainment in Texarkana
According to labor force statistics for Texarkana, 69.3% of individuals (12,615) out of the total population between 25 and 64 years of age (18,204) are in the labor force, with 5.5% or 694 of them being unemployed. The group with the highest labor force participation rate are those with the educational attainment of bachelor's degree or higher, with 79.7% or 3,363 individuals in the labor force. Within the labor force, individuals with less than high school education have the highest percentage of unemployment, with 10.8% or 101 of them being unemployed.
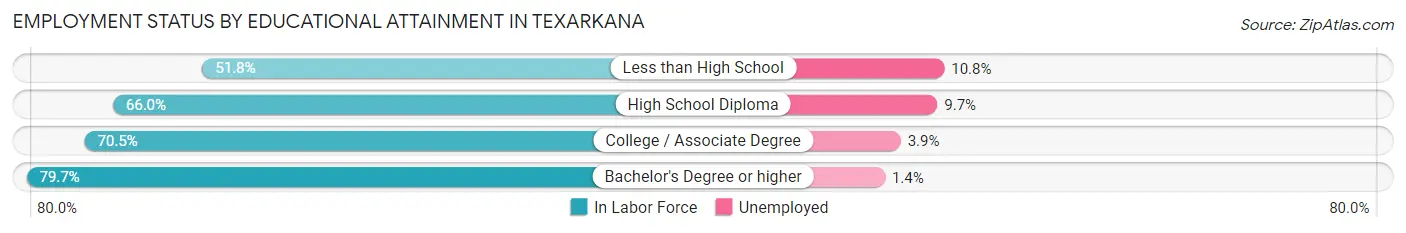
| Educational Attainment | In Labor Force | Unemployed |
| Less than High School | 938 (51.8%) | 195 (10.8%) |
| High School Diploma | 3,905 (66.0%) | 574 (9.7%) |
| College / Associate Degree | 4,413 (70.5%) | 244 (3.9%) |
| Bachelor's Degree or higher | 3,363 (79.7%) | 59 (1.4%) |
| Total | 12,615 (69.3%) | 1,001 (5.5%) |
Employment Occupations by Sex in Texarkana
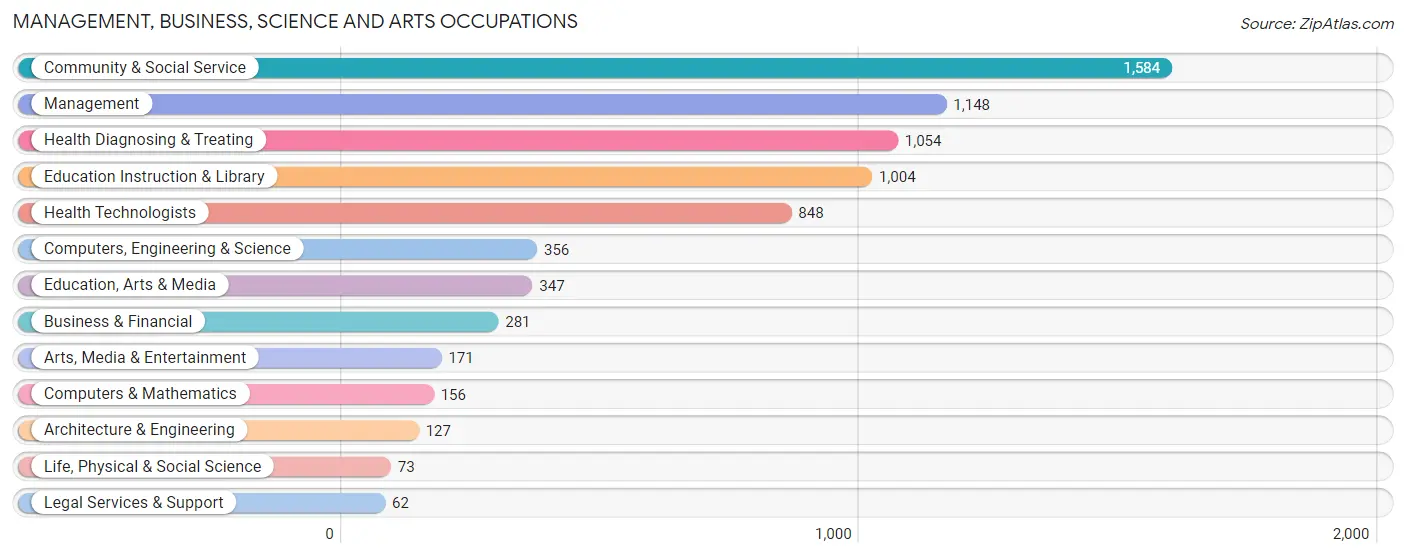
Management, Business, Science and Arts Occupations
The most common Management, Business, Science and Arts occupations in Texarkana are Community & Social Service (1,584 | 10.6%), Management (1,148 | 7.7%), Health Diagnosing & Treating (1,054 | 7.0%), Education Instruction & Library (1,004 | 6.7%), and Health Technologists (848 | 5.7%).
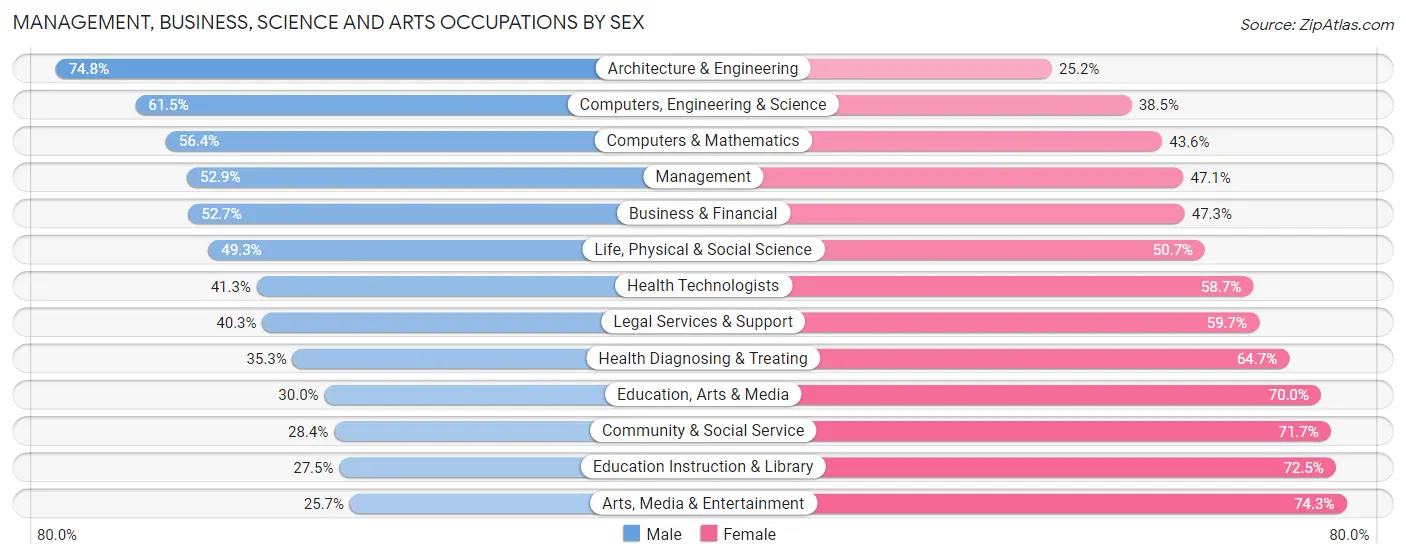
Management, Business, Science and Arts Occupations by Sex
Within the Management, Business, Science and Arts occupations in Texarkana, the most male-oriented occupations are Architecture & Engineering (74.8%), Computers, Engineering & Science (61.5%), and Computers & Mathematics (56.4%), while the most female-oriented occupations are Arts, Media & Entertainment (74.3%), Education Instruction & Library (72.5%), and Community & Social Service (71.7%).
| Occupation | Male | Female |
| Management | 607 (52.9%) | 541 (47.1%) |
| Business & Financial | 148 (52.7%) | 133 (47.3%) |
| Computers, Engineering & Science | 219 (61.5%) | 137 (38.5%) |
| Computers & Mathematics | 88 (56.4%) | 68 (43.6%) |
| Architecture & Engineering | 95 (74.8%) | 32 (25.2%) |
| Life, Physical & Social Science | 36 (49.3%) | 37 (50.7%) |
| Community & Social Service | 449 (28.3%) | 1,135 (71.7%) |
| Education, Arts & Media | 104 (30.0%) | 243 (70.0%) |
| Legal Services & Support | 25 (40.3%) | 37 (59.7%) |
| Education Instruction & Library | 276 (27.5%) | 728 (72.5%) |
| Arts, Media & Entertainment | 44 (25.7%) | 127 (74.3%) |
| Health Diagnosing & Treating | 372 (35.3%) | 682 (64.7%) |
| Health Technologists | 350 (41.3%) | 498 (58.7%) |
| Total (Category) | 1,795 (40.6%) | 2,628 (59.4%) |
| Total (Overall) | 7,548 (50.4%) | 7,436 (49.6%) |
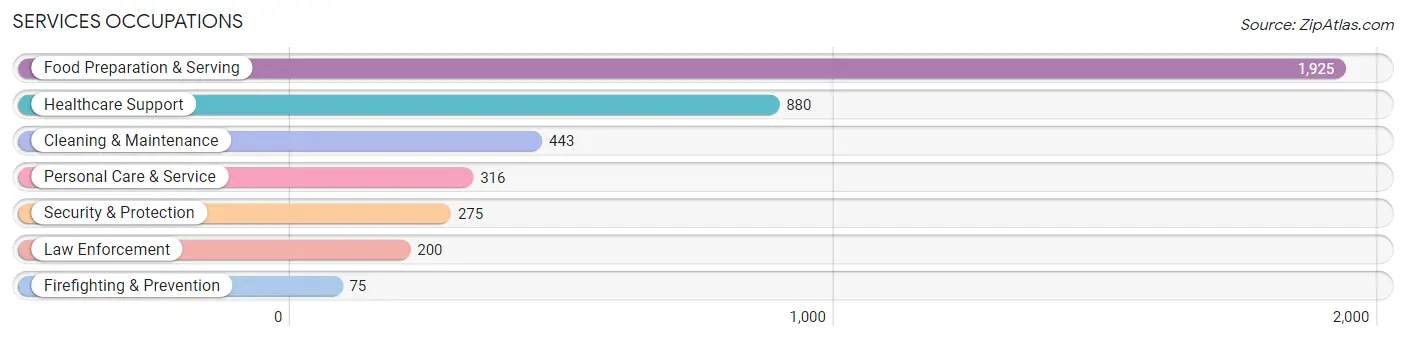
Services Occupations
The most common Services occupations in Texarkana are Food Preparation & Serving (1,925 | 12.9%), Healthcare Support (880 | 5.9%), Cleaning & Maintenance (443 | 3.0%), Personal Care & Service (316 | 2.1%), and Security & Protection (275 | 1.8%).
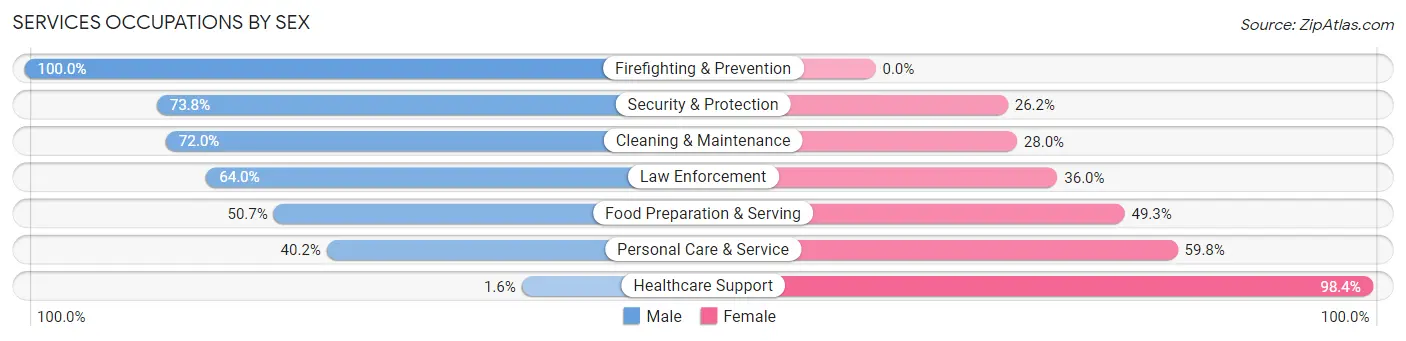
Services Occupations by Sex
Within the Services occupations in Texarkana, the most male-oriented occupations are Firefighting & Prevention (100.0%), Security & Protection (73.8%), and Cleaning & Maintenance (72.0%), while the most female-oriented occupations are Healthcare Support (98.4%), Personal Care & Service (59.8%), and Food Preparation & Serving (49.3%).
| Occupation | Male | Female |
| Healthcare Support | 14 (1.6%) | 866 (98.4%) |
| Security & Protection | 203 (73.8%) | 72 (26.2%) |
| Firefighting & Prevention | 75 (100.0%) | 0 (0.0%) |
| Law Enforcement | 128 (64.0%) | 72 (36.0%) |
| Food Preparation & Serving | 976 (50.7%) | 949 (49.3%) |
| Cleaning & Maintenance | 319 (72.0%) | 124 (28.0%) |
| Personal Care & Service | 127 (40.2%) | 189 (59.8%) |
| Total (Category) | 1,639 (42.7%) | 2,200 (57.3%) |
| Total (Overall) | 7,548 (50.4%) | 7,436 (49.6%) |
Sales and Office Occupations
The most common Sales and Office occupations in Texarkana are Office & Administration (1,859 | 12.4%), and Sales & Related (1,785 | 11.9%).

Sales and Office Occupations by Sex
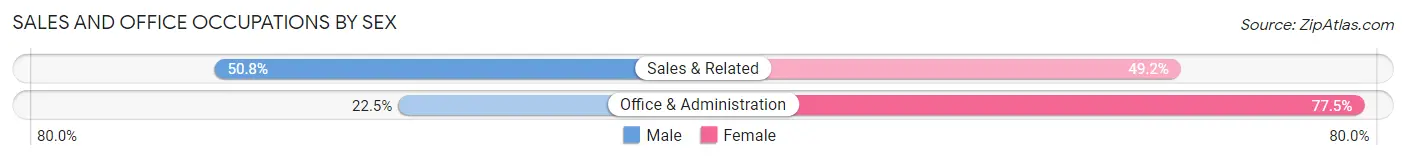
| Occupation | Male | Female |
| Sales & Related | 906 (50.8%) | 879 (49.2%) |
| Office & Administration | 419 (22.5%) | 1,440 (77.5%) |
| Total (Category) | 1,325 (36.4%) | 2,319 (63.6%) |
| Total (Overall) | 7,548 (50.4%) | 7,436 (49.6%) |
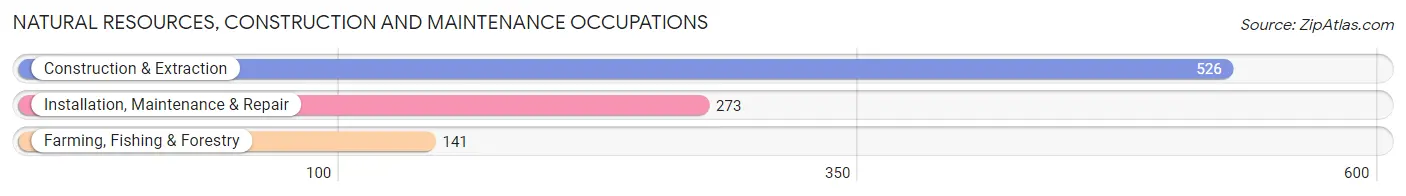
Natural Resources, Construction and Maintenance Occupations
The most common Natural Resources, Construction and Maintenance occupations in Texarkana are Construction & Extraction (526 | 3.5%), Installation, Maintenance & Repair (273 | 1.8%), and Farming, Fishing & Forestry (141 | 0.9%).
Natural Resources, Construction and Maintenance Occupations by Sex
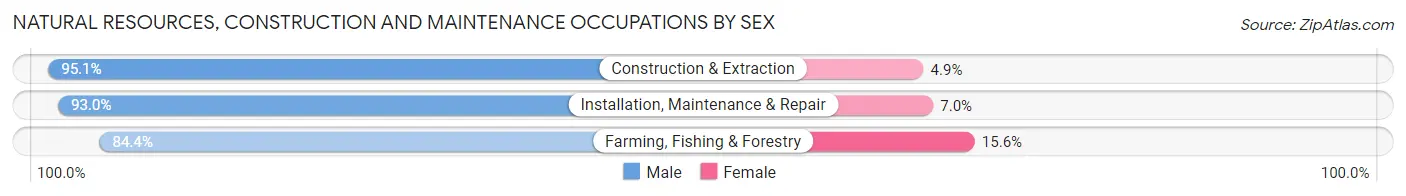
| Occupation | Male | Female |
| Farming, Fishing & Forestry | 119 (84.4%) | 22 (15.6%) |
| Construction & Extraction | 500 (95.1%) | 26 (4.9%) |
| Installation, Maintenance & Repair | 254 (93.0%) | 19 (7.0%) |
| Total (Category) | 873 (92.9%) | 67 (7.1%) |
| Total (Overall) | 7,548 (50.4%) | 7,436 (49.6%) |
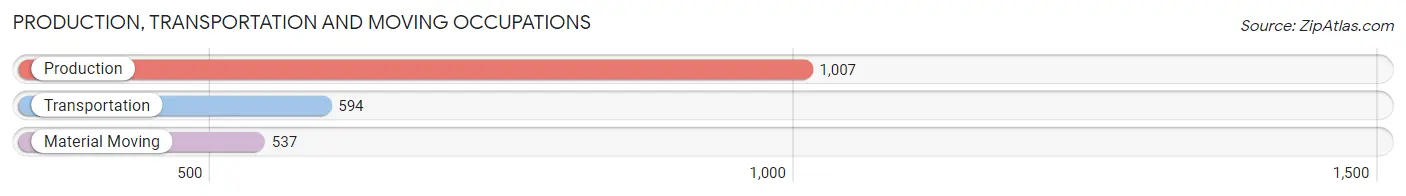
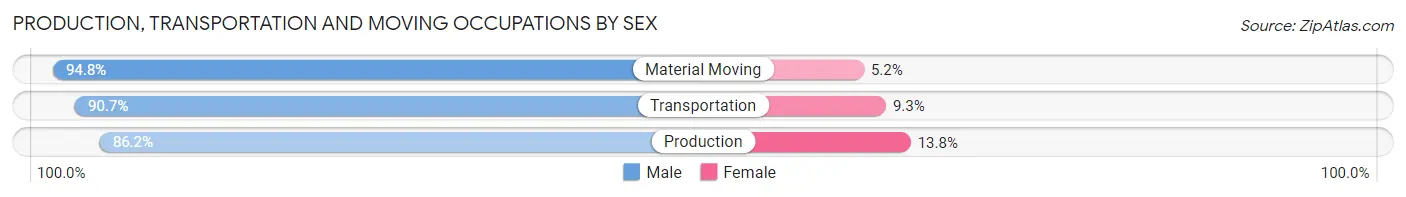
Production, Transportation and Moving Occupations
The most common Production, Transportation and Moving occupations in Texarkana are Production (1,007 | 6.7%), Transportation (594 | 4.0%), and Material Moving (537 | 3.6%).
Production, Transportation and Moving Occupations by Sex
| Occupation | Male | Female |
| Production | 868 (86.2%) | 139 (13.8%) |
| Transportation | 539 (90.7%) | 55 (9.3%) |
| Material Moving | 509 (94.8%) | 28 (5.2%) |
| Total (Category) | 1,916 (89.6%) | 222 (10.4%) |
| Total (Overall) | 7,548 (50.4%) | 7,436 (49.6%) |
Employment Industries by Sex in Texarkana
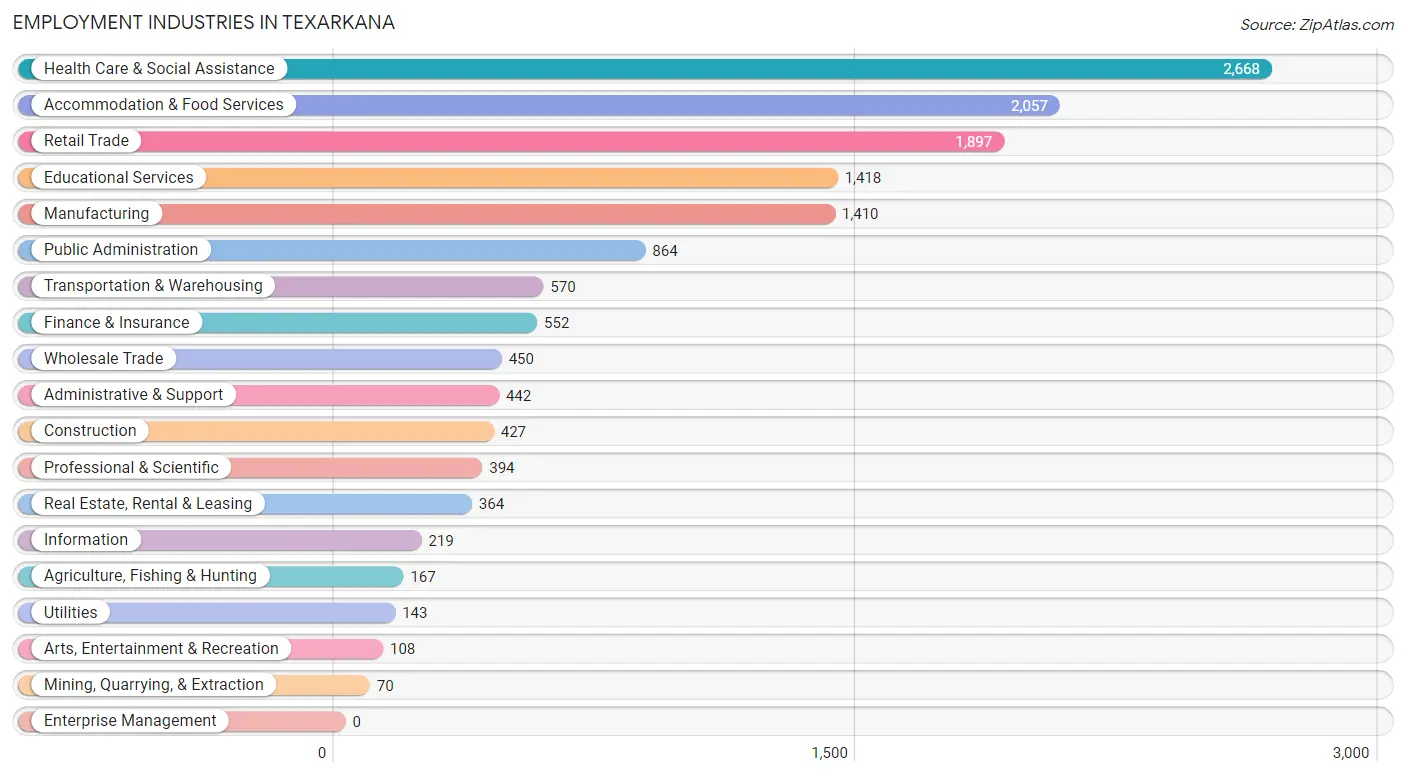
Employment Industries in Texarkana
The major employment industries in Texarkana include Health Care & Social Assistance (2,668 | 17.8%), Accommodation & Food Services (2,057 | 13.7%), Retail Trade (1,897 | 12.7%), Educational Services (1,418 | 9.5%), and Manufacturing (1,410 | 9.4%).
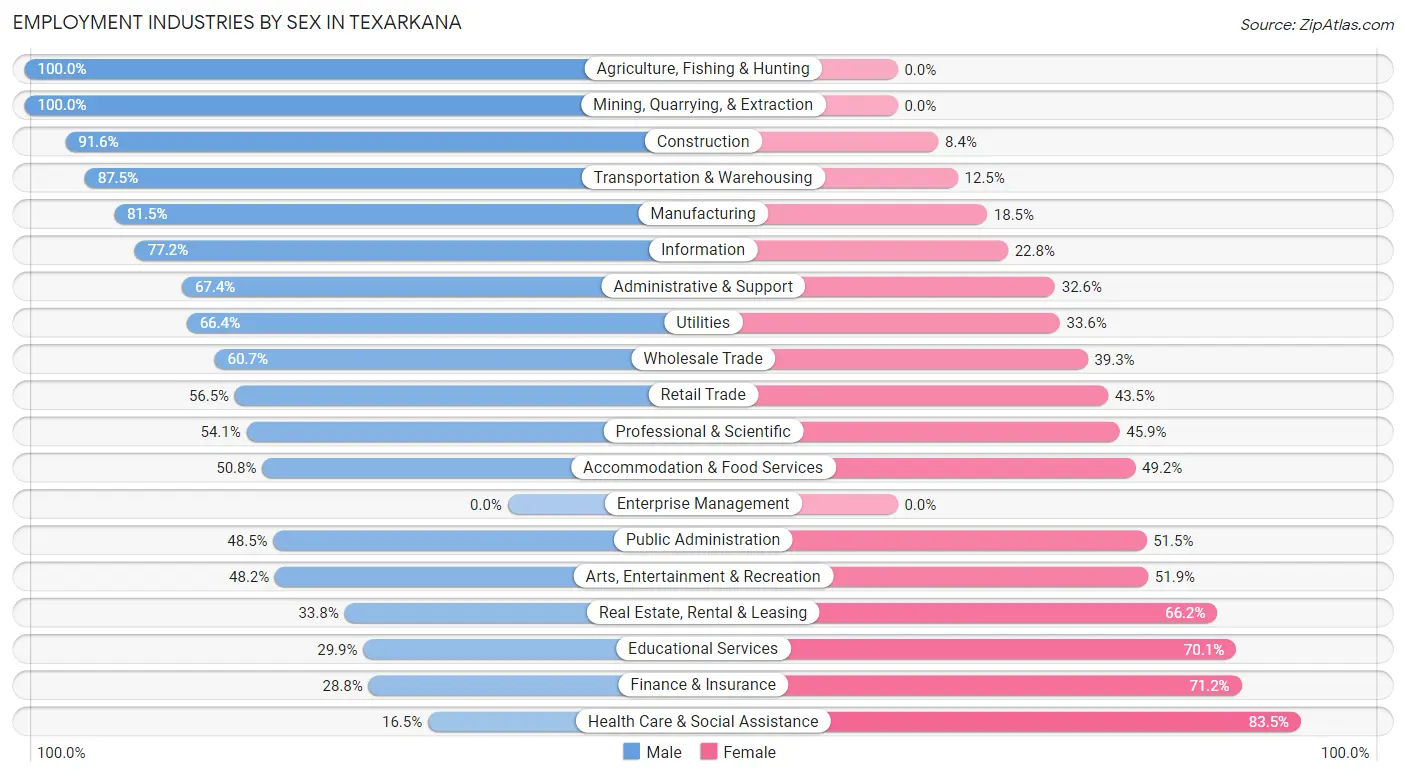
Employment Industries by Sex in Texarkana
The Texarkana industries that see more men than women are Agriculture, Fishing & Hunting (100.0%), Mining, Quarrying, & Extraction (100.0%), and Construction (91.6%), whereas the industries that tend to have a higher number of women are Health Care & Social Assistance (83.5%), Finance & Insurance (71.2%), and Educational Services (70.1%).
| Industry | Male | Female |
| Agriculture, Fishing & Hunting | 167 (100.0%) | 0 (0.0%) |
| Mining, Quarrying, & Extraction | 70 (100.0%) | 0 (0.0%) |
| Construction | 391 (91.6%) | 36 (8.4%) |
| Manufacturing | 1,149 (81.5%) | 261 (18.5%) |
| Wholesale Trade | 273 (60.7%) | 177 (39.3%) |
| Retail Trade | 1,071 (56.5%) | 826 (43.5%) |
| Transportation & Warehousing | 499 (87.5%) | 71 (12.5%) |
| Utilities | 95 (66.4%) | 48 (33.6%) |
| Information | 169 (77.2%) | 50 (22.8%) |
| Finance & Insurance | 159 (28.8%) | 393 (71.2%) |
| Real Estate, Rental & Leasing | 123 (33.8%) | 241 (66.2%) |
| Professional & Scientific | 213 (54.1%) | 181 (45.9%) |
| Enterprise Management | 0 (0.0%) | 0 (0.0%) |
| Administrative & Support | 298 (67.4%) | 144 (32.6%) |
| Educational Services | 424 (29.9%) | 994 (70.1%) |
| Health Care & Social Assistance | 440 (16.5%) | 2,228 (83.5%) |
| Arts, Entertainment & Recreation | 52 (48.1%) | 56 (51.8%) |
| Accommodation & Food Services | 1,045 (50.8%) | 1,012 (49.2%) |
| Public Administration | 419 (48.5%) | 445 (51.5%) |
| Total | 7,548 (50.4%) | 7,436 (49.6%) |
Education in Texarkana
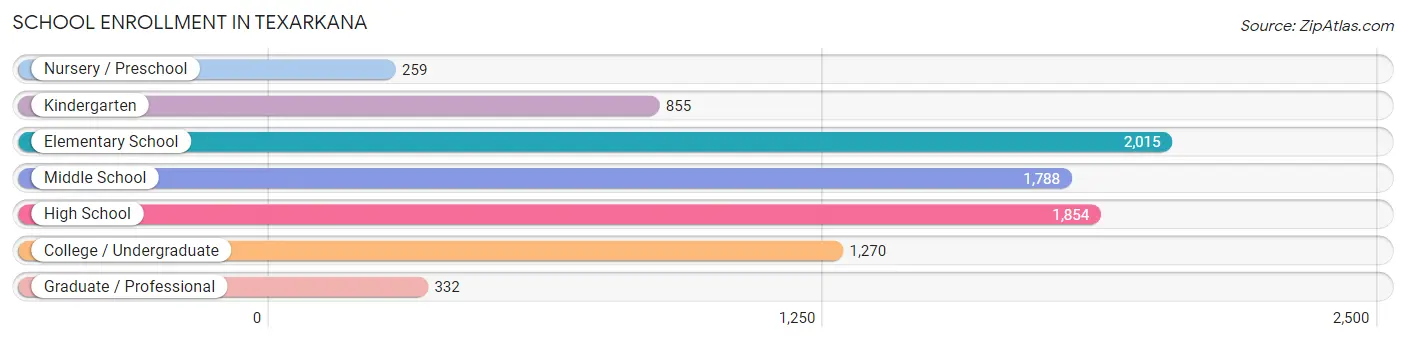
School Enrollment in Texarkana
The most common levels of schooling among the 8,373 students in Texarkana are elementary school (2,015 | 24.1%), high school (1,854 | 22.1%), and middle school (1,788 | 21.3%).
| School Level | # Students | % Students |
| Nursery / Preschool | 259 | 3.1% |
| Kindergarten | 855 | 10.2% |
| Elementary School | 2,015 | 24.1% |
| Middle School | 1,788 | 21.3% |
| High School | 1,854 | 22.1% |
| College / Undergraduate | 1,270 | 15.2% |
| Graduate / Professional | 332 | 4.0% |
| Total | 8,373 | 100.0% |
School Enrollment by Age by Funding Source in Texarkana
Out of a total of 8,373 students who are enrolled in schools in Texarkana, 787 (9.4%) attend a private institution, while the remaining 7,586 (90.6%) are enrolled in public schools. The age group of 20 to 24 year olds has the highest likelihood of being enrolled in private schools, with 121 (19.6% in the age bracket) enrolled. Conversely, the age group of 5 to 9 year old has the lowest likelihood of being enrolled in a private school, with 2,356 (94.4% in the age bracket) attending a public institution.
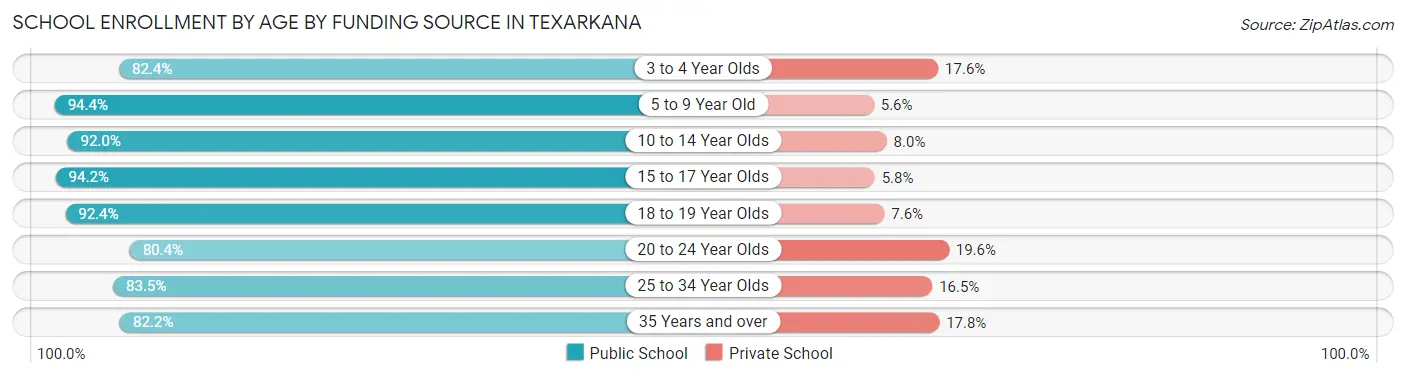
| Age Bracket | Public School | Private School |
| 3 to 4 Year Olds | 323 (82.4%) | 69 (17.6%) |
| 5 to 9 Year Old | 2,356 (94.4%) | 140 (5.6%) |
| 10 to 14 Year Olds | 1,976 (92.0%) | 172 (8.0%) |
| 15 to 17 Year Olds | 1,205 (94.2%) | 74 (5.8%) |
| 18 to 19 Year Olds | 378 (92.4%) | 31 (7.6%) |
| 20 to 24 Year Olds | 497 (80.4%) | 121 (19.6%) |
| 25 to 34 Year Olds | 476 (83.5%) | 94 (16.5%) |
| 35 Years and over | 379 (82.2%) | 82 (17.8%) |
| Total | 7,586 (90.6%) | 787 (9.4%) |
Educational Attainment by Field of Study in Texarkana
Education (1,243 | 20.7%), business (1,146 | 19.1%), science & technology (767 | 12.8%), bio, nature & agricultural (470 | 7.9%), and arts & humanities (388 | 6.5%) are the most common fields of study among 5,991 individuals in Texarkana who have obtained a bachelor's degree or higher.
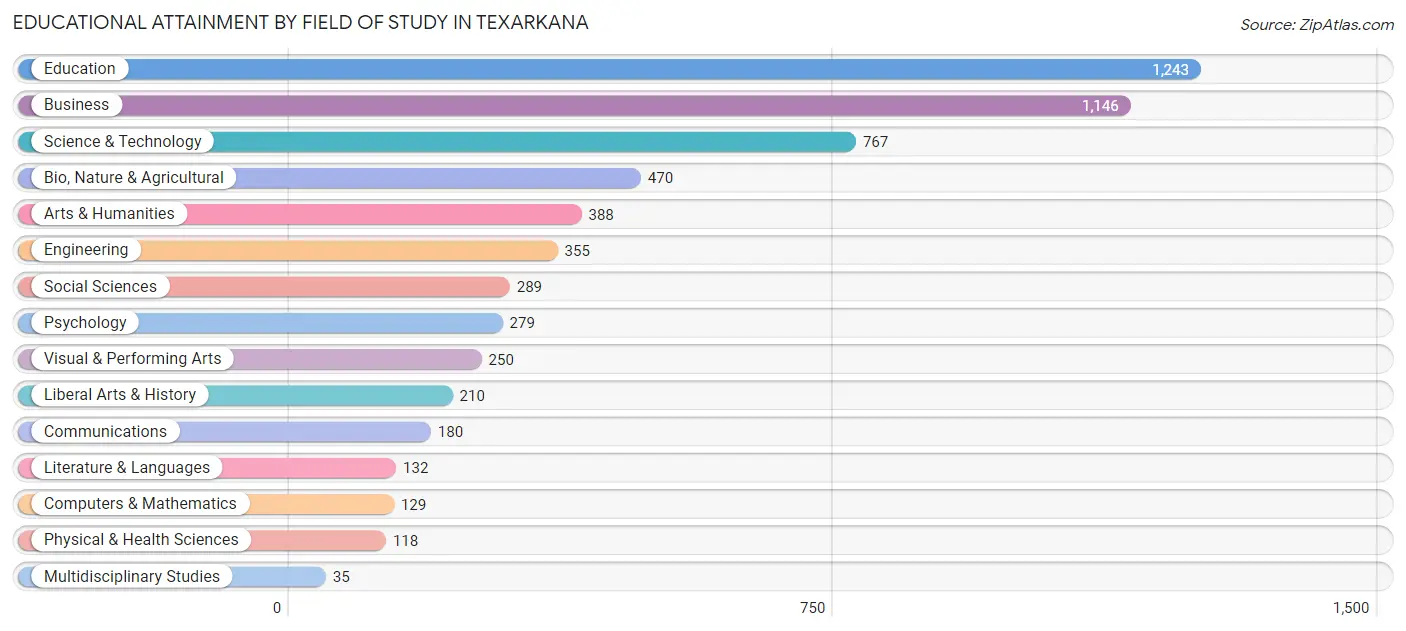
| Field of Study | # Graduates | % Graduates |
| Computers & Mathematics | 129 | 2.1% |
| Bio, Nature & Agricultural | 470 | 7.9% |
| Physical & Health Sciences | 118 | 2.0% |
| Psychology | 279 | 4.7% |
| Social Sciences | 289 | 4.8% |
| Engineering | 355 | 5.9% |
| Multidisciplinary Studies | 35 | 0.6% |
| Science & Technology | 767 | 12.8% |
| Business | 1,146 | 19.1% |
| Education | 1,243 | 20.7% |
| Literature & Languages | 132 | 2.2% |
| Liberal Arts & History | 210 | 3.5% |
| Visual & Performing Arts | 250 | 4.2% |
| Communications | 180 | 3.0% |
| Arts & Humanities | 388 | 6.5% |
| Total | 5,991 | 100.0% |
Transportation & Commute in Texarkana
Vehicle Availability by Sex in Texarkana
The most prevalent vehicle ownership categories in Texarkana are males with 2 vehicles (3,467, accounting for 46.0%) and females with 2 vehicles (3,117, making up 47.0%).
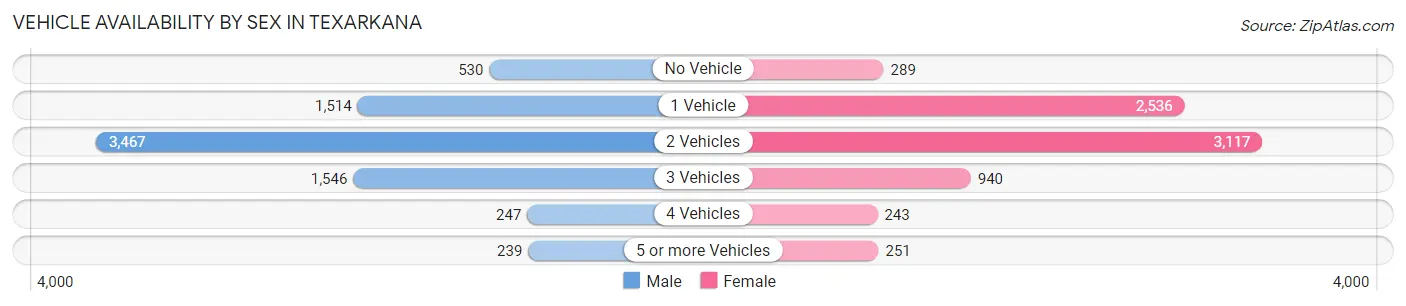
| Vehicles Available | Male | Female |
| No Vehicle | 530 (7.0%) | 289 (3.9%) |
| 1 Vehicle | 1,514 (20.1%) | 2,536 (34.4%) |
| 2 Vehicles | 3,467 (46.0%) | 3,117 (42.3%) |
| 3 Vehicles | 1,546 (20.5%) | 940 (12.7%) |
| 4 Vehicles | 247 (3.3%) | 243 (3.3%) |
| 5 or more Vehicles | 239 (3.2%) | 251 (3.4%) |
| Total | 7,543 (100.0%) | 7,376 (100.0%) |
Commute Time in Texarkana
The most frequently occuring commute durations in Texarkana are 10 to 14 minutes (5,395 commuters, 38.0%), 5 to 9 minutes (2,960 commuters, 20.8%), and 15 to 19 minutes (1,692 commuters, 11.9%).
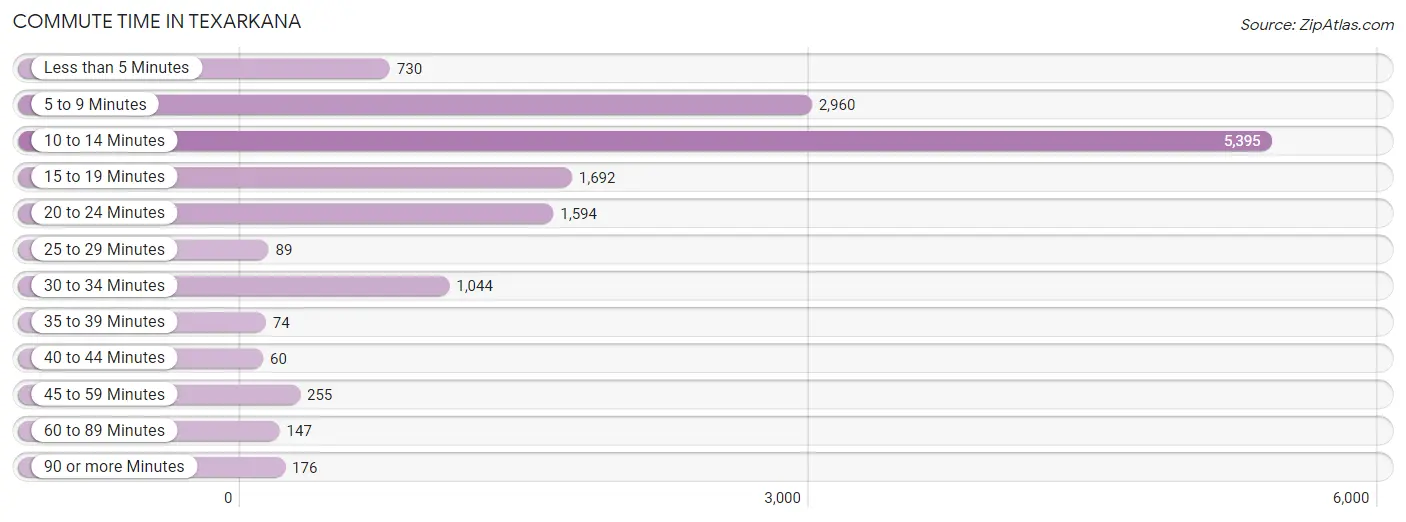
| Commute Time | # Commuters | % Commuters |
| Less than 5 Minutes | 730 | 5.1% |
| 5 to 9 Minutes | 2,960 | 20.8% |
| 10 to 14 Minutes | 5,395 | 38.0% |
| 15 to 19 Minutes | 1,692 | 11.9% |
| 20 to 24 Minutes | 1,594 | 11.2% |
| 25 to 29 Minutes | 89 | 0.6% |
| 30 to 34 Minutes | 1,044 | 7.3% |
| 35 to 39 Minutes | 74 | 0.5% |
| 40 to 44 Minutes | 60 | 0.4% |
| 45 to 59 Minutes | 255 | 1.8% |
| 60 to 89 Minutes | 147 | 1.0% |
| 90 or more Minutes | 176 | 1.2% |
Commute Time by Sex in Texarkana
The most common commute times in Texarkana are 10 to 14 minutes (2,425 commuters, 33.4%) for males and 10 to 14 minutes (2,970 commuters, 42.7%) for females.
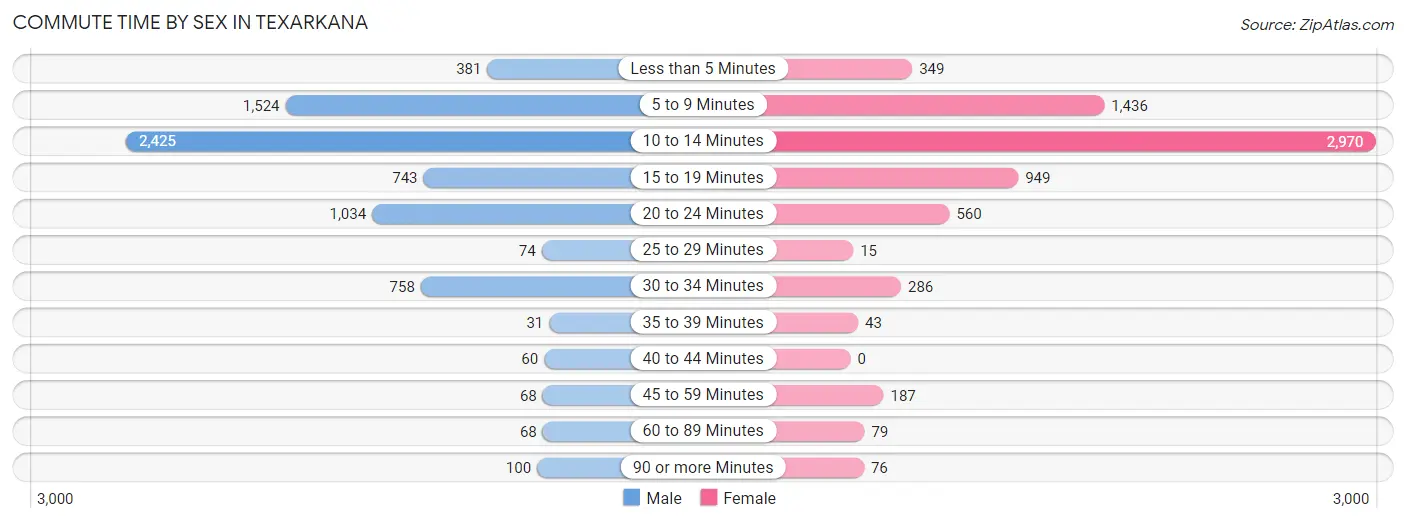
| Commute Time | Male | Female |
| Less than 5 Minutes | 381 (5.2%) | 349 (5.0%) |
| 5 to 9 Minutes | 1,524 (21.0%) | 1,436 (20.7%) |
| 10 to 14 Minutes | 2,425 (33.4%) | 2,970 (42.7%) |
| 15 to 19 Minutes | 743 (10.2%) | 949 (13.7%) |
| 20 to 24 Minutes | 1,034 (14.2%) | 560 (8.1%) |
| 25 to 29 Minutes | 74 (1.0%) | 15 (0.2%) |
| 30 to 34 Minutes | 758 (10.4%) | 286 (4.1%) |
| 35 to 39 Minutes | 31 (0.4%) | 43 (0.6%) |
| 40 to 44 Minutes | 60 (0.8%) | 0 (0.0%) |
| 45 to 59 Minutes | 68 (0.9%) | 187 (2.7%) |
| 60 to 89 Minutes | 68 (0.9%) | 79 (1.1%) |
| 90 or more Minutes | 100 (1.4%) | 76 (1.1%) |
Time of Departure to Work by Sex in Texarkana
The most frequent times of departure to work in Texarkana are 7:00 AM to 7:29 AM (1,269, 17.5%) for males and 7:30 AM to 7:59 AM (1,142, 16.4%) for females.
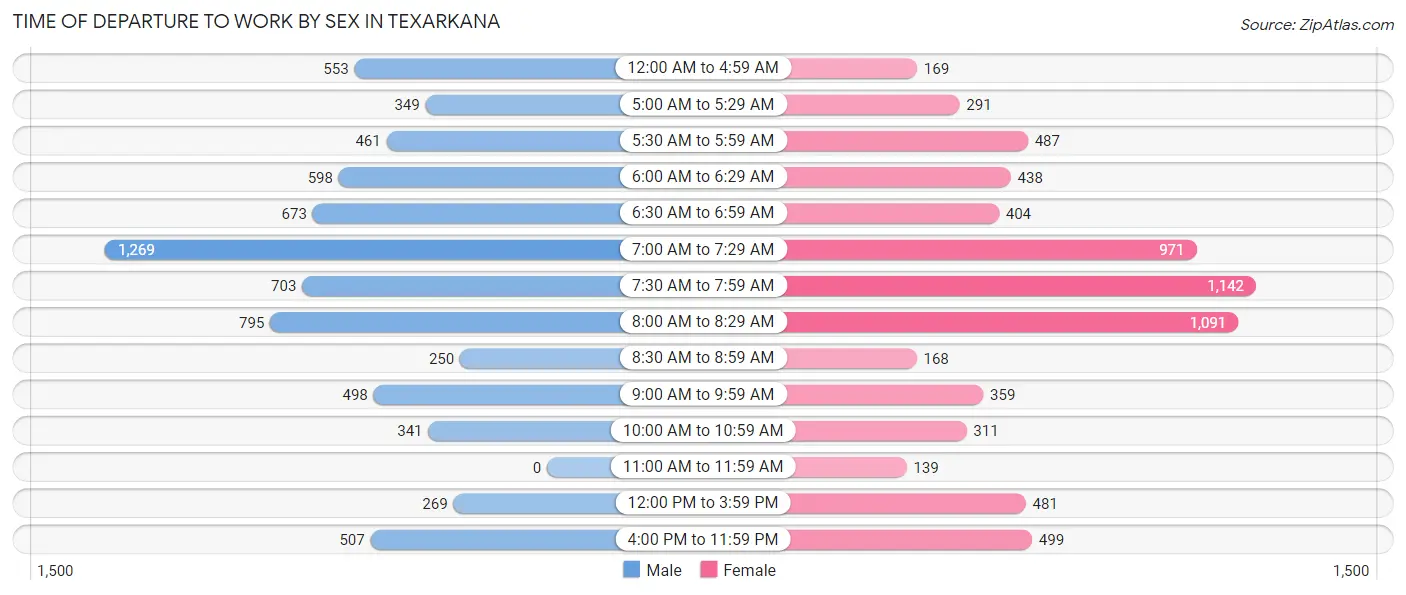
| Time of Departure | Male | Female |
| 12:00 AM to 4:59 AM | 553 (7.6%) | 169 (2.4%) |
| 5:00 AM to 5:29 AM | 349 (4.8%) | 291 (4.2%) |
| 5:30 AM to 5:59 AM | 461 (6.3%) | 487 (7.0%) |
| 6:00 AM to 6:29 AM | 598 (8.2%) | 438 (6.3%) |
| 6:30 AM to 6:59 AM | 673 (9.3%) | 404 (5.8%) |
| 7:00 AM to 7:29 AM | 1,269 (17.5%) | 971 (14.0%) |
| 7:30 AM to 7:59 AM | 703 (9.7%) | 1,142 (16.4%) |
| 8:00 AM to 8:29 AM | 795 (10.9%) | 1,091 (15.7%) |
| 8:30 AM to 8:59 AM | 250 (3.4%) | 168 (2.4%) |
| 9:00 AM to 9:59 AM | 498 (6.9%) | 359 (5.2%) |
| 10:00 AM to 10:59 AM | 341 (4.7%) | 311 (4.5%) |
| 11:00 AM to 11:59 AM | 0 (0.0%) | 139 (2.0%) |
| 12:00 PM to 3:59 PM | 269 (3.7%) | 481 (6.9%) |
| 4:00 PM to 11:59 PM | 507 (7.0%) | 499 (7.2%) |
| Total | 7,266 (100.0%) | 6,950 (100.0%) |
Housing Occupancy in Texarkana
Occupancy by Ownership in Texarkana
Of the total 14,295 dwellings in Texarkana, owner-occupied units account for 7,244 (50.7%), while renter-occupied units make up 7,051 (49.3%).
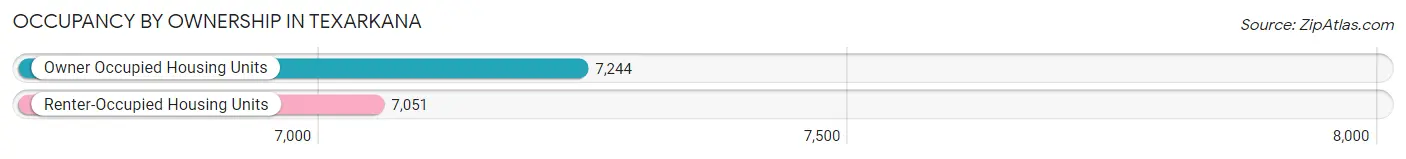
| Occupancy | # Housing Units | % Housing Units |
| Owner Occupied Housing Units | 7,244 | 50.7% |
| Renter-Occupied Housing Units | 7,051 | 49.3% |
| Total Occupied Housing Units | 14,295 | 100.0% |
Occupancy by Household Size in Texarkana
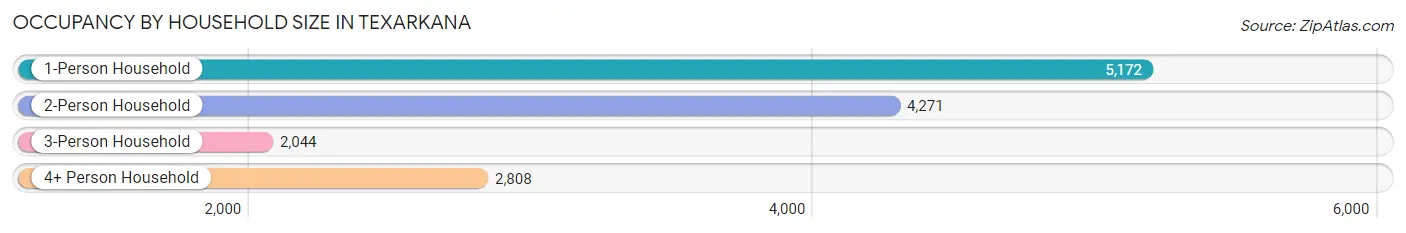
| Household Size | # Housing Units | % Housing Units |
| 1-Person Household | 5,172 | 36.2% |
| 2-Person Household | 4,271 | 29.9% |
| 3-Person Household | 2,044 | 14.3% |
| 4+ Person Household | 2,808 | 19.6% |
| Total Housing Units | 14,295 | 100.0% |
Occupancy by Ownership by Household Size in Texarkana
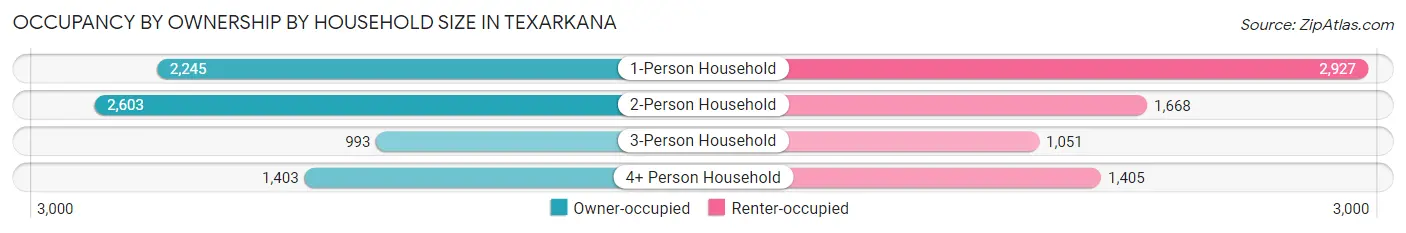
| Household Size | Owner-occupied | Renter-occupied |
| 1-Person Household | 2,245 (43.4%) | 2,927 (56.6%) |
| 2-Person Household | 2,603 (61.0%) | 1,668 (39.1%) |
| 3-Person Household | 993 (48.6%) | 1,051 (51.4%) |
| 4+ Person Household | 1,403 (50.0%) | 1,405 (50.0%) |
| Total Housing Units | 7,244 (50.7%) | 7,051 (49.3%) |
Occupancy by Educational Attainment in Texarkana
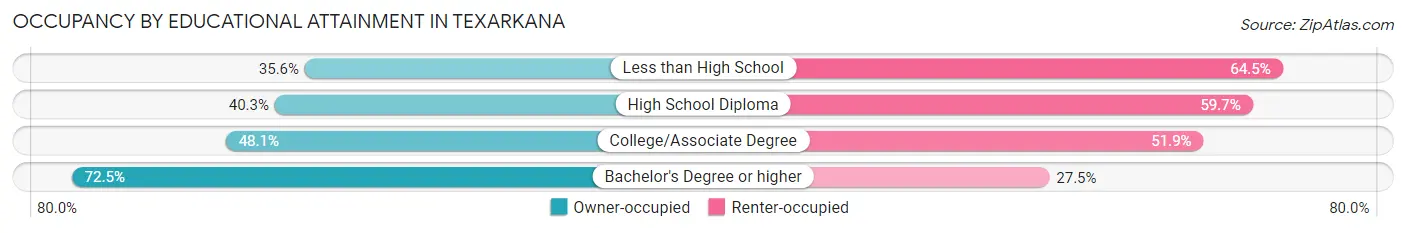
| Household Size | Owner-occupied | Renter-occupied |
| Less than High School | 497 (35.5%) | 901 (64.4%) |
| High School Diploma | 1,590 (40.3%) | 2,353 (59.7%) |
| College/Associate Degree | 2,633 (48.1%) | 2,841 (51.9%) |
| Bachelor's Degree or higher | 2,524 (72.5%) | 956 (27.5%) |
Occupancy by Age of Householder in Texarkana
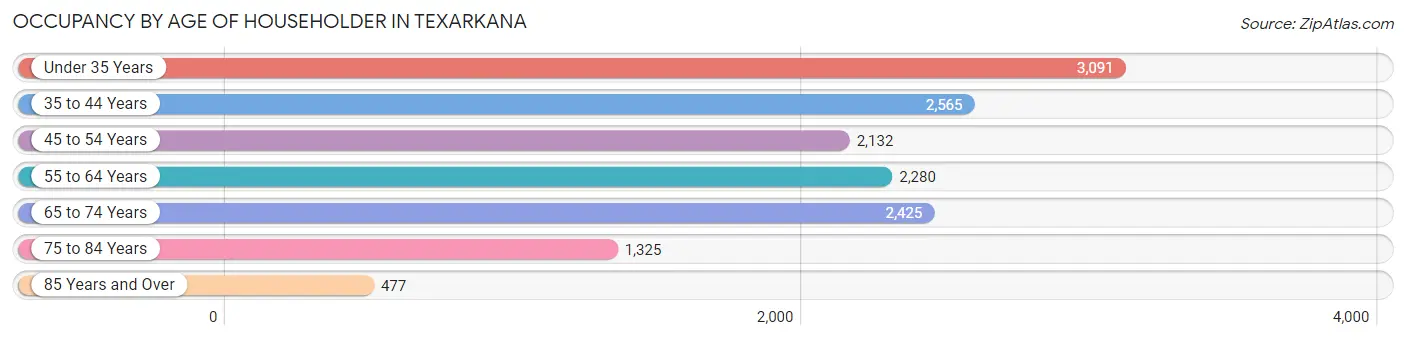
| Age Bracket | # Households | % Households |
| Under 35 Years | 3,091 | 21.6% |
| 35 to 44 Years | 2,565 | 17.9% |
| 45 to 54 Years | 2,132 | 14.9% |
| 55 to 64 Years | 2,280 | 16.0% |
| 65 to 74 Years | 2,425 | 17.0% |
| 75 to 84 Years | 1,325 | 9.3% |
| 85 Years and Over | 477 | 3.3% |
| Total | 14,295 | 100.0% |
Housing Finances in Texarkana
Median Income by Occupancy in Texarkana
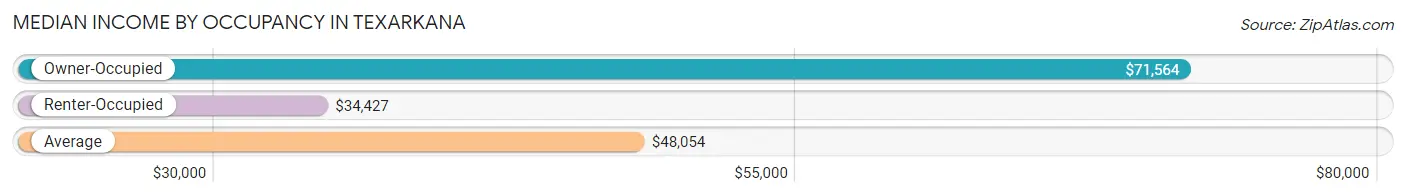
| Occupancy Type | # Households | Median Income |
| Owner-Occupied | 7,244 (50.7%) | $71,564 |
| Renter-Occupied | 7,051 (49.3%) | $34,427 |
| Average | 14,295 (100.0%) | $48,054 |
Occupancy by Householder Income Bracket in Texarkana
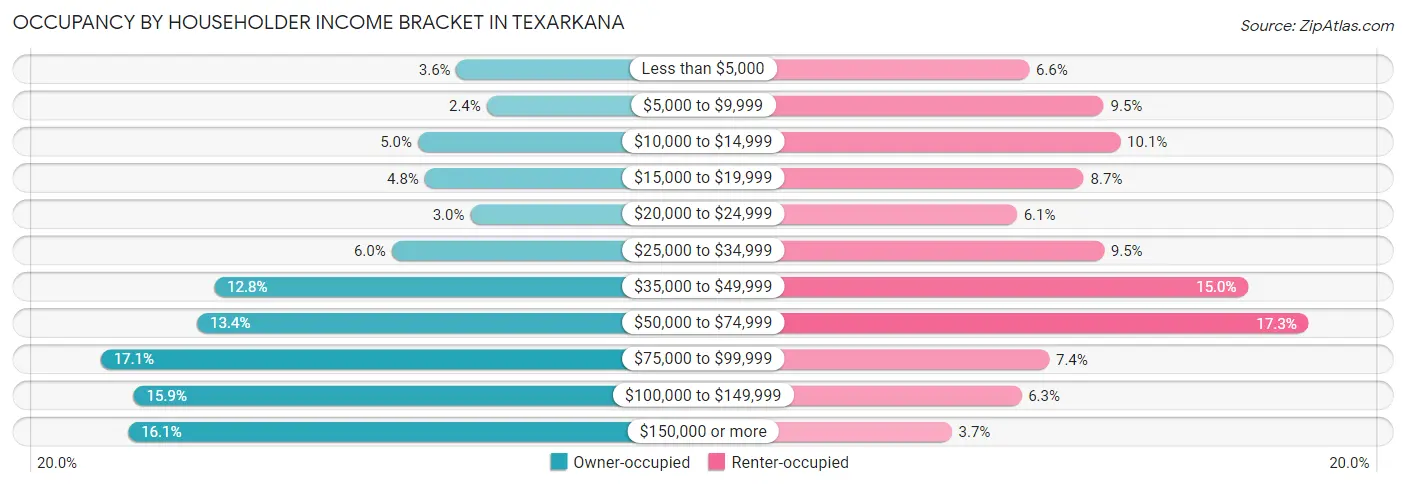
| Income Bracket | Owner-occupied | Renter-occupied |
| Less than $5,000 | 257 (3.5%) | 466 (6.6%) |
| $5,000 to $9,999 | 174 (2.4%) | 666 (9.5%) |
| $10,000 to $14,999 | 364 (5.0%) | 711 (10.1%) |
| $15,000 to $19,999 | 345 (4.8%) | 613 (8.7%) |
| $20,000 to $24,999 | 219 (3.0%) | 433 (6.1%) |
| $25,000 to $34,999 | 436 (6.0%) | 667 (9.5%) |
| $35,000 to $49,999 | 926 (12.8%) | 1,055 (15.0%) |
| $50,000 to $74,999 | 973 (13.4%) | 1,217 (17.3%) |
| $75,000 to $99,999 | 1,239 (17.1%) | 520 (7.4%) |
| $100,000 to $149,999 | 1,148 (15.9%) | 445 (6.3%) |
| $150,000 or more | 1,163 (16.1%) | 258 (3.7%) |
| Total | 7,244 (100.0%) | 7,051 (100.0%) |
Monthly Housing Cost Tiers in Texarkana
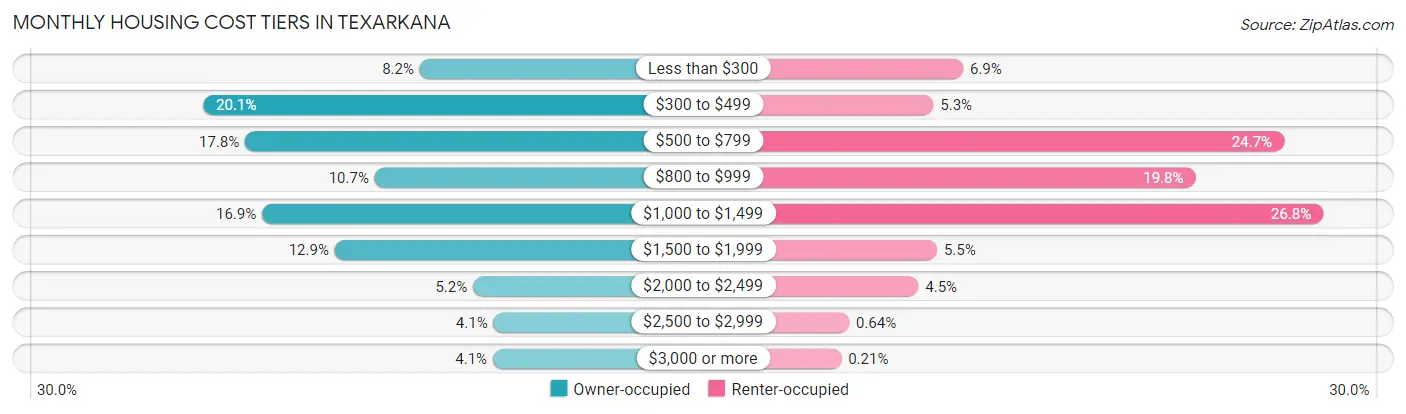
| Monthly Cost | Owner-occupied | Renter-occupied |
| Less than $300 | 592 (8.2%) | 489 (6.9%) |
| $300 to $499 | 1,459 (20.1%) | 374 (5.3%) |
| $500 to $799 | 1,291 (17.8%) | 1,739 (24.7%) |
| $800 to $999 | 772 (10.7%) | 1,394 (19.8%) |
| $1,000 to $1,499 | 1,223 (16.9%) | 1,891 (26.8%) |
| $1,500 to $1,999 | 932 (12.9%) | 388 (5.5%) |
| $2,000 to $2,499 | 379 (5.2%) | 315 (4.5%) |
| $2,500 to $2,999 | 297 (4.1%) | 45 (0.6%) |
| $3,000 or more | 299 (4.1%) | 15 (0.2%) |
| Total | 7,244 (100.0%) | 7,051 (100.0%) |
Physical Housing Characteristics in Texarkana
Housing Structures in Texarkana
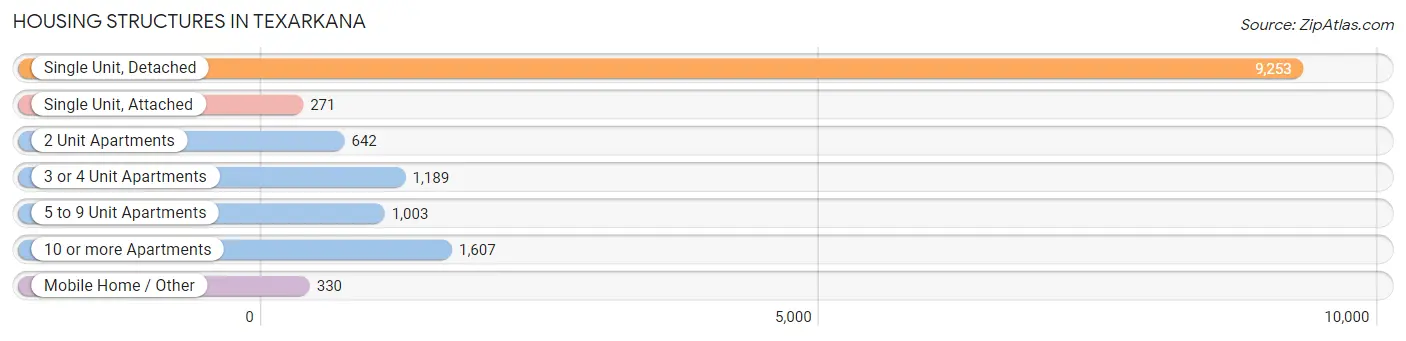
| Structure Type | # Housing Units | % Housing Units |
| Single Unit, Detached | 9,253 | 64.7% |
| Single Unit, Attached | 271 | 1.9% |
| 2 Unit Apartments | 642 | 4.5% |
| 3 or 4 Unit Apartments | 1,189 | 8.3% |
| 5 to 9 Unit Apartments | 1,003 | 7.0% |
| 10 or more Apartments | 1,607 | 11.2% |
| Mobile Home / Other | 330 | 2.3% |
| Total | 14,295 | 100.0% |
Housing Structures by Occupancy in Texarkana
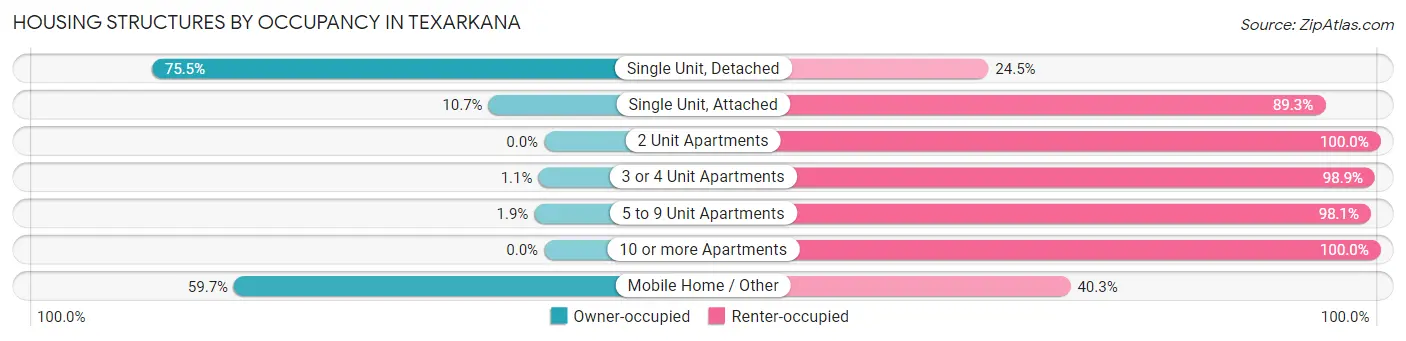
| Structure Type | Owner-occupied | Renter-occupied |
| Single Unit, Detached | 6,986 (75.5%) | 2,267 (24.5%) |
| Single Unit, Attached | 29 (10.7%) | 242 (89.3%) |
| 2 Unit Apartments | 0 (0.0%) | 642 (100.0%) |
| 3 or 4 Unit Apartments | 13 (1.1%) | 1,176 (98.9%) |
| 5 to 9 Unit Apartments | 19 (1.9%) | 984 (98.1%) |
| 10 or more Apartments | 0 (0.0%) | 1,607 (100.0%) |
| Mobile Home / Other | 197 (59.7%) | 133 (40.3%) |
| Total | 7,244 (50.7%) | 7,051 (49.3%) |
Housing Structures by Number of Rooms in Texarkana
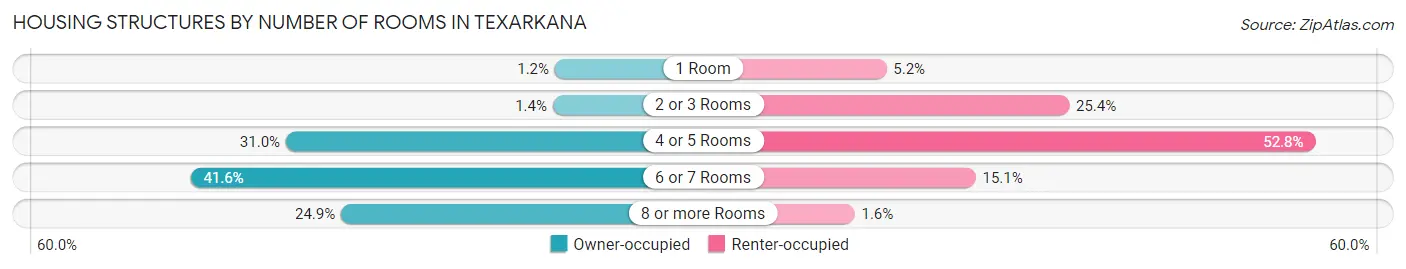
| Number of Rooms | Owner-occupied | Renter-occupied |
| 1 Room | 83 (1.1%) | 363 (5.1%) |
| 2 or 3 Rooms | 100 (1.4%) | 1,793 (25.4%) |
| 4 or 5 Rooms | 2,246 (31.0%) | 3,720 (52.8%) |
| 6 or 7 Rooms | 3,013 (41.6%) | 1,061 (15.0%) |
| 8 or more Rooms | 1,802 (24.9%) | 114 (1.6%) |
| Total | 7,244 (100.0%) | 7,051 (100.0%) |
Housing Structure by Heating Type in Texarkana
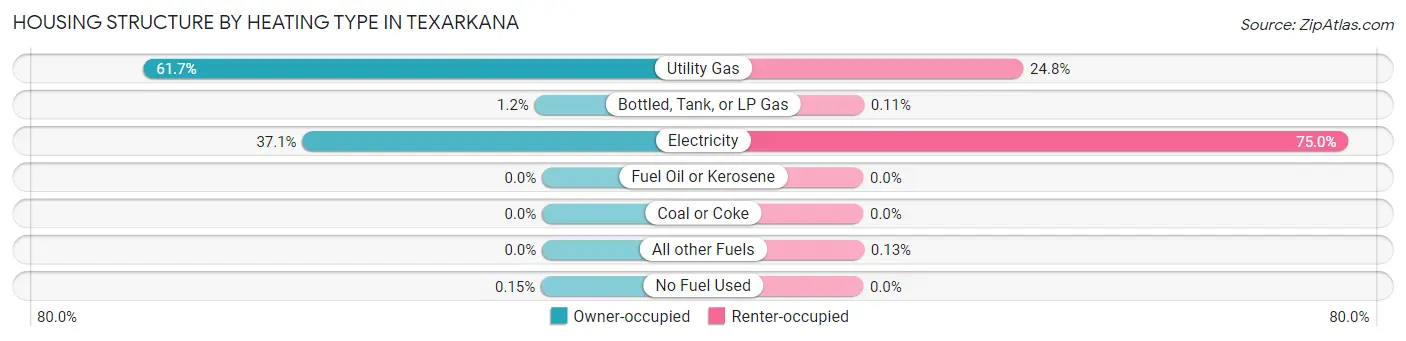
| Heating Type | Owner-occupied | Renter-occupied |
| Utility Gas | 4,466 (61.7%) | 1,745 (24.7%) |
| Bottled, Tank, or LP Gas | 83 (1.1%) | 8 (0.1%) |
| Electricity | 2,684 (37.0%) | 5,289 (75.0%) |
| Fuel Oil or Kerosene | 0 (0.0%) | 0 (0.0%) |
| Coal or Coke | 0 (0.0%) | 0 (0.0%) |
| All other Fuels | 0 (0.0%) | 9 (0.1%) |
| No Fuel Used | 11 (0.2%) | 0 (0.0%) |
| Total | 7,244 (100.0%) | 7,051 (100.0%) |
Household Vehicle Usage in Texarkana
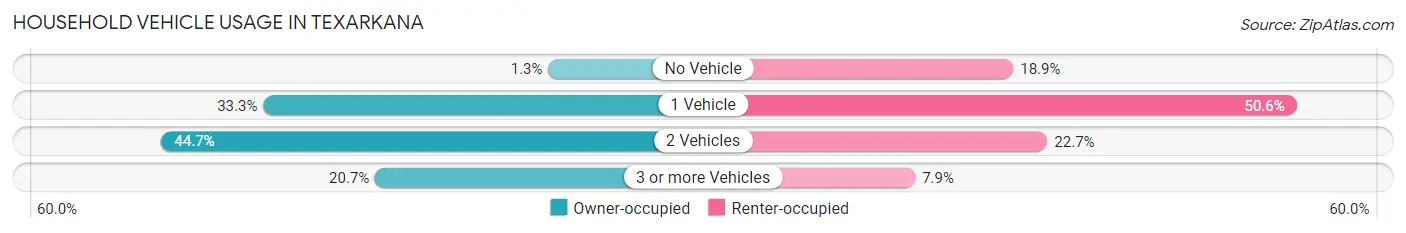
| Vehicles per Household | Owner-occupied | Renter-occupied |
| No Vehicle | 96 (1.3%) | 1,330 (18.9%) |
| 1 Vehicle | 2,410 (33.3%) | 3,567 (50.6%) |
| 2 Vehicles | 3,236 (44.7%) | 1,599 (22.7%) |
| 3 or more Vehicles | 1,502 (20.7%) | 555 (7.9%) |
| Total | 7,244 (100.0%) | 7,051 (100.0%) |
Real Estate & Mortgages in Texarkana
Real Estate and Mortgage Overview in Texarkana
| Characteristic | Without Mortgage | With Mortgage |
| Housing Units | 3,779 | 3,465 |
| Median Property Value | $134,600 | $175,300 |
| Median Household Income | $57,051 | $669 |
| Monthly Housing Costs | $477 | $299 |
| Real Estate Taxes | $1,489 | $108 |
Property Value by Mortgage Status in Texarkana
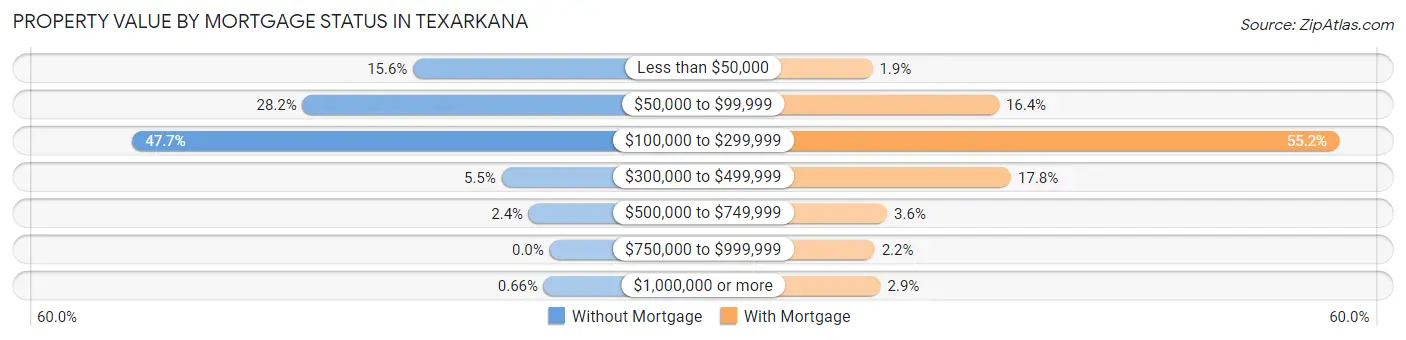
| Property Value | Without Mortgage | With Mortgage |
| Less than $50,000 | 589 (15.6%) | 67 (1.9%) |
| $50,000 to $99,999 | 1,067 (28.2%) | 568 (16.4%) |
| $100,000 to $299,999 | 1,802 (47.7%) | 1,914 (55.2%) |
| $300,000 to $499,999 | 207 (5.5%) | 616 (17.8%) |
| $500,000 to $749,999 | 89 (2.4%) | 125 (3.6%) |
| $750,000 to $999,999 | 0 (0.0%) | 76 (2.2%) |
| $1,000,000 or more | 25 (0.7%) | 99 (2.9%) |
| Total | 3,779 (100.0%) | 3,465 (100.0%) |
Household Income by Mortgage Status in Texarkana
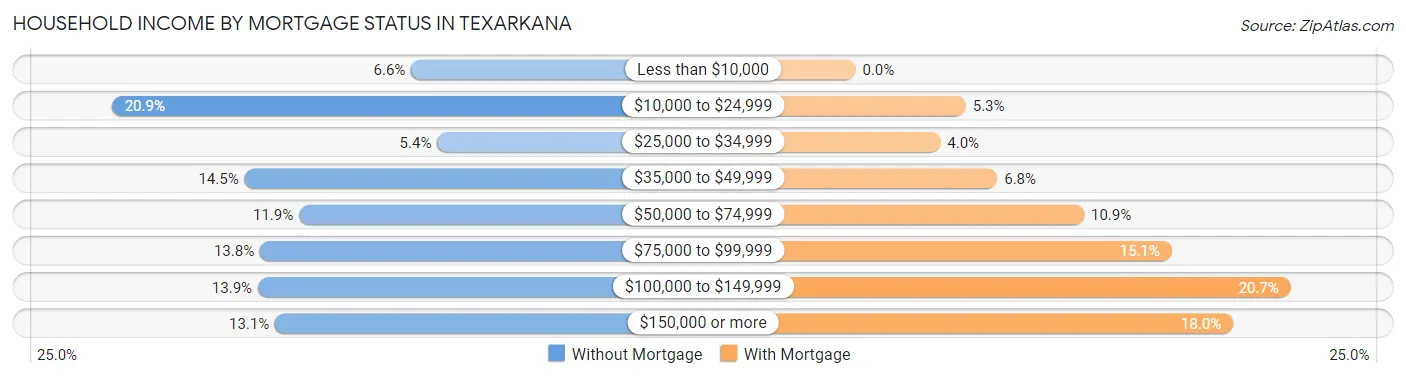
| Household Income | Without Mortgage | With Mortgage |
| Less than $10,000 | 249 (6.6%) | 0 (0.0%) |
| $10,000 to $24,999 | 788 (20.8%) | 182 (5.2%) |
| $25,000 to $34,999 | 202 (5.3%) | 140 (4.0%) |
| $35,000 to $49,999 | 549 (14.5%) | 234 (6.8%) |
| $50,000 to $74,999 | 451 (11.9%) | 377 (10.9%) |
| $75,000 to $99,999 | 521 (13.8%) | 522 (15.1%) |
| $100,000 to $149,999 | 525 (13.9%) | 718 (20.7%) |
| $150,000 or more | 494 (13.1%) | 623 (18.0%) |
| Total | 3,779 (100.0%) | 3,465 (100.0%) |
Property Value to Household Income Ratio in Texarkana
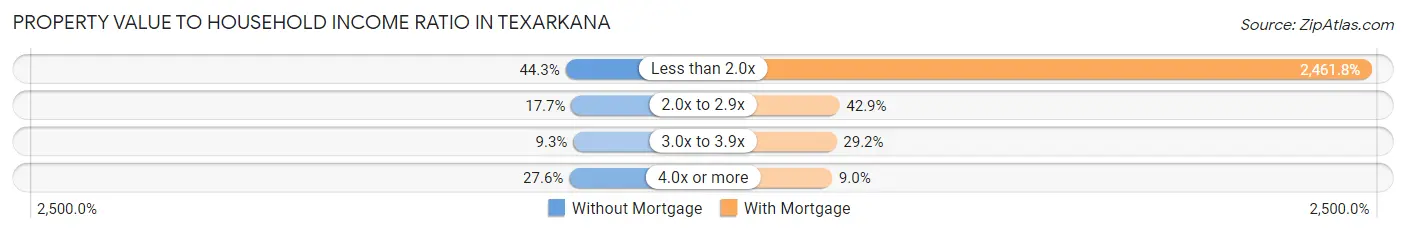
| Value-to-Income Ratio | Without Mortgage | With Mortgage |
| Less than 2.0x | 1,673 (44.3%) | 85,301 (2,461.8%) |
| 2.0x to 2.9x | 670 (17.7%) | 1,488 (42.9%) |
| 3.0x to 3.9x | 350 (9.3%) | 1,010 (29.1%) |
| 4.0x or more | 1,044 (27.6%) | 312 (9.0%) |
| Total | 3,779 (100.0%) | 3,465 (100.0%) |
Real Estate Taxes by Mortgage Status in Texarkana
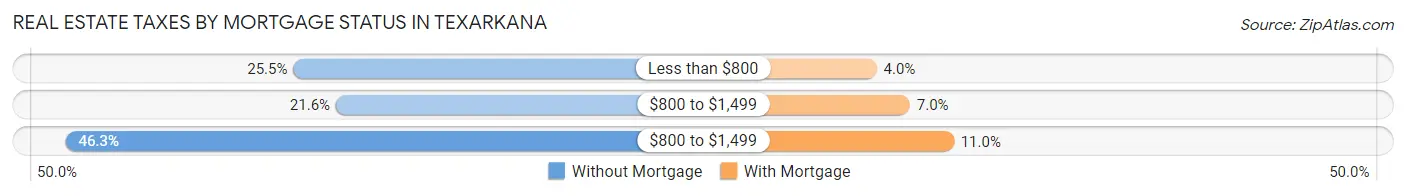
| Property Taxes | Without Mortgage | With Mortgage |
| Less than $800 | 962 (25.5%) | 138 (4.0%) |
| $800 to $1,499 | 815 (21.6%) | 243 (7.0%) |
| $800 to $1,499 | 1,748 (46.3%) | 382 (11.0%) |
| Total | 3,779 (100.0%) | 3,465 (100.0%) |
Health & Disability in Texarkana
Health Insurance Coverage by Age in Texarkana
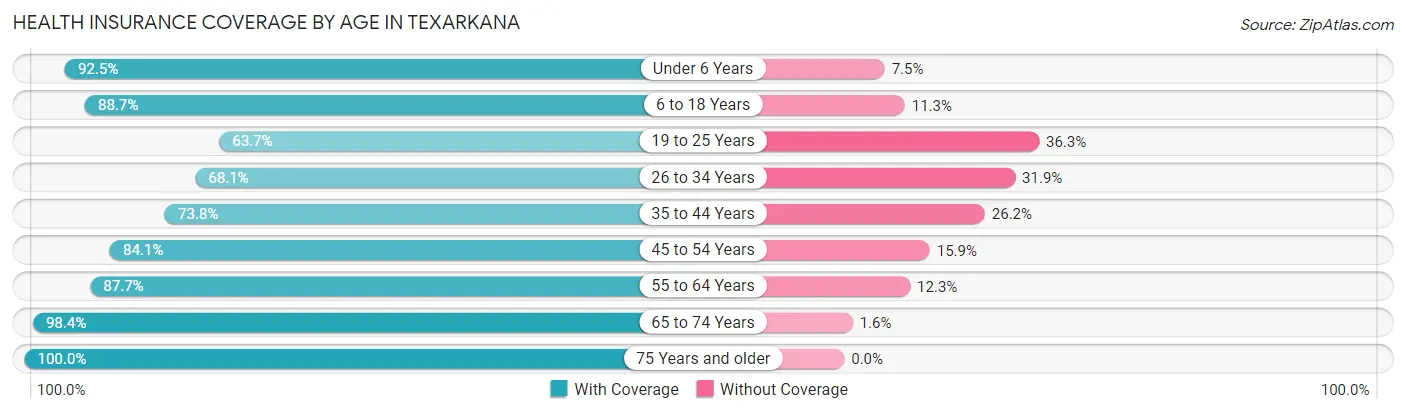
| Age Bracket | With Coverage | Without Coverage |
| Under 6 Years | 2,650 (92.5%) | 216 (7.5%) |
| 6 to 18 Years | 5,470 (88.7%) | 696 (11.3%) |
| 19 to 25 Years | 2,066 (63.7%) | 1,178 (36.3%) |
| 26 to 34 Years | 2,857 (68.1%) | 1,336 (31.9%) |
| 35 to 44 Years | 3,423 (73.8%) | 1,216 (26.2%) |
| 45 to 54 Years | 3,154 (84.1%) | 598 (15.9%) |
| 55 to 64 Years | 3,536 (87.7%) | 495 (12.3%) |
| 65 to 74 Years | 3,313 (98.4%) | 53 (1.6%) |
| 75 Years and older | 2,349 (100.0%) | 0 (0.0%) |
| Total | 28,818 (83.3%) | 5,788 (16.7%) |
Health Insurance Coverage by Citizenship Status in Texarkana

| Citizenship Status | With Coverage | Without Coverage |
| Native Born | 2,650 (92.5%) | 216 (7.5%) |
| Foreign Born, Citizen | 5,470 (88.7%) | 696 (11.3%) |
| Foreign Born, not a Citizen | 2,066 (63.7%) | 1,178 (36.3%) |
Health Insurance Coverage by Household Income in Texarkana
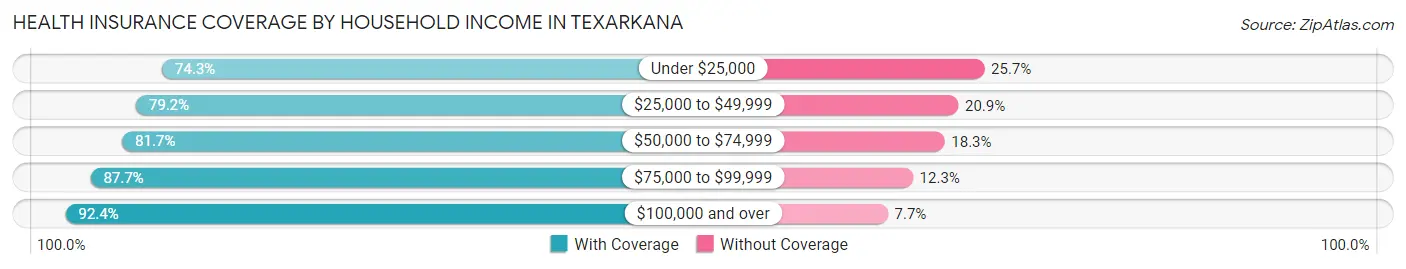
| Household Income | With Coverage | Without Coverage |
| Under $25,000 | 5,739 (74.3%) | 1,988 (25.7%) |
| $25,000 to $49,999 | 4,807 (79.1%) | 1,266 (20.8%) |
| $50,000 to $74,999 | 4,975 (81.7%) | 1,113 (18.3%) |
| $75,000 to $99,999 | 4,790 (87.7%) | 674 (12.3%) |
| $100,000 and over | 8,389 (92.3%) | 695 (7.6%) |
Public vs Private Health Insurance Coverage by Age in Texarkana
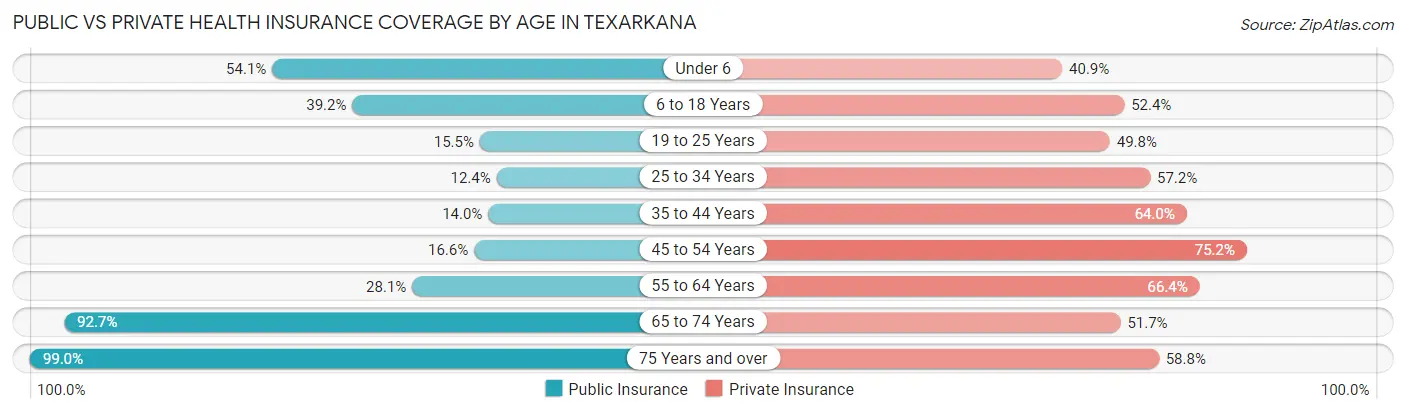
| Age Bracket | Public Insurance | Private Insurance |
| Under 6 | 1,549 (54.0%) | 1,172 (40.9%) |
| 6 to 18 Years | 2,415 (39.2%) | 3,232 (52.4%) |
| 19 to 25 Years | 503 (15.5%) | 1,614 (49.7%) |
| 25 to 34 Years | 520 (12.4%) | 2,399 (57.2%) |
| 35 to 44 Years | 647 (14.0%) | 2,970 (64.0%) |
| 45 to 54 Years | 622 (16.6%) | 2,820 (75.2%) |
| 55 to 64 Years | 1,131 (28.1%) | 2,677 (66.4%) |
| 65 to 74 Years | 3,119 (92.7%) | 1,741 (51.7%) |
| 75 Years and over | 2,326 (99.0%) | 1,382 (58.8%) |
| Total | 12,832 (37.1%) | 20,007 (57.8%) |
Disability Status by Sex by Age in Texarkana
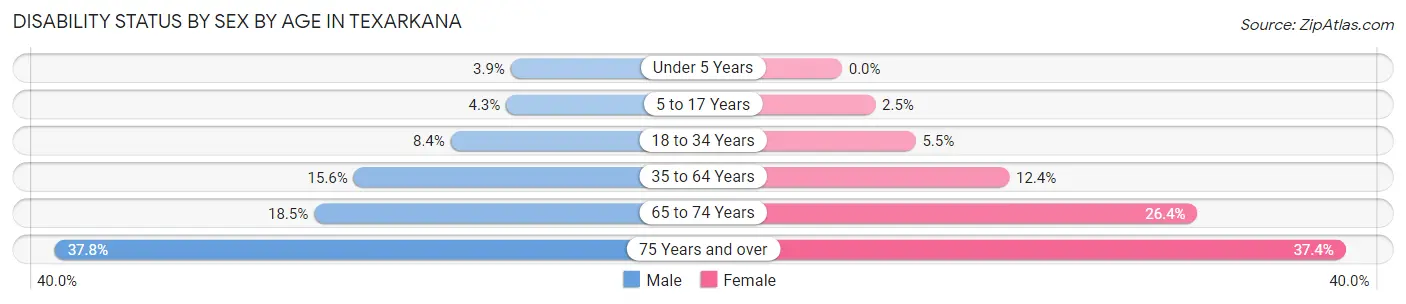
| Age Bracket | Male | Female |
| Under 5 Years | 49 (3.9%) | 0 (0.0%) |
| 5 to 17 Years | 127 (4.3%) | 77 (2.5%) |
| 18 to 34 Years | 344 (8.4%) | 208 (5.5%) |
| 35 to 64 Years | 895 (15.6%) | 829 (12.4%) |
| 65 to 74 Years | 269 (18.5%) | 505 (26.4%) |
| 75 Years and over | 350 (37.8%) | 532 (37.4%) |
Disability Class by Sex by Age in Texarkana
Disability Class: Hearing Difficulty
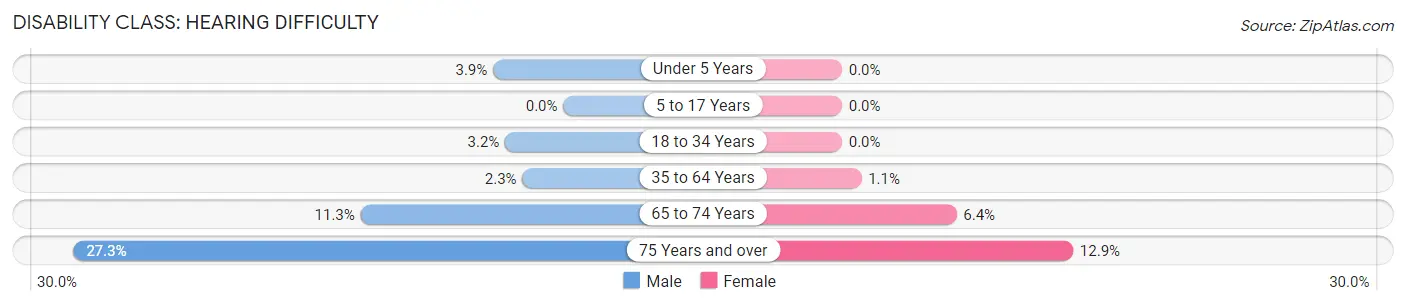
| Age Bracket | Male | Female |
| Under 5 Years | 49 (3.9%) | 0 (0.0%) |
| 5 to 17 Years | 0 (0.0%) | 0 (0.0%) |
| 18 to 34 Years | 133 (3.2%) | 0 (0.0%) |
| 35 to 64 Years | 131 (2.3%) | 72 (1.1%) |
| 65 to 74 Years | 164 (11.3%) | 122 (6.4%) |
| 75 Years and over | 253 (27.3%) | 183 (12.9%) |
Disability Class: Vision Difficulty
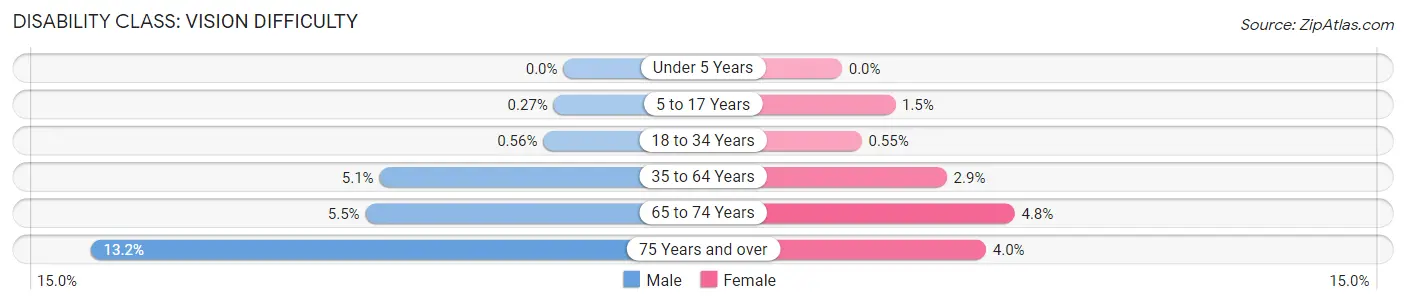
| Age Bracket | Male | Female |
| Under 5 Years | 0 (0.0%) | 0 (0.0%) |
| 5 to 17 Years | 8 (0.3%) | 46 (1.5%) |
| 18 to 34 Years | 23 (0.6%) | 21 (0.5%) |
| 35 to 64 Years | 294 (5.1%) | 195 (2.9%) |
| 65 to 74 Years | 80 (5.5%) | 92 (4.8%) |
| 75 Years and over | 122 (13.2%) | 57 (4.0%) |
Disability Class: Cognitive Difficulty
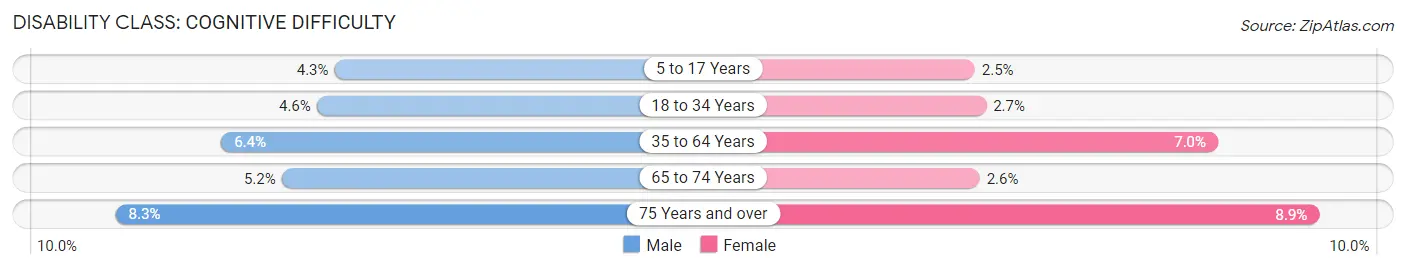
| Age Bracket | Male | Female |
| 5 to 17 Years | 127 (4.3%) | 77 (2.5%) |
| 18 to 34 Years | 188 (4.6%) | 102 (2.7%) |
| 35 to 64 Years | 365 (6.4%) | 466 (7.0%) |
| 65 to 74 Years | 76 (5.2%) | 49 (2.6%) |
| 75 Years and over | 77 (8.3%) | 126 (8.9%) |
Disability Class: Ambulatory Difficulty
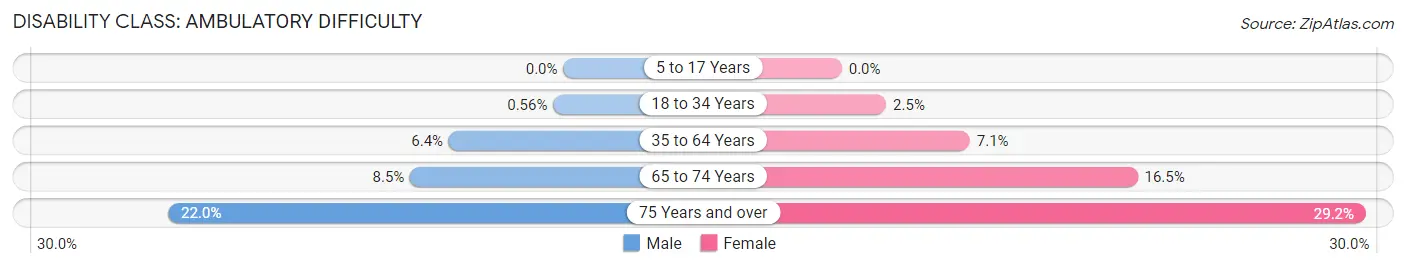
| Age Bracket | Male | Female |
| 5 to 17 Years | 0 (0.0%) | 0 (0.0%) |
| 18 to 34 Years | 23 (0.6%) | 94 (2.5%) |
| 35 to 64 Years | 366 (6.4%) | 476 (7.1%) |
| 65 to 74 Years | 124 (8.5%) | 315 (16.5%) |
| 75 Years and over | 204 (22.0%) | 415 (29.2%) |
Disability Class: Self-Care Difficulty
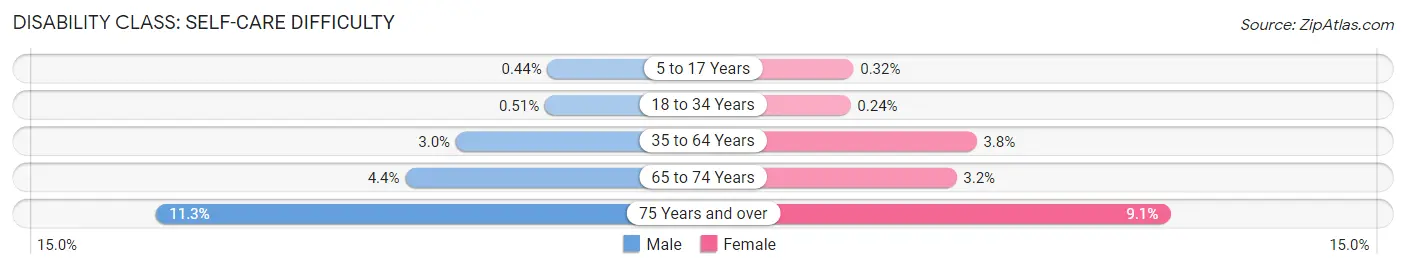
| Age Bracket | Male | Female |
| 5 to 17 Years | 13 (0.4%) | 10 (0.3%) |
| 18 to 34 Years | 21 (0.5%) | 9 (0.2%) |
| 35 to 64 Years | 172 (3.0%) | 250 (3.7%) |
| 65 to 74 Years | 64 (4.4%) | 61 (3.2%) |
| 75 Years and over | 105 (11.3%) | 130 (9.1%) |
Technology Access in Texarkana
Computing Device Access in Texarkana
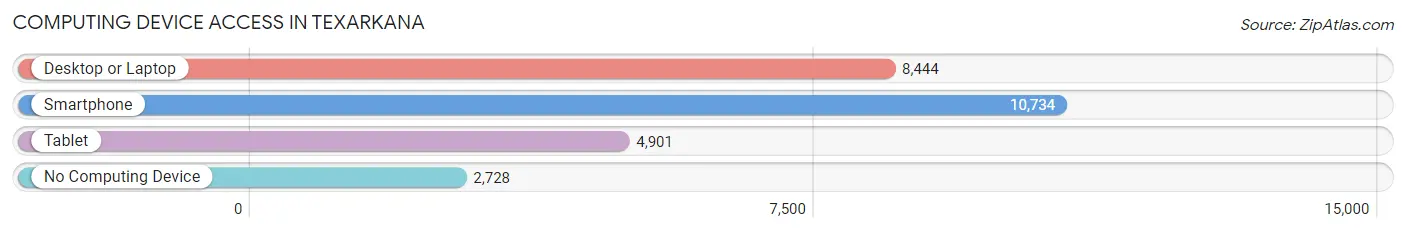
| Device Type | # Households | % Households |
| Desktop or Laptop | 8,444 | 59.1% |
| Smartphone | 10,734 | 75.1% |
| Tablet | 4,901 | 34.3% |
| No Computing Device | 2,728 | 19.1% |
| Total | 14,295 | 100.0% |
Internet Access in Texarkana
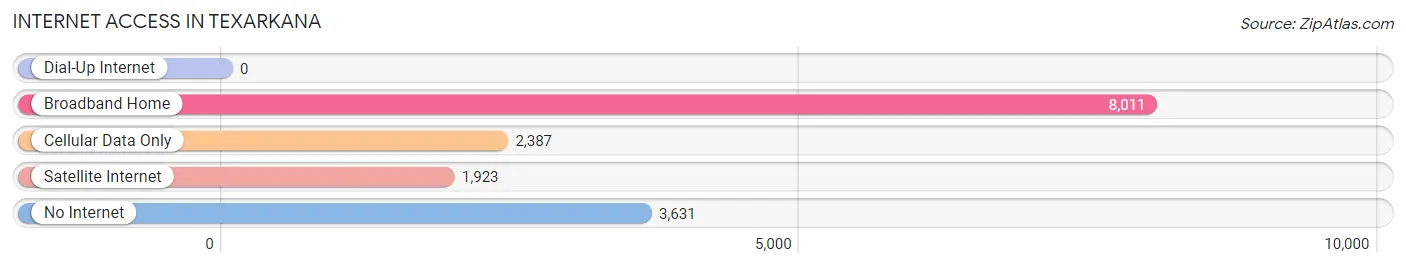
| Internet Type | # Households | % Households |
| Dial-Up Internet | 0 | 0.0% |
| Broadband Home | 8,011 | 56.0% |
| Cellular Data Only | 2,387 | 16.7% |
| Satellite Internet | 1,923 | 13.5% |
| No Internet | 3,631 | 25.4% |
| Total | 14,295 | 100.0% |
Texarkana Summary
Texarkana is a city located in Bowie County, Texas, and Miller County, Arkansas, United States. It is the county seat of Bowie County, Texas, and the largest city in the Ark-La-Tex region. The city is located in the extreme northeast corner of Texas, and is bordered by Arkansas to the east and the Red River to the north. The city is situated at the junction of Interstate 30 and U.S. Highway 59, and is the largest city in the four-state area of Arkansas, Louisiana, Oklahoma, and Texas.
History
The area where Texarkana is located was first inhabited by the Caddo Indians, who were later displaced by the Choctaw and Chickasaw tribes. The first European settlers arrived in the area in the early 1800s, and the city was officially founded in 1873. The city was named after the two states that border it, Texas and Arkansas, and was originally known as Texarkana, Texas-Arkansas.
The city grew rapidly in the late 19th century, and by the early 20th century, it had become a major railroad hub. The city was also home to a number of oil refineries, and was a major center for the timber industry.
In the 1950s, the city experienced a period of rapid growth, and by the 1960s, it had become a major center for manufacturing and industry. The city was also home to a number of military bases, and was a major center for the oil and gas industry.
Geography
Texarkana is located in the extreme northeast corner of Texas, and is bordered by Arkansas to the east and the Red River to the north. The city is situated at the junction of Interstate 30 and U.S. Highway 59, and is the largest city in the four-state area of Arkansas, Louisiana, Oklahoma, and Texas.
The city is located in the Piney Woods region of East Texas, and is surrounded by a number of small towns and rural communities. The city is located in a humid subtropical climate zone, and experiences hot, humid summers and mild winters.
Economy
Texarkana is a major center for manufacturing and industry, and is home to a number of large companies, including Tyson Foods, Cooper Tire & Rubber Company, and the Cooper Tire & Rubber Company. The city is also home to a number of military bases, and is a major center for the oil and gas industry.
The city is also home to a number of educational institutions, including Texarkana College, Texas A&M University-Texarkana, and the University of Arkansas at Texarkana.
Demographics
As of the 2010 census, the population of Texarkana was 36,411. The city has a population that is predominantly white (77.2%), with African Americans making up the largest minority group (17.3%). The city also has a large Hispanic population (4.7%), as well as a small Asian population (1.2%).
The median household income in Texarkana is $37,845, and the median family income is $45,945. The city has a poverty rate of 17.3%, and the unemployment rate is 5.2%.
Common Questions
What is Per Capita Income in Texarkana?
Per Capita income in Texarkana is $29,763.
What is the Median Family Income in Texarkana?
Median Family Income in Texarkana is $69,379.
What is the Median Household income in Texarkana?
Median Household Income in Texarkana is $48,054.
What is Income or Wage Gap in Texarkana?
Income or Wage Gap in Texarkana is 12.8%.
Women in Texarkana earn 87.2 cents for every dollar earned by a man.
What is Family Income Deficit in Texarkana?
Family Income Deficit in Texarkana is $11,826.
Families that are below poverty line in Texarkana earn $11,826 less on average than the poverty threshold level.
What is Inequality or Gini Index in Texarkana?
Inequality or Gini Index in Texarkana is 0.53.
What is the Total Population of Texarkana?
Total Population of Texarkana is 36,156.
What is the Total Male Population of Texarkana?
Total Male Population of Texarkana is 17,510.
What is the Total Female Population of Texarkana?
Total Female Population of Texarkana is 18,646.
What is the Ratio of Males per 100 Females in Texarkana?
There are 93.91 Males per 100 Females in Texarkana.
What is the Ratio of Females per 100 Males in Texarkana?
There are 106.49 Females per 100 Males in Texarkana.
What is the Median Population Age in Texarkana?
Median Population Age in Texarkana is 37.2 Years.
What is the Average Family Size in Texarkana
Average Family Size in Texarkana is 3.2 People.
What is the Average Household Size in Texarkana
Average Household Size in Texarkana is 2.4 People.
How Large is the Labor Force in Texarkana?
There are 15,910 People in the Labor Forcein in Texarkana.
What is the Percentage of People in the Labor Force in Texarkana?
55.9% of People are in the Labor Force in Texarkana.
What is the Unemployment Rate in Texarkana?
Unemployment Rate in Texarkana is 5.7%.