Zip Codes with the Highest Percentage of Population Employed in Office & Administration in Baytown, TX
RELATED REPORTS & OPTIONS
Office & Administration
Baytown
Compare Zip Codes
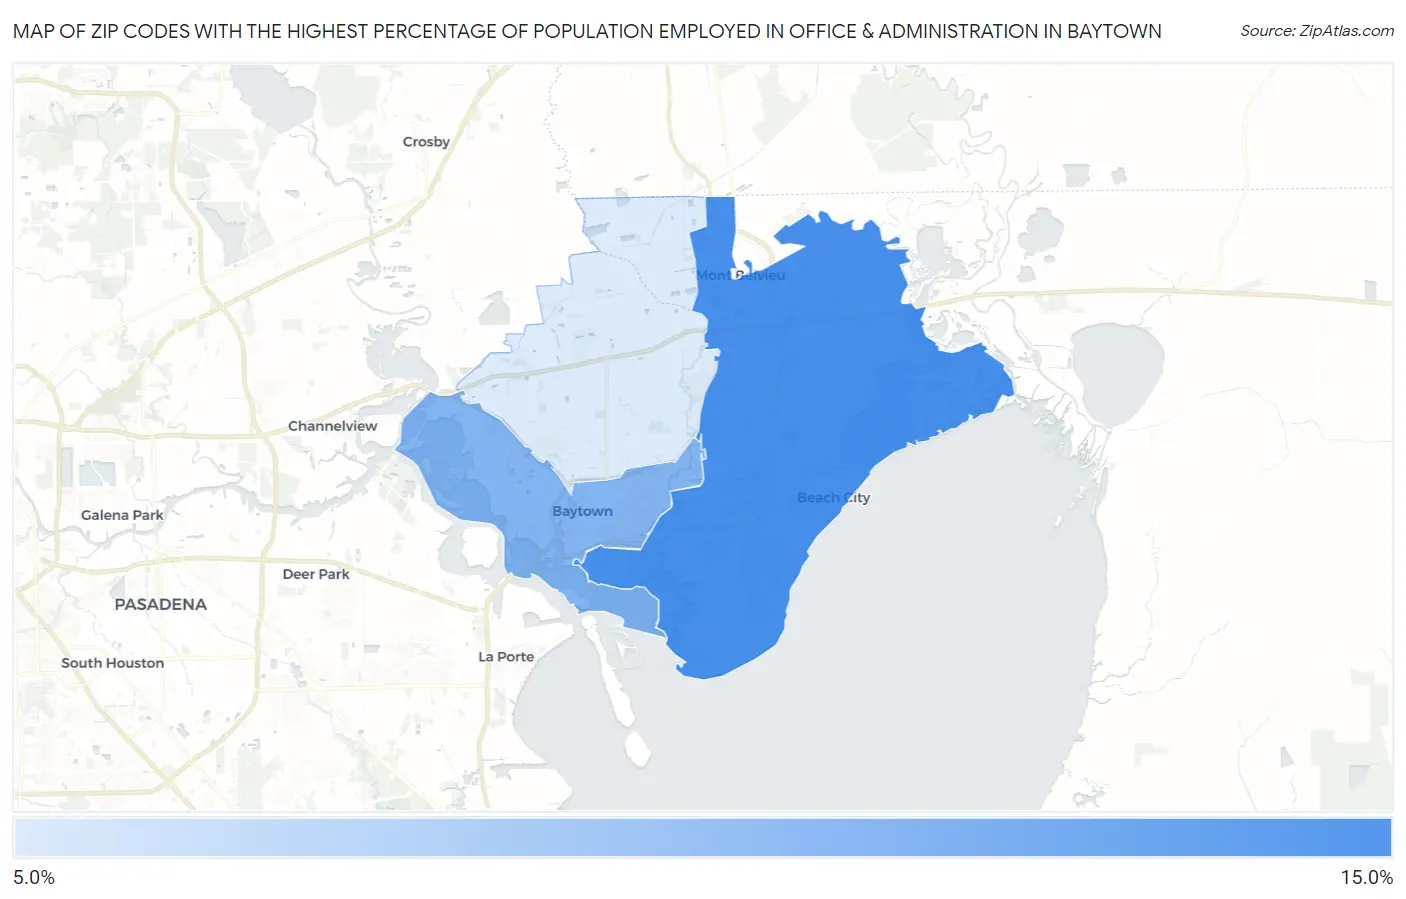
Map of Zip Codes with the Highest Percentage of Population Employed in Office & Administration in Baytown
9.0%
11.2%
Zip Codes with the Highest Percentage of Population Employed in Office & Administration in Baytown, TX
| Zip Code | % Employed | vs State | vs National | |
| 1. | 77523 | 11.2% | 11.0%(+0.209)#789 | 10.9%(+0.325)#13,270 |
| 2. | 77520 | 10.3% | 11.0%(-0.661)#970 | 10.9%(-0.546)#16,125 |
| 3. | 77521 | 9.0% | 11.0%(-1.99)#1,220 | 10.9%(-1.87)#20,303 |
1
Common Questions
What are the Top Zip Codes with the Highest Percentage of Population Employed in Office & Administration in Baytown, TX?
Top Zip Codes with the Highest Percentage of Population Employed in Office & Administration in Baytown, TX are:
What zip code has the Highest Percentage of Population Employed in Office & Administration in Baytown, TX?
77523 has the Highest Percentage of Population Employed in Office & Administration in Baytown, TX with 11.2%.
What is the Percentage of Population Employed in Office & Administration in Baytown, TX?
Percentage of Population Employed in Office & Administration in Baytown is 9.6%.
What is the Percentage of Population Employed in Office & Administration in Texas?
Percentage of Population Employed in Office & Administration in Texas is 11.0%.
What is the Percentage of Population Employed in Office & Administration in the United States?
Percentage of Population Employed in Office & Administration in the United States is 10.9%.