Flandreau, SD Map & Demographics
Flandreau Map
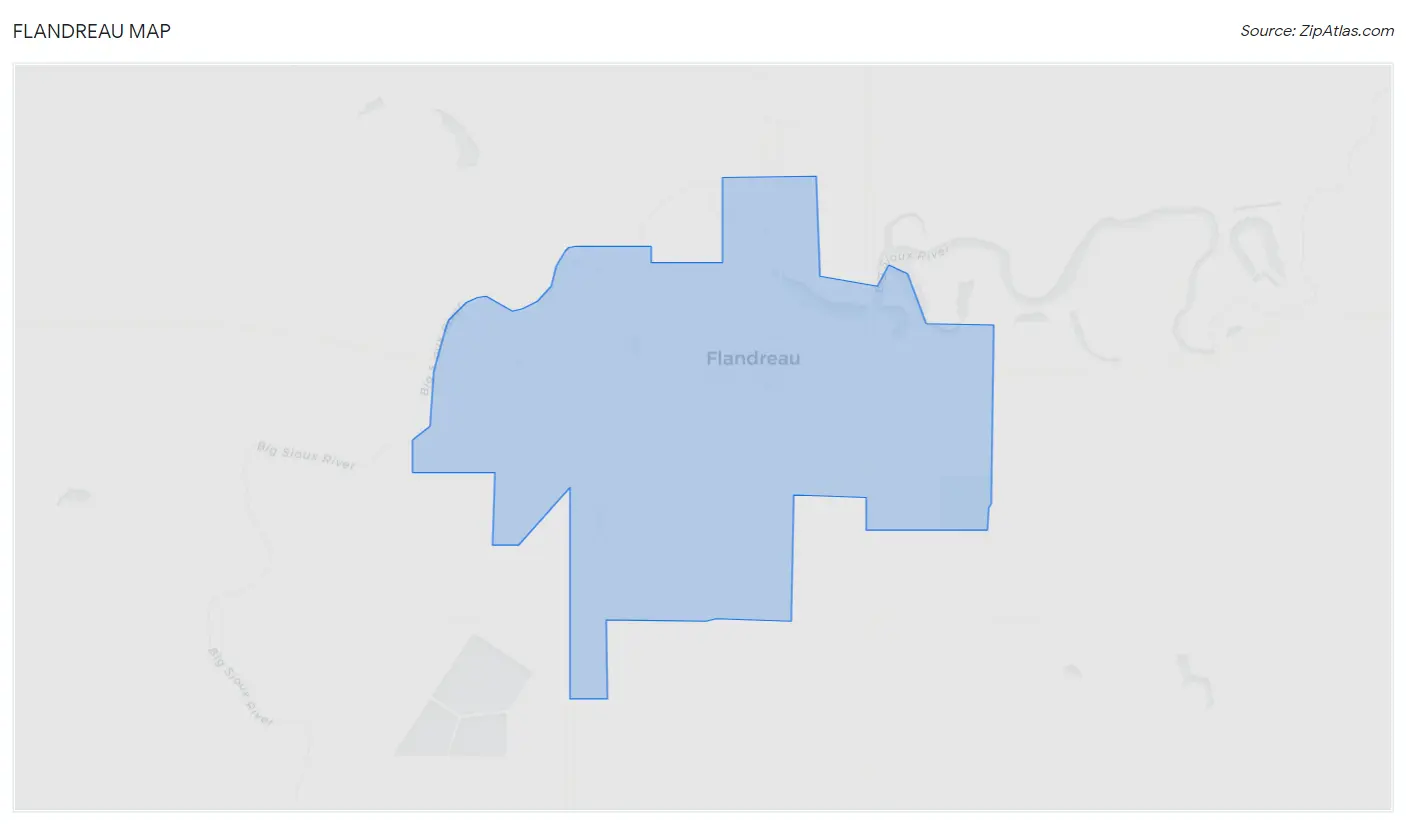
Flandreau Overview
$25,677
PER CAPITA INCOME
$67,321
AVG FAMILY INCOME
$54,821
AVG HOUSEHOLD INCOME
14.5%
WAGE / INCOME GAP [ % ]
85.5¢/ $1
WAGE / INCOME GAP [ $ ]
0.42
INEQUALITY / GINI INDEX
2,246
TOTAL POPULATION
1,050
MALE POPULATION
1,196
FEMALE POPULATION
87.79
MALES / 100 FEMALES
113.90
FEMALES / 100 MALES
37.5
MEDIAN AGE
3.2
AVG FAMILY SIZE
2.4
AVG HOUSEHOLD SIZE
1,058
LABOR FORCE [ PEOPLE ]
64.6%
PERCENT IN LABOR FORCE
2.2%
UNEMPLOYMENT RATE
Flandreau Zip Codes
Flandreau Area Codes
Income in Flandreau
Income Overview in Flandreau
Per Capita Income in Flandreau is $25,677, while median incomes of families and households are $67,321 and $54,821 respectively.
| Characteristic | Number | Measure |
| Per Capita Income | 2,246 | $25,677 |
| Median Family Income | 515 | $67,321 |
| Mean Family Income | 515 | $78,273 |
| Median Household Income | 926 | $54,821 |
| Mean Household Income | 926 | $63,026 |
| Income Deficit | 515 | $0 |
| Wage / Income Gap (%) | 2,246 | 14.54% |
| Wage / Income Gap ($) | 2,246 | 85.46¢ per $1 |
| Gini / Inequality Index | 2,246 | 0.42 |
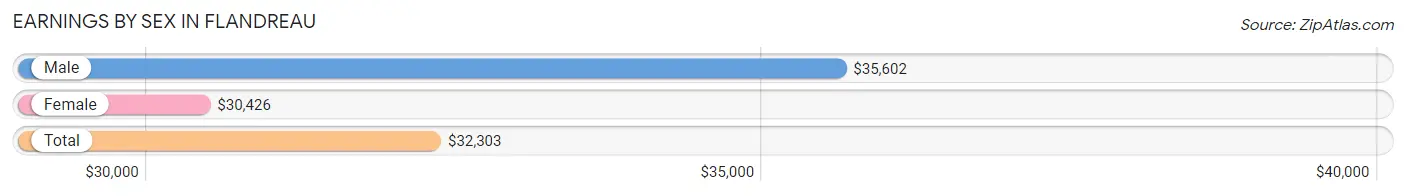
Earnings by Sex in Flandreau
Average Earnings in Flandreau are $32,303, $35,602 for men and $30,426 for women, a difference of 14.5%.
| Sex | Number | Average Earnings |
| Male | 541 (47.0%) | $35,602 |
| Female | 609 (53.0%) | $30,426 |
| Total | 1,150 (100.0%) | $32,303 |
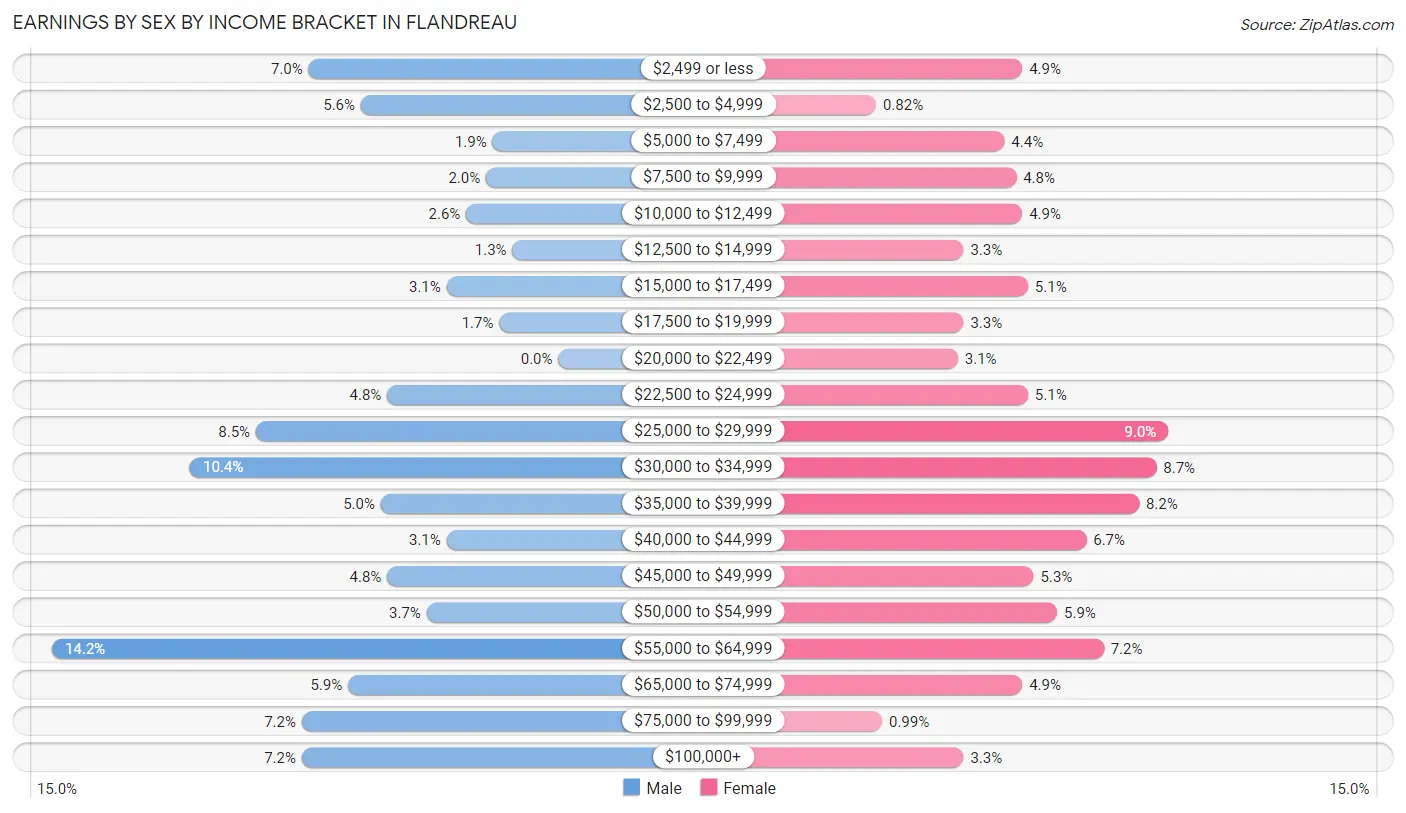
Earnings by Sex by Income Bracket in Flandreau
The most common earnings brackets in Flandreau are $55,000 to $64,999 for men (77 | 14.2%) and $25,000 to $29,999 for women (55 | 9.0%).
| Income | Male | Female |
| $2,499 or less | 38 (7.0%) | 30 (4.9%) |
| $2,500 to $4,999 | 30 (5.6%) | 5 (0.8%) |
| $5,000 to $7,499 | 10 (1.8%) | 27 (4.4%) |
| $7,500 to $9,999 | 11 (2.0%) | 29 (4.8%) |
| $10,000 to $12,499 | 14 (2.6%) | 30 (4.9%) |
| $12,500 to $14,999 | 7 (1.3%) | 20 (3.3%) |
| $15,000 to $17,499 | 17 (3.1%) | 31 (5.1%) |
| $17,500 to $19,999 | 9 (1.7%) | 20 (3.3%) |
| $20,000 to $22,499 | 0 (0.0%) | 19 (3.1%) |
| $22,500 to $24,999 | 26 (4.8%) | 31 (5.1%) |
| $25,000 to $29,999 | 46 (8.5%) | 55 (9.0%) |
| $30,000 to $34,999 | 56 (10.3%) | 53 (8.7%) |
| $35,000 to $39,999 | 27 (5.0%) | 50 (8.2%) |
| $40,000 to $44,999 | 17 (3.1%) | 41 (6.7%) |
| $45,000 to $49,999 | 26 (4.8%) | 32 (5.2%) |
| $50,000 to $54,999 | 20 (3.7%) | 36 (5.9%) |
| $55,000 to $64,999 | 77 (14.2%) | 44 (7.2%) |
| $65,000 to $74,999 | 32 (5.9%) | 30 (4.9%) |
| $75,000 to $99,999 | 39 (7.2%) | 6 (1.0%) |
| $100,000+ | 39 (7.2%) | 20 (3.3%) |
| Total | 541 (100.0%) | 609 (100.0%) |
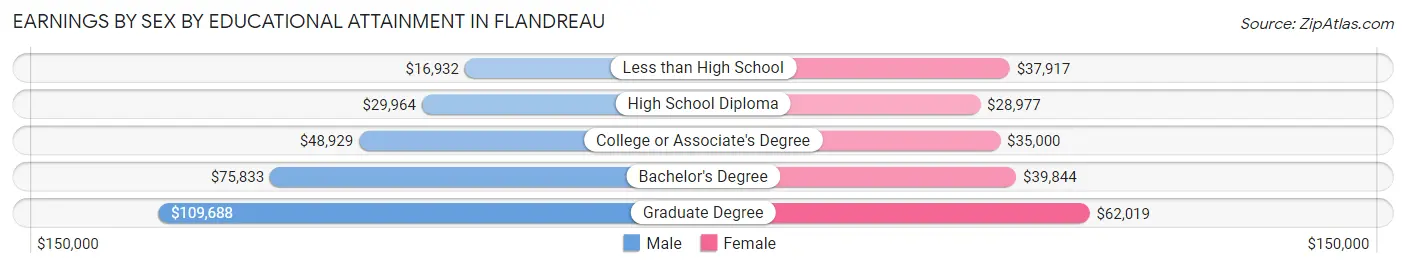
Earnings by Sex by Educational Attainment in Flandreau
Average earnings in Flandreau are $40,250 for men and $31,761 for women, a difference of 21.1%. Men with an educational attainment of graduate degree enjoy the highest average annual earnings of $109,688, while those with less than high school education earn the least with $16,932. Women with an educational attainment of graduate degree earn the most with the average annual earnings of $62,019, while those with high school diploma education have the smallest earnings of $28,977.
| Educational Attainment | Male Income | Female Income |
| Less than High School | $16,932 | $37,917 |
| High School Diploma | $29,964 | $28,977 |
| College or Associate's Degree | $48,929 | $35,000 |
| Bachelor's Degree | $75,833 | $39,844 |
| Graduate Degree | $109,688 | $62,019 |
| Total | $40,250 | $31,761 |
Family Income in Flandreau
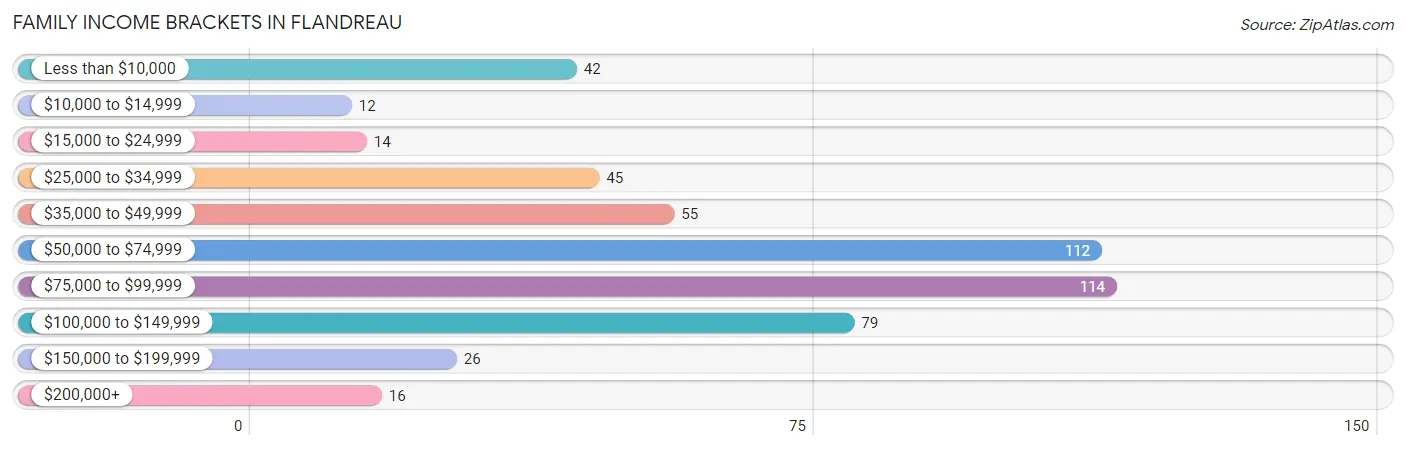
Family Income Brackets in Flandreau
According to the Flandreau family income data, there are 114 families falling into the $75,000 to $99,999 income range, which is the most common income bracket and makes up 22.1% of all families. Conversely, the $10,000 to $14,999 income bracket is the least frequent group with only 12 families (2.3%) belonging to this category.
| Income Bracket | # Families | % Families |
| Less than $10,000 | 42 | 8.2% |
| $10,000 to $14,999 | 12 | 2.3% |
| $15,000 to $24,999 | 14 | 2.7% |
| $25,000 to $34,999 | 45 | 8.7% |
| $35,000 to $49,999 | 55 | 10.7% |
| $50,000 to $74,999 | 112 | 21.7% |
| $75,000 to $99,999 | 114 | 22.1% |
| $100,000 to $149,999 | 79 | 15.3% |
| $150,000 to $199,999 | 26 | 5.0% |
| $200,000+ | 16 | 3.1% |
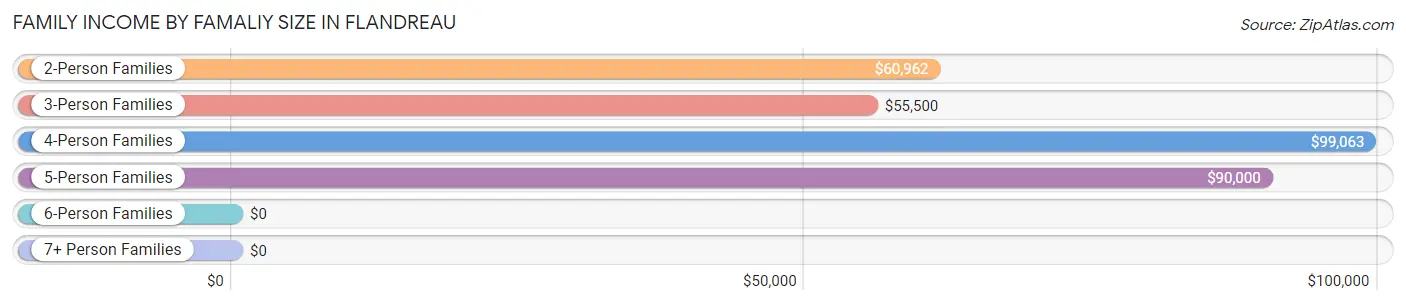
Family Income by Famaliy Size in Flandreau
4-person families (69 | 13.4%) account for the highest median family income in Flandreau with $99,063 per family, while 2-person families (226 | 43.9%) have the highest median income of $30,481 per family member.
| Income Bracket | # Families | Median Income |
| 2-Person Families | 226 (43.9%) | $60,962 |
| 3-Person Families | 96 (18.6%) | $55,500 |
| 4-Person Families | 69 (13.4%) | $99,063 |
| 5-Person Families | 92 (17.9%) | $90,000 |
| 6-Person Families | 5 (1.0%) | $0 |
| 7+ Person Families | 27 (5.2%) | $0 |
| Total | 515 (100.0%) | $67,321 |
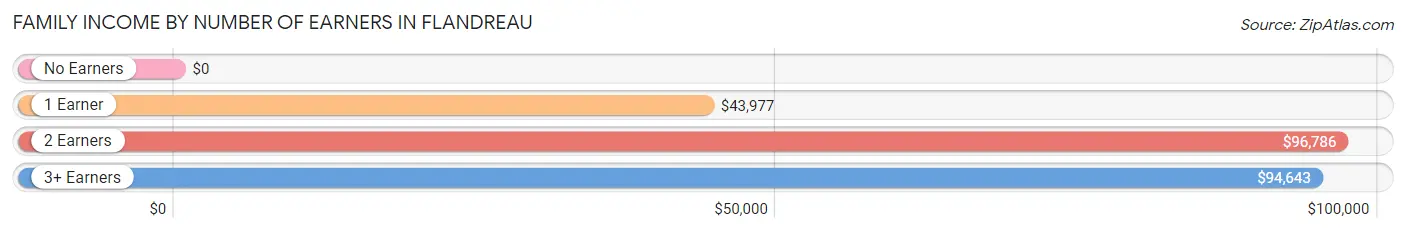
Family Income by Number of Earners in Flandreau
| Number of Earners | # Families | Median Income |
| No Earners | 80 (15.5%) | $0 |
| 1 Earner | 165 (32.0%) | $43,977 |
| 2 Earners | 184 (35.7%) | $96,786 |
| 3+ Earners | 86 (16.7%) | $94,643 |
| Total | 515 (100.0%) | $67,321 |
Household Income in Flandreau
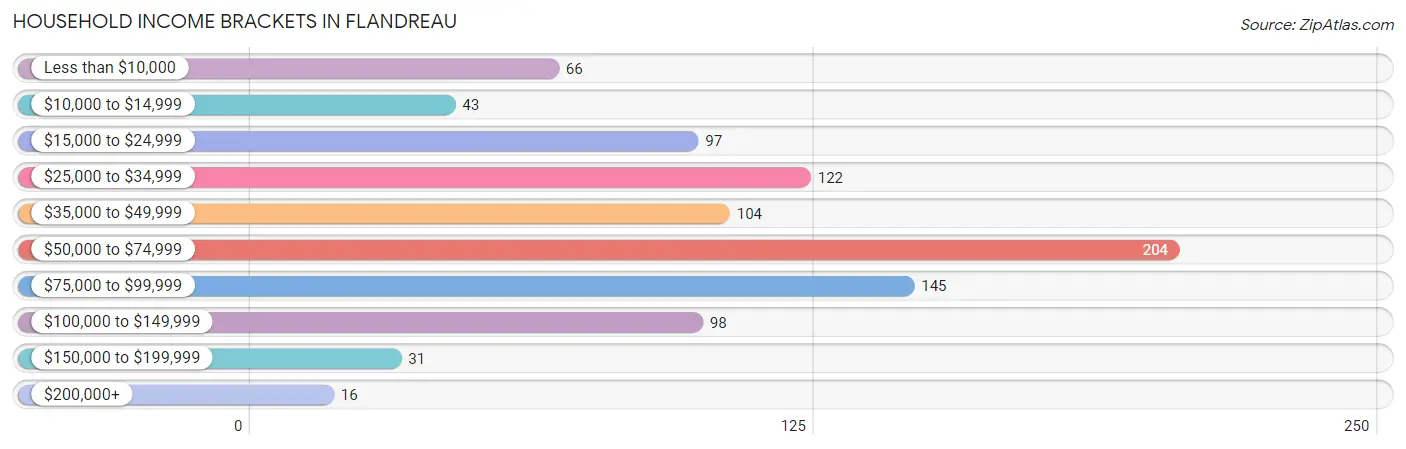
Household Income Brackets in Flandreau
With 204 households falling in the category, the $50,000 to $74,999 income range is the most frequent in Flandreau, accounting for 22.0% of all households. In contrast, only 16 households (1.7%) fall into the $200,000+ income bracket, making it the least populous group.
| Income Bracket | # Households | % Households |
| Less than $10,000 | 66 | 7.1% |
| $10,000 to $14,999 | 43 | 4.6% |
| $15,000 to $24,999 | 97 | 10.5% |
| $25,000 to $34,999 | 122 | 13.2% |
| $35,000 to $49,999 | 104 | 11.2% |
| $50,000 to $74,999 | 204 | 22.0% |
| $75,000 to $99,999 | 145 | 15.7% |
| $100,000 to $149,999 | 98 | 10.6% |
| $150,000 to $199,999 | 31 | 3.3% |
| $200,000+ | 16 | 1.7% |
Household Income by Householder Age in Flandreau
The median household income in Flandreau is $54,821, with the highest median household income of $65,341 found in the 25 to 44 years age bracket for the primary householder. A total of 317 households (34.2%) fall into this category. Meanwhile, the 15 to 24 years age bracket for the primary householder has the lowest median household income of $0, with 7 households (0.8%) in this group.
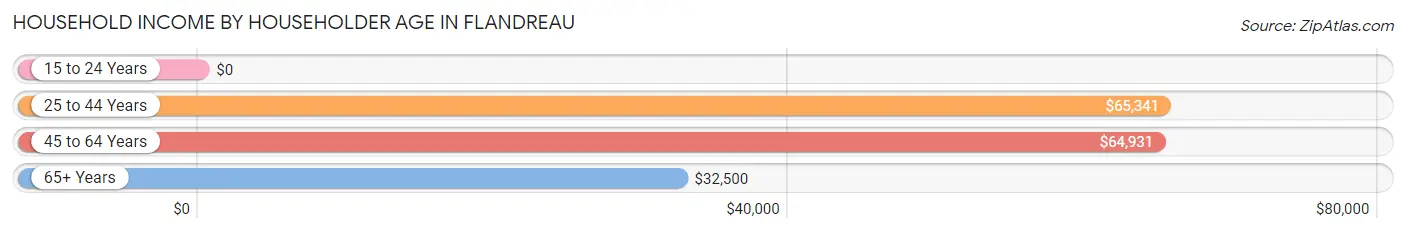
| Income Bracket | # Households | Median Income |
| 15 to 24 Years | 7 (0.8%) | $0 |
| 25 to 44 Years | 317 (34.2%) | $65,341 |
| 45 to 64 Years | 314 (33.9%) | $64,931 |
| 65+ Years | 288 (31.1%) | $32,500 |
| Total | 926 (100.0%) | $54,821 |
Poverty in Flandreau
Income Below Poverty by Sex and Age in Flandreau
With 16.6% poverty level for males and 14.5% for females among the residents of Flandreau, 5 year old males and under 5 year old females are the most vulnerable to poverty, with 7 males (50.0%) and 43 females (41.7%) in their respective age groups living below the poverty level.
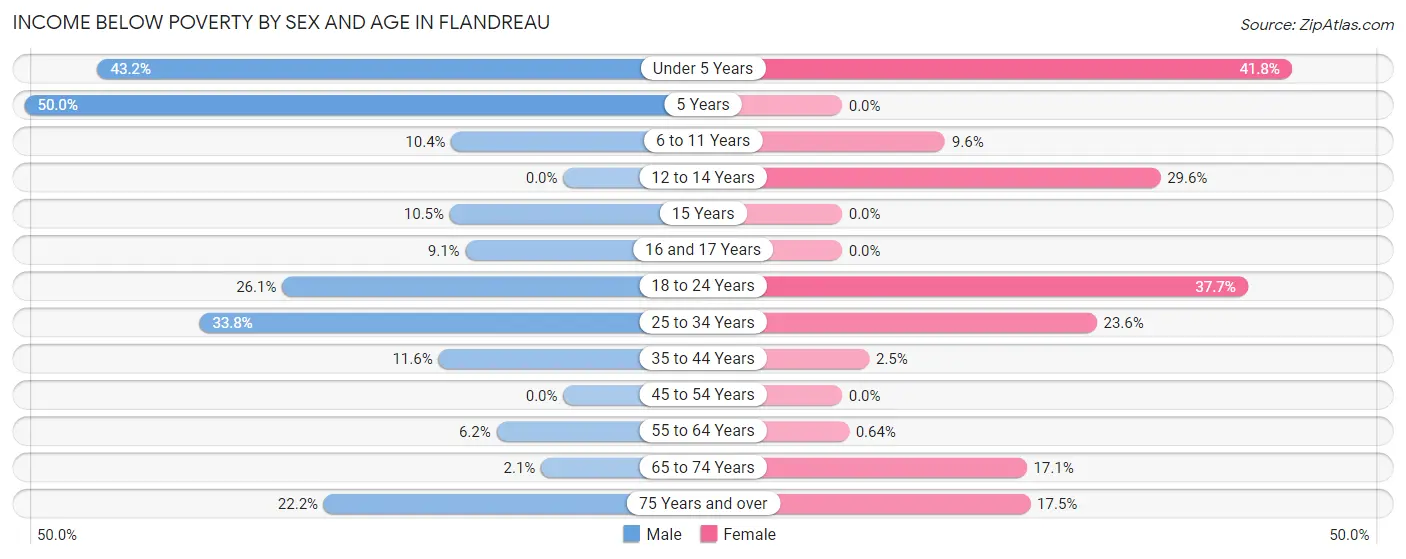
| Age Bracket | Male | Female |
| Under 5 Years | 51 (43.2%) | 43 (41.7%) |
| 5 Years | 7 (50.0%) | 0 (0.0%) |
| 6 to 11 Years | 8 (10.4%) | 11 (9.6%) |
| 12 to 14 Years | 0 (0.0%) | 13 (29.5%) |
| 15 Years | 4 (10.5%) | 0 (0.0%) |
| 16 and 17 Years | 3 (9.1%) | 0 (0.0%) |
| 18 to 24 Years | 6 (26.1%) | 29 (37.7%) |
| 25 to 34 Years | 51 (33.8%) | 26 (23.6%) |
| 35 to 44 Years | 16 (11.6%) | 4 (2.5%) |
| 45 to 54 Years | 0 (0.0%) | 0 (0.0%) |
| 55 to 64 Years | 8 (6.2%) | 1 (0.6%) |
| 65 to 74 Years | 2 (2.1%) | 18 (17.1%) |
| 75 Years and over | 8 (22.2%) | 25 (17.5%) |
| Total | 164 (16.6%) | 170 (14.5%) |
Income Above Poverty by Sex and Age in Flandreau
According to the poverty statistics in Flandreau, males aged 12 to 14 years and females aged 5 years are the age groups that are most secure financially, with 100.0% of males and 100.0% of females in these age groups living above the poverty line.
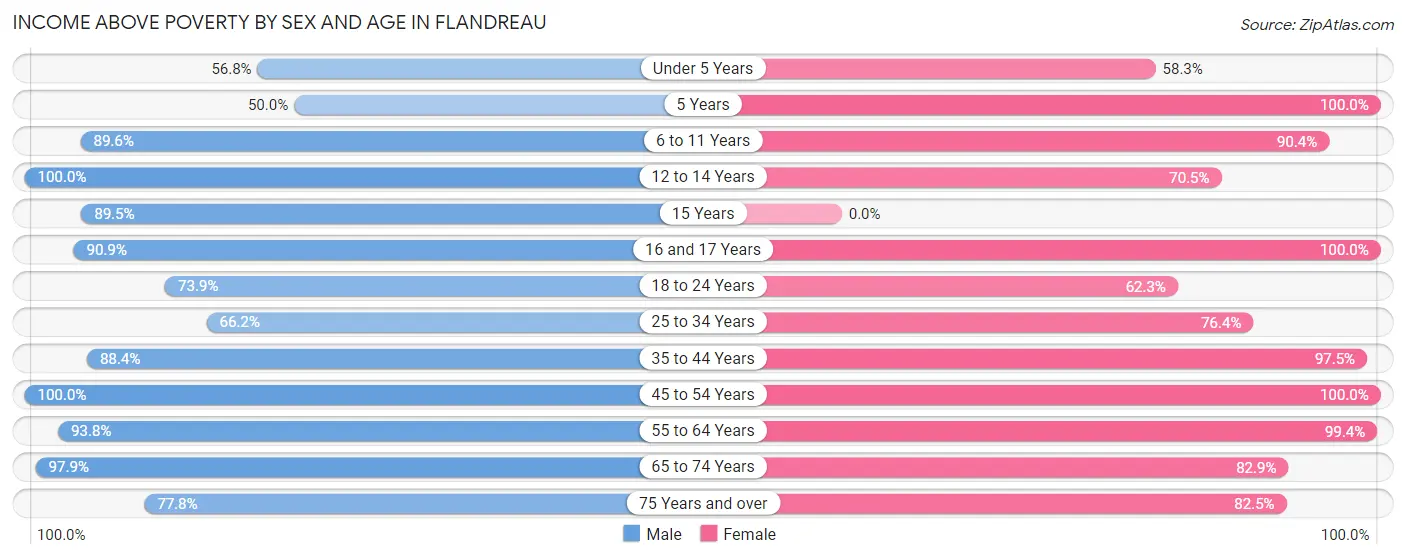
| Age Bracket | Male | Female |
| Under 5 Years | 67 (56.8%) | 60 (58.3%) |
| 5 Years | 7 (50.0%) | 17 (100.0%) |
| 6 to 11 Years | 69 (89.6%) | 104 (90.4%) |
| 12 to 14 Years | 57 (100.0%) | 31 (70.5%) |
| 15 Years | 34 (89.5%) | 0 (0.0%) |
| 16 and 17 Years | 30 (90.9%) | 33 (100.0%) |
| 18 to 24 Years | 17 (73.9%) | 48 (62.3%) |
| 25 to 34 Years | 100 (66.2%) | 84 (76.4%) |
| 35 to 44 Years | 122 (88.4%) | 154 (97.5%) |
| 45 to 54 Years | 79 (100.0%) | 109 (100.0%) |
| 55 to 64 Years | 121 (93.8%) | 155 (99.4%) |
| 65 to 74 Years | 95 (97.9%) | 87 (82.9%) |
| 75 Years and over | 28 (77.8%) | 118 (82.5%) |
| Total | 826 (83.4%) | 1,000 (85.5%) |
Income Below Poverty Among Married-Couple Families in Flandreau
The poverty statistics for married-couple families in Flandreau show that 8.6% or 28 of the total 326 families live below the poverty line. Families with 1 or 2 children have the highest poverty rate of 29.8%, comprising of 20 families. On the other hand, families with 3 or 4 children have the lowest poverty rate of 2.6%, which includes 2 families.
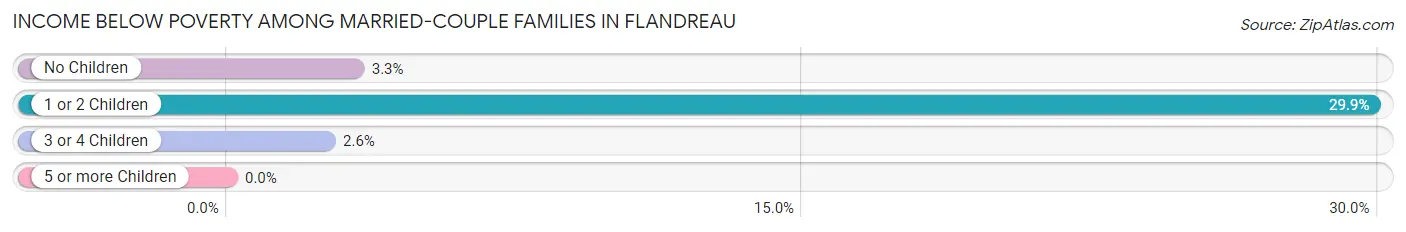
| Children | Above Poverty | Below Poverty |
| No Children | 175 (96.7%) | 6 (3.3%) |
| 1 or 2 Children | 47 (70.2%) | 20 (29.8%) |
| 3 or 4 Children | 76 (97.4%) | 2 (2.6%) |
| 5 or more Children | 0 (0.0%) | 0 (0.0%) |
| Total | 298 (91.4%) | 28 (8.6%) |
Income Below Poverty Among Single-Parent Households in Flandreau
According to the poverty data in Flandreau, 34.9% or 38 single-father households and 6.2% or 5 single-mother households are living below the poverty line. Among single-father households, those with 5 or more children have the highest poverty rate, with 4 households (57.1%) experiencing poverty. Likewise, among single-mother households, those with 3 or 4 children have the highest poverty rate, with 2 households (28.6%) falling below the poverty line.
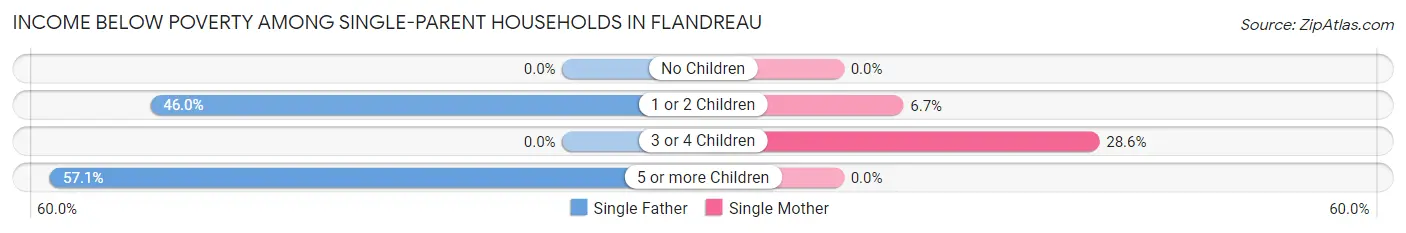
| Children | Single Father | Single Mother |
| No Children | 0 (0.0%) | 0 (0.0%) |
| 1 or 2 Children | 34 (46.0%) | 3 (6.7%) |
| 3 or 4 Children | 0 (0.0%) | 2 (28.6%) |
| 5 or more Children | 4 (57.1%) | 0 (0.0%) |
| Total | 38 (34.9%) | 5 (6.2%) |
Income Below Poverty Among Married-Couple vs Single-Parent Households in Flandreau
The poverty data for Flandreau shows that 28 of the married-couple family households (8.6%) and 43 of the single-parent households (22.8%) are living below the poverty level. Within the married-couple family households, those with 1 or 2 children have the highest poverty rate, with 20 households (29.8%) falling below the poverty line. Among the single-parent households, those with 5 or more children have the highest poverty rate, with 4 household (57.1%) living below poverty.
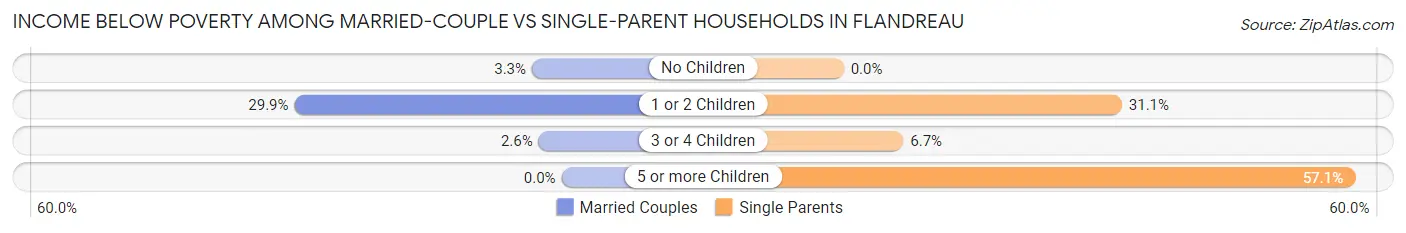
| Children | Married-Couple Families | Single-Parent Households |
| No Children | 6 (3.3%) | 0 (0.0%) |
| 1 or 2 Children | 20 (29.8%) | 37 (31.1%) |
| 3 or 4 Children | 2 (2.6%) | 2 (6.7%) |
| 5 or more Children | 0 (0.0%) | 4 (57.1%) |
| Total | 28 (8.6%) | 43 (22.8%) |
Race in Flandreau
The most populous races in Flandreau are White / Caucasian (1,269 | 56.5%), Native / Alaskan (520 | 23.2%), and Two or more Races (271 | 12.1%).
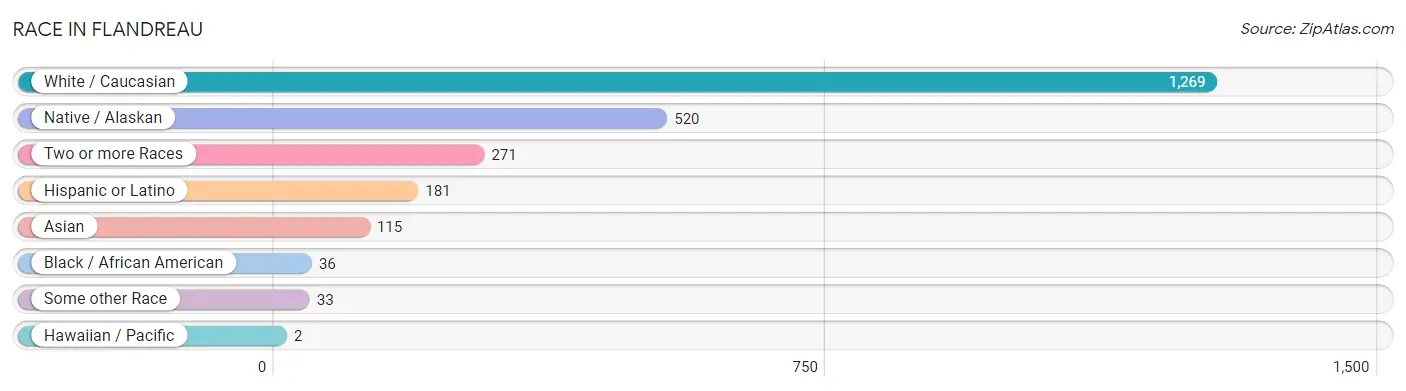
| Race | # Population | % Population |
| Asian | 115 | 5.1% |
| Black / African American | 36 | 1.6% |
| Hawaiian / Pacific | 2 | 0.1% |
| Hispanic or Latino | 181 | 8.1% |
| Native / Alaskan | 520 | 23.2% |
| White / Caucasian | 1,269 | 56.5% |
| Two or more Races | 271 | 12.1% |
| Some other Race | 33 | 1.5% |
| Total | 2,246 | 100.0% |
Ancestry in Flandreau
The most populous ancestries reported in Flandreau are Sioux (555 | 24.7%), German (547 | 24.3%), Norwegian (324 | 14.4%), Irish (184 | 8.2%), and American (164 | 7.3%), together accounting for 79.0% of all Flandreau residents.
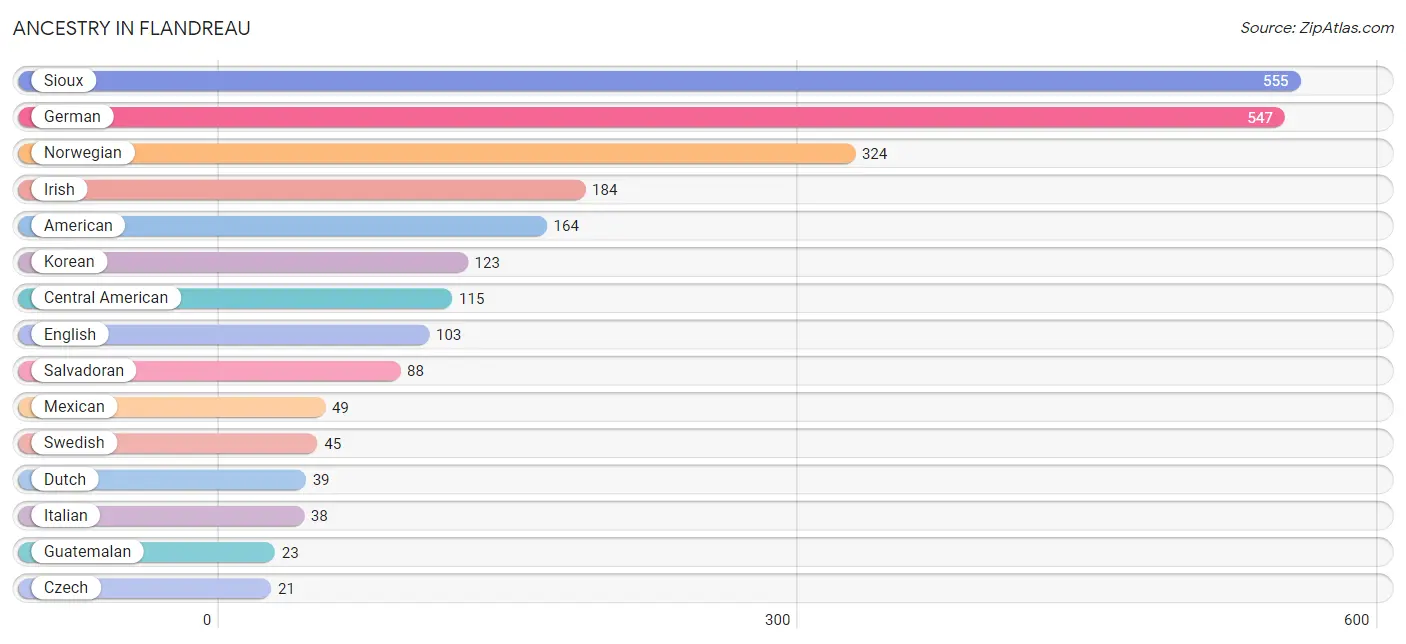
| Ancestry | # Population | % Population |
| American | 164 | 7.3% |
| Arapaho | 4 | 0.2% |
| Belgian | 4 | 0.2% |
| British | 6 | 0.3% |
| Central American | 115 | 5.1% |
| Cheyenne | 4 | 0.2% |
| Chippewa | 14 | 0.6% |
| Choctaw | 4 | 0.2% |
| Crow | 2 | 0.1% |
| Czech | 21 | 0.9% |
| Dutch | 39 | 1.7% |
| Eastern European | 4 | 0.2% |
| English | 103 | 4.6% |
| European | 8 | 0.4% |
| Finnish | 8 | 0.4% |
| French | 11 | 0.5% |
| French Canadian | 5 | 0.2% |
| German | 547 | 24.3% |
| Guamanian / Chamorro | 2 | 0.1% |
| Guatemalan | 23 | 1.0% |
| Irish | 184 | 8.2% |
| Italian | 38 | 1.7% |
| Kiowa | 1 | 0.0% |
| Korean | 123 | 5.5% |
| Mexican | 49 | 2.2% |
| Norwegian | 324 | 14.4% |
| Panamanian | 3 | 0.1% |
| Polish | 5 | 0.2% |
| Pueblo | 13 | 0.6% |
| Puerto Rican | 17 | 0.8% |
| Salvadoran | 88 | 3.9% |
| Scandinavian | 4 | 0.2% |
| Scotch-Irish | 21 | 0.9% |
| Scottish | 16 | 0.7% |
| Shoshone | 3 | 0.1% |
| Sioux | 555 | 24.7% |
| Swedish | 45 | 2.0% |
| Swiss | 6 | 0.3% |
| Tlingit-Haida | 4 | 0.2% |
| Welsh | 9 | 0.4% | View All 40 Rows |
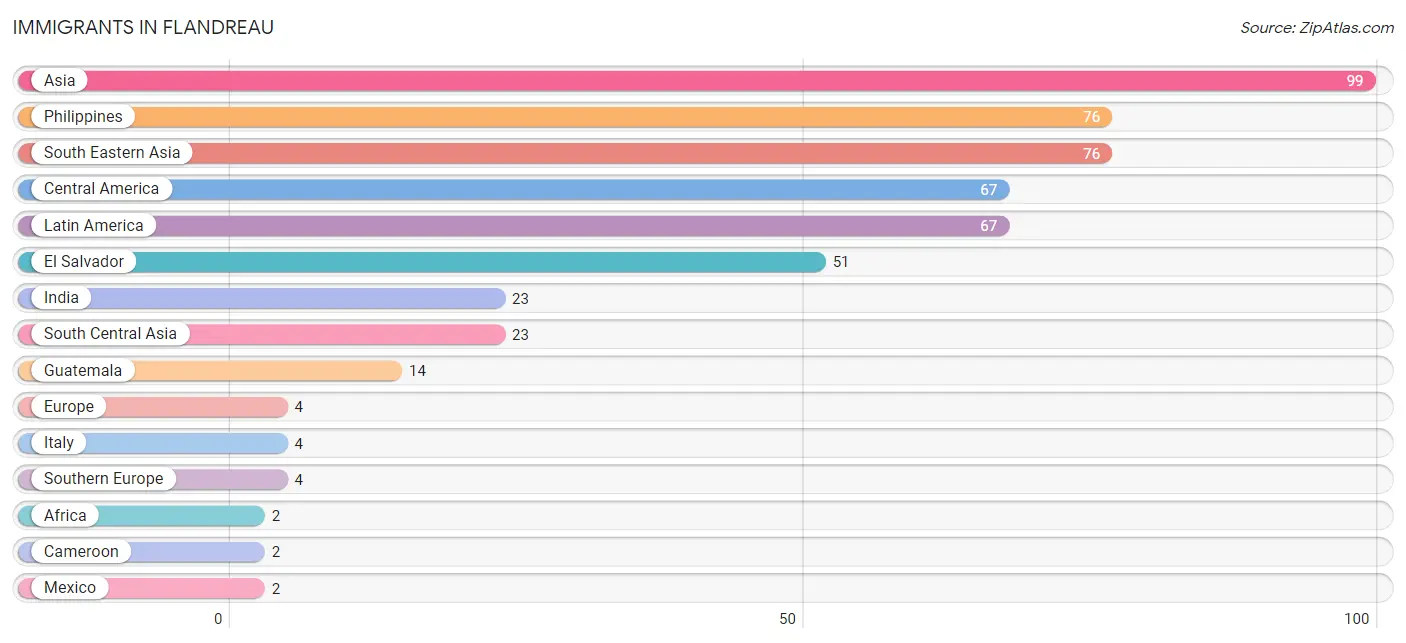
Immigrants in Flandreau
The most numerous immigrant groups reported in Flandreau came from Asia (99 | 4.4%), Philippines (76 | 3.4%), South Eastern Asia (76 | 3.4%), Central America (67 | 3.0%), and Latin America (67 | 3.0%), together accounting for 17.1% of all Flandreau residents.
| Immigration Origin | # Population | % Population |
| Africa | 2 | 0.1% |
| Asia | 99 | 4.4% |
| Cameroon | 2 | 0.1% |
| Central America | 67 | 3.0% |
| El Salvador | 51 | 2.3% |
| Europe | 4 | 0.2% |
| Guatemala | 14 | 0.6% |
| India | 23 | 1.0% |
| Italy | 4 | 0.2% |
| Latin America | 67 | 3.0% |
| Mexico | 2 | 0.1% |
| Middle Africa | 2 | 0.1% |
| Philippines | 76 | 3.4% |
| South Central Asia | 23 | 1.0% |
| South Eastern Asia | 76 | 3.4% |
| Southern Europe | 4 | 0.2% | View All 16 Rows |
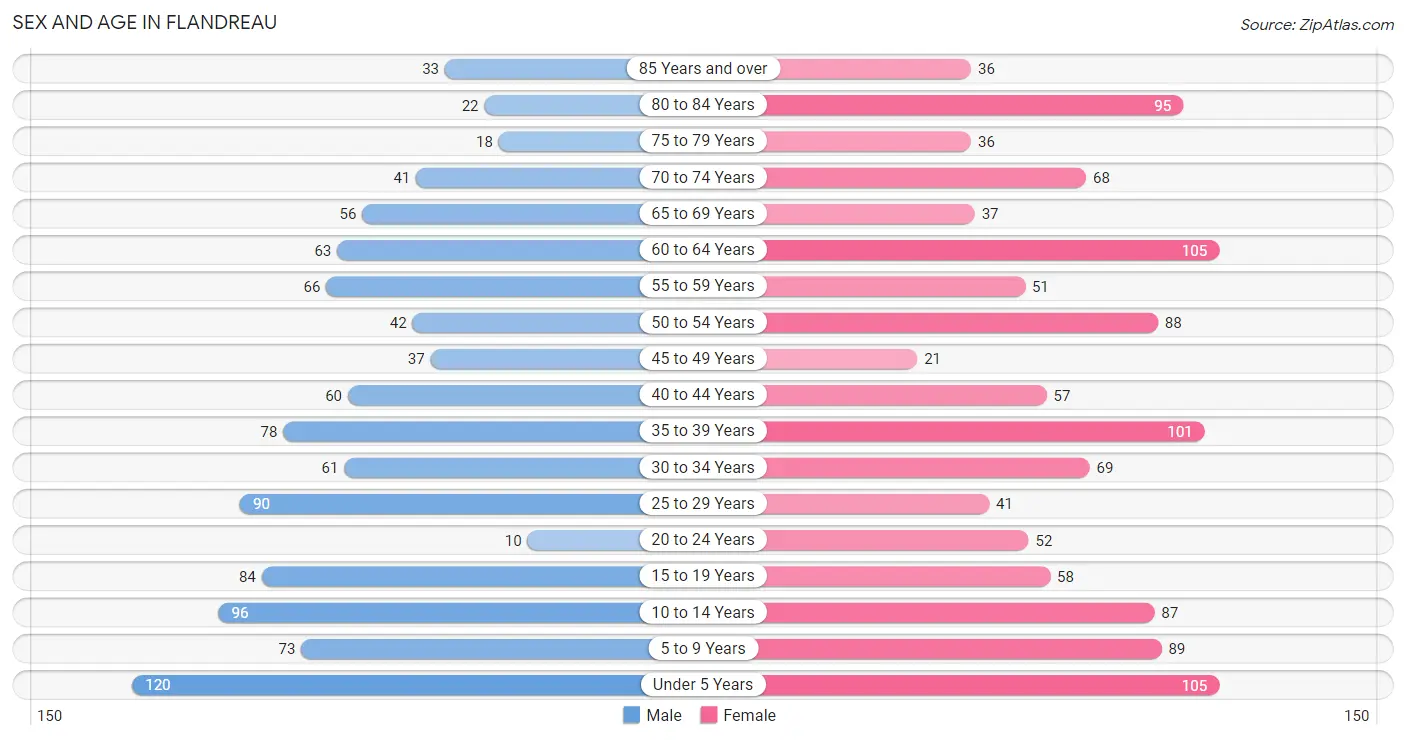
Sex and Age in Flandreau
Sex and Age in Flandreau
The most populous age groups in Flandreau are Under 5 Years (120 | 11.4%) for men and Under 5 Years (105 | 8.8%) for women.
| Age Bracket | Male | Female |
| Under 5 Years | 120 (11.4%) | 105 (8.8%) |
| 5 to 9 Years | 73 (7.0%) | 89 (7.4%) |
| 10 to 14 Years | 96 (9.1%) | 87 (7.3%) |
| 15 to 19 Years | 84 (8.0%) | 58 (4.9%) |
| 20 to 24 Years | 10 (0.9%) | 52 (4.3%) |
| 25 to 29 Years | 90 (8.6%) | 41 (3.4%) |
| 30 to 34 Years | 61 (5.8%) | 69 (5.8%) |
| 35 to 39 Years | 78 (7.4%) | 101 (8.4%) |
| 40 to 44 Years | 60 (5.7%) | 57 (4.8%) |
| 45 to 49 Years | 37 (3.5%) | 21 (1.8%) |
| 50 to 54 Years | 42 (4.0%) | 88 (7.4%) |
| 55 to 59 Years | 66 (6.3%) | 51 (4.3%) |
| 60 to 64 Years | 63 (6.0%) | 105 (8.8%) |
| 65 to 69 Years | 56 (5.3%) | 37 (3.1%) |
| 70 to 74 Years | 41 (3.9%) | 68 (5.7%) |
| 75 to 79 Years | 18 (1.7%) | 36 (3.0%) |
| 80 to 84 Years | 22 (2.1%) | 95 (7.9%) |
| 85 Years and over | 33 (3.1%) | 36 (3.0%) |
| Total | 1,050 (100.0%) | 1,196 (100.0%) |
Families and Households in Flandreau
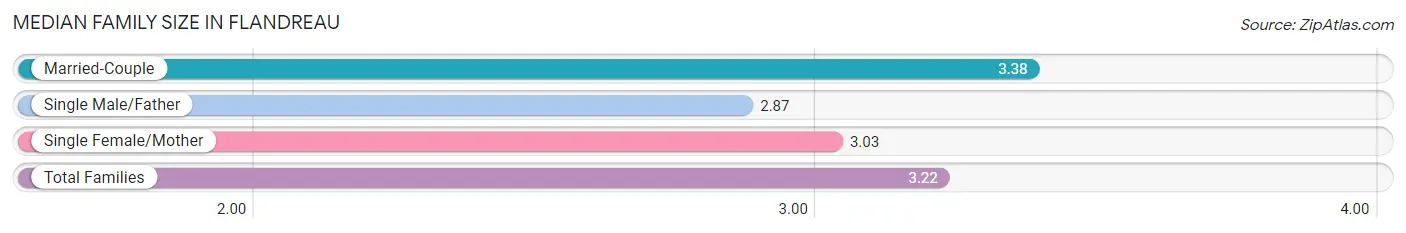
Median Family Size in Flandreau
The median family size in Flandreau is 3.22 persons per family, with married-couple families (326 | 63.3%) accounting for the largest median family size of 3.38 persons per family. On the other hand, single male/father families (109 | 21.2%) represent the smallest median family size with 2.87 persons per family.
| Family Type | # Families | Family Size |
| Married-Couple | 326 (63.3%) | 3.38 |
| Single Male/Father | 109 (21.2%) | 2.87 |
| Single Female/Mother | 80 (15.5%) | 3.03 |
| Total Families | 515 (100.0%) | 3.22 |
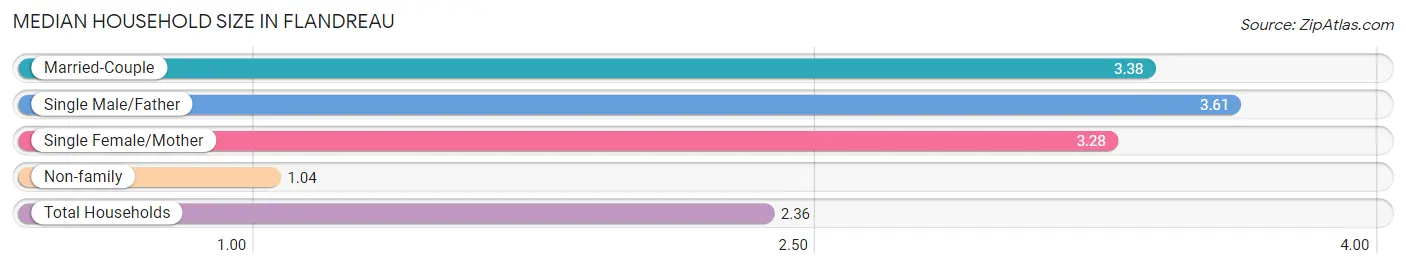
Median Household Size in Flandreau
The median household size in Flandreau is 2.36 persons per household, with single male/father households (109 | 11.8%) accounting for the largest median household size of 3.61 persons per household. non-family households (411 | 44.4%) represent the smallest median household size with 1.04 persons per household.
| Household Type | # Households | Household Size |
| Married-Couple | 326 (35.2%) | 3.38 |
| Single Male/Father | 109 (11.8%) | 3.61 |
| Single Female/Mother | 80 (8.6%) | 3.28 |
| Non-family | 411 (44.4%) | 1.04 |
| Total Households | 926 (100.0%) | 2.36 |
Household Size by Marriage Status in Flandreau
Out of a total of 926 households in Flandreau, 515 (55.6%) are family households, while 411 (44.4%) are nonfamily households. The most numerous type of family households are 2-person households, comprising 185, and the most common type of nonfamily households are 1-person households, comprising 376.
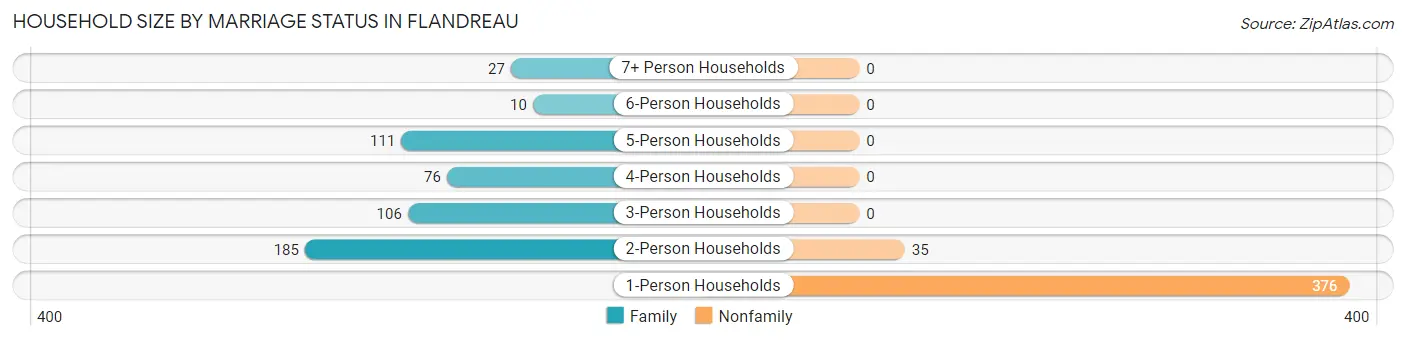
| Household Size | Family Households | Nonfamily Households |
| 1-Person Households | - | 376 (40.6%) |
| 2-Person Households | 185 (20.0%) | 35 (3.8%) |
| 3-Person Households | 106 (11.5%) | 0 (0.0%) |
| 4-Person Households | 76 (8.2%) | 0 (0.0%) |
| 5-Person Households | 111 (12.0%) | 0 (0.0%) |
| 6-Person Households | 10 (1.1%) | 0 (0.0%) |
| 7+ Person Households | 27 (2.9%) | 0 (0.0%) |
| Total | 515 (55.6%) | 411 (44.4%) |
Female Fertility in Flandreau
Fertility by Age in Flandreau
Average fertility rate in Flandreau is 90.0 births per 1,000 women. Women in the age bracket of 20 to 34 years have the highest fertility rate with 204.0 births per 1,000 women. Women in the age bracket of 20 to 34 years acount for 91.7% of all women with births.
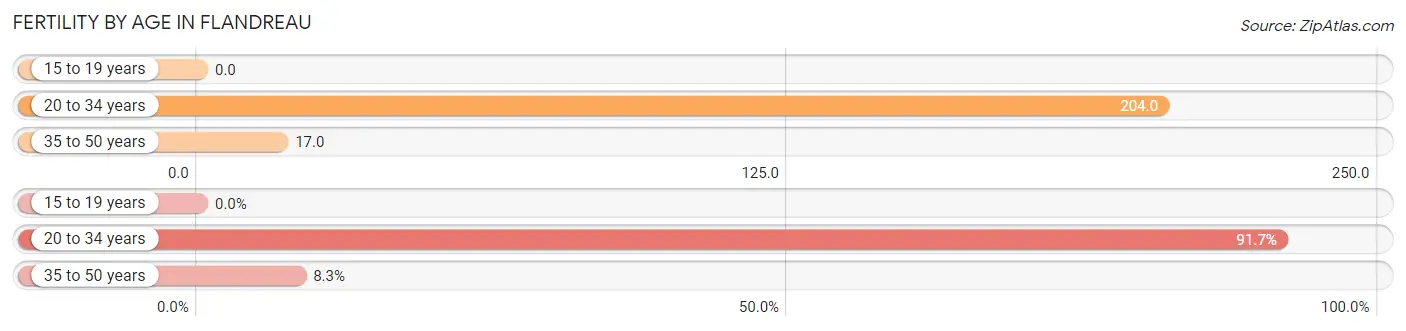
| Age Bracket | Women with Births | Births / 1,000 Women |
| 15 to 19 years | 0 (0.0%) | 0.0 |
| 20 to 34 years | 33 (91.7%) | 204.0 |
| 35 to 50 years | 3 (8.3%) | 17.0 |
| Total | 36 (100.0%) | 90.0 |
Fertility by Age by Marriage Status in Flandreau
52.8% of women with births (36) in Flandreau are married. The highest percentage of unmarried women with births falls into 35 to 50 years age bracket with 66.7% of them unmarried at the time of birth, while the lowest percentage of unmarried women with births belong to 20 to 34 years age bracket with 45.5% of them unmarried.
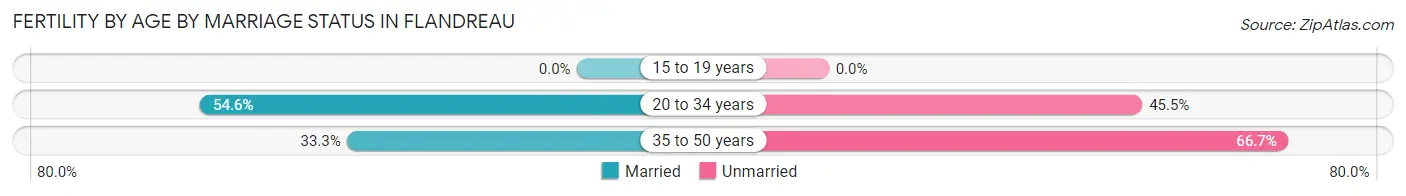
| Age Bracket | Married | Unmarried |
| 15 to 19 years | 0 (0.0%) | 0 (0.0%) |
| 20 to 34 years | 18 (54.5%) | 15 (45.5%) |
| 35 to 50 years | 1 (33.3%) | 2 (66.7%) |
| Total | 19 (52.8%) | 17 (47.2%) |
Fertility by Education in Flandreau
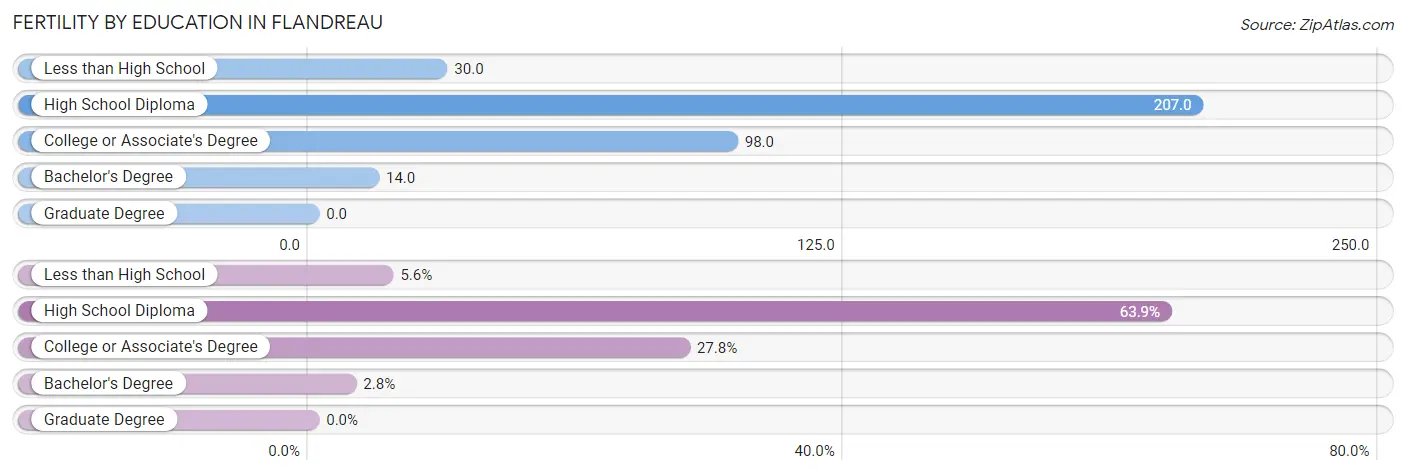
| Educational Attainment | Women with Births | Births / 1,000 Women |
| Less than High School | 2 (5.6%) | 30.0 |
| High School Diploma | 23 (63.9%) | 207.0 |
| College or Associate's Degree | 10 (27.8%) | 98.0 |
| Bachelor's Degree | 1 (2.8%) | 14.0 |
| Graduate Degree | 0 (0.0%) | 0.0 |
| Total | 36 (100.0%) | 90.0 |
Fertility by Education by Marriage Status in Flandreau
47.2% of women with births in Flandreau are unmarried. Women with the educational attainment of bachelor's degree are most likely to be married with 100.0% of them married at childbirth, while women with the educational attainment of less than high school are least likely to be married with 100.0% of them unmarried at childbirth.
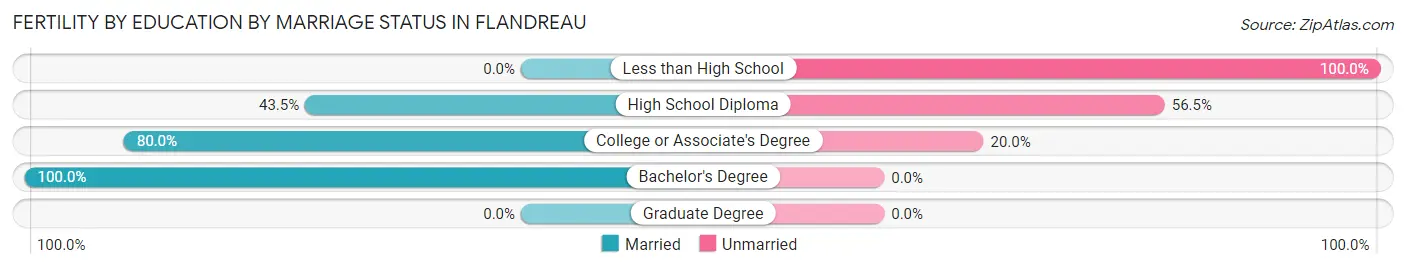
| Educational Attainment | Married | Unmarried |
| Less than High School | 0 (0.0%) | 2 (100.0%) |
| High School Diploma | 10 (43.5%) | 13 (56.5%) |
| College or Associate's Degree | 8 (80.0%) | 2 (20.0%) |
| Bachelor's Degree | 1 (100.0%) | 0 (0.0%) |
| Graduate Degree | 0 (0.0%) | 0 (0.0%) |
| Total | 19 (52.8%) | 17 (47.2%) |
Employment Characteristics in Flandreau
Employment by Class of Employer in Flandreau
Among the 993 employed individuals in Flandreau, private company employees (544 | 54.8%), local government employees (181 | 18.2%), and federal government employees (93 | 9.4%) make up the most common classes of employment.
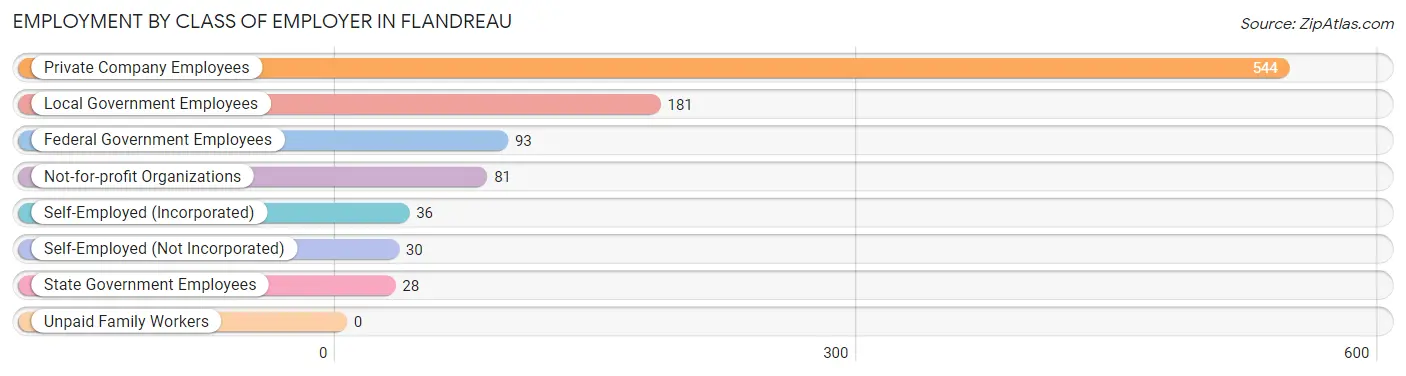
| Employer Class | # Employees | % Employees |
| Private Company Employees | 544 | 54.8% |
| Self-Employed (Incorporated) | 36 | 3.6% |
| Self-Employed (Not Incorporated) | 30 | 3.0% |
| Not-for-profit Organizations | 81 | 8.2% |
| Local Government Employees | 181 | 18.2% |
| State Government Employees | 28 | 2.8% |
| Federal Government Employees | 93 | 9.4% |
| Unpaid Family Workers | 0 | 0.0% |
| Total | 993 | 100.0% |
Employment Status by Age in Flandreau
According to the labor force statistics for Flandreau, out of the total population over 16 years of age (1,638), 64.6% or 1,058 individuals are in the labor force, with 2.2% or 23 of them unemployed. The age group with the highest labor force participation rate is 45 to 54 years, with 95.2% or 179 individuals in the labor force. Within the labor force, the 25 to 29 years age range has the highest percentage of unemployed individuals, with 15.6% or 14 of them being unemployed.
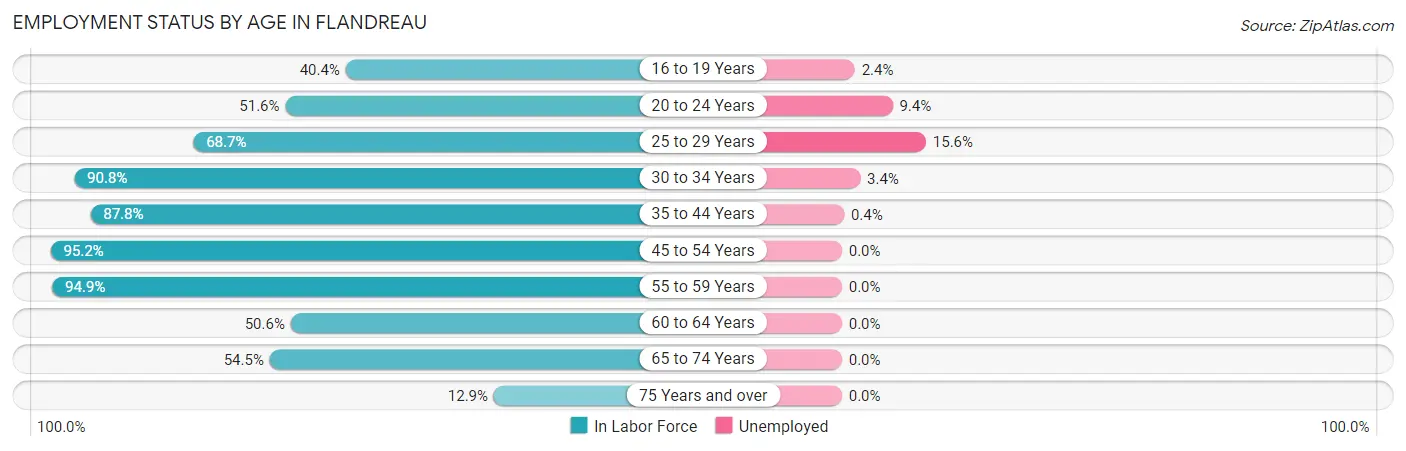
| Age Bracket | In Labor Force | Unemployed |
| 16 to 19 Years | 42 (40.4%) | 1 (2.4%) |
| 20 to 24 Years | 32 (51.6%) | 3 (9.4%) |
| 25 to 29 Years | 90 (68.7%) | 14 (15.6%) |
| 30 to 34 Years | 118 (90.8%) | 4 (3.4%) |
| 35 to 44 Years | 260 (87.8%) | 1 (0.4%) |
| 45 to 54 Years | 179 (95.2%) | 0 (0.0%) |
| 55 to 59 Years | 111 (94.9%) | 0 (0.0%) |
| 60 to 64 Years | 85 (50.6%) | 0 (0.0%) |
| 65 to 74 Years | 110 (54.5%) | 0 (0.0%) |
| 75 Years and over | 31 (12.9%) | 0 (0.0%) |
| Total | 1,058 (64.6%) | 23 (2.2%) |
Employment Status by Educational Attainment in Flandreau
According to labor force statistics for Flandreau, 81.8% of individuals (843) out of the total population between 25 and 64 years of age (1,030) are in the labor force, with 2.3% or 19 of them being unemployed. The group with the highest labor force participation rate are those with the educational attainment of bachelor's degree or higher, with 91.8% or 180 individuals in the labor force. Within the labor force, individuals with less than high school education have the highest percentage of unemployment, with 17.9% or 12 of them being unemployed.
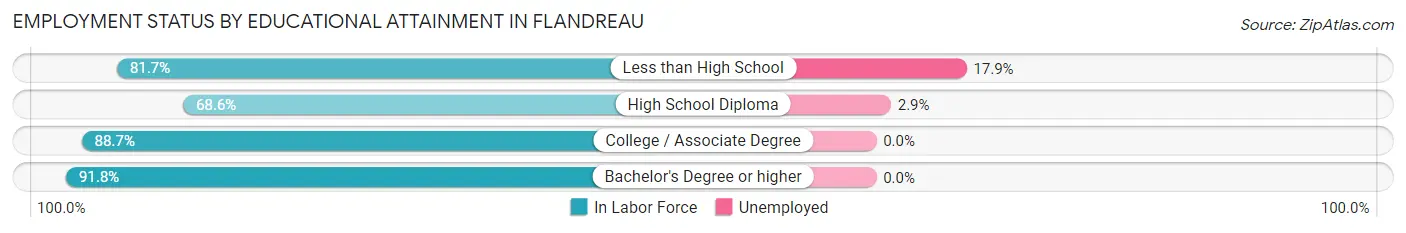
| Educational Attainment | In Labor Force | Unemployed |
| Less than High School | 67 (81.7%) | 15 (17.9%) |
| High School Diploma | 242 (68.6%) | 10 (2.9%) |
| College / Associate Degree | 354 (88.7%) | 0 (0.0%) |
| Bachelor's Degree or higher | 180 (91.8%) | 0 (0.0%) |
| Total | 843 (81.8%) | 24 (2.3%) |
Employment Occupations by Sex in Flandreau
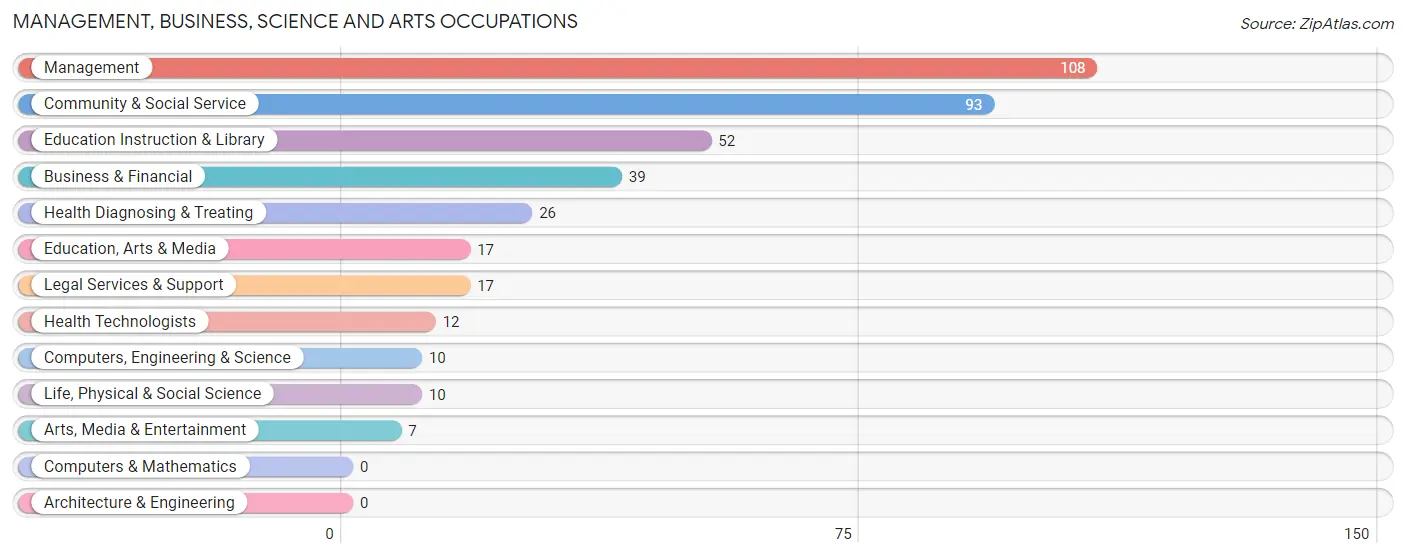
Management, Business, Science and Arts Occupations
The most common Management, Business, Science and Arts occupations in Flandreau are Management (108 | 10.4%), Community & Social Service (93 | 9.0%), Education Instruction & Library (52 | 5.0%), Business & Financial (39 | 3.8%), and Health Diagnosing & Treating (26 | 2.5%).
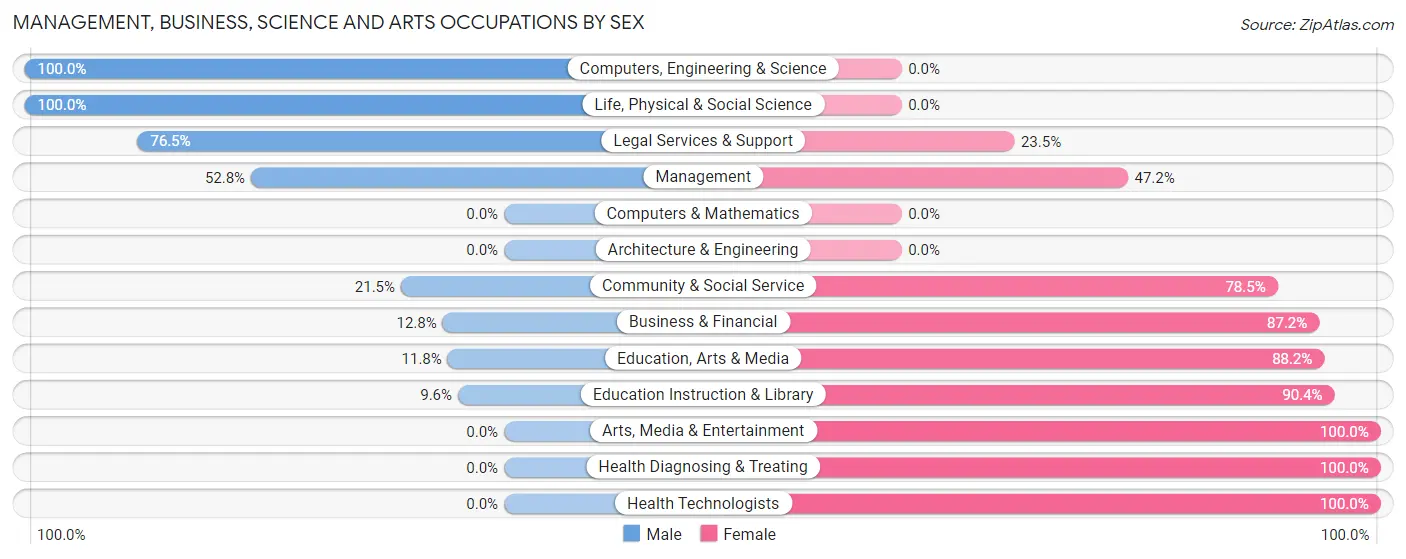
Management, Business, Science and Arts Occupations by Sex
Within the Management, Business, Science and Arts occupations in Flandreau, the most male-oriented occupations are Computers, Engineering & Science (100.0%), Life, Physical & Social Science (100.0%), and Legal Services & Support (76.5%), while the most female-oriented occupations are Arts, Media & Entertainment (100.0%), Health Diagnosing & Treating (100.0%), and Health Technologists (100.0%).
| Occupation | Male | Female |
| Management | 57 (52.8%) | 51 (47.2%) |
| Business & Financial | 5 (12.8%) | 34 (87.2%) |
| Computers, Engineering & Science | 10 (100.0%) | 0 (0.0%) |
| Computers & Mathematics | 0 (0.0%) | 0 (0.0%) |
| Architecture & Engineering | 0 (0.0%) | 0 (0.0%) |
| Life, Physical & Social Science | 10 (100.0%) | 0 (0.0%) |
| Community & Social Service | 20 (21.5%) | 73 (78.5%) |
| Education, Arts & Media | 2 (11.8%) | 15 (88.2%) |
| Legal Services & Support | 13 (76.5%) | 4 (23.5%) |
| Education Instruction & Library | 5 (9.6%) | 47 (90.4%) |
| Arts, Media & Entertainment | 0 (0.0%) | 7 (100.0%) |
| Health Diagnosing & Treating | 0 (0.0%) | 26 (100.0%) |
| Health Technologists | 0 (0.0%) | 12 (100.0%) |
| Total (Category) | 92 (33.3%) | 184 (66.7%) |
| Total (Overall) | 457 (44.2%) | 578 (55.8%) |
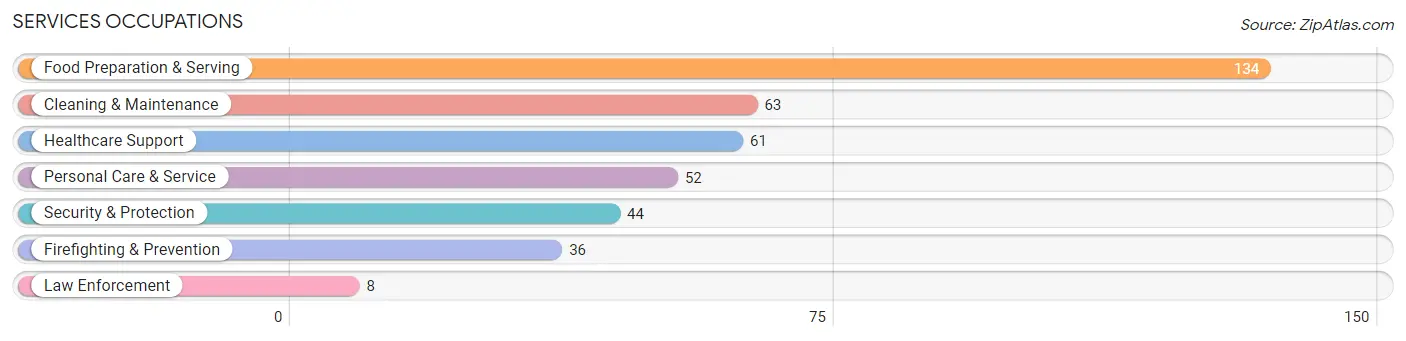
Services Occupations
The most common Services occupations in Flandreau are Food Preparation & Serving (134 | 13.0%), Cleaning & Maintenance (63 | 6.1%), Healthcare Support (61 | 5.9%), Personal Care & Service (52 | 5.0%), and Security & Protection (44 | 4.3%).
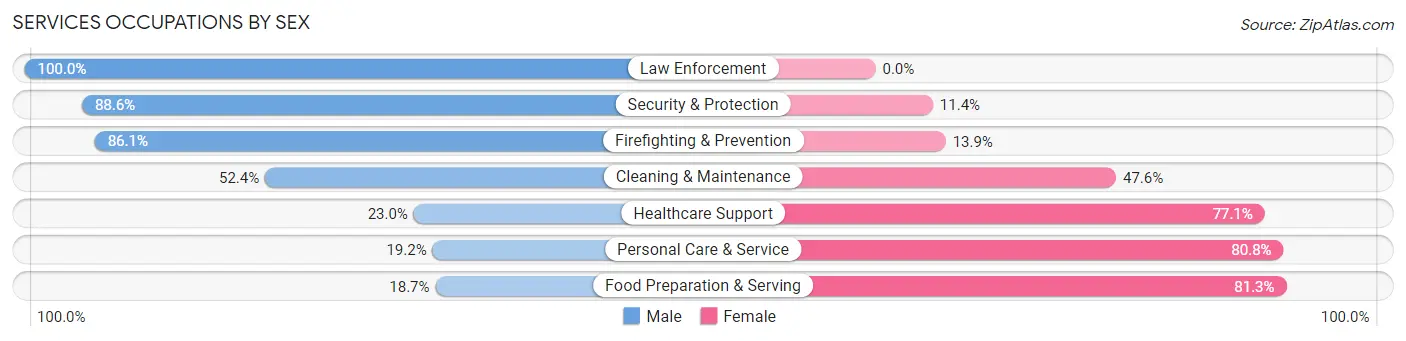
Services Occupations by Sex
Within the Services occupations in Flandreau, the most male-oriented occupations are Law Enforcement (100.0%), Security & Protection (88.6%), and Firefighting & Prevention (86.1%), while the most female-oriented occupations are Food Preparation & Serving (81.3%), Personal Care & Service (80.8%), and Healthcare Support (77.0%).
| Occupation | Male | Female |
| Healthcare Support | 14 (23.0%) | 47 (77.0%) |
| Security & Protection | 39 (88.6%) | 5 (11.4%) |
| Firefighting & Prevention | 31 (86.1%) | 5 (13.9%) |
| Law Enforcement | 8 (100.0%) | 0 (0.0%) |
| Food Preparation & Serving | 25 (18.7%) | 109 (81.3%) |
| Cleaning & Maintenance | 33 (52.4%) | 30 (47.6%) |
| Personal Care & Service | 10 (19.2%) | 42 (80.8%) |
| Total (Category) | 121 (34.2%) | 233 (65.8%) |
| Total (Overall) | 457 (44.2%) | 578 (55.8%) |
Sales and Office Occupations
The most common Sales and Office occupations in Flandreau are Office & Administration (123 | 11.9%), and Sales & Related (53 | 5.1%).
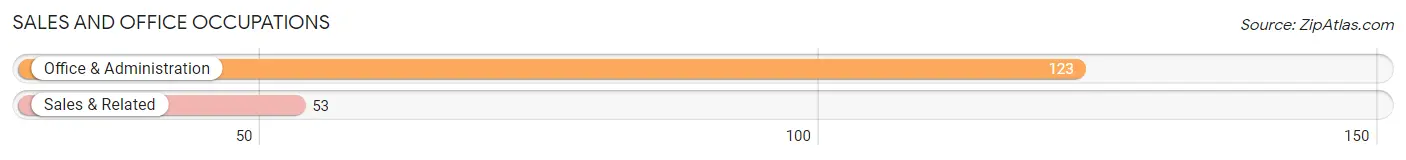
Sales and Office Occupations by Sex
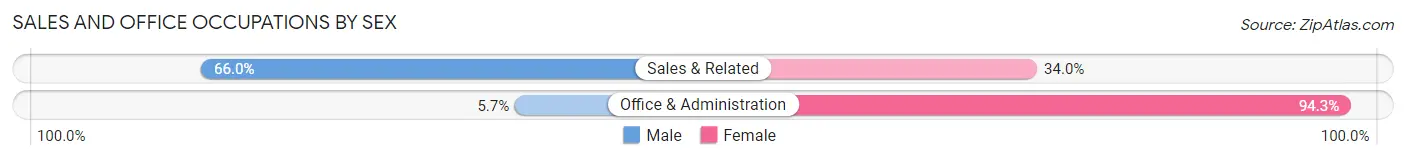
| Occupation | Male | Female |
| Sales & Related | 35 (66.0%) | 18 (34.0%) |
| Office & Administration | 7 (5.7%) | 116 (94.3%) |
| Total (Category) | 42 (23.9%) | 134 (76.1%) |
| Total (Overall) | 457 (44.2%) | 578 (55.8%) |
Natural Resources, Construction and Maintenance Occupations
The most common Natural Resources, Construction and Maintenance occupations in Flandreau are Construction & Extraction (88 | 8.5%), Installation, Maintenance & Repair (24 | 2.3%), and Farming, Fishing & Forestry (4 | 0.4%).
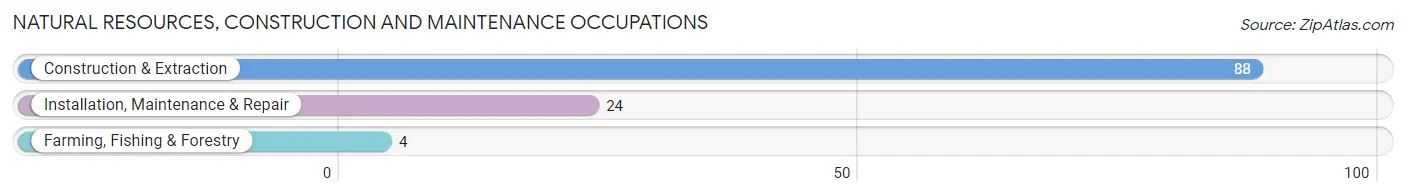
Natural Resources, Construction and Maintenance Occupations by Sex
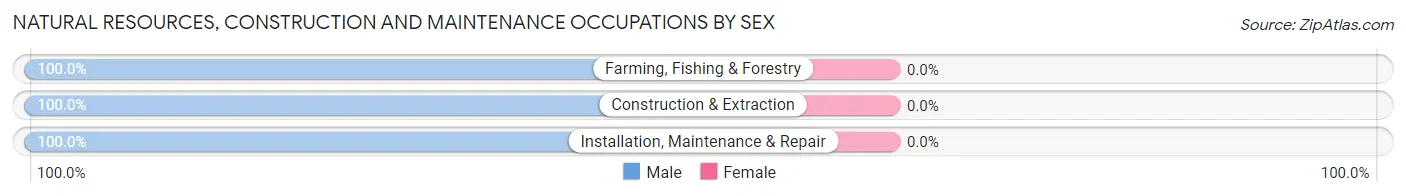
| Occupation | Male | Female |
| Farming, Fishing & Forestry | 4 (100.0%) | 0 (0.0%) |
| Construction & Extraction | 88 (100.0%) | 0 (0.0%) |
| Installation, Maintenance & Repair | 24 (100.0%) | 0 (0.0%) |
| Total (Category) | 116 (100.0%) | 0 (0.0%) |
| Total (Overall) | 457 (44.2%) | 578 (55.8%) |
Production, Transportation and Moving Occupations
The most common Production, Transportation and Moving occupations in Flandreau are Transportation (48 | 4.6%), Material Moving (33 | 3.2%), and Production (32 | 3.1%).
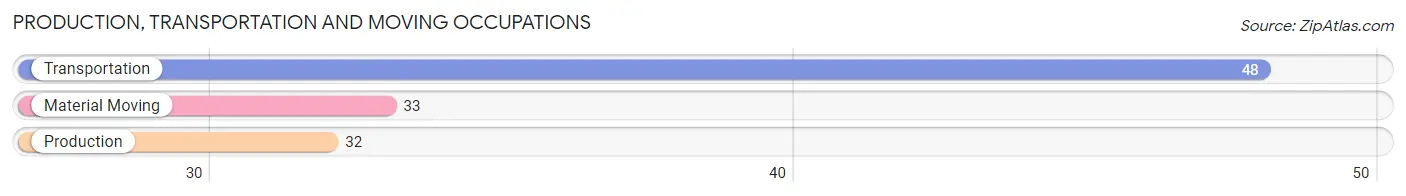
Production, Transportation and Moving Occupations by Sex
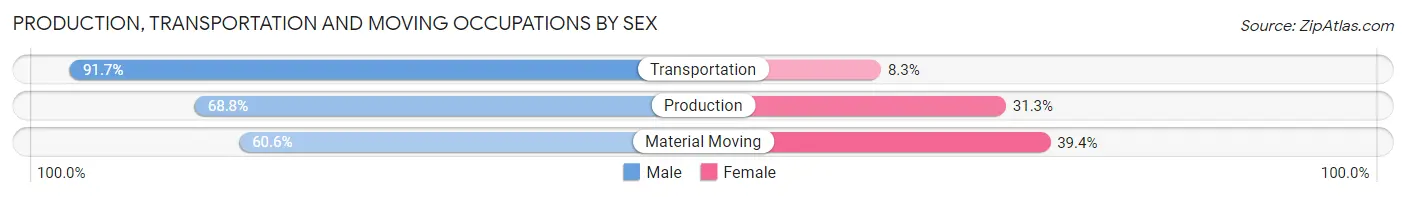
| Occupation | Male | Female |
| Production | 22 (68.8%) | 10 (31.2%) |
| Transportation | 44 (91.7%) | 4 (8.3%) |
| Material Moving | 20 (60.6%) | 13 (39.4%) |
| Total (Category) | 86 (76.1%) | 27 (23.9%) |
| Total (Overall) | 457 (44.2%) | 578 (55.8%) |
Employment Industries by Sex in Flandreau
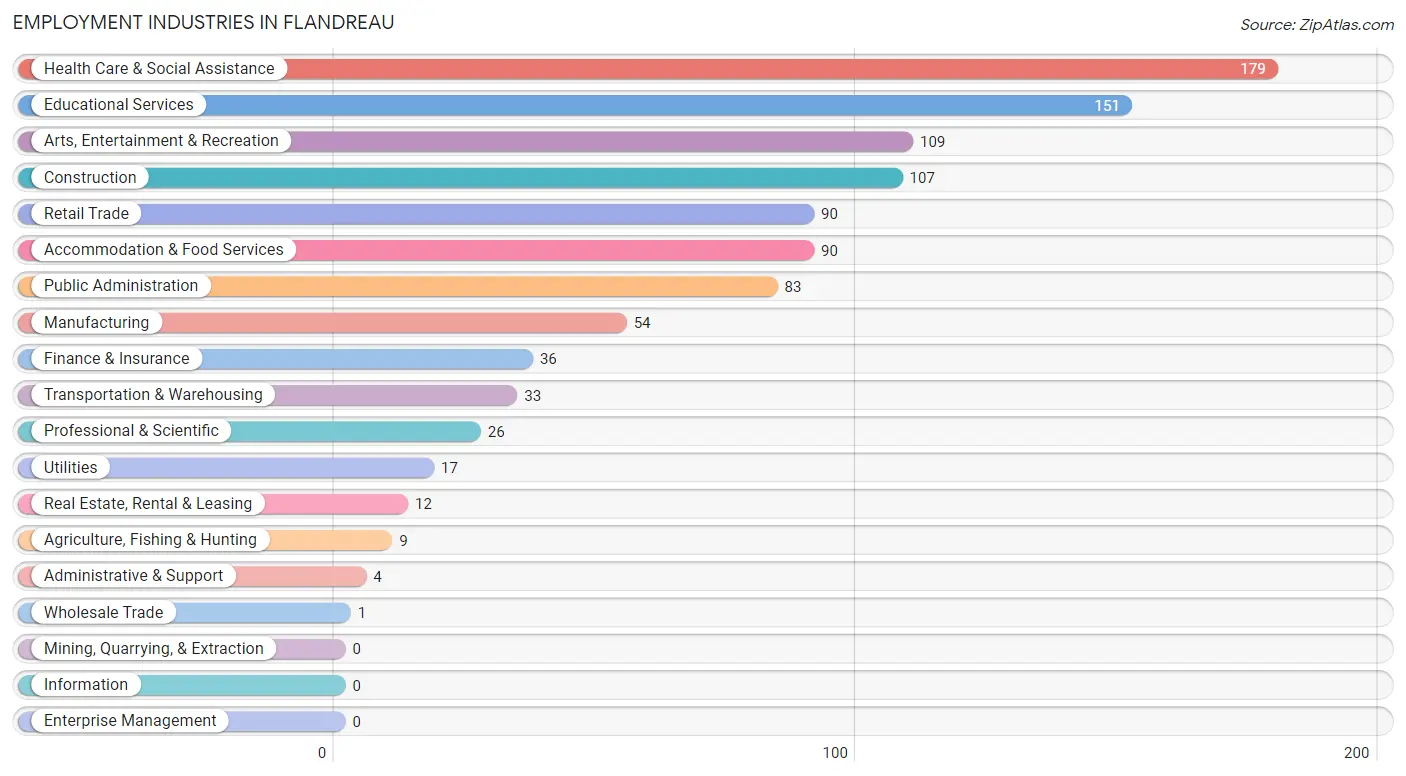
Employment Industries in Flandreau
The major employment industries in Flandreau include Health Care & Social Assistance (179 | 17.3%), Educational Services (151 | 14.6%), Arts, Entertainment & Recreation (109 | 10.5%), Construction (107 | 10.3%), and Retail Trade (90 | 8.7%).
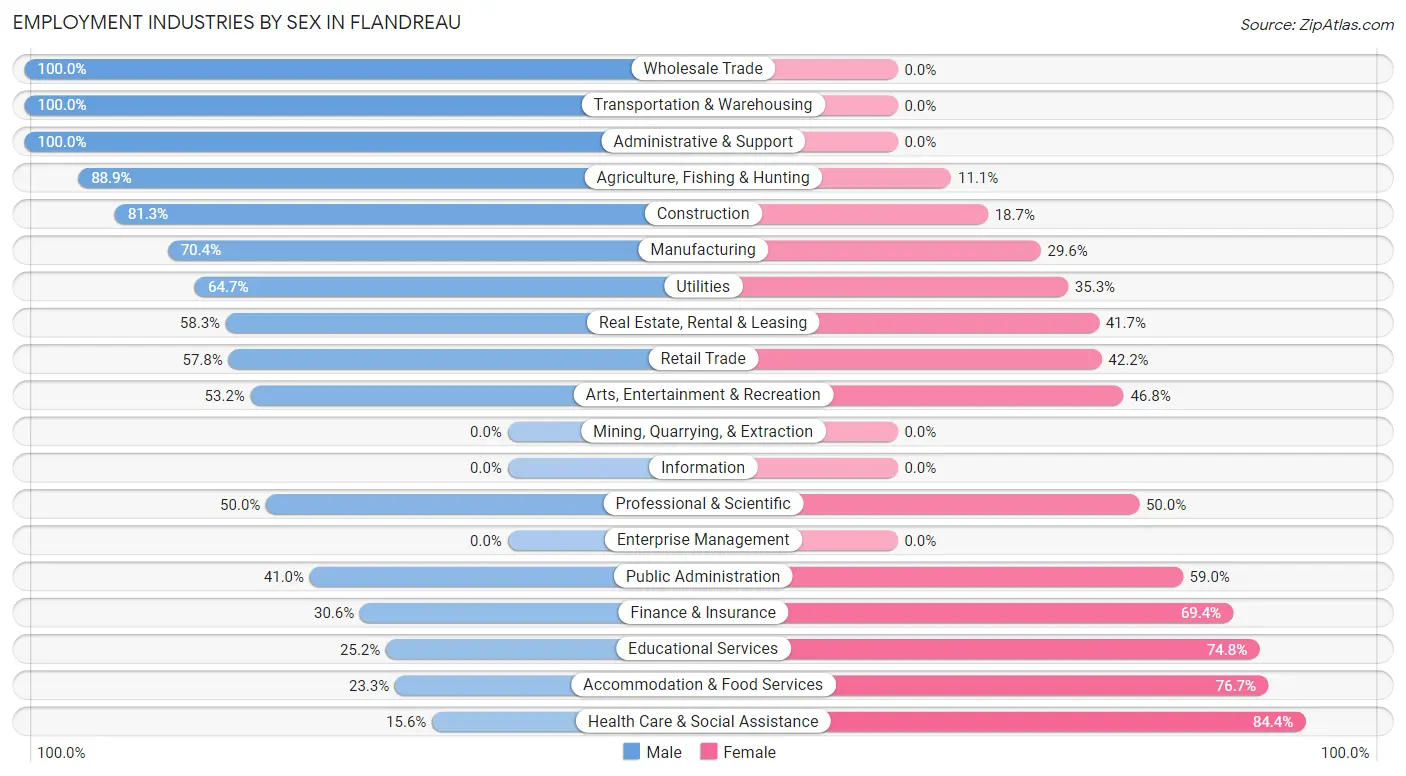
Employment Industries by Sex in Flandreau
The Flandreau industries that see more men than women are Wholesale Trade (100.0%), Transportation & Warehousing (100.0%), and Administrative & Support (100.0%), whereas the industries that tend to have a higher number of women are Health Care & Social Assistance (84.4%), Accommodation & Food Services (76.7%), and Educational Services (74.8%).
| Industry | Male | Female |
| Agriculture, Fishing & Hunting | 8 (88.9%) | 1 (11.1%) |
| Mining, Quarrying, & Extraction | 0 (0.0%) | 0 (0.0%) |
| Construction | 87 (81.3%) | 20 (18.7%) |
| Manufacturing | 38 (70.4%) | 16 (29.6%) |
| Wholesale Trade | 1 (100.0%) | 0 (0.0%) |
| Retail Trade | 52 (57.8%) | 38 (42.2%) |
| Transportation & Warehousing | 33 (100.0%) | 0 (0.0%) |
| Utilities | 11 (64.7%) | 6 (35.3%) |
| Information | 0 (0.0%) | 0 (0.0%) |
| Finance & Insurance | 11 (30.6%) | 25 (69.4%) |
| Real Estate, Rental & Leasing | 7 (58.3%) | 5 (41.7%) |
| Professional & Scientific | 13 (50.0%) | 13 (50.0%) |
| Enterprise Management | 0 (0.0%) | 0 (0.0%) |
| Administrative & Support | 4 (100.0%) | 0 (0.0%) |
| Educational Services | 38 (25.2%) | 113 (74.8%) |
| Health Care & Social Assistance | 28 (15.6%) | 151 (84.4%) |
| Arts, Entertainment & Recreation | 58 (53.2%) | 51 (46.8%) |
| Accommodation & Food Services | 21 (23.3%) | 69 (76.7%) |
| Public Administration | 34 (41.0%) | 49 (59.0%) |
| Total | 457 (44.2%) | 578 (55.8%) |
Education in Flandreau
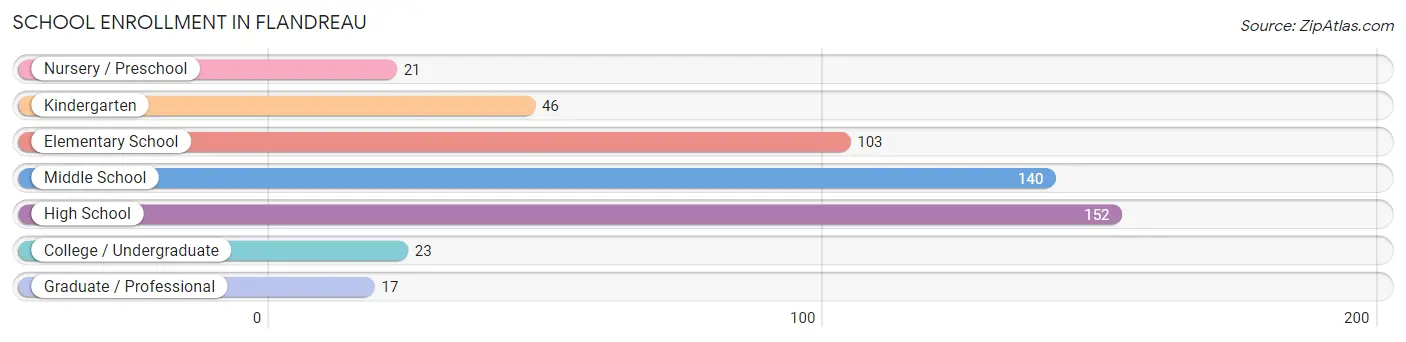
School Enrollment in Flandreau
The most common levels of schooling among the 502 students in Flandreau are high school (152 | 30.3%), middle school (140 | 27.9%), and elementary school (103 | 20.5%).
| School Level | # Students | % Students |
| Nursery / Preschool | 21 | 4.2% |
| Kindergarten | 46 | 9.2% |
| Elementary School | 103 | 20.5% |
| Middle School | 140 | 27.9% |
| High School | 152 | 30.3% |
| College / Undergraduate | 23 | 4.6% |
| Graduate / Professional | 17 | 3.4% |
| Total | 502 | 100.0% |
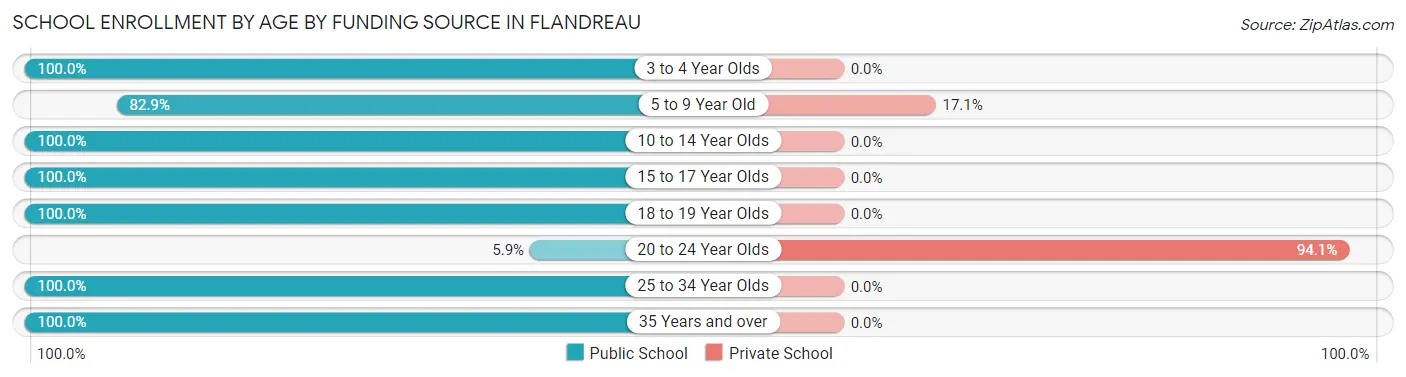
School Enrollment by Age by Funding Source in Flandreau
Out of a total of 502 students who are enrolled in schools in Flandreau, 41 (8.2%) attend a private institution, while the remaining 461 (91.8%) are enrolled in public schools. The age group of 20 to 24 year olds has the highest likelihood of being enrolled in private schools, with 16 (94.1% in the age bracket) enrolled. Conversely, the age group of 3 to 4 year olds has the lowest likelihood of being enrolled in a private school, with 8 (100.0% in the age bracket) attending a public institution.
| Age Bracket | Public School | Private School |
| 3 to 4 Year Olds | 8 (100.0%) | 0 (0.0%) |
| 5 to 9 Year Old | 121 (82.9%) | 25 (17.1%) |
| 10 to 14 Year Olds | 180 (100.0%) | 0 (0.0%) |
| 15 to 17 Year Olds | 104 (100.0%) | 0 (0.0%) |
| 18 to 19 Year Olds | 19 (100.0%) | 0 (0.0%) |
| 20 to 24 Year Olds | 1 (5.9%) | 16 (94.1%) |
| 25 to 34 Year Olds | 11 (100.0%) | 0 (0.0%) |
| 35 Years and over | 17 (100.0%) | 0 (0.0%) |
| Total | 461 (91.8%) | 41 (8.2%) |
Educational Attainment by Field of Study in Flandreau
Education (84 | 24.1%), science & technology (55 | 15.8%), literature & languages (45 | 12.9%), communications (31 | 8.9%), and business (27 | 7.7%) are the most common fields of study among 349 individuals in Flandreau who have obtained a bachelor's degree or higher.
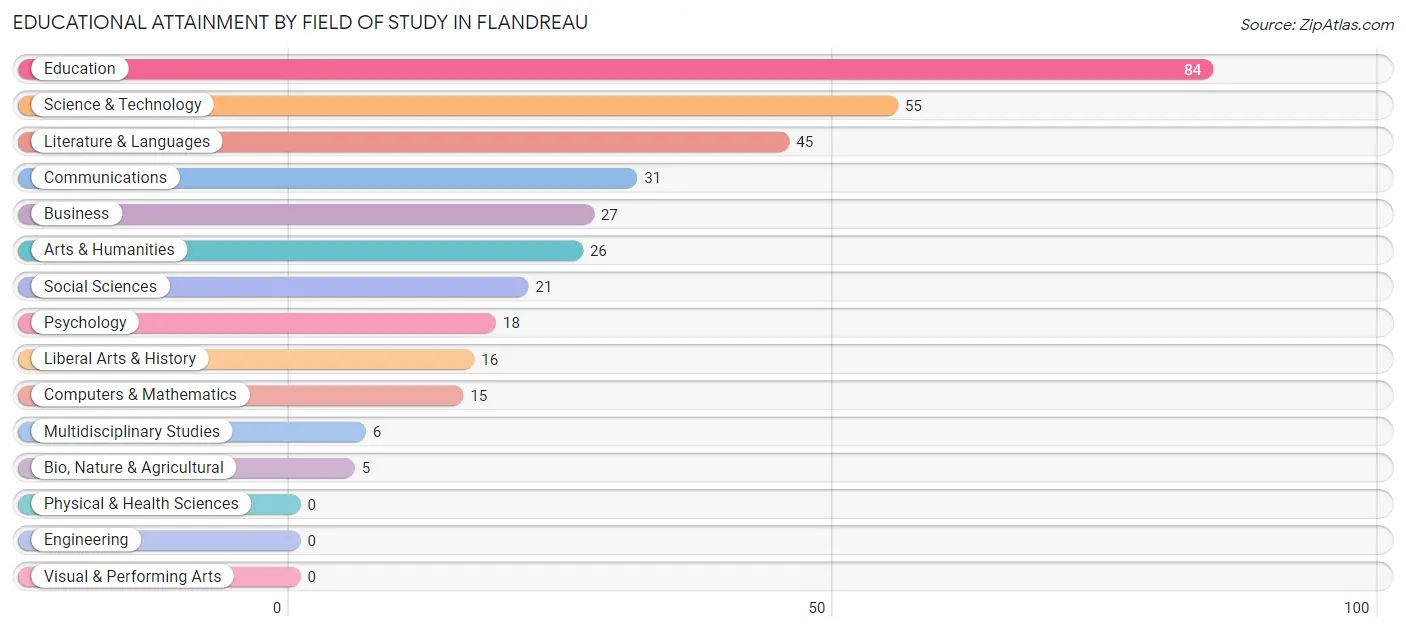
| Field of Study | # Graduates | % Graduates |
| Computers & Mathematics | 15 | 4.3% |
| Bio, Nature & Agricultural | 5 | 1.4% |
| Physical & Health Sciences | 0 | 0.0% |
| Psychology | 18 | 5.2% |
| Social Sciences | 21 | 6.0% |
| Engineering | 0 | 0.0% |
| Multidisciplinary Studies | 6 | 1.7% |
| Science & Technology | 55 | 15.8% |
| Business | 27 | 7.7% |
| Education | 84 | 24.1% |
| Literature & Languages | 45 | 12.9% |
| Liberal Arts & History | 16 | 4.6% |
| Visual & Performing Arts | 0 | 0.0% |
| Communications | 31 | 8.9% |
| Arts & Humanities | 26 | 7.4% |
| Total | 349 | 100.0% |
Transportation & Commute in Flandreau
Vehicle Availability by Sex in Flandreau
The most prevalent vehicle ownership categories in Flandreau are males with 2 vehicles (175, accounting for 39.2%) and females with 2 vehicles (175, making up 32.0%).
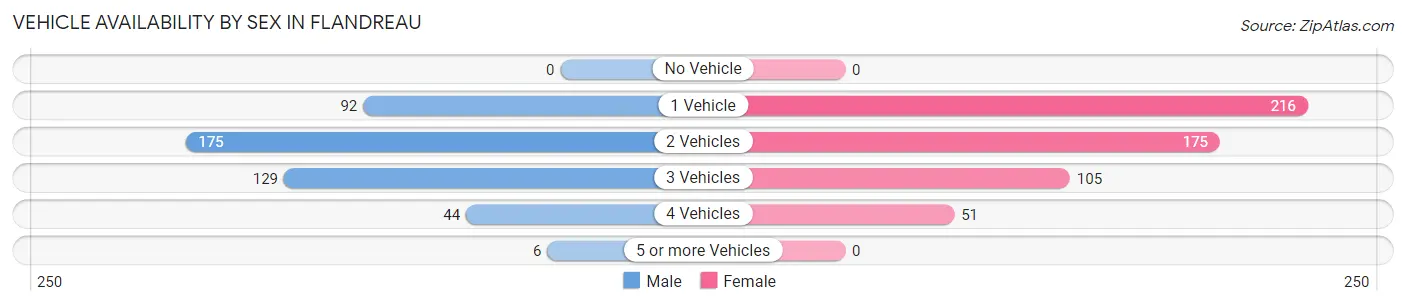
| Vehicles Available | Male | Female |
| No Vehicle | 0 (0.0%) | 0 (0.0%) |
| 1 Vehicle | 92 (20.6%) | 216 (39.5%) |
| 2 Vehicles | 175 (39.2%) | 175 (32.0%) |
| 3 Vehicles | 129 (28.9%) | 105 (19.2%) |
| 4 Vehicles | 44 (9.9%) | 51 (9.3%) |
| 5 or more Vehicles | 6 (1.3%) | 0 (0.0%) |
| Total | 446 (100.0%) | 547 (100.0%) |
Commute Time in Flandreau
The most frequently occuring commute durations in Flandreau are 5 to 9 minutes (415 commuters, 43.7%), less than 5 minutes (165 commuters, 17.4%), and 10 to 14 minutes (113 commuters, 11.9%).
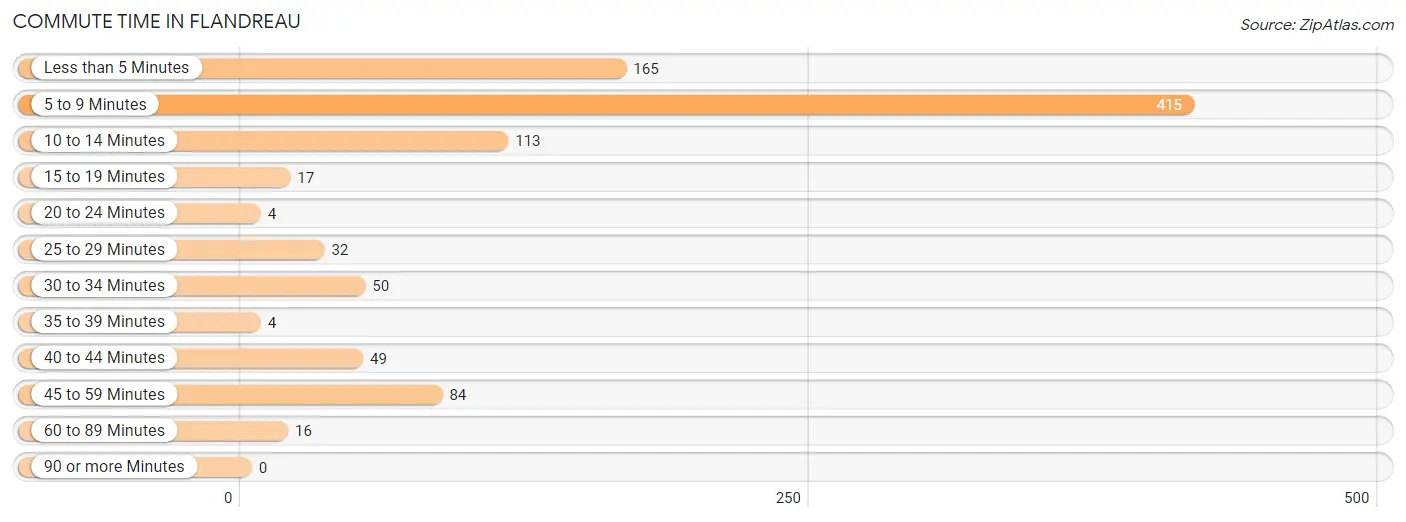
| Commute Time | # Commuters | % Commuters |
| Less than 5 Minutes | 165 | 17.4% |
| 5 to 9 Minutes | 415 | 43.7% |
| 10 to 14 Minutes | 113 | 11.9% |
| 15 to 19 Minutes | 17 | 1.8% |
| 20 to 24 Minutes | 4 | 0.4% |
| 25 to 29 Minutes | 32 | 3.4% |
| 30 to 34 Minutes | 50 | 5.3% |
| 35 to 39 Minutes | 4 | 0.4% |
| 40 to 44 Minutes | 49 | 5.2% |
| 45 to 59 Minutes | 84 | 8.8% |
| 60 to 89 Minutes | 16 | 1.7% |
| 90 or more Minutes | 0 | 0.0% |
Commute Time by Sex in Flandreau
The most common commute times in Flandreau are 5 to 9 minutes (181 commuters, 41.0%) for males and 5 to 9 minutes (234 commuters, 46.1%) for females.
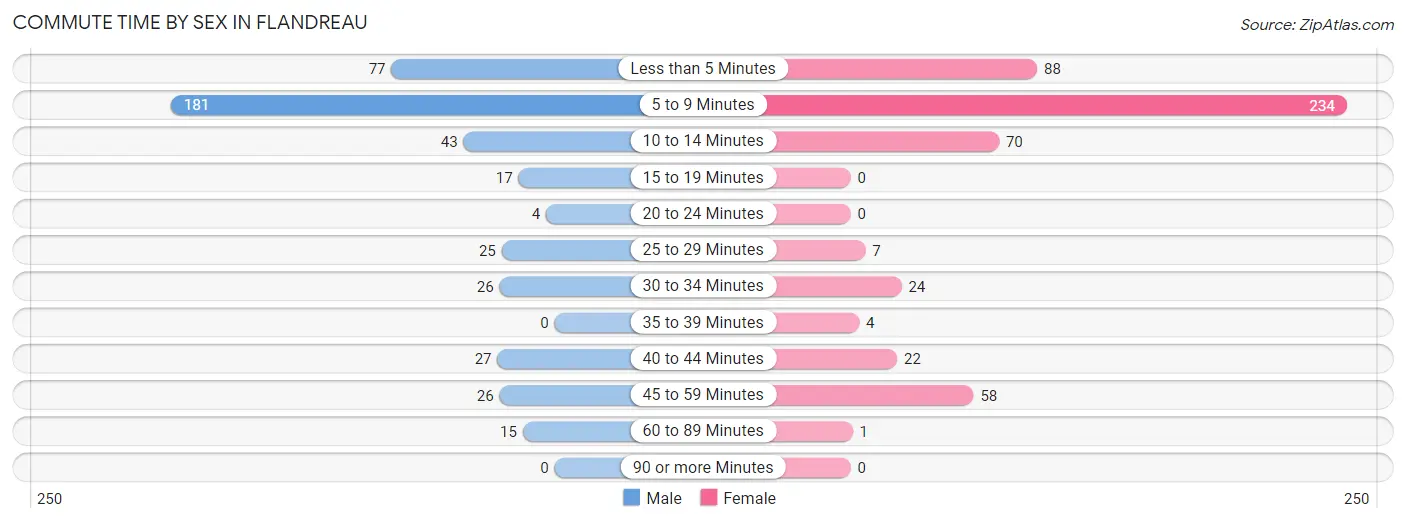
| Commute Time | Male | Female |
| Less than 5 Minutes | 77 (17.5%) | 88 (17.3%) |
| 5 to 9 Minutes | 181 (41.0%) | 234 (46.1%) |
| 10 to 14 Minutes | 43 (9.8%) | 70 (13.8%) |
| 15 to 19 Minutes | 17 (3.8%) | 0 (0.0%) |
| 20 to 24 Minutes | 4 (0.9%) | 0 (0.0%) |
| 25 to 29 Minutes | 25 (5.7%) | 7 (1.4%) |
| 30 to 34 Minutes | 26 (5.9%) | 24 (4.7%) |
| 35 to 39 Minutes | 0 (0.0%) | 4 (0.8%) |
| 40 to 44 Minutes | 27 (6.1%) | 22 (4.3%) |
| 45 to 59 Minutes | 26 (5.9%) | 58 (11.4%) |
| 60 to 89 Minutes | 15 (3.4%) | 1 (0.2%) |
| 90 or more Minutes | 0 (0.0%) | 0 (0.0%) |
Time of Departure to Work by Sex in Flandreau
The most frequent times of departure to work in Flandreau are 7:30 AM to 7:59 AM (82, 18.6%) for males and 7:30 AM to 7:59 AM (114, 22.4%) for females.
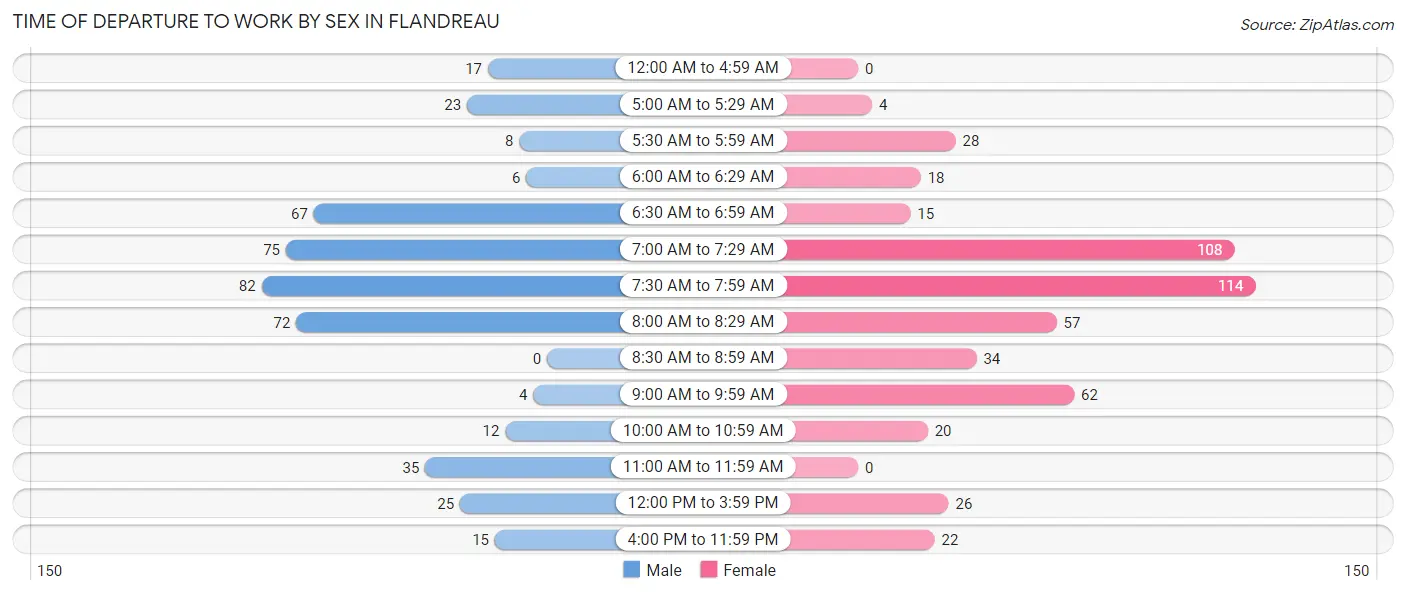
| Time of Departure | Male | Female |
| 12:00 AM to 4:59 AM | 17 (3.8%) | 0 (0.0%) |
| 5:00 AM to 5:29 AM | 23 (5.2%) | 4 (0.8%) |
| 5:30 AM to 5:59 AM | 8 (1.8%) | 28 (5.5%) |
| 6:00 AM to 6:29 AM | 6 (1.4%) | 18 (3.5%) |
| 6:30 AM to 6:59 AM | 67 (15.2%) | 15 (2.9%) |
| 7:00 AM to 7:29 AM | 75 (17.0%) | 108 (21.3%) |
| 7:30 AM to 7:59 AM | 82 (18.6%) | 114 (22.4%) |
| 8:00 AM to 8:29 AM | 72 (16.3%) | 57 (11.2%) |
| 8:30 AM to 8:59 AM | 0 (0.0%) | 34 (6.7%) |
| 9:00 AM to 9:59 AM | 4 (0.9%) | 62 (12.2%) |
| 10:00 AM to 10:59 AM | 12 (2.7%) | 20 (3.9%) |
| 11:00 AM to 11:59 AM | 35 (7.9%) | 0 (0.0%) |
| 12:00 PM to 3:59 PM | 25 (5.7%) | 26 (5.1%) |
| 4:00 PM to 11:59 PM | 15 (3.4%) | 22 (4.3%) |
| Total | 441 (100.0%) | 508 (100.0%) |
Housing Occupancy in Flandreau
Occupancy by Ownership in Flandreau
Of the total 926 dwellings in Flandreau, owner-occupied units account for 490 (52.9%), while renter-occupied units make up 436 (47.1%).
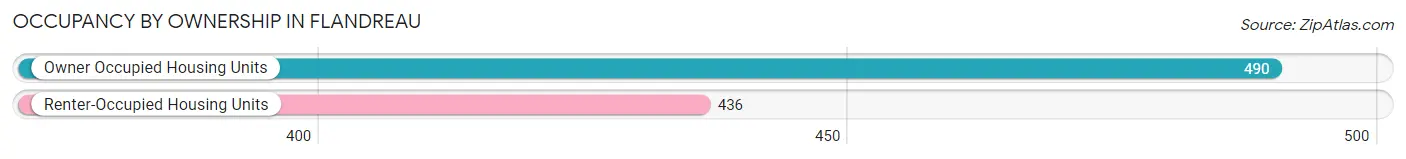
| Occupancy | # Housing Units | % Housing Units |
| Owner Occupied Housing Units | 490 | 52.9% |
| Renter-Occupied Housing Units | 436 | 47.1% |
| Total Occupied Housing Units | 926 | 100.0% |
Occupancy by Household Size in Flandreau
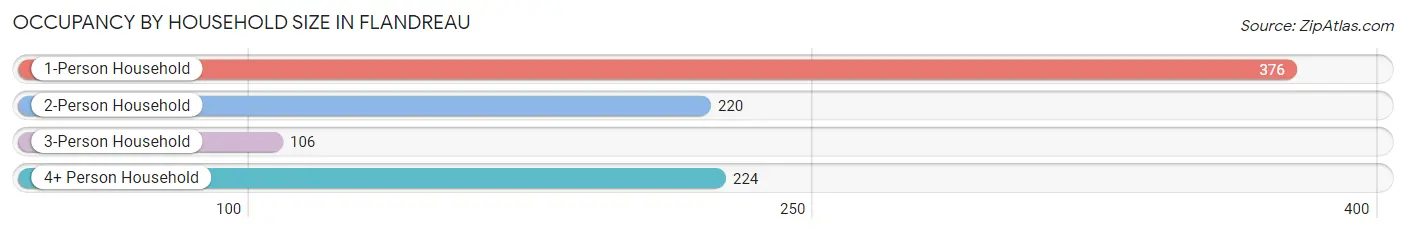
| Household Size | # Housing Units | % Housing Units |
| 1-Person Household | 376 | 40.6% |
| 2-Person Household | 220 | 23.8% |
| 3-Person Household | 106 | 11.5% |
| 4+ Person Household | 224 | 24.2% |
| Total Housing Units | 926 | 100.0% |
Occupancy by Ownership by Household Size in Flandreau
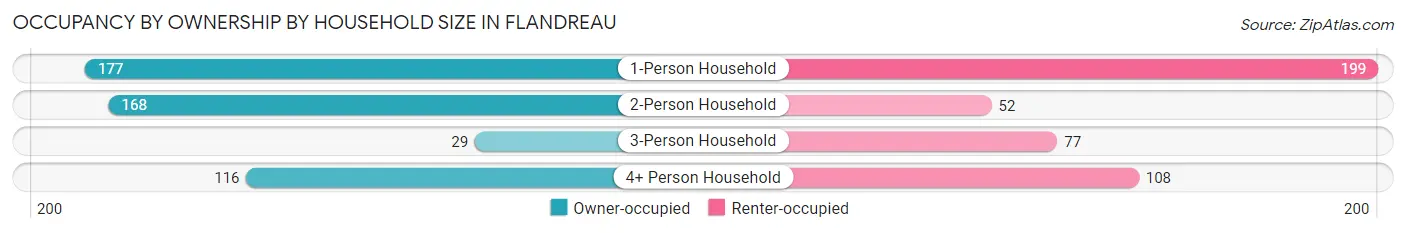
| Household Size | Owner-occupied | Renter-occupied |
| 1-Person Household | 177 (47.1%) | 199 (52.9%) |
| 2-Person Household | 168 (76.4%) | 52 (23.6%) |
| 3-Person Household | 29 (27.4%) | 77 (72.6%) |
| 4+ Person Household | 116 (51.8%) | 108 (48.2%) |
| Total Housing Units | 490 (52.9%) | 436 (47.1%) |
Occupancy by Educational Attainment in Flandreau
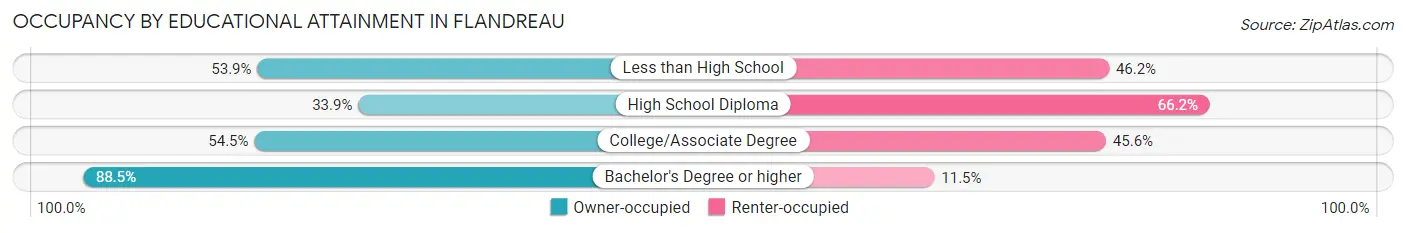
| Household Size | Owner-occupied | Renter-occupied |
| Less than High School | 28 (53.8%) | 24 (46.2%) |
| High School Diploma | 110 (33.9%) | 215 (66.1%) |
| College/Associate Degree | 214 (54.4%) | 179 (45.6%) |
| Bachelor's Degree or higher | 138 (88.5%) | 18 (11.5%) |
Occupancy by Age of Householder in Flandreau
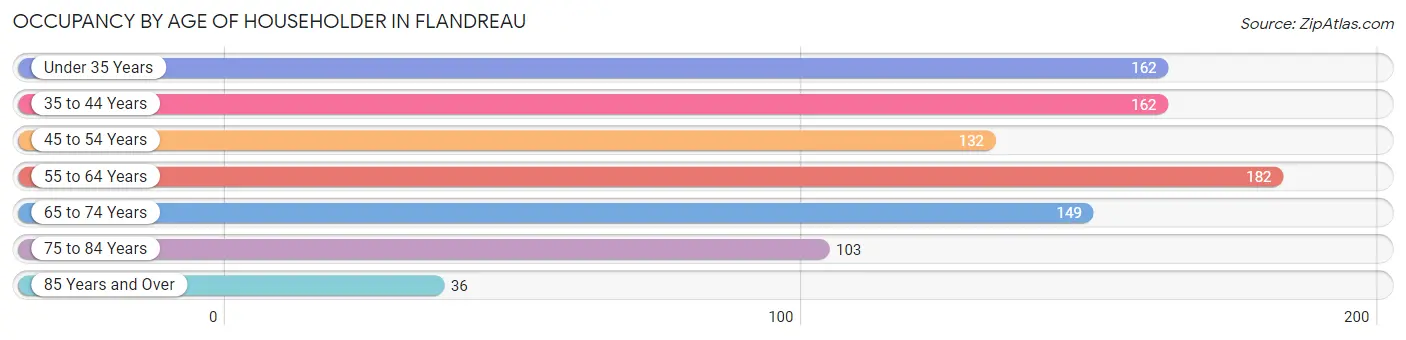
| Age Bracket | # Households | % Households |
| Under 35 Years | 162 | 17.5% |
| 35 to 44 Years | 162 | 17.5% |
| 45 to 54 Years | 132 | 14.2% |
| 55 to 64 Years | 182 | 19.7% |
| 65 to 74 Years | 149 | 16.1% |
| 75 to 84 Years | 103 | 11.1% |
| 85 Years and Over | 36 | 3.9% |
| Total | 926 | 100.0% |
Housing Finances in Flandreau
Median Income by Occupancy in Flandreau
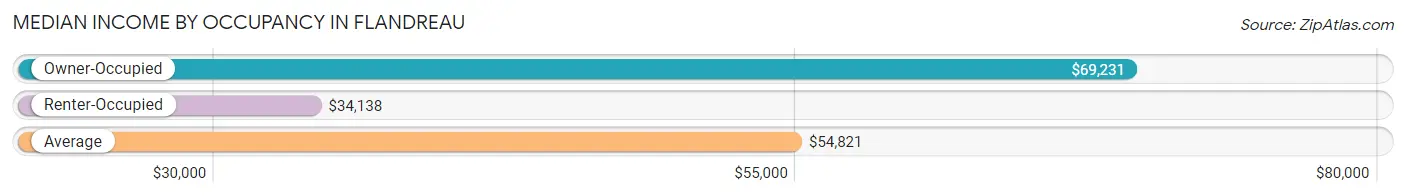
| Occupancy Type | # Households | Median Income |
| Owner-Occupied | 490 (52.9%) | $69,231 |
| Renter-Occupied | 436 (47.1%) | $34,138 |
| Average | 926 (100.0%) | $54,821 |
Occupancy by Householder Income Bracket in Flandreau
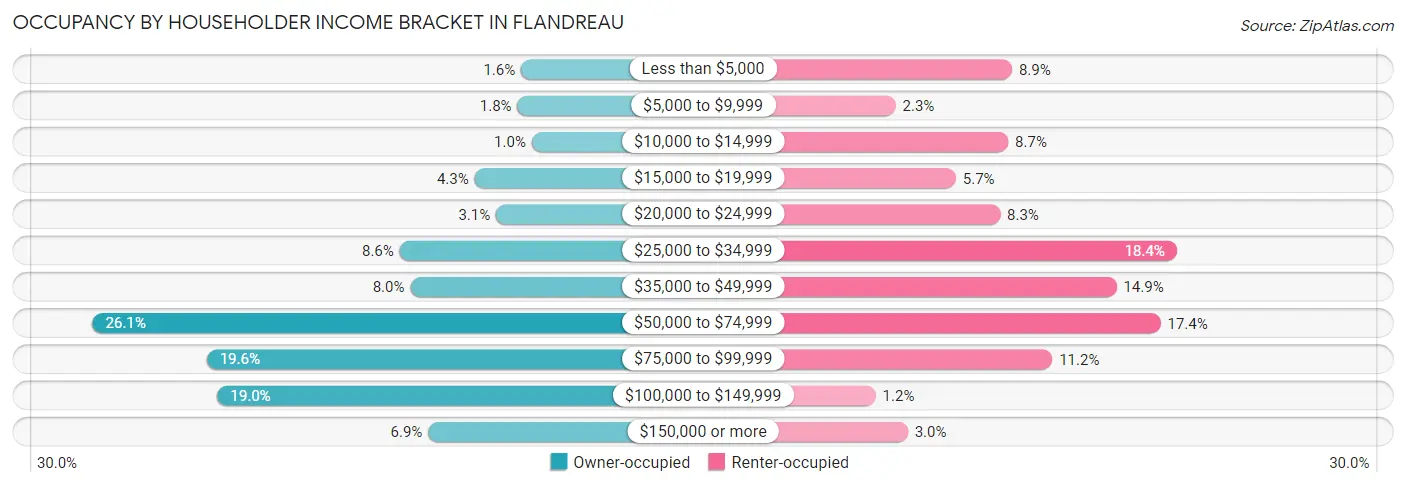
| Income Bracket | Owner-occupied | Renter-occupied |
| Less than $5,000 | 8 (1.6%) | 39 (8.9%) |
| $5,000 to $9,999 | 9 (1.8%) | 10 (2.3%) |
| $10,000 to $14,999 | 5 (1.0%) | 38 (8.7%) |
| $15,000 to $19,999 | 21 (4.3%) | 25 (5.7%) |
| $20,000 to $24,999 | 15 (3.1%) | 36 (8.3%) |
| $25,000 to $34,999 | 42 (8.6%) | 80 (18.3%) |
| $35,000 to $49,999 | 39 (8.0%) | 65 (14.9%) |
| $50,000 to $74,999 | 128 (26.1%) | 76 (17.4%) |
| $75,000 to $99,999 | 96 (19.6%) | 49 (11.2%) |
| $100,000 to $149,999 | 93 (19.0%) | 5 (1.1%) |
| $150,000 or more | 34 (6.9%) | 13 (3.0%) |
| Total | 490 (100.0%) | 436 (100.0%) |
Monthly Housing Cost Tiers in Flandreau
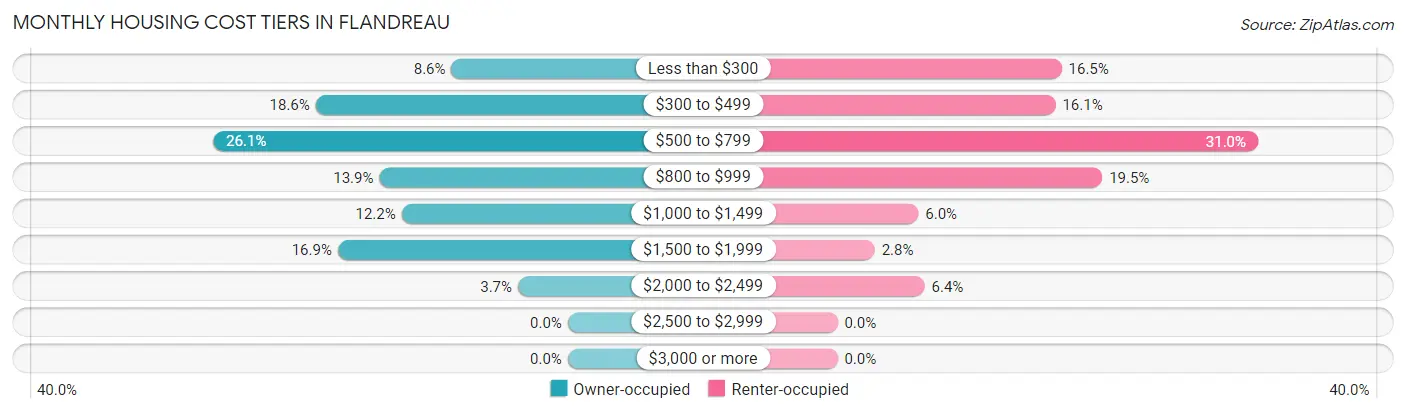
| Monthly Cost | Owner-occupied | Renter-occupied |
| Less than $300 | 42 (8.6%) | 72 (16.5%) |
| $300 to $499 | 91 (18.6%) | 70 (16.1%) |
| $500 to $799 | 128 (26.1%) | 135 (31.0%) |
| $800 to $999 | 68 (13.9%) | 85 (19.5%) |
| $1,000 to $1,499 | 60 (12.2%) | 26 (6.0%) |
| $1,500 to $1,999 | 83 (16.9%) | 12 (2.8%) |
| $2,000 to $2,499 | 18 (3.7%) | 28 (6.4%) |
| $2,500 to $2,999 | 0 (0.0%) | 0 (0.0%) |
| $3,000 or more | 0 (0.0%) | 0 (0.0%) |
| Total | 490 (100.0%) | 436 (100.0%) |
Physical Housing Characteristics in Flandreau
Housing Structures in Flandreau
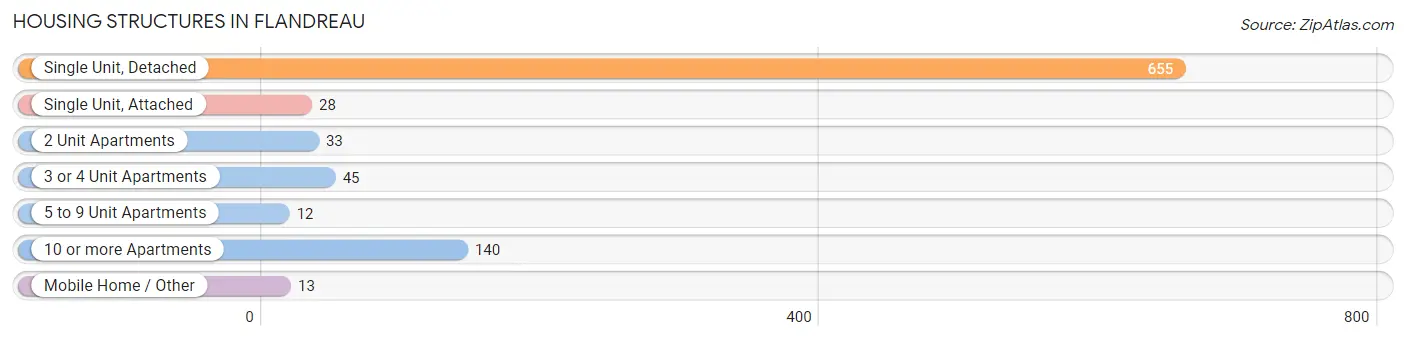
| Structure Type | # Housing Units | % Housing Units |
| Single Unit, Detached | 655 | 70.7% |
| Single Unit, Attached | 28 | 3.0% |
| 2 Unit Apartments | 33 | 3.6% |
| 3 or 4 Unit Apartments | 45 | 4.9% |
| 5 to 9 Unit Apartments | 12 | 1.3% |
| 10 or more Apartments | 140 | 15.1% |
| Mobile Home / Other | 13 | 1.4% |
| Total | 926 | 100.0% |
Housing Structures by Occupancy in Flandreau
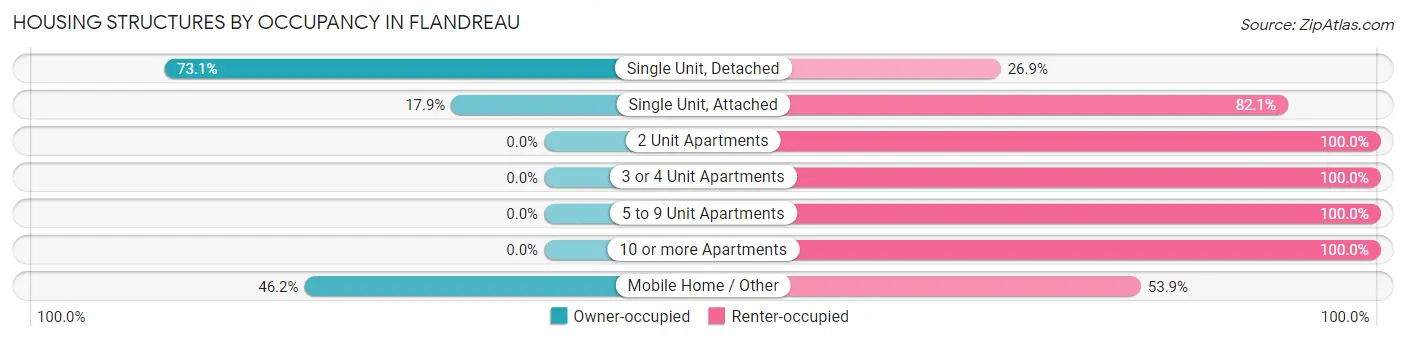
| Structure Type | Owner-occupied | Renter-occupied |
| Single Unit, Detached | 479 (73.1%) | 176 (26.9%) |
| Single Unit, Attached | 5 (17.9%) | 23 (82.1%) |
| 2 Unit Apartments | 0 (0.0%) | 33 (100.0%) |
| 3 or 4 Unit Apartments | 0 (0.0%) | 45 (100.0%) |
| 5 to 9 Unit Apartments | 0 (0.0%) | 12 (100.0%) |
| 10 or more Apartments | 0 (0.0%) | 140 (100.0%) |
| Mobile Home / Other | 6 (46.2%) | 7 (53.8%) |
| Total | 490 (52.9%) | 436 (47.1%) |
Housing Structures by Number of Rooms in Flandreau
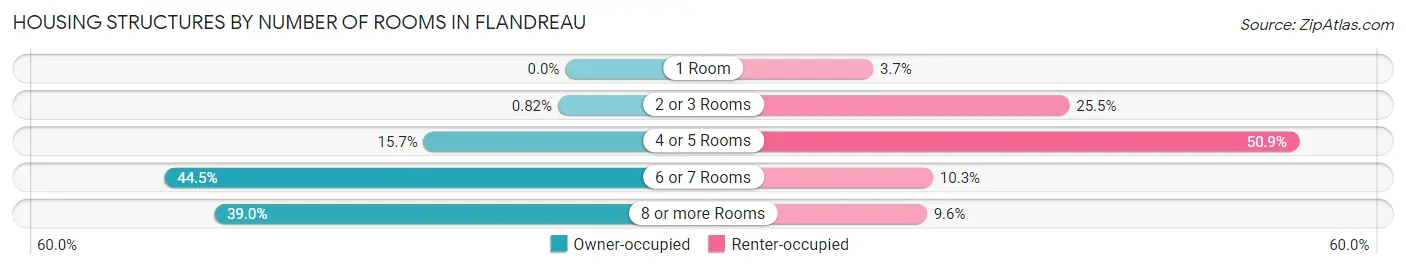
| Number of Rooms | Owner-occupied | Renter-occupied |
| 1 Room | 0 (0.0%) | 16 (3.7%) |
| 2 or 3 Rooms | 4 (0.8%) | 111 (25.5%) |
| 4 or 5 Rooms | 77 (15.7%) | 222 (50.9%) |
| 6 or 7 Rooms | 218 (44.5%) | 45 (10.3%) |
| 8 or more Rooms | 191 (39.0%) | 42 (9.6%) |
| Total | 490 (100.0%) | 436 (100.0%) |
Housing Structure by Heating Type in Flandreau
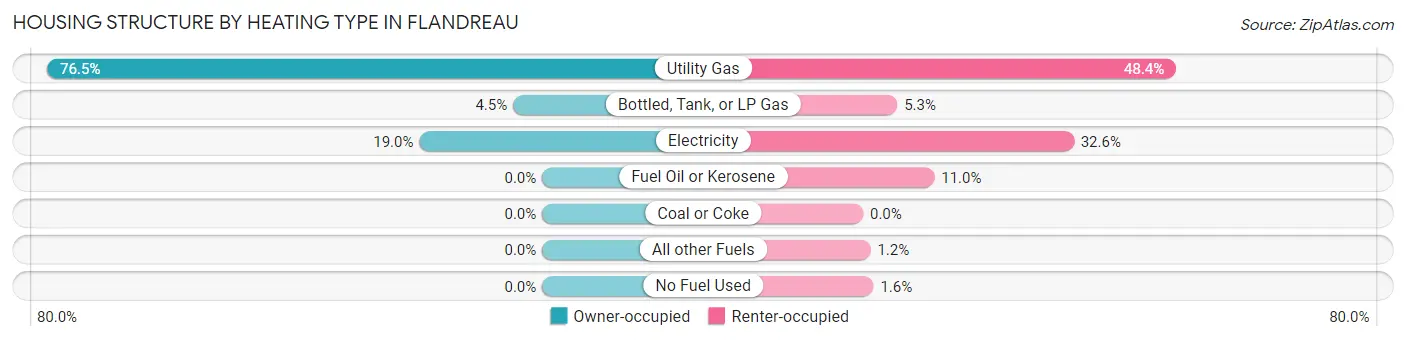
| Heating Type | Owner-occupied | Renter-occupied |
| Utility Gas | 375 (76.5%) | 211 (48.4%) |
| Bottled, Tank, or LP Gas | 22 (4.5%) | 23 (5.3%) |
| Electricity | 93 (19.0%) | 142 (32.6%) |
| Fuel Oil or Kerosene | 0 (0.0%) | 48 (11.0%) |
| Coal or Coke | 0 (0.0%) | 0 (0.0%) |
| All other Fuels | 0 (0.0%) | 5 (1.1%) |
| No Fuel Used | 0 (0.0%) | 7 (1.6%) |
| Total | 490 (100.0%) | 436 (100.0%) |
Household Vehicle Usage in Flandreau
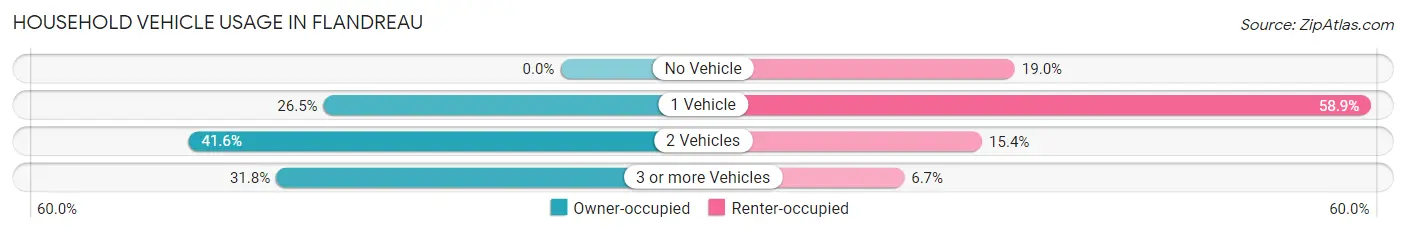
| Vehicles per Household | Owner-occupied | Renter-occupied |
| No Vehicle | 0 (0.0%) | 83 (19.0%) |
| 1 Vehicle | 130 (26.5%) | 257 (58.9%) |
| 2 Vehicles | 204 (41.6%) | 67 (15.4%) |
| 3 or more Vehicles | 156 (31.8%) | 29 (6.7%) |
| Total | 490 (100.0%) | 436 (100.0%) |
Real Estate & Mortgages in Flandreau
Real Estate and Mortgage Overview in Flandreau
| Characteristic | Without Mortgage | With Mortgage |
| Housing Units | 243 | 247 |
| Median Property Value | $118,800 | $147,500 |
| Median Household Income | $60,469 | $13 |
| Monthly Housing Costs | $490 | $0 |
| Real Estate Taxes | $1,880 | $4 |
Property Value by Mortgage Status in Flandreau
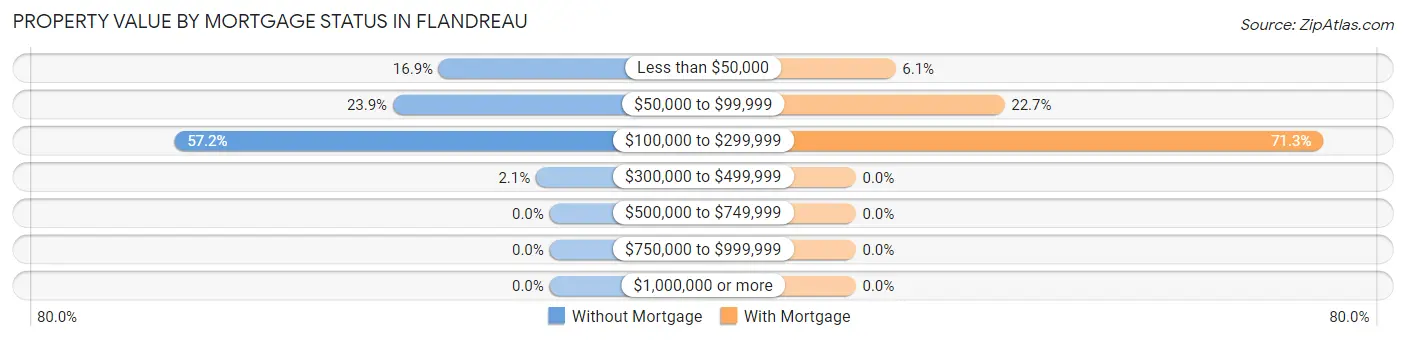
| Property Value | Without Mortgage | With Mortgage |
| Less than $50,000 | 41 (16.9%) | 15 (6.1%) |
| $50,000 to $99,999 | 58 (23.9%) | 56 (22.7%) |
| $100,000 to $299,999 | 139 (57.2%) | 176 (71.3%) |
| $300,000 to $499,999 | 5 (2.1%) | 0 (0.0%) |
| $500,000 to $749,999 | 0 (0.0%) | 0 (0.0%) |
| $750,000 to $999,999 | 0 (0.0%) | 0 (0.0%) |
| $1,000,000 or more | 0 (0.0%) | 0 (0.0%) |
| Total | 243 (100.0%) | 247 (100.0%) |
Household Income by Mortgage Status in Flandreau
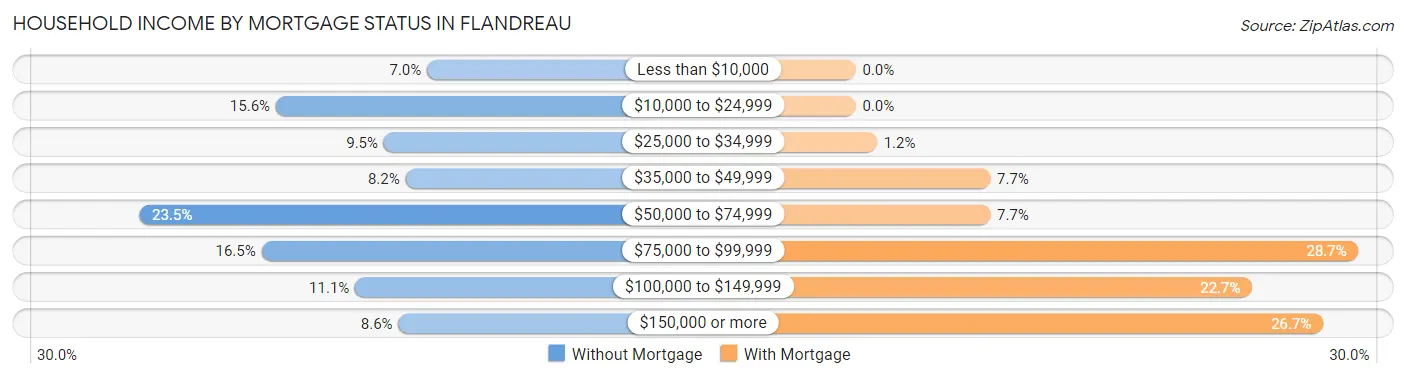
| Household Income | Without Mortgage | With Mortgage |
| Less than $10,000 | 17 (7.0%) | 0 (0.0%) |
| $10,000 to $24,999 | 38 (15.6%) | 0 (0.0%) |
| $25,000 to $34,999 | 23 (9.5%) | 3 (1.2%) |
| $35,000 to $49,999 | 20 (8.2%) | 19 (7.7%) |
| $50,000 to $74,999 | 57 (23.5%) | 19 (7.7%) |
| $75,000 to $99,999 | 40 (16.5%) | 71 (28.7%) |
| $100,000 to $149,999 | 27 (11.1%) | 56 (22.7%) |
| $150,000 or more | 21 (8.6%) | 66 (26.7%) |
| Total | 243 (100.0%) | 247 (100.0%) |
Property Value to Household Income Ratio in Flandreau
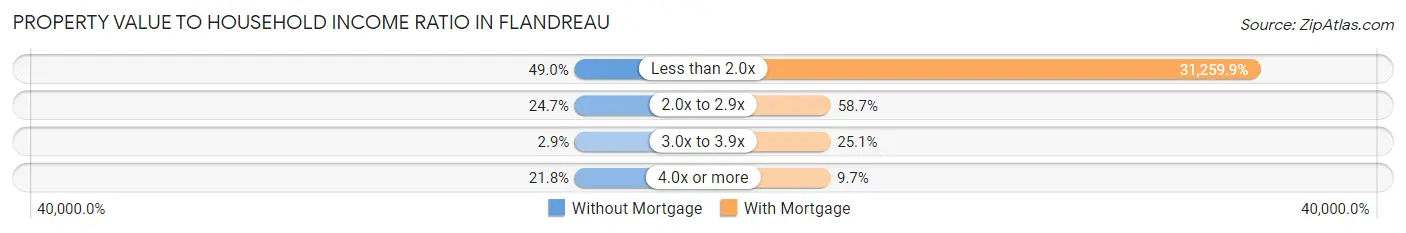
| Value-to-Income Ratio | Without Mortgage | With Mortgage |
| Less than 2.0x | 119 (49.0%) | 77,212 (31,259.9%) |
| 2.0x to 2.9x | 60 (24.7%) | 145 (58.7%) |
| 3.0x to 3.9x | 7 (2.9%) | 62 (25.1%) |
| 4.0x or more | 53 (21.8%) | 24 (9.7%) |
| Total | 243 (100.0%) | 247 (100.0%) |
Real Estate Taxes by Mortgage Status in Flandreau
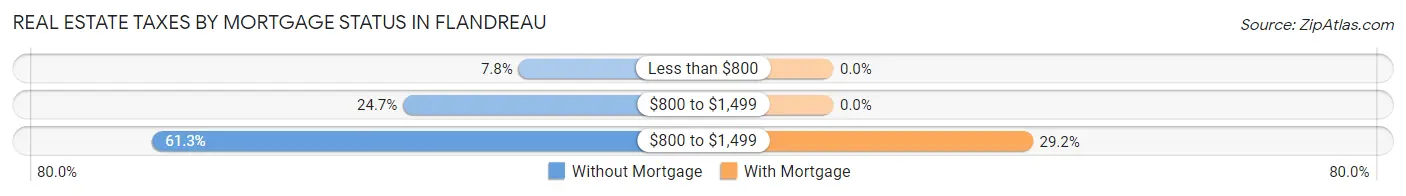
| Property Taxes | Without Mortgage | With Mortgage |
| Less than $800 | 19 (7.8%) | 0 (0.0%) |
| $800 to $1,499 | 60 (24.7%) | 0 (0.0%) |
| $800 to $1,499 | 149 (61.3%) | 72 (29.1%) |
| Total | 243 (100.0%) | 247 (100.0%) |
Health & Disability in Flandreau
Health Insurance Coverage by Age in Flandreau
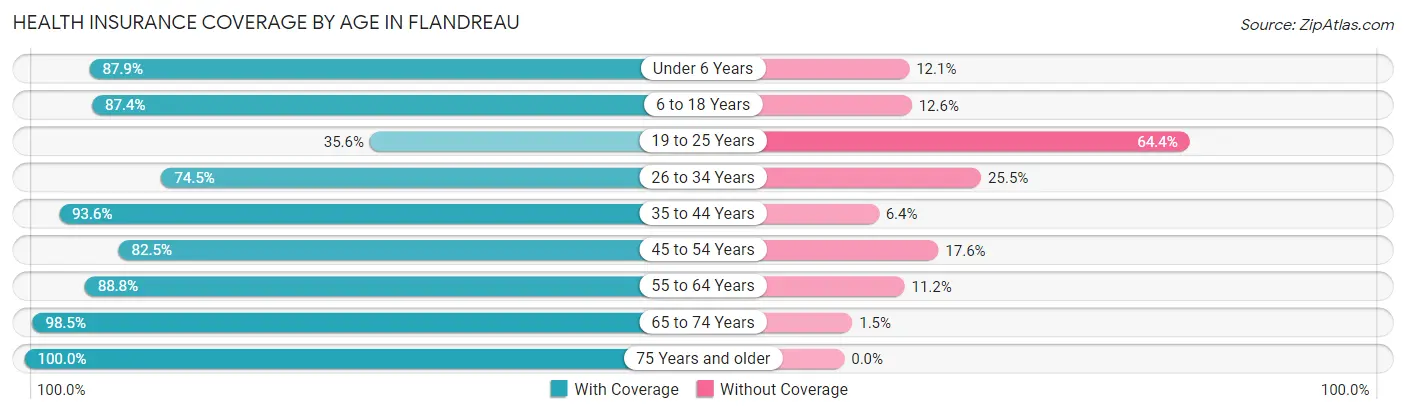
| Age Bracket | With Coverage | Without Coverage |
| Under 6 Years | 225 (87.9%) | 31 (12.1%) |
| 6 to 18 Years | 396 (87.4%) | 57 (12.6%) |
| 19 to 25 Years | 31 (35.6%) | 56 (64.4%) |
| 26 to 34 Years | 178 (74.5%) | 61 (25.5%) |
| 35 to 44 Years | 277 (93.6%) | 19 (6.4%) |
| 45 to 54 Years | 155 (82.5%) | 33 (17.5%) |
| 55 to 64 Years | 253 (88.8%) | 32 (11.2%) |
| 65 to 74 Years | 199 (98.5%) | 3 (1.5%) |
| 75 Years and older | 179 (100.0%) | 0 (0.0%) |
| Total | 1,893 (86.6%) | 292 (13.4%) |
Health Insurance Coverage by Citizenship Status in Flandreau
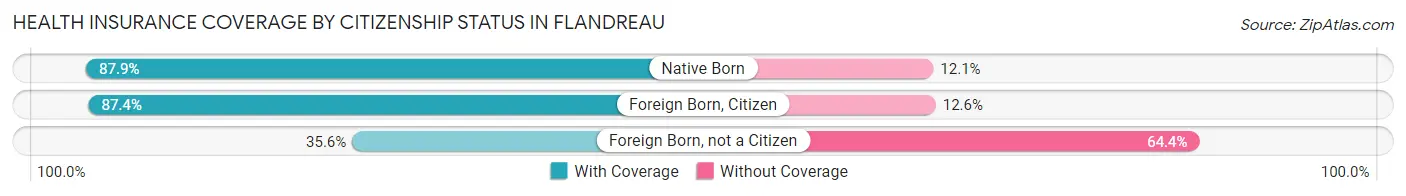
| Citizenship Status | With Coverage | Without Coverage |
| Native Born | 225 (87.9%) | 31 (12.1%) |
| Foreign Born, Citizen | 396 (87.4%) | 57 (12.6%) |
| Foreign Born, not a Citizen | 31 (35.6%) | 56 (64.4%) |
Health Insurance Coverage by Household Income in Flandreau
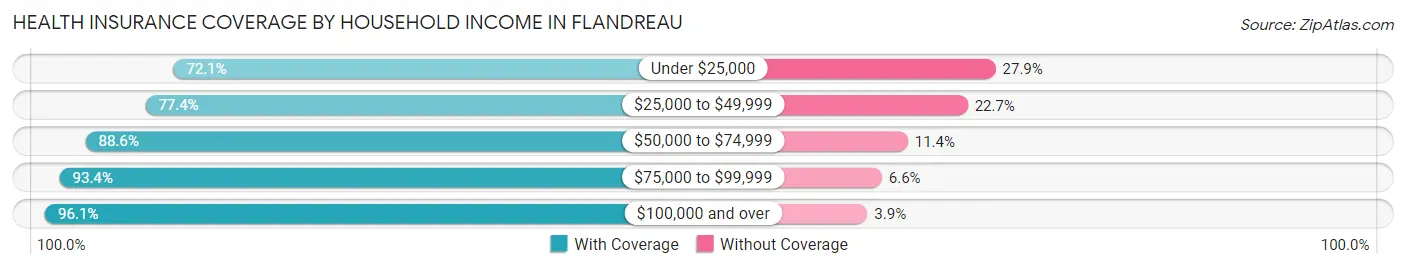
| Household Income | With Coverage | Without Coverage |
| Under $25,000 | 282 (72.1%) | 109 (27.9%) |
| $25,000 to $49,999 | 263 (77.3%) | 77 (22.7%) |
| $50,000 to $74,999 | 434 (88.6%) | 56 (11.4%) |
| $75,000 to $99,999 | 441 (93.4%) | 31 (6.6%) |
| $100,000 and over | 473 (96.1%) | 19 (3.9%) |
Public vs Private Health Insurance Coverage by Age in Flandreau
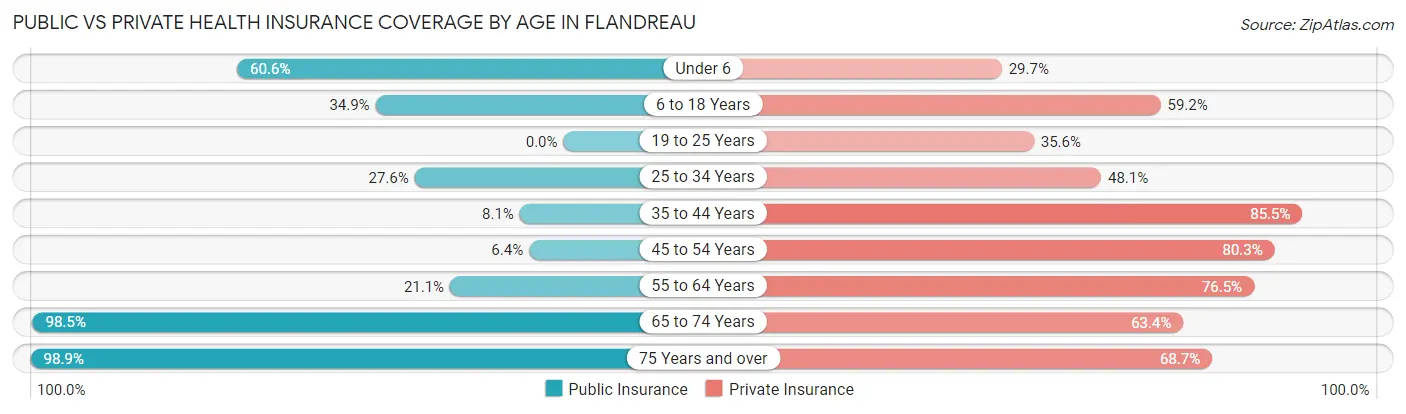
| Age Bracket | Public Insurance | Private Insurance |
| Under 6 | 155 (60.6%) | 76 (29.7%) |
| 6 to 18 Years | 158 (34.9%) | 268 (59.2%) |
| 19 to 25 Years | 0 (0.0%) | 31 (35.6%) |
| 25 to 34 Years | 66 (27.6%) | 115 (48.1%) |
| 35 to 44 Years | 24 (8.1%) | 253 (85.5%) |
| 45 to 54 Years | 12 (6.4%) | 151 (80.3%) |
| 55 to 64 Years | 60 (21.0%) | 218 (76.5%) |
| 65 to 74 Years | 199 (98.5%) | 128 (63.4%) |
| 75 Years and over | 177 (98.9%) | 123 (68.7%) |
| Total | 851 (39.0%) | 1,363 (62.4%) |
Disability Status by Sex by Age in Flandreau
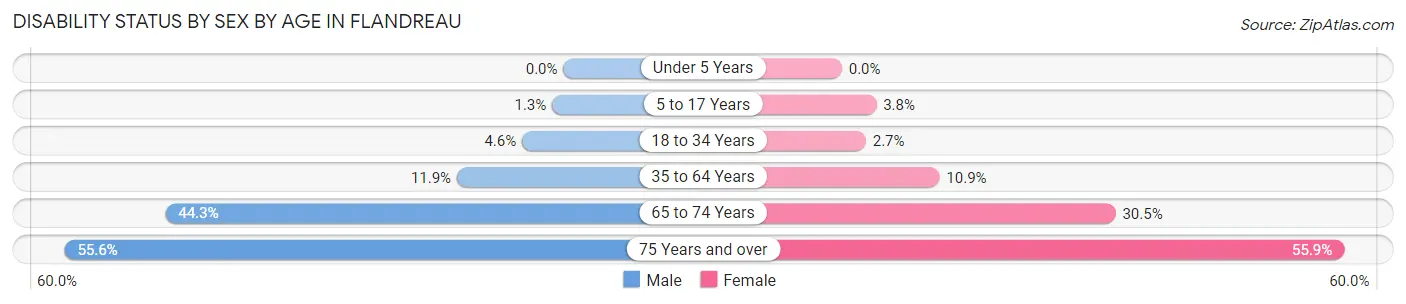
| Age Bracket | Male | Female |
| Under 5 Years | 0 (0.0%) | 0 (0.0%) |
| 5 to 17 Years | 3 (1.3%) | 8 (3.8%) |
| 18 to 34 Years | 8 (4.6%) | 5 (2.7%) |
| 35 to 64 Years | 41 (11.8%) | 46 (10.9%) |
| 65 to 74 Years | 43 (44.3%) | 32 (30.5%) |
| 75 Years and over | 20 (55.6%) | 80 (55.9%) |
Disability Class by Sex by Age in Flandreau
Disability Class: Hearing Difficulty
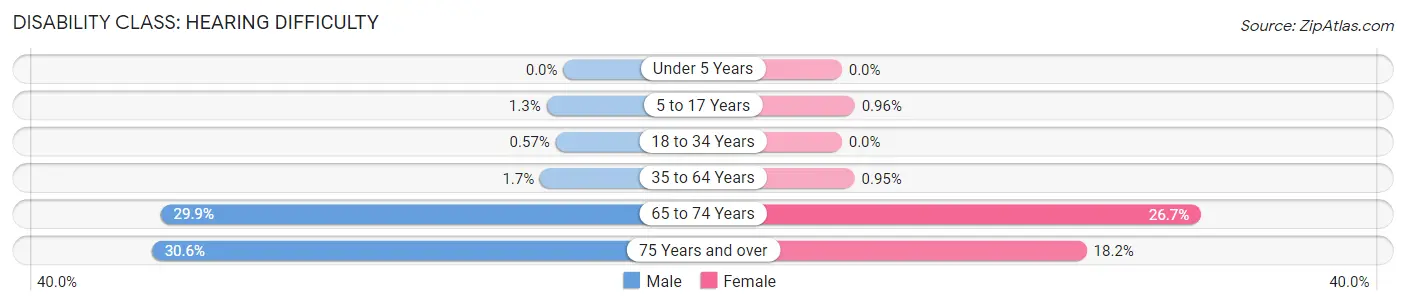
| Age Bracket | Male | Female |
| Under 5 Years | 0 (0.0%) | 0 (0.0%) |
| 5 to 17 Years | 3 (1.3%) | 2 (1.0%) |
| 18 to 34 Years | 1 (0.6%) | 0 (0.0%) |
| 35 to 64 Years | 6 (1.7%) | 4 (0.9%) |
| 65 to 74 Years | 29 (29.9%) | 28 (26.7%) |
| 75 Years and over | 11 (30.6%) | 26 (18.2%) |
Disability Class: Vision Difficulty
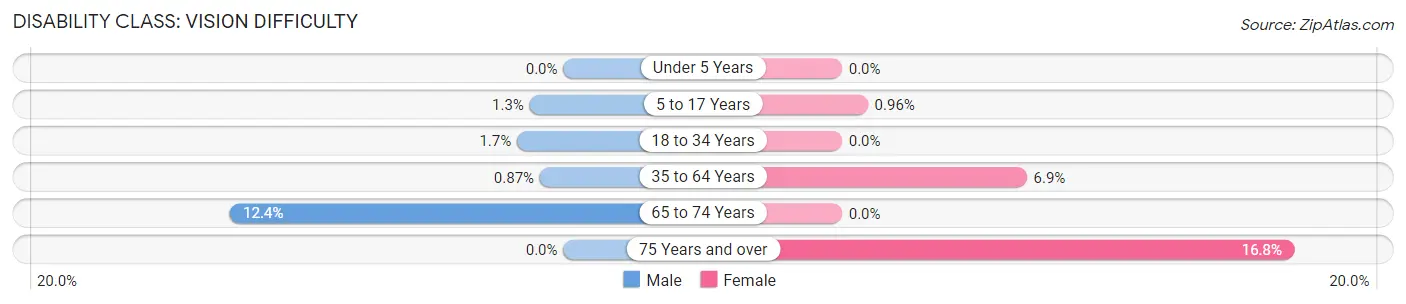
| Age Bracket | Male | Female |
| Under 5 Years | 0 (0.0%) | 0 (0.0%) |
| 5 to 17 Years | 3 (1.3%) | 2 (1.0%) |
| 18 to 34 Years | 3 (1.7%) | 0 (0.0%) |
| 35 to 64 Years | 3 (0.9%) | 29 (6.9%) |
| 65 to 74 Years | 12 (12.4%) | 0 (0.0%) |
| 75 Years and over | 0 (0.0%) | 24 (16.8%) |
Disability Class: Cognitive Difficulty
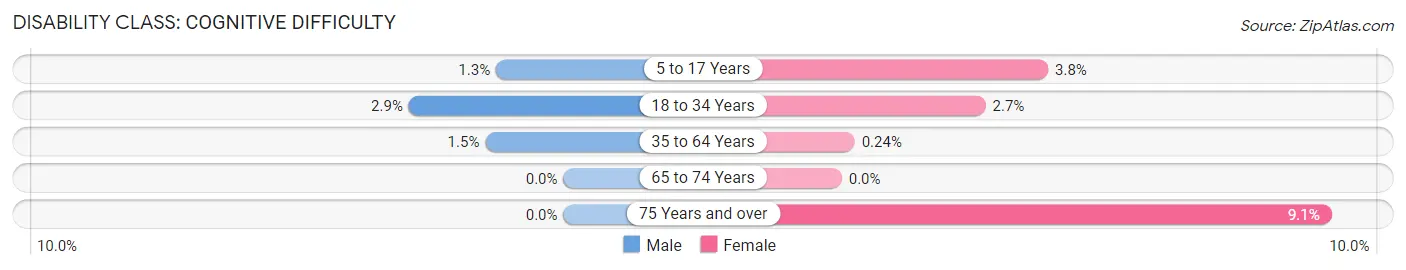
| Age Bracket | Male | Female |
| 5 to 17 Years | 3 (1.3%) | 8 (3.8%) |
| 18 to 34 Years | 5 (2.9%) | 5 (2.7%) |
| 35 to 64 Years | 5 (1.5%) | 1 (0.2%) |
| 65 to 74 Years | 0 (0.0%) | 0 (0.0%) |
| 75 Years and over | 0 (0.0%) | 13 (9.1%) |
Disability Class: Ambulatory Difficulty
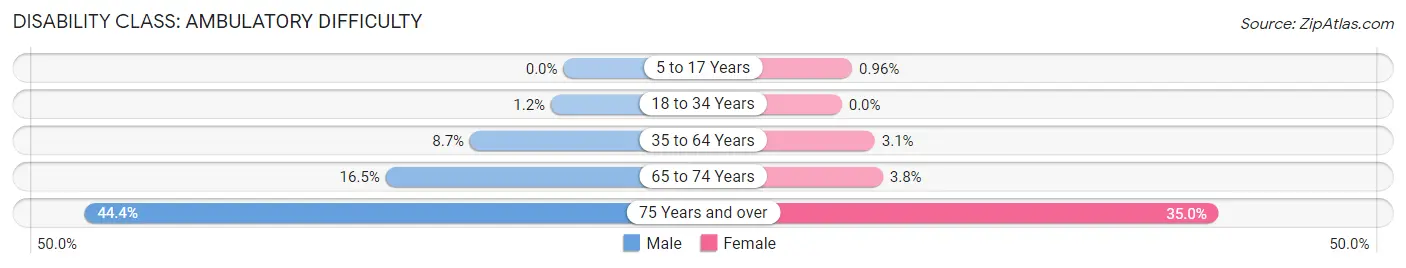
| Age Bracket | Male | Female |
| 5 to 17 Years | 0 (0.0%) | 2 (1.0%) |
| 18 to 34 Years | 2 (1.1%) | 0 (0.0%) |
| 35 to 64 Years | 30 (8.7%) | 13 (3.1%) |
| 65 to 74 Years | 16 (16.5%) | 4 (3.8%) |
| 75 Years and over | 16 (44.4%) | 50 (35.0%) |
Disability Class: Self-Care Difficulty
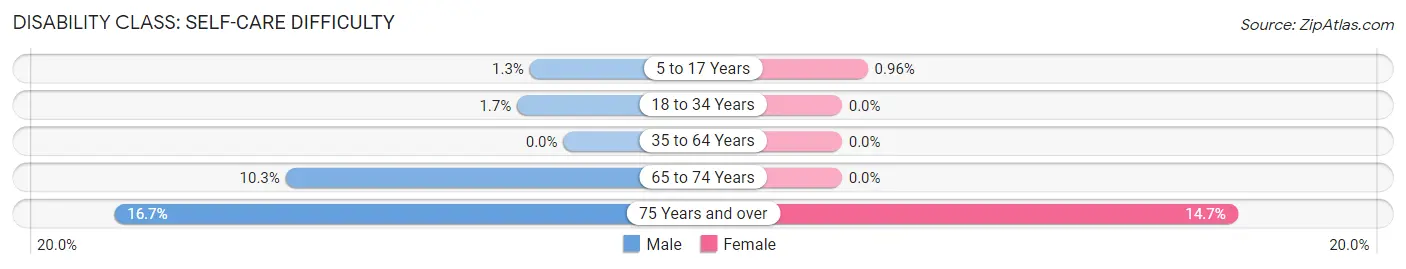
| Age Bracket | Male | Female |
| 5 to 17 Years | 3 (1.3%) | 2 (1.0%) |
| 18 to 34 Years | 3 (1.7%) | 0 (0.0%) |
| 35 to 64 Years | 0 (0.0%) | 0 (0.0%) |
| 65 to 74 Years | 10 (10.3%) | 0 (0.0%) |
| 75 Years and over | 6 (16.7%) | 21 (14.7%) |
Technology Access in Flandreau
Computing Device Access in Flandreau
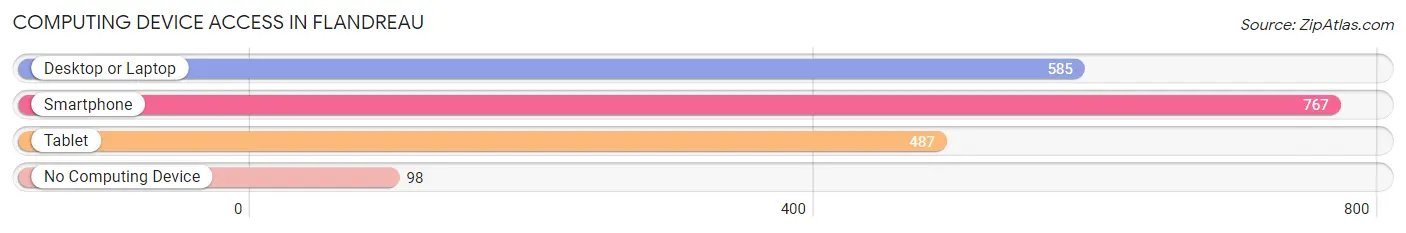
| Device Type | # Households | % Households |
| Desktop or Laptop | 585 | 63.2% |
| Smartphone | 767 | 82.8% |
| Tablet | 487 | 52.6% |
| No Computing Device | 98 | 10.6% |
| Total | 926 | 100.0% |
Internet Access in Flandreau
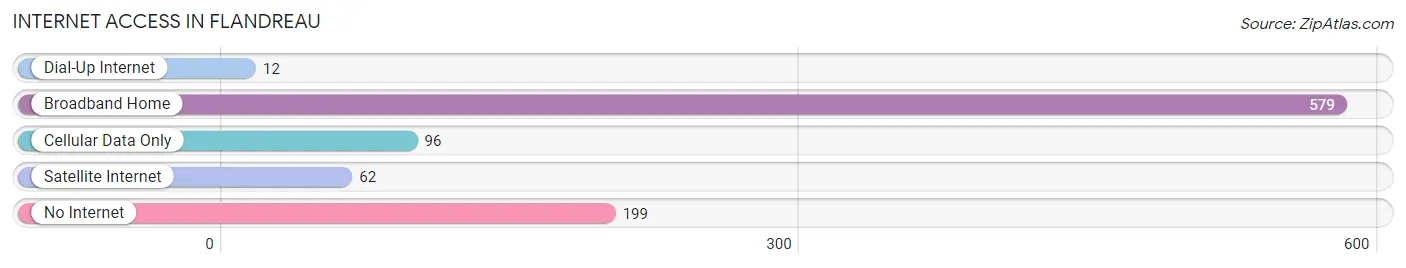
| Internet Type | # Households | % Households |
| Dial-Up Internet | 12 | 1.3% |
| Broadband Home | 579 | 62.5% |
| Cellular Data Only | 96 | 10.4% |
| Satellite Internet | 62 | 6.7% |
| No Internet | 199 | 21.5% |
| Total | 926 | 100.0% |
Flandreau Summary
Flandreau is a small city located in Moody County, South Dakota, United States. It is situated along the Big Sioux River, approximately 25 miles (40 km) north of Sioux Falls. The population was 2,341 at the 2010 census.
History
Flandreau was founded in 1857 by a group of settlers from the Netherlands. The city was named after a Dutch nobleman, Baron de Flandre. The settlers were attracted to the area by its fertile soil and abundant natural resources.
The city was incorporated in 1881 and quickly became a center for trade and commerce. The railroad arrived in 1883, connecting Flandreau to the rest of the state and the nation. The city was also home to a number of businesses, including a flour mill, a creamery, a brewery, and a brickyard.
In the early 20th century, Flandreau was a popular destination for tourists. The city was home to a number of resorts, including the Flandreau Hotel, which was built in 1906. The hotel was a popular destination for visitors from all over the Midwest.
Geography
Flandreau is located at 43°41'25" North, 96°37'17" West (43.690278, -96.621389). According to the United States Census Bureau, the city has a total area of 2.2 square miles (5.7 km2), all of it land.
The city is situated along the Big Sioux River, which flows through the city from north to south. The river is a popular destination for fishing, boating, and other recreational activities.
Economy
Flandreau’s economy is largely based on agriculture and manufacturing. The city is home to a number of agricultural businesses, including a feed mill, a grain elevator, and a dairy.
The city is also home to a number of manufacturing businesses, including a furniture factory, a plastics factory, and a metal fabrication plant.
Demographics
As of the 2010 census, there were 2,341 people, 945 households, and 590 families residing in the city. The population density was 1,053.2 people per square mile (406.7/km2). There were 1,039 housing units at an average density of 467.2 per square mile (180.3/km2). The racial makeup of the city was 94.2% White, 0.3% African American, 0.7% Native American, 0.2% Asian, 0.1% Pacific Islander, 2.7% from other races, and 1.8% from two or more races. Hispanic or Latino of any race were 4.7% of the population.
There were 945 households, out of which 28.2% had children under the age of 18 living with them, 46.2% were married couples living together, 10.3% had a female householder with no husband present, and 38.7% were non-families. 33.2% of all households were made up of individuals, and 16.2% had someone living alone who was 65 years of age or older. The average household size was 2.37 and the average family size was 3.02.
In the city, the population was spread out, with 25.2% under the age of 18, 8.2% from 18 to 24, 25.7% from 25 to 44, 21.2% from 45 to 64, and 19.7% who were 65 years of age or older. The median age was 38 years. For every 100 females, there were 91.2 males. For every 100 females age 18 and over, there were 87.2 males.
The median income for a household in the city was $31,250, and the median income for a family was $37,500. Males had a median income of $30,000 versus $20,000 for females. The per capita income for the city was $15,945. About 8.2% of families and 11.2% of the population were below the poverty line, including 14.2% of those under age 18 and 8.2% of those age 65 or over.
Common Questions
What is Per Capita Income in Flandreau?
Per Capita income in Flandreau is $25,677.
What is the Median Family Income in Flandreau?
Median Family Income in Flandreau is $67,321.
What is the Median Household income in Flandreau?
Median Household Income in Flandreau is $54,821.
What is Income or Wage Gap in Flandreau?
Income or Wage Gap in Flandreau is 14.5%.
Women in Flandreau earn 85.5 cents for every dollar earned by a man.
What is Inequality or Gini Index in Flandreau?
Inequality or Gini Index in Flandreau is 0.42.
What is the Total Population of Flandreau?
Total Population of Flandreau is 2,246.
What is the Total Male Population of Flandreau?
Total Male Population of Flandreau is 1,050.
What is the Total Female Population of Flandreau?
Total Female Population of Flandreau is 1,196.
What is the Ratio of Males per 100 Females in Flandreau?
There are 87.79 Males per 100 Females in Flandreau.
What is the Ratio of Females per 100 Males in Flandreau?
There are 113.90 Females per 100 Males in Flandreau.
What is the Median Population Age in Flandreau?
Median Population Age in Flandreau is 37.5 Years.
What is the Average Family Size in Flandreau
Average Family Size in Flandreau is 3.2 People.
What is the Average Household Size in Flandreau
Average Household Size in Flandreau is 2.4 People.
How Large is the Labor Force in Flandreau?
There are 1,058 People in the Labor Forcein in Flandreau.
What is the Percentage of People in the Labor Force in Flandreau?
64.6% of People are in the Labor Force in Flandreau.
What is the Unemployment Rate in Flandreau?
Unemployment Rate in Flandreau is 2.2%.