Avon, SD Map & Demographics
Avon Map
Avon Overview
$22,043
PER CAPITA INCOME
$74,583
AVG FAMILY INCOME
$49,750
AVG HOUSEHOLD INCOME
14.6%
WAGE / INCOME GAP [ % ]
85.4¢/ $1
WAGE / INCOME GAP [ $ ]
0.36
INEQUALITY / GINI INDEX
707
TOTAL POPULATION
370
MALE POPULATION
337
FEMALE POPULATION
109.79
MALES / 100 FEMALES
91.08
FEMALES / 100 MALES
34.2
MEDIAN AGE
3.8
AVG FAMILY SIZE
3.0
AVG HOUSEHOLD SIZE
279
LABOR FORCE [ PEOPLE ]
64.0%
PERCENT IN LABOR FORCE
2.2%
UNEMPLOYMENT RATE
Avon Zip Codes
Avon Area Codes
Income in Avon
Income Overview in Avon
Per Capita Income in Avon is $22,043, while median incomes of families and households are $74,583 and $49,750 respectively.
| Characteristic | Number | Measure |
| Per Capita Income | 707 | $22,043 |
| Median Family Income | 164 | $74,583 |
| Mean Family Income | 164 | $74,453 |
| Median Household Income | 239 | $49,750 |
| Mean Household Income | 239 | $61,779 |
| Income Deficit | 164 | $0 |
| Wage / Income Gap (%) | 707 | 14.57% |
| Wage / Income Gap ($) | 707 | 85.43¢ per $1 |
| Gini / Inequality Index | 707 | 0.36 |
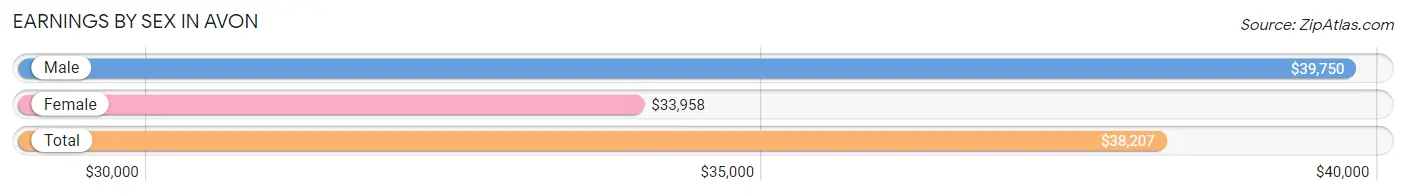
Earnings by Sex in Avon
Average Earnings in Avon are $38,207, $39,750 for men and $33,958 for women, a difference of 14.6%.
| Sex | Number | Average Earnings |
| Male | 158 (52.8%) | $39,750 |
| Female | 141 (47.2%) | $33,958 |
| Total | 299 (100.0%) | $38,207 |
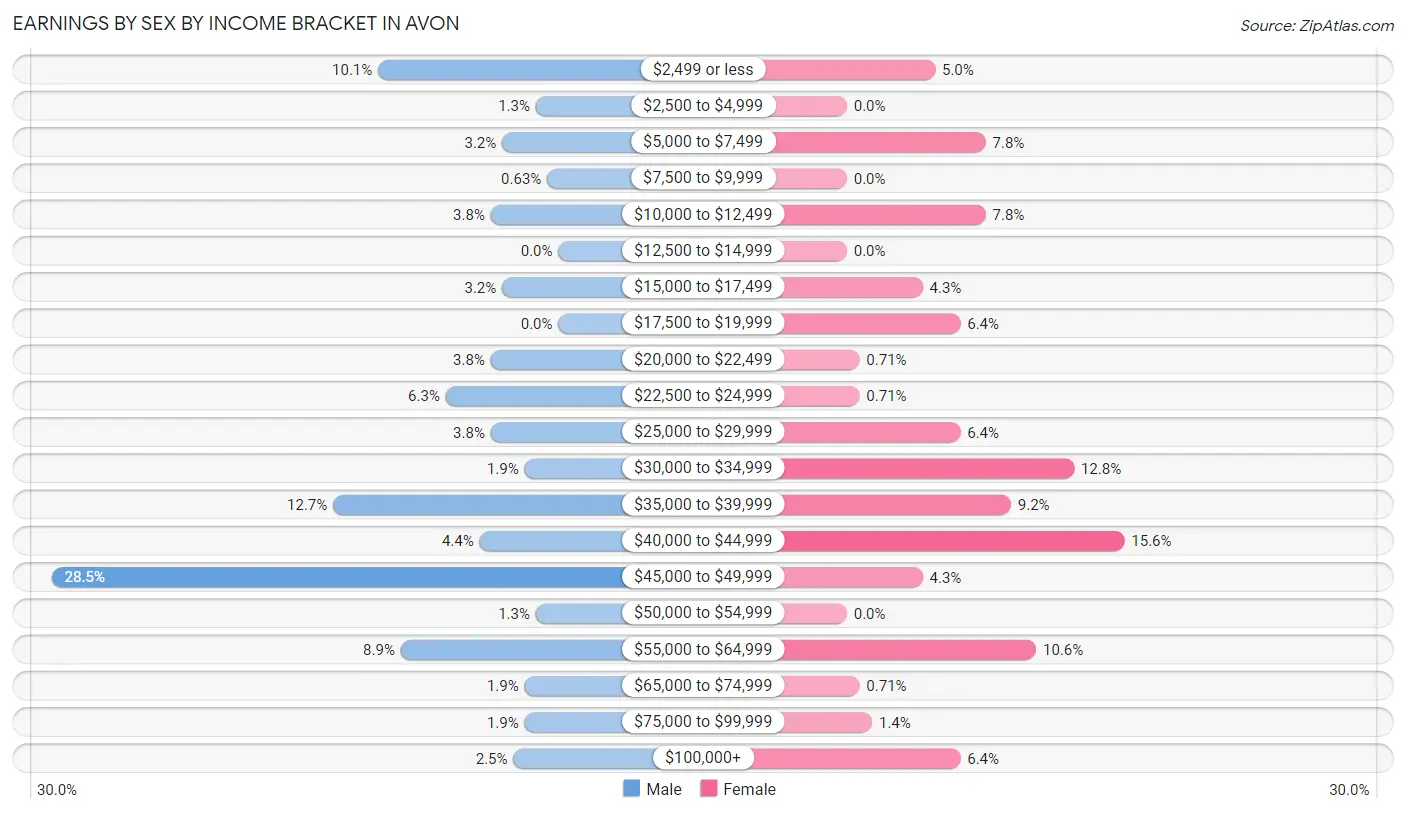
Earnings by Sex by Income Bracket in Avon
The most common earnings brackets in Avon are $45,000 to $49,999 for men (45 | 28.5%) and $40,000 to $44,999 for women (22 | 15.6%).
| Income | Male | Female |
| $2,499 or less | 16 (10.1%) | 7 (5.0%) |
| $2,500 to $4,999 | 2 (1.3%) | 0 (0.0%) |
| $5,000 to $7,499 | 5 (3.2%) | 11 (7.8%) |
| $7,500 to $9,999 | 1 (0.6%) | 0 (0.0%) |
| $10,000 to $12,499 | 6 (3.8%) | 11 (7.8%) |
| $12,500 to $14,999 | 0 (0.0%) | 0 (0.0%) |
| $15,000 to $17,499 | 5 (3.2%) | 6 (4.3%) |
| $17,500 to $19,999 | 0 (0.0%) | 9 (6.4%) |
| $20,000 to $22,499 | 6 (3.8%) | 1 (0.7%) |
| $22,500 to $24,999 | 10 (6.3%) | 1 (0.7%) |
| $25,000 to $29,999 | 6 (3.8%) | 9 (6.4%) |
| $30,000 to $34,999 | 3 (1.9%) | 18 (12.8%) |
| $35,000 to $39,999 | 20 (12.7%) | 13 (9.2%) |
| $40,000 to $44,999 | 7 (4.4%) | 22 (15.6%) |
| $45,000 to $49,999 | 45 (28.5%) | 6 (4.3%) |
| $50,000 to $54,999 | 2 (1.3%) | 0 (0.0%) |
| $55,000 to $64,999 | 14 (8.9%) | 15 (10.6%) |
| $65,000 to $74,999 | 3 (1.9%) | 1 (0.7%) |
| $75,000 to $99,999 | 3 (1.9%) | 2 (1.4%) |
| $100,000+ | 4 (2.5%) | 9 (6.4%) |
| Total | 158 (100.0%) | 141 (100.0%) |
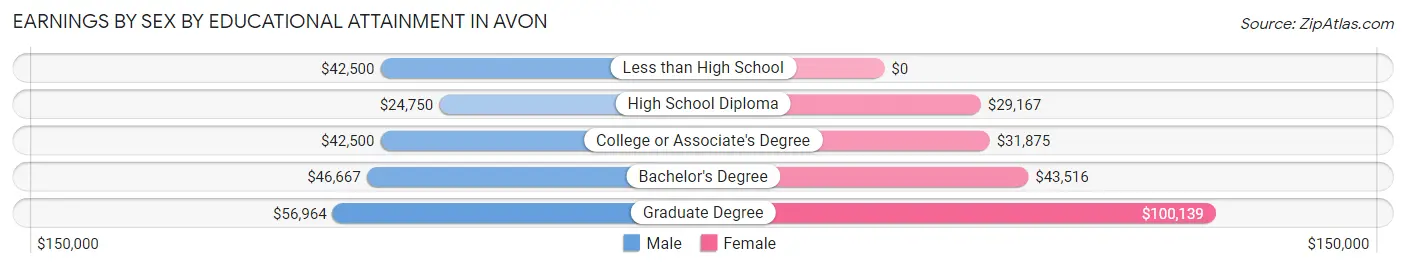
Earnings by Sex by Educational Attainment in Avon
Average earnings in Avon are $41,875 for men and $38,654 for women, a difference of 7.7%. Men with an educational attainment of graduate degree enjoy the highest average annual earnings of $56,964, while those with high school diploma education earn the least with $24,750. Women with an educational attainment of graduate degree earn the most with the average annual earnings of $100,139, while those with high school diploma education have the smallest earnings of $29,167.
| Educational Attainment | Male Income | Female Income |
| Less than High School | $42,500 | $0 |
| High School Diploma | $24,750 | $29,167 |
| College or Associate's Degree | $42,500 | $31,875 |
| Bachelor's Degree | $46,667 | $43,516 |
| Graduate Degree | $56,964 | $100,139 |
| Total | $41,875 | $38,654 |
Family Income in Avon
Family Income Brackets in Avon
According to the Avon family income data, there are 43 families falling into the $75,000 to $99,999 income range, which is the most common income bracket and makes up 26.2% of all families.
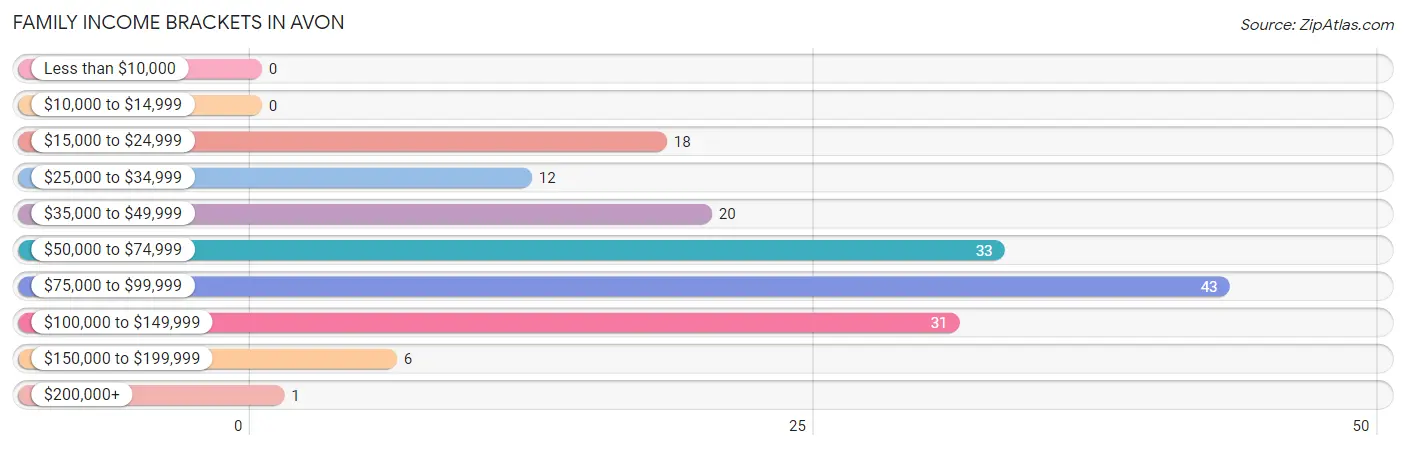
| Income Bracket | # Families | % Families |
| Less than $10,000 | 0 | 0.0% |
| $10,000 to $14,999 | 0 | 0.0% |
| $15,000 to $24,999 | 18 | 11.0% |
| $25,000 to $34,999 | 12 | 7.3% |
| $35,000 to $49,999 | 20 | 12.2% |
| $50,000 to $74,999 | 33 | 20.1% |
| $75,000 to $99,999 | 43 | 26.2% |
| $100,000 to $149,999 | 31 | 18.9% |
| $150,000 to $199,999 | 6 | 3.7% |
| $200,000+ | 1 | 0.6% |
Family Income by Famaliy Size in Avon
4-person families (15 | 9.1%) account for the highest median family income in Avon with $95,417 per family, while 2-person families (102 | 62.2%) have the highest median income of $40,416 per family member.
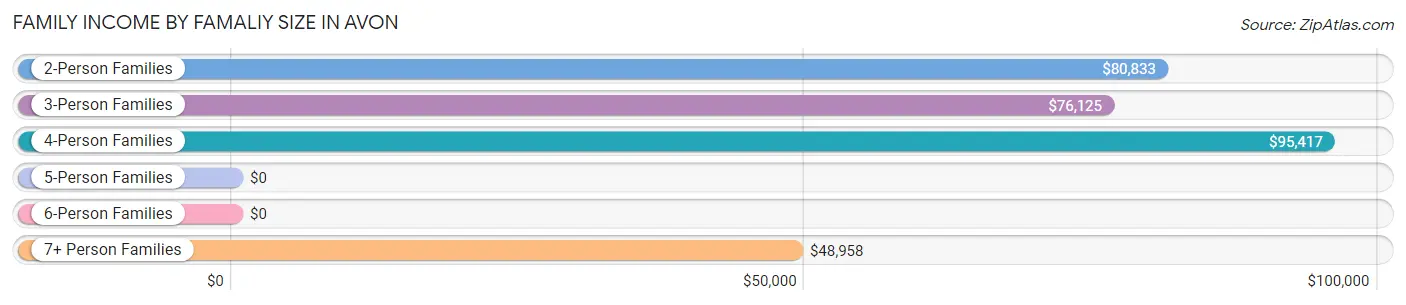
| Income Bracket | # Families | Median Income |
| 2-Person Families | 102 (62.2%) | $80,833 |
| 3-Person Families | 15 (9.1%) | $76,125 |
| 4-Person Families | 15 (9.1%) | $95,417 |
| 5-Person Families | 9 (5.5%) | $0 |
| 6-Person Families | 1 (0.6%) | $0 |
| 7+ Person Families | 22 (13.4%) | $48,958 |
| Total | 164 (100.0%) | $74,583 |
Family Income by Number of Earners in Avon
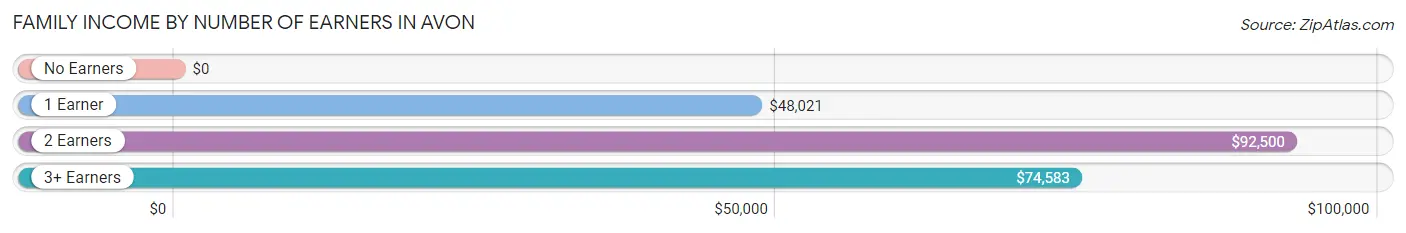
| Number of Earners | # Families | Median Income |
| No Earners | 29 (17.7%) | $0 |
| 1 Earner | 37 (22.6%) | $48,021 |
| 2 Earners | 88 (53.7%) | $92,500 |
| 3+ Earners | 10 (6.1%) | $74,583 |
| Total | 164 (100.0%) | $74,583 |
Household Income in Avon
Household Income Brackets in Avon
With 43 households falling in the category, the $75,000 to $99,999 income range is the most frequent in Avon, accounting for 18.0% of all households. In contrast, only 1 households (0.4%) fall into the $200,000+ income bracket, making it the least populous group.
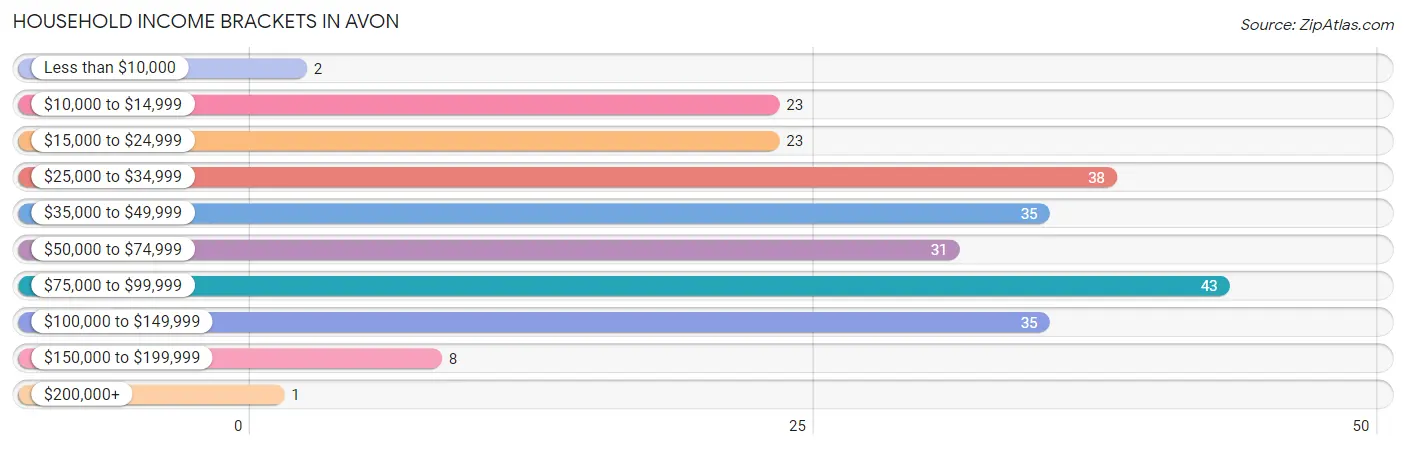
| Income Bracket | # Households | % Households |
| Less than $10,000 | 2 | 0.8% |
| $10,000 to $14,999 | 23 | 9.6% |
| $15,000 to $24,999 | 23 | 9.6% |
| $25,000 to $34,999 | 38 | 15.9% |
| $35,000 to $49,999 | 35 | 14.6% |
| $50,000 to $74,999 | 31 | 13.0% |
| $75,000 to $99,999 | 43 | 18.0% |
| $100,000 to $149,999 | 35 | 14.6% |
| $150,000 to $199,999 | 8 | 3.3% |
| $200,000+ | 1 | 0.4% |
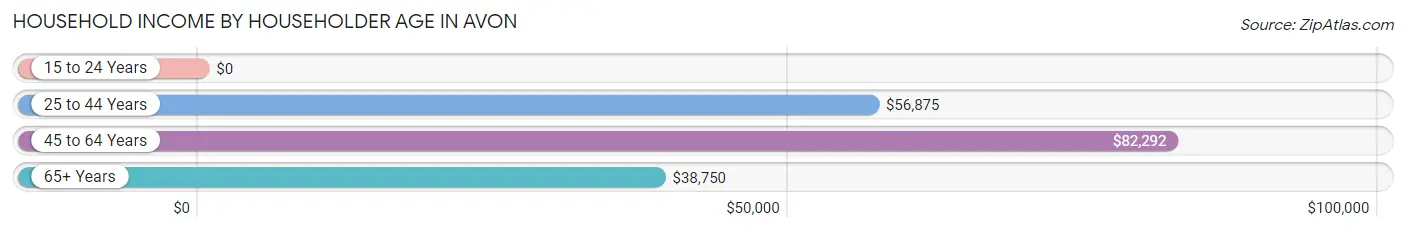
Household Income by Householder Age in Avon
The median household income in Avon is $49,750, with the highest median household income of $82,292 found in the 45 to 64 years age bracket for the primary householder. A total of 73 households (30.5%) fall into this category. Meanwhile, the 15 to 24 years age bracket for the primary householder has the lowest median household income of $0, with 7 households (2.9%) in this group.
| Income Bracket | # Households | Median Income |
| 15 to 24 Years | 7 (2.9%) | $0 |
| 25 to 44 Years | 69 (28.9%) | $56,875 |
| 45 to 64 Years | 73 (30.5%) | $82,292 |
| 65+ Years | 90 (37.7%) | $38,750 |
| Total | 239 (100.0%) | $49,750 |
Poverty in Avon
Income Below Poverty by Sex and Age in Avon
With 38.9% poverty level for males and 32.3% for females among the residents of Avon, 35 to 44 year old males and 12 to 14 year old females are the most vulnerable to poverty, with 35 males (87.5%) and 55 females (94.8%) in their respective age groups living below the poverty level.
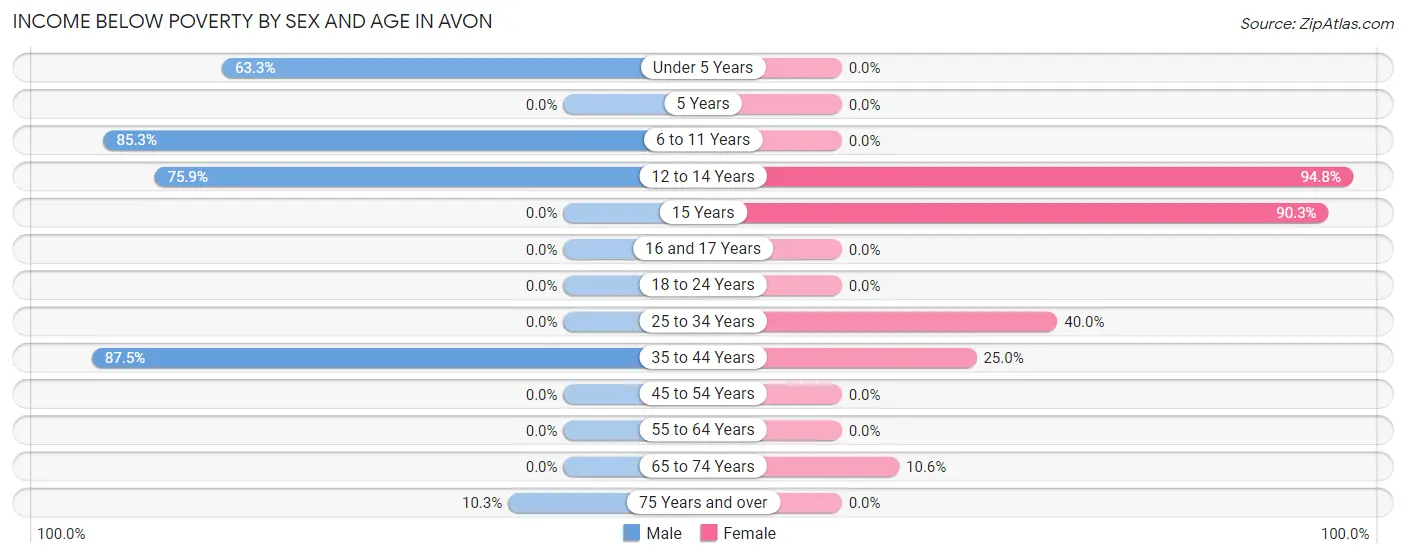
| Age Bracket | Male | Female |
| Under 5 Years | 19 (63.3%) | 0 (0.0%) |
| 5 Years | 0 (0.0%) | 0 (0.0%) |
| 6 to 11 Years | 64 (85.3%) | 0 (0.0%) |
| 12 to 14 Years | 22 (75.9%) | 55 (94.8%) |
| 15 Years | 0 (0.0%) | 28 (90.3%) |
| 16 and 17 Years | 0 (0.0%) | 0 (0.0%) |
| 18 to 24 Years | 0 (0.0%) | 0 (0.0%) |
| 25 to 34 Years | 0 (0.0%) | 12 (40.0%) |
| 35 to 44 Years | 35 (87.5%) | 9 (25.0%) |
| 45 to 54 Years | 0 (0.0%) | 0 (0.0%) |
| 55 to 64 Years | 0 (0.0%) | 0 (0.0%) |
| 65 to 74 Years | 0 (0.0%) | 5 (10.6%) |
| 75 Years and over | 4 (10.3%) | 0 (0.0%) |
| Total | 144 (38.9%) | 109 (32.3%) |
Income Above Poverty by Sex and Age in Avon
According to the poverty statistics in Avon, males aged 5 years and females aged under 5 years are the age groups that are most secure financially, with 100.0% of males and 100.0% of females in these age groups living above the poverty line.
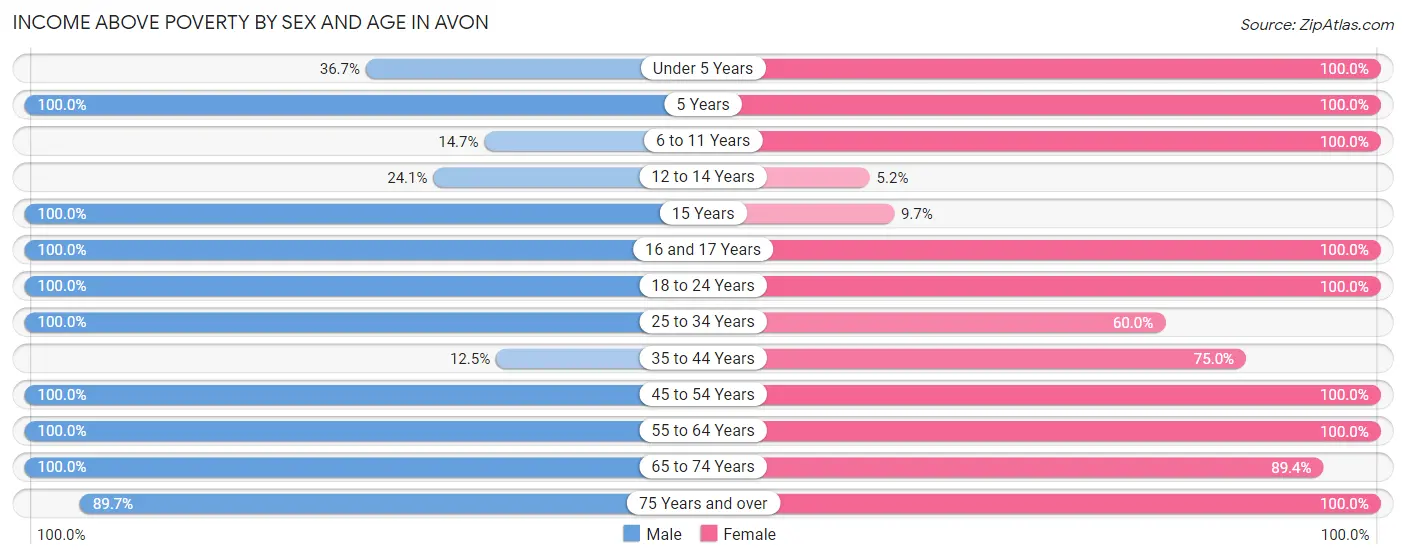
| Age Bracket | Male | Female |
| Under 5 Years | 11 (36.7%) | 9 (100.0%) |
| 5 Years | 10 (100.0%) | 11 (100.0%) |
| 6 to 11 Years | 11 (14.7%) | 14 (100.0%) |
| 12 to 14 Years | 7 (24.1%) | 3 (5.2%) |
| 15 Years | 4 (100.0%) | 3 (9.7%) |
| 16 and 17 Years | 8 (100.0%) | 8 (100.0%) |
| 18 to 24 Years | 4 (100.0%) | 9 (100.0%) |
| 25 to 34 Years | 37 (100.0%) | 18 (60.0%) |
| 35 to 44 Years | 5 (12.5%) | 27 (75.0%) |
| 45 to 54 Years | 20 (100.0%) | 20 (100.0%) |
| 55 to 64 Years | 47 (100.0%) | 48 (100.0%) |
| 65 to 74 Years | 27 (100.0%) | 42 (89.4%) |
| 75 Years and over | 35 (89.7%) | 16 (100.0%) |
| Total | 226 (61.1%) | 228 (67.7%) |
Income Below Poverty Among Married-Couple Families in Avon
The poverty statistics for married-couple families in Avon show that 8.1% or 12 of the total 148 families live below the poverty line. Families with 5 or more children have the highest poverty rate of 54.5%, comprising of 12 families. On the other hand, families with no children have the lowest poverty rate of 0.0%, which includes 0 families.
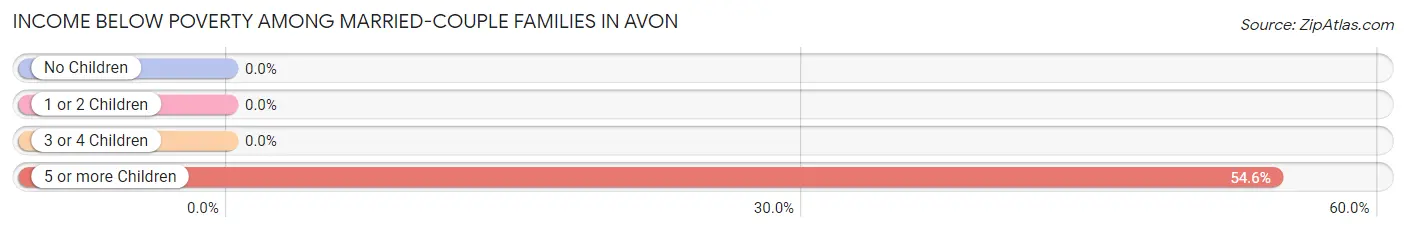
| Children | Above Poverty | Below Poverty |
| No Children | 105 (100.0%) | 0 (0.0%) |
| 1 or 2 Children | 20 (100.0%) | 0 (0.0%) |
| 3 or 4 Children | 1 (100.0%) | 0 (0.0%) |
| 5 or more Children | 10 (45.5%) | 12 (54.5%) |
| Total | 136 (91.9%) | 12 (8.1%) |
Income Below Poverty Among Single-Parent Households in Avon
According to the poverty data in Avon, 100.0% or 3 single-father households and 69.2% or 9 single-mother households are living below the poverty line. Among single-father households, those with no children have the highest poverty rate, with 3 households (100.0%) experiencing poverty. Likewise, among single-mother households, those with 3 or 4 children have the highest poverty rate, with 9 households (81.8%) falling below the poverty line.
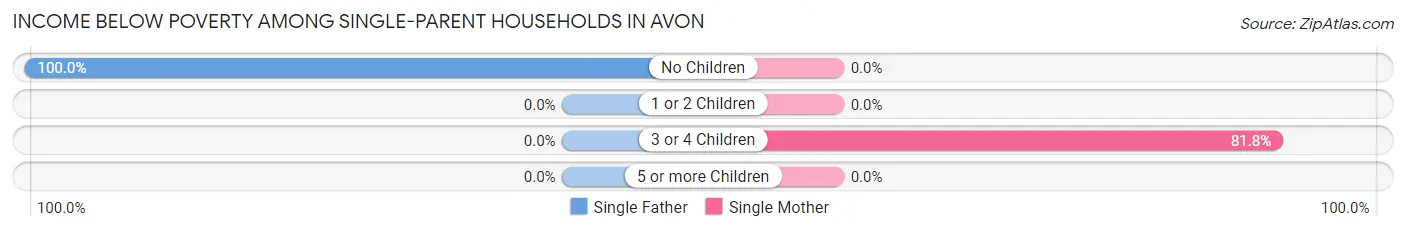
| Children | Single Father | Single Mother |
| No Children | 3 (100.0%) | 0 (0.0%) |
| 1 or 2 Children | 0 (0.0%) | 0 (0.0%) |
| 3 or 4 Children | 0 (0.0%) | 9 (81.8%) |
| 5 or more Children | 0 (0.0%) | 0 (0.0%) |
| Total | 3 (100.0%) | 9 (69.2%) |
Income Below Poverty Among Married-Couple vs Single-Parent Households in Avon
The poverty data for Avon shows that 12 of the married-couple family households (8.1%) and 12 of the single-parent households (75.0%) are living below the poverty level. Within the married-couple family households, those with 5 or more children have the highest poverty rate, with 12 households (54.5%) falling below the poverty line. Among the single-parent households, those with no children have the highest poverty rate, with 3 household (100.0%) living below poverty.
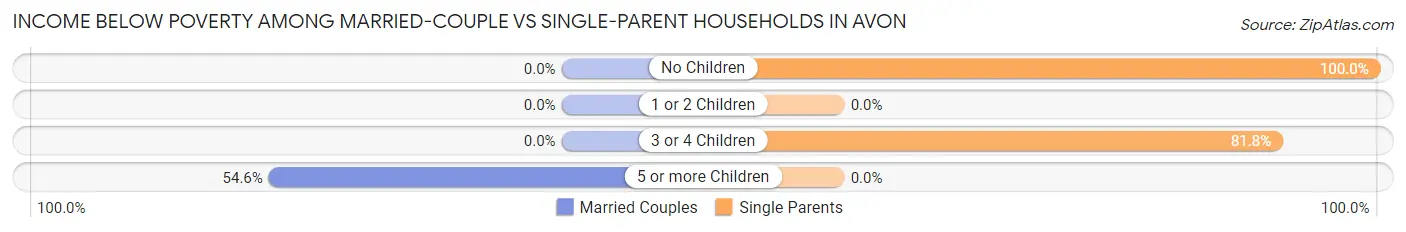
| Children | Married-Couple Families | Single-Parent Households |
| No Children | 0 (0.0%) | 3 (100.0%) |
| 1 or 2 Children | 0 (0.0%) | 0 (0.0%) |
| 3 or 4 Children | 0 (0.0%) | 9 (81.8%) |
| 5 or more Children | 12 (54.5%) | 0 (0.0%) |
| Total | 12 (8.1%) | 12 (75.0%) |
Race in Avon
The most populous races in Avon are White / Caucasian (688 | 97.3%), Native / Alaskan (13 | 1.8%), and Two or more Races (4 | 0.6%).
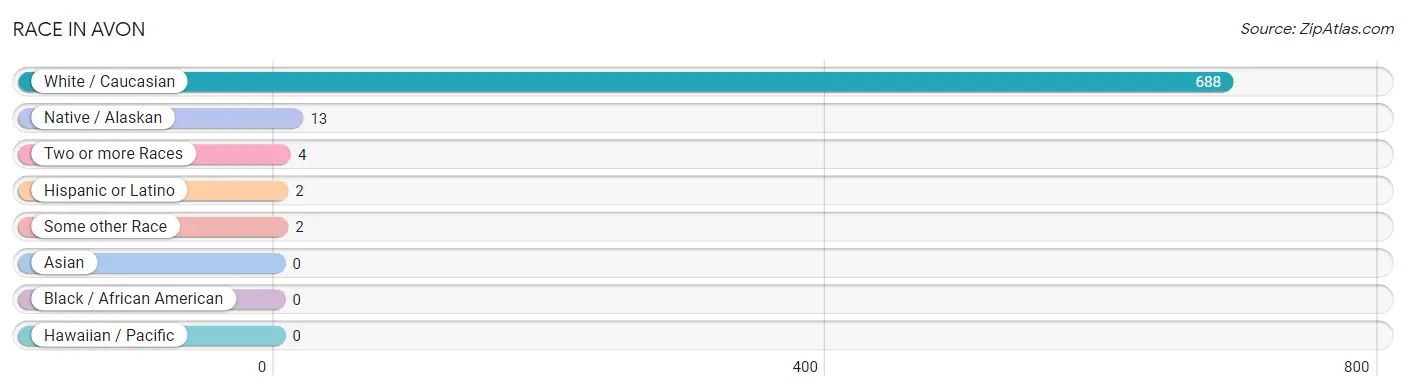
| Race | # Population | % Population |
| Asian | 0 | 0.0% |
| Black / African American | 0 | 0.0% |
| Hawaiian / Pacific | 0 | 0.0% |
| Hispanic or Latino | 2 | 0.3% |
| Native / Alaskan | 13 | 1.8% |
| White / Caucasian | 688 | 97.3% |
| Two or more Races | 4 | 0.6% |
| Some other Race | 2 | 0.3% |
| Total | 707 | 100.0% |
Ancestry in Avon
The most populous ancestries reported in Avon are Dutch (287 | 40.6%), German (239 | 33.8%), Czech (61 | 8.6%), American (53 | 7.5%), and Irish (40 | 5.7%), together accounting for 96.2% of all Avon residents.
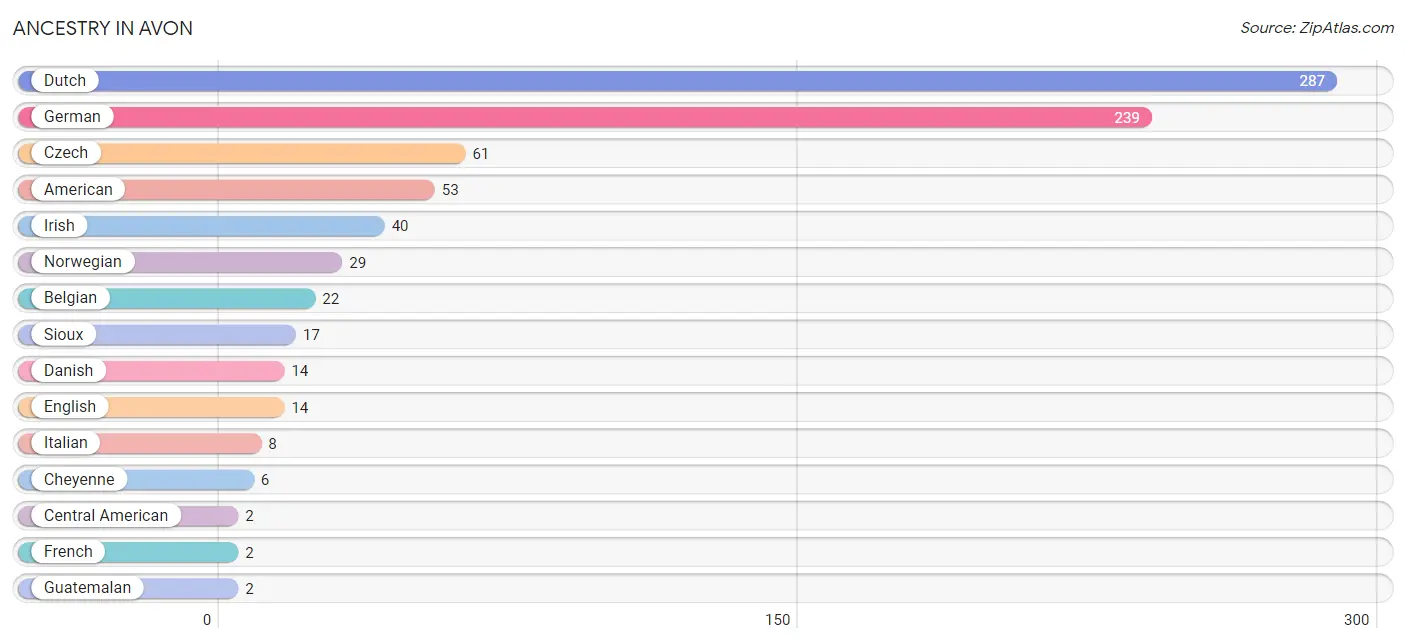
| Ancestry | # Population | % Population |
| American | 53 | 7.5% |
| Belgian | 22 | 3.1% |
| Central American | 2 | 0.3% |
| Cheyenne | 6 | 0.9% |
| Czech | 61 | 8.6% |
| Danish | 14 | 2.0% |
| Dutch | 287 | 40.6% |
| English | 14 | 2.0% |
| French | 2 | 0.3% |
| German | 239 | 33.8% |
| Guatemalan | 2 | 0.3% |
| Irish | 40 | 5.7% |
| Italian | 8 | 1.1% |
| Norwegian | 29 | 4.1% |
| Sioux | 17 | 2.4% | View All 15 Rows |
Immigrants in Avon
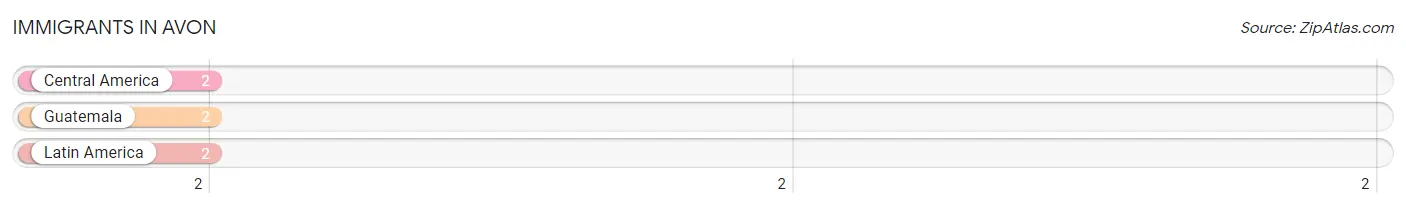
The most numerous immigrant groups reported in Avon came from Central America (2 | 0.3%), Guatemala (2 | 0.3%), and Latin America (2 | 0.3%), together accounting for 0.8% of all Avon residents.
| Immigration Origin | # Population | % Population |
| Central America | 2 | 0.3% |
| Guatemala | 2 | 0.3% |
| Latin America | 2 | 0.3% | View All 3 Rows |
Sex and Age in Avon
Sex and Age in Avon
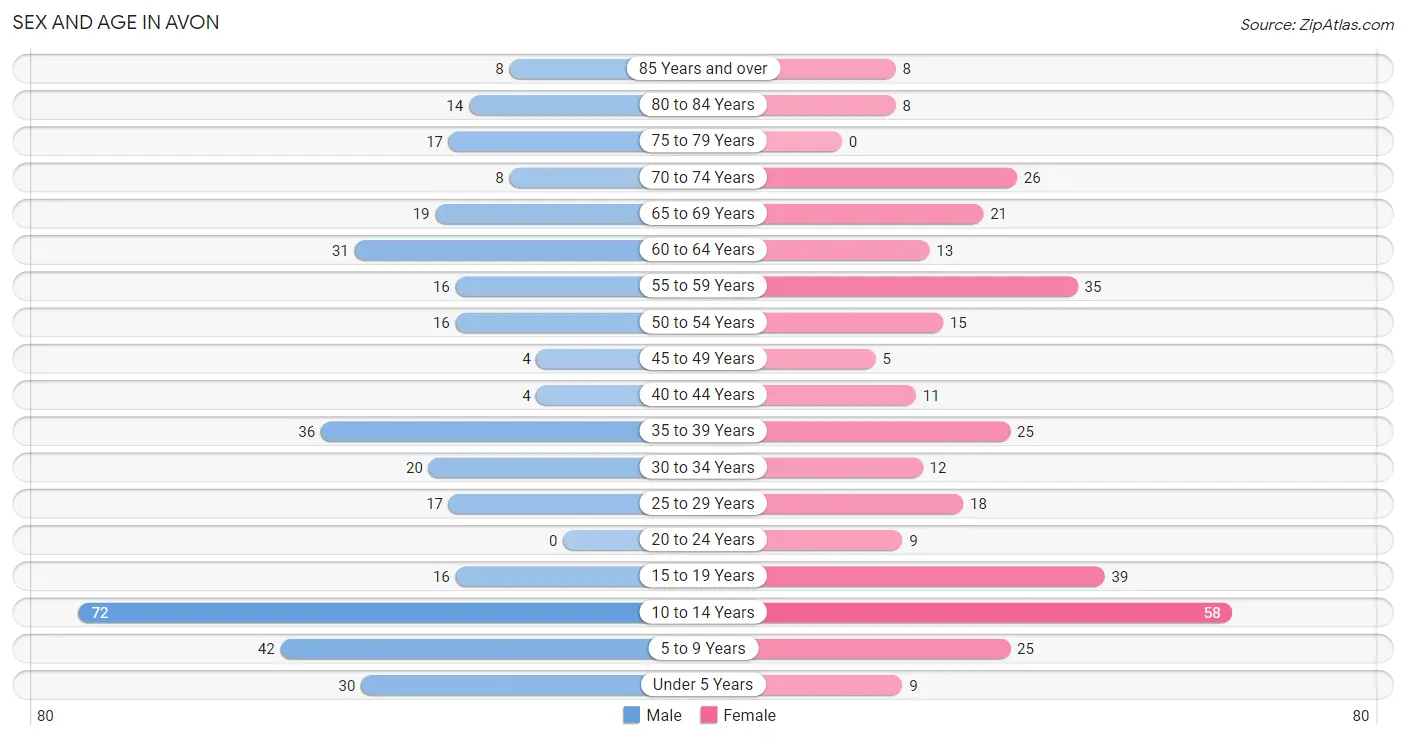
The most populous age groups in Avon are 10 to 14 Years (72 | 19.5%) for men and 10 to 14 Years (58 | 17.2%) for women.
| Age Bracket | Male | Female |
| Under 5 Years | 30 (8.1%) | 9 (2.7%) |
| 5 to 9 Years | 42 (11.4%) | 25 (7.4%) |
| 10 to 14 Years | 72 (19.5%) | 58 (17.2%) |
| 15 to 19 Years | 16 (4.3%) | 39 (11.6%) |
| 20 to 24 Years | 0 (0.0%) | 9 (2.7%) |
| 25 to 29 Years | 17 (4.6%) | 18 (5.3%) |
| 30 to 34 Years | 20 (5.4%) | 12 (3.6%) |
| 35 to 39 Years | 36 (9.7%) | 25 (7.4%) |
| 40 to 44 Years | 4 (1.1%) | 11 (3.3%) |
| 45 to 49 Years | 4 (1.1%) | 5 (1.5%) |
| 50 to 54 Years | 16 (4.3%) | 15 (4.4%) |
| 55 to 59 Years | 16 (4.3%) | 35 (10.4%) |
| 60 to 64 Years | 31 (8.4%) | 13 (3.9%) |
| 65 to 69 Years | 19 (5.1%) | 21 (6.2%) |
| 70 to 74 Years | 8 (2.2%) | 26 (7.7%) |
| 75 to 79 Years | 17 (4.6%) | 0 (0.0%) |
| 80 to 84 Years | 14 (3.8%) | 8 (2.4%) |
| 85 Years and over | 8 (2.2%) | 8 (2.4%) |
| Total | 370 (100.0%) | 337 (100.0%) |
Families and Households in Avon
Median Family Size in Avon
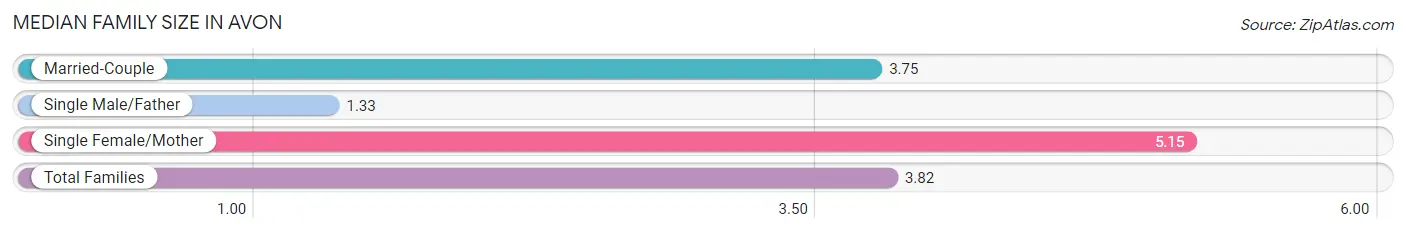
The median family size in Avon is 3.82 persons per family, with single female/mother families (13 | 7.9%) accounting for the largest median family size of 5.15 persons per family. On the other hand, single male/father families (3 | 1.8%) represent the smallest median family size with 1.33 persons per family.
| Family Type | # Families | Family Size |
| Married-Couple | 148 (90.2%) | 3.75 |
| Single Male/Father | 3 (1.8%) | 1.33 |
| Single Female/Mother | 13 (7.9%) | 5.15 |
| Total Families | 164 (100.0%) | 3.82 |
Median Household Size in Avon
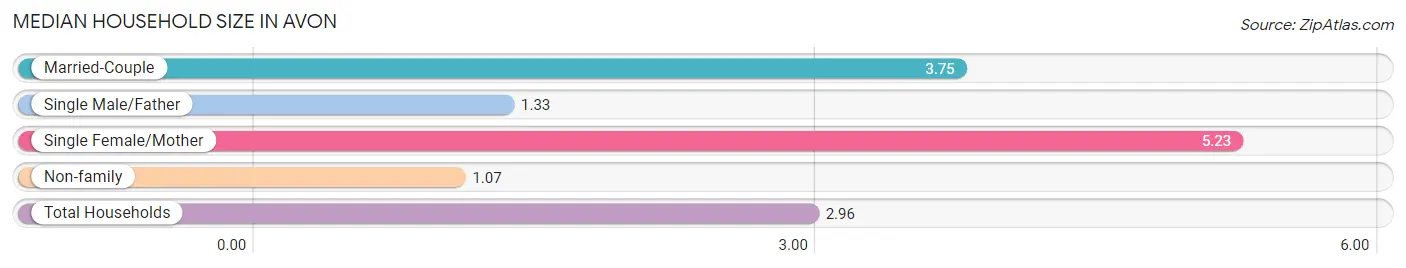
The median household size in Avon is 2.96 persons per household, with single female/mother households (13 | 5.4%) accounting for the largest median household size of 5.23 persons per household. non-family households (75 | 31.4%) represent the smallest median household size with 1.07 persons per household.
| Household Type | # Households | Household Size |
| Married-Couple | 148 (61.9%) | 3.75 |
| Single Male/Father | 3 (1.3%) | 1.33 |
| Single Female/Mother | 13 (5.4%) | 5.23 |
| Non-family | 75 (31.4%) | 1.07 |
| Total Households | 239 (100.0%) | 2.96 |
Household Size by Marriage Status in Avon
Out of a total of 239 households in Avon, 164 (68.6%) are family households, while 75 (31.4%) are nonfamily households. The most numerous type of family households are 2-person households, comprising 102, and the most common type of nonfamily households are 1-person households, comprising 66.
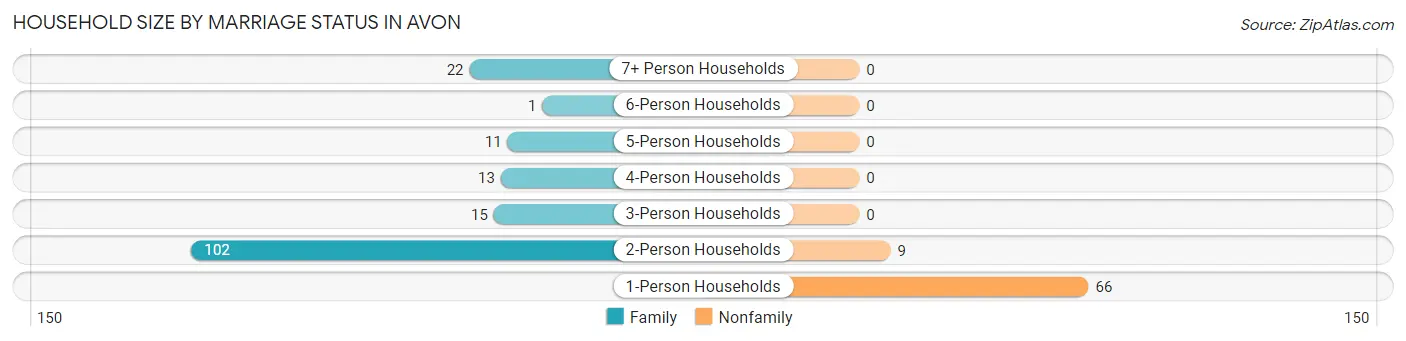
| Household Size | Family Households | Nonfamily Households |
| 1-Person Households | - | 66 (27.6%) |
| 2-Person Households | 102 (42.7%) | 9 (3.8%) |
| 3-Person Households | 15 (6.3%) | 0 (0.0%) |
| 4-Person Households | 13 (5.4%) | 0 (0.0%) |
| 5-Person Households | 11 (4.6%) | 0 (0.0%) |
| 6-Person Households | 1 (0.4%) | 0 (0.0%) |
| 7+ Person Households | 22 (9.2%) | 0 (0.0%) |
| Total | 164 (68.6%) | 75 (31.4%) |
Female Fertility in Avon
Fertility by Age in Avon
| Age Bracket | Women with Births | Births / 1,000 Women |
| 15 to 19 years | 0 (0.0%) | 0.0 |
| 20 to 34 years | 0 (0.0%) | 0.0 |
| 35 to 50 years | 0 (0.0%) | 0.0 |
| Total | 0 (0.0%) | 0.0 |
Fertility by Age by Marriage Status in Avon
| Age Bracket | Married | Unmarried |
| 15 to 19 years | 0 (0.0%) | 0 (0.0%) |
| 20 to 34 years | 0 (0.0%) | 0 (0.0%) |
| 35 to 50 years | 0 (0.0%) | 0 (0.0%) |
| Total | 0 (0.0%) | 0 (0.0%) |
Fertility by Education in Avon
| Educational Attainment | Women with Births | Births / 1,000 Women |
| Less than High School | 0 (0.0%) | 0.0 |
| High School Diploma | 0 (0.0%) | 0.0 |
| College or Associate's Degree | 0 (0.0%) | 0.0 |
| Bachelor's Degree | 0 (0.0%) | 0.0 |
| Graduate Degree | 0 (0.0%) | 0.0 |
| Total | 0 (0.0%) | 0.0 |
Fertility by Education by Marriage Status in Avon
| Educational Attainment | Married | Unmarried |
| Less than High School | 0 (0.0%) | 0 (0.0%) |
| High School Diploma | 0 (0.0%) | 0 (0.0%) |
| College or Associate's Degree | 0 (0.0%) | 0 (0.0%) |
| Bachelor's Degree | 0 (0.0%) | 0 (0.0%) |
| Graduate Degree | 0 (0.0%) | 0 (0.0%) |
| Total | 0 (0.0%) | 0 (0.0%) |
Employment Characteristics in Avon
Employment by Class of Employer in Avon
Among the 271 employed individuals in Avon, private company employees (116 | 42.8%), local government employees (43 | 15.9%), and self-employed (not incorporated) (38 | 14.0%) make up the most common classes of employment.
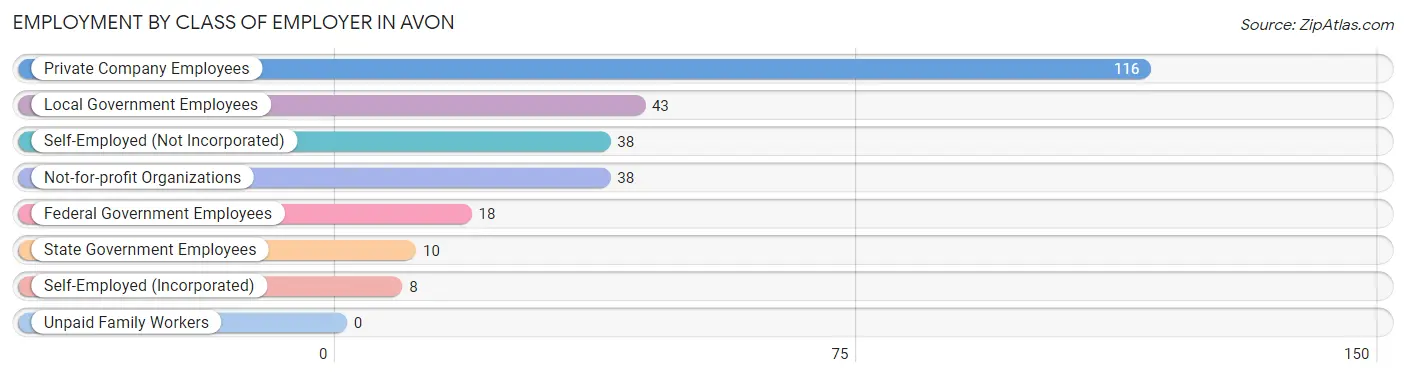
| Employer Class | # Employees | % Employees |
| Private Company Employees | 116 | 42.8% |
| Self-Employed (Incorporated) | 8 | 2.9% |
| Self-Employed (Not Incorporated) | 38 | 14.0% |
| Not-for-profit Organizations | 38 | 14.0% |
| Local Government Employees | 43 | 15.9% |
| State Government Employees | 10 | 3.7% |
| Federal Government Employees | 18 | 6.6% |
| Unpaid Family Workers | 0 | 0.0% |
| Total | 271 | 100.0% |
Employment Status by Age in Avon
According to the labor force statistics for Avon, out of the total population over 16 years of age (436), 64.0% or 279 individuals are in the labor force, with 2.2% or 6 of them unemployed. The age group with the highest labor force participation rate is 20 to 24 years, with 100.0% or 9 individuals in the labor force. Within the labor force, the 55 to 59 years age range has the highest percentage of unemployed individuals, with 13.2% or 5 of them being unemployed.
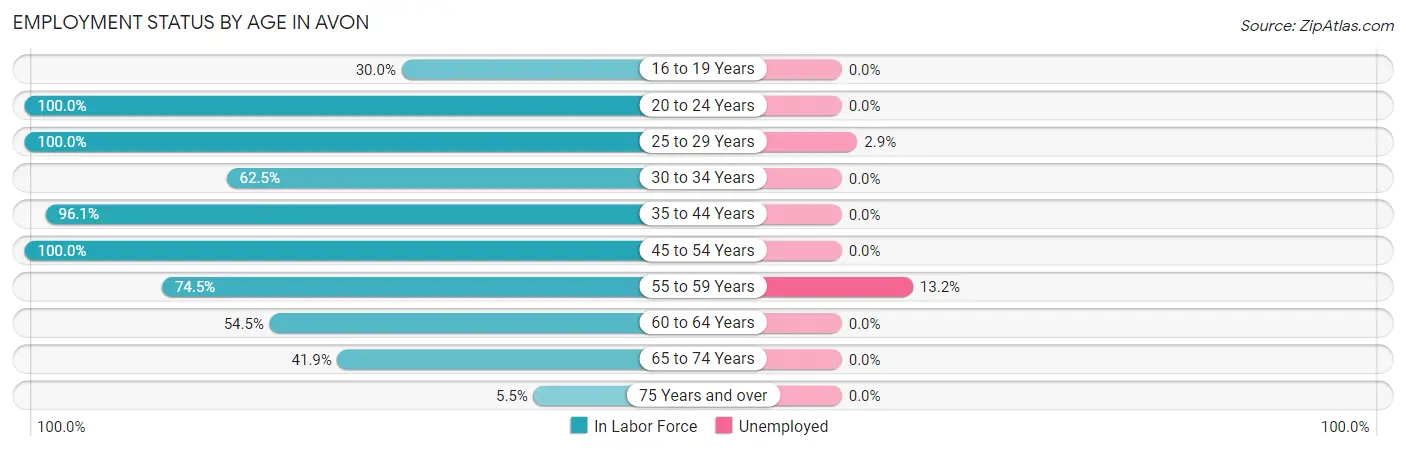
| Age Bracket | In Labor Force | Unemployed |
| 16 to 19 Years | 6 (30.0%) | 0 (0.0%) |
| 20 to 24 Years | 9 (100.0%) | 0 (0.0%) |
| 25 to 29 Years | 35 (100.0%) | 1 (2.9%) |
| 30 to 34 Years | 20 (62.5%) | 0 (0.0%) |
| 35 to 44 Years | 73 (96.1%) | 0 (0.0%) |
| 45 to 54 Years | 40 (100.0%) | 0 (0.0%) |
| 55 to 59 Years | 38 (74.5%) | 5 (13.2%) |
| 60 to 64 Years | 24 (54.5%) | 0 (0.0%) |
| 65 to 74 Years | 31 (41.9%) | 0 (0.0%) |
| 75 Years and over | 3 (5.5%) | 0 (0.0%) |
| Total | 279 (64.0%) | 6 (2.2%) |
Employment Status by Educational Attainment in Avon
According to labor force statistics for Avon, 82.7% of individuals (230) out of the total population between 25 and 64 years of age (278) are in the labor force, with 2.6% or 6 of them being unemployed. The group with the highest labor force participation rate are those with the educational attainment of bachelor's degree or higher, with 100.0% or 59 individuals in the labor force. Within the labor force, individuals with college / associate degree education have the highest percentage of unemployment, with 4.2% or 5 of them being unemployed.
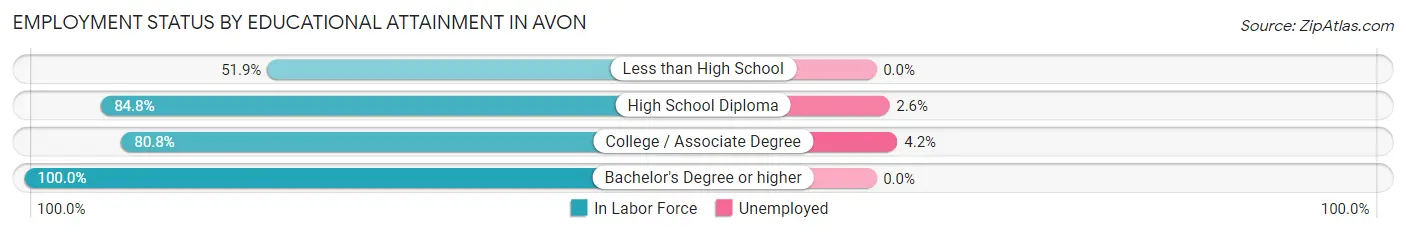
| Educational Attainment | In Labor Force | Unemployed |
| Less than High School | 14 (51.9%) | 0 (0.0%) |
| High School Diploma | 39 (84.8%) | 1 (2.6%) |
| College / Associate Degree | 118 (80.8%) | 6 (4.2%) |
| Bachelor's Degree or higher | 59 (100.0%) | 0 (0.0%) |
| Total | 230 (82.7%) | 7 (2.6%) |
Employment Occupations by Sex in Avon
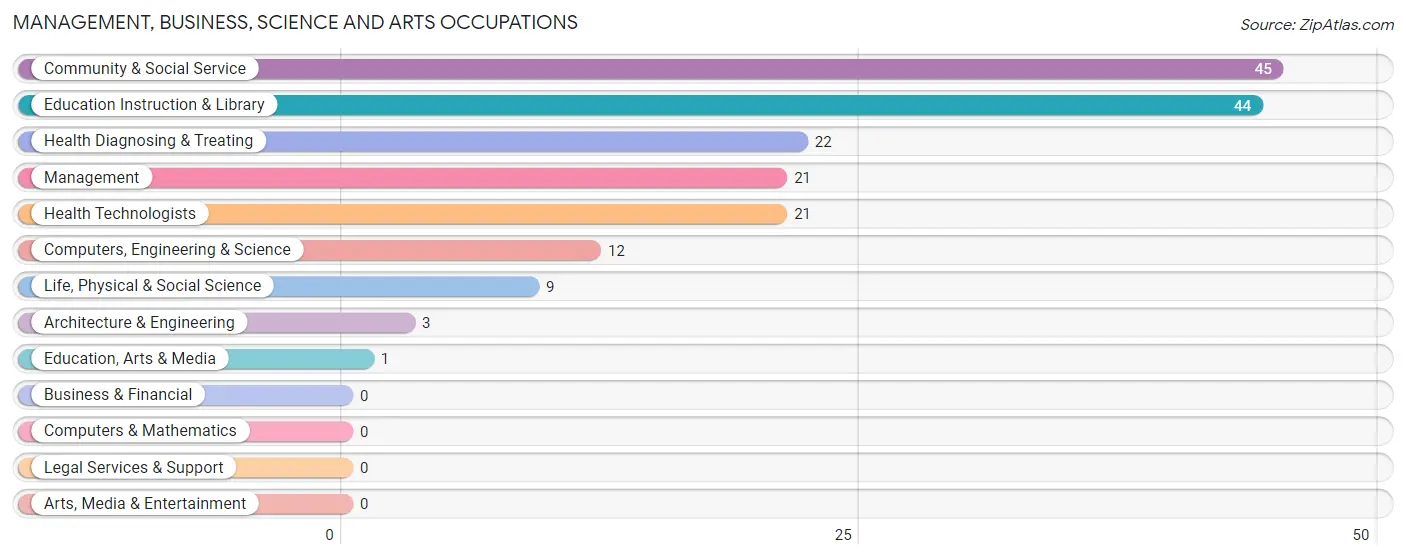
Management, Business, Science and Arts Occupations
The most common Management, Business, Science and Arts occupations in Avon are Community & Social Service (45 | 16.5%), Education Instruction & Library (44 | 16.1%), Health Diagnosing & Treating (22 | 8.1%), Management (21 | 7.7%), and Health Technologists (21 | 7.7%).
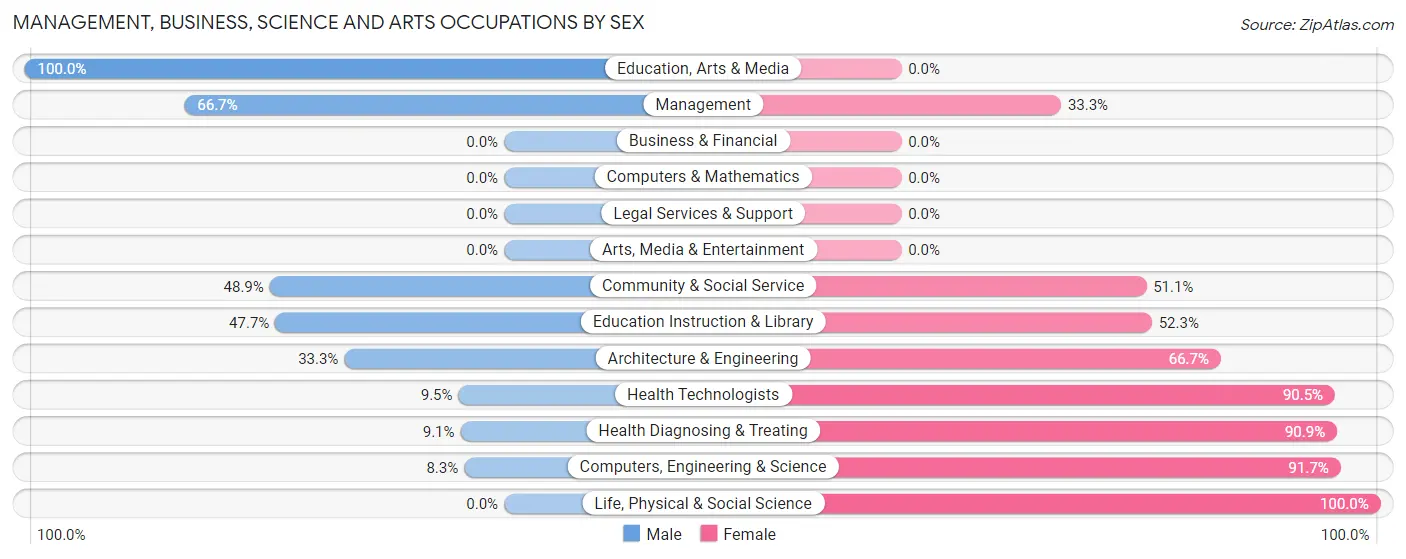
Management, Business, Science and Arts Occupations by Sex
Within the Management, Business, Science and Arts occupations in Avon, the most male-oriented occupations are Education, Arts & Media (100.0%), Management (66.7%), and Community & Social Service (48.9%), while the most female-oriented occupations are Life, Physical & Social Science (100.0%), Computers, Engineering & Science (91.7%), and Health Diagnosing & Treating (90.9%).
| Occupation | Male | Female |
| Management | 14 (66.7%) | 7 (33.3%) |
| Business & Financial | 0 (0.0%) | 0 (0.0%) |
| Computers, Engineering & Science | 1 (8.3%) | 11 (91.7%) |
| Computers & Mathematics | 0 (0.0%) | 0 (0.0%) |
| Architecture & Engineering | 1 (33.3%) | 2 (66.7%) |
| Life, Physical & Social Science | 0 (0.0%) | 9 (100.0%) |
| Community & Social Service | 22 (48.9%) | 23 (51.1%) |
| Education, Arts & Media | 1 (100.0%) | 0 (0.0%) |
| Legal Services & Support | 0 (0.0%) | 0 (0.0%) |
| Education Instruction & Library | 21 (47.7%) | 23 (52.3%) |
| Arts, Media & Entertainment | 0 (0.0%) | 0 (0.0%) |
| Health Diagnosing & Treating | 2 (9.1%) | 20 (90.9%) |
| Health Technologists | 2 (9.5%) | 19 (90.5%) |
| Total (Category) | 39 (39.0%) | 61 (61.0%) |
| Total (Overall) | 143 (52.4%) | 130 (47.6%) |
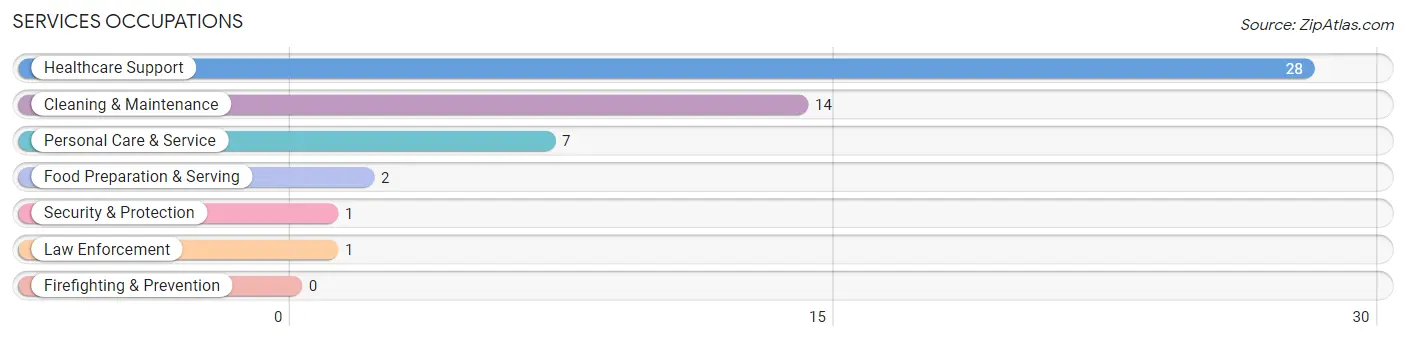
Services Occupations
The most common Services occupations in Avon are Healthcare Support (28 | 10.3%), Cleaning & Maintenance (14 | 5.1%), Personal Care & Service (7 | 2.6%), Food Preparation & Serving (2 | 0.7%), and Security & Protection (1 | 0.4%).
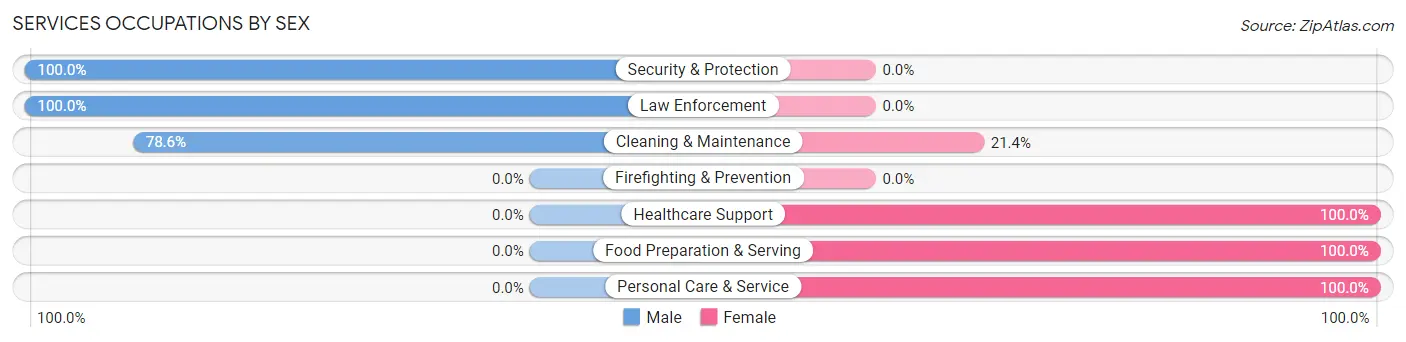
Services Occupations by Sex
Within the Services occupations in Avon, the most male-oriented occupations are Security & Protection (100.0%), Law Enforcement (100.0%), and Cleaning & Maintenance (78.6%), while the most female-oriented occupations are Healthcare Support (100.0%), Food Preparation & Serving (100.0%), and Personal Care & Service (100.0%).
| Occupation | Male | Female |
| Healthcare Support | 0 (0.0%) | 28 (100.0%) |
| Security & Protection | 1 (100.0%) | 0 (0.0%) |
| Firefighting & Prevention | 0 (0.0%) | 0 (0.0%) |
| Law Enforcement | 1 (100.0%) | 0 (0.0%) |
| Food Preparation & Serving | 0 (0.0%) | 2 (100.0%) |
| Cleaning & Maintenance | 11 (78.6%) | 3 (21.4%) |
| Personal Care & Service | 0 (0.0%) | 7 (100.0%) |
| Total (Category) | 12 (23.1%) | 40 (76.9%) |
| Total (Overall) | 143 (52.4%) | 130 (47.6%) |
Sales and Office Occupations
The most common Sales and Office occupations in Avon are Office & Administration (19 | 7.0%), and Sales & Related (6 | 2.2%).
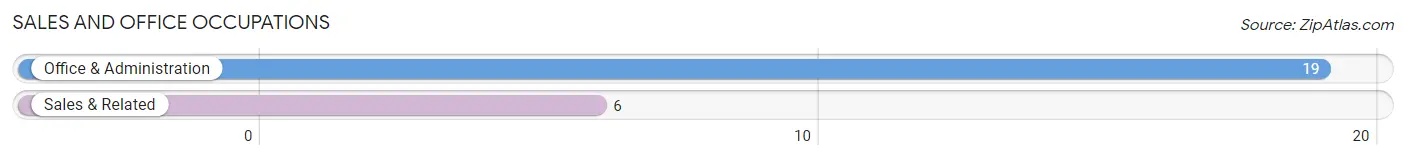
Sales and Office Occupations by Sex
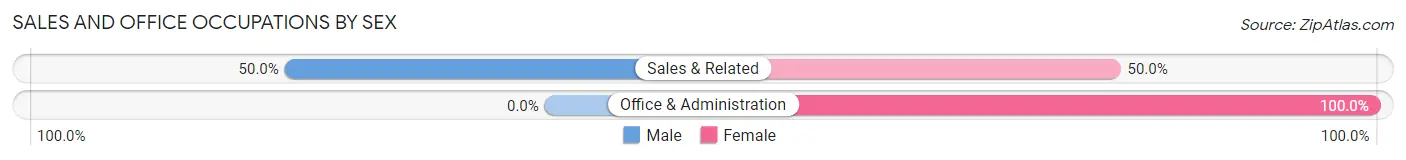
| Occupation | Male | Female |
| Sales & Related | 3 (50.0%) | 3 (50.0%) |
| Office & Administration | 0 (0.0%) | 19 (100.0%) |
| Total (Category) | 3 (12.0%) | 22 (88.0%) |
| Total (Overall) | 143 (52.4%) | 130 (47.6%) |
Natural Resources, Construction and Maintenance Occupations
The most common Natural Resources, Construction and Maintenance occupations in Avon are Construction & Extraction (47 | 17.2%), and Installation, Maintenance & Repair (23 | 8.4%).
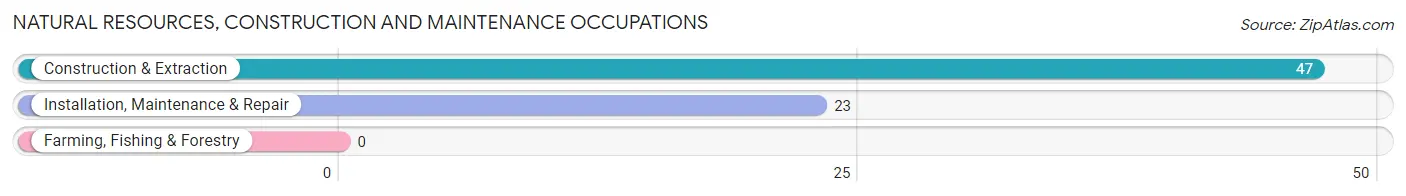
Natural Resources, Construction and Maintenance Occupations by Sex
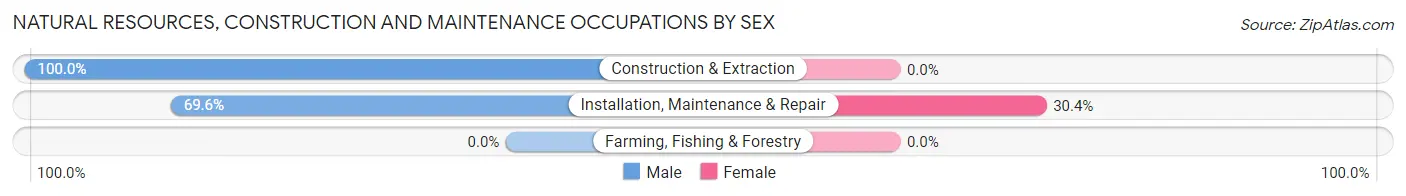
| Occupation | Male | Female |
| Farming, Fishing & Forestry | 0 (0.0%) | 0 (0.0%) |
| Construction & Extraction | 47 (100.0%) | 0 (0.0%) |
| Installation, Maintenance & Repair | 16 (69.6%) | 7 (30.4%) |
| Total (Category) | 63 (90.0%) | 7 (10.0%) |
| Total (Overall) | 143 (52.4%) | 130 (47.6%) |
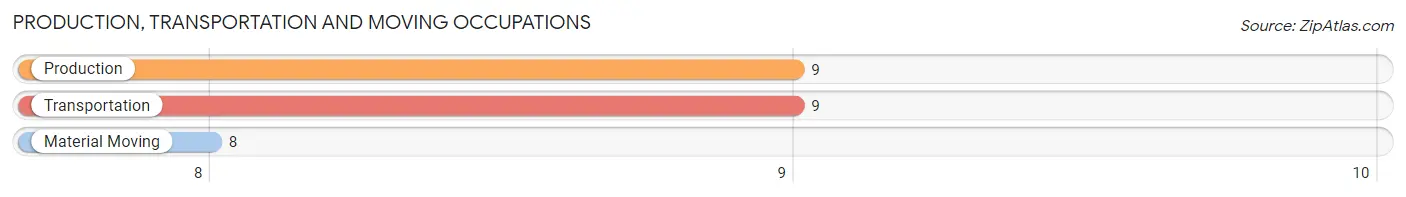
Production, Transportation and Moving Occupations
The most common Production, Transportation and Moving occupations in Avon are Production (9 | 3.3%), Transportation (9 | 3.3%), and Material Moving (8 | 2.9%).
Production, Transportation and Moving Occupations by Sex
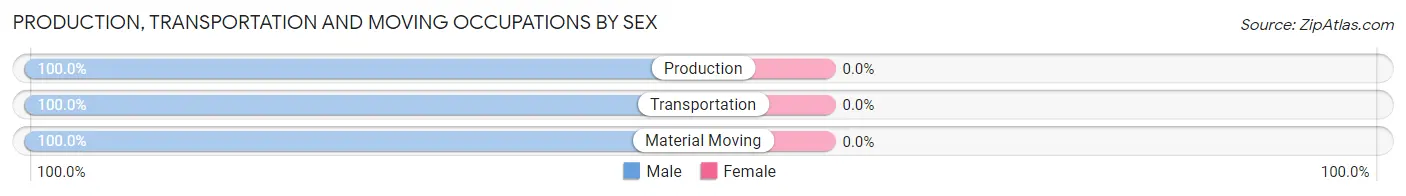
| Occupation | Male | Female |
| Production | 9 (100.0%) | 0 (0.0%) |
| Transportation | 9 (100.0%) | 0 (0.0%) |
| Material Moving | 8 (100.0%) | 0 (0.0%) |
| Total (Category) | 26 (100.0%) | 0 (0.0%) |
| Total (Overall) | 143 (52.4%) | 130 (47.6%) |
Employment Industries by Sex in Avon
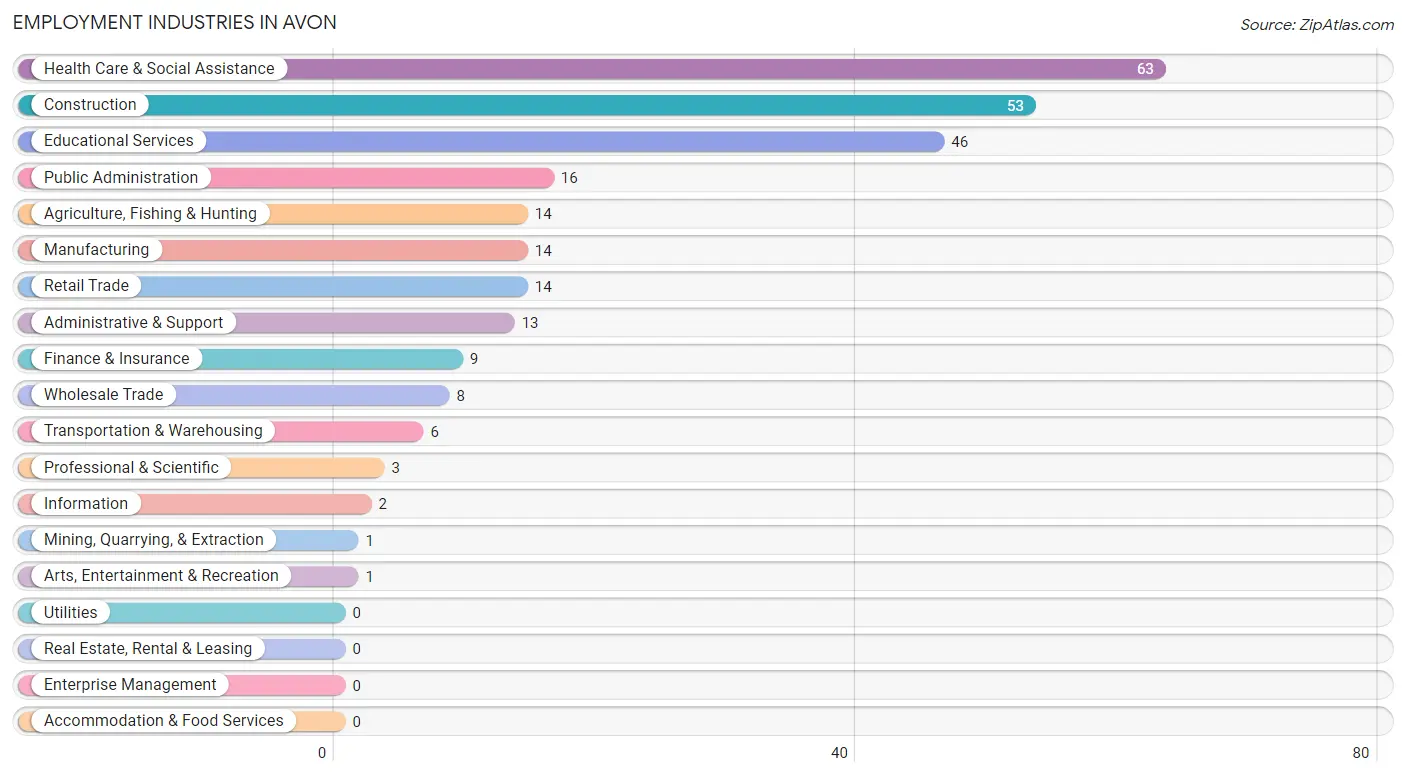
Employment Industries in Avon
The major employment industries in Avon include Health Care & Social Assistance (63 | 23.1%), Construction (53 | 19.4%), Educational Services (46 | 16.9%), Public Administration (16 | 5.9%), and Agriculture, Fishing & Hunting (14 | 5.1%).
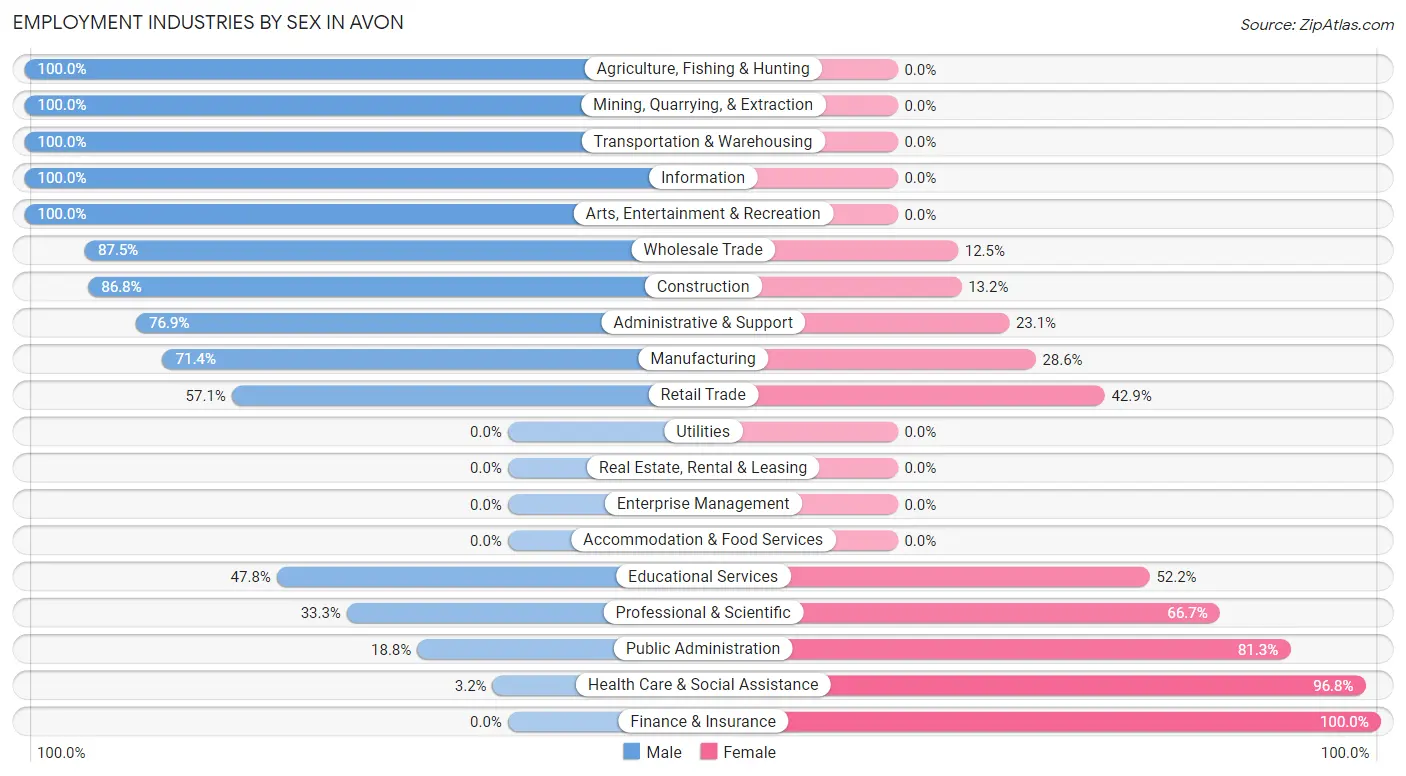
Employment Industries by Sex in Avon
The Avon industries that see more men than women are Agriculture, Fishing & Hunting (100.0%), Mining, Quarrying, & Extraction (100.0%), and Transportation & Warehousing (100.0%), whereas the industries that tend to have a higher number of women are Finance & Insurance (100.0%), Health Care & Social Assistance (96.8%), and Public Administration (81.2%).
| Industry | Male | Female |
| Agriculture, Fishing & Hunting | 14 (100.0%) | 0 (0.0%) |
| Mining, Quarrying, & Extraction | 1 (100.0%) | 0 (0.0%) |
| Construction | 46 (86.8%) | 7 (13.2%) |
| Manufacturing | 10 (71.4%) | 4 (28.6%) |
| Wholesale Trade | 7 (87.5%) | 1 (12.5%) |
| Retail Trade | 8 (57.1%) | 6 (42.9%) |
| Transportation & Warehousing | 6 (100.0%) | 0 (0.0%) |
| Utilities | 0 (0.0%) | 0 (0.0%) |
| Information | 2 (100.0%) | 0 (0.0%) |
| Finance & Insurance | 0 (0.0%) | 9 (100.0%) |
| Real Estate, Rental & Leasing | 0 (0.0%) | 0 (0.0%) |
| Professional & Scientific | 1 (33.3%) | 2 (66.7%) |
| Enterprise Management | 0 (0.0%) | 0 (0.0%) |
| Administrative & Support | 10 (76.9%) | 3 (23.1%) |
| Educational Services | 22 (47.8%) | 24 (52.2%) |
| Health Care & Social Assistance | 2 (3.2%) | 61 (96.8%) |
| Arts, Entertainment & Recreation | 1 (100.0%) | 0 (0.0%) |
| Accommodation & Food Services | 0 (0.0%) | 0 (0.0%) |
| Public Administration | 3 (18.8%) | 13 (81.2%) |
| Total | 143 (52.4%) | 130 (47.6%) |
Education in Avon
School Enrollment in Avon
The most common levels of schooling among the 266 students in Avon are middle school (108 | 40.6%), elementary school (60 | 22.6%), and high school (57 | 21.4%).
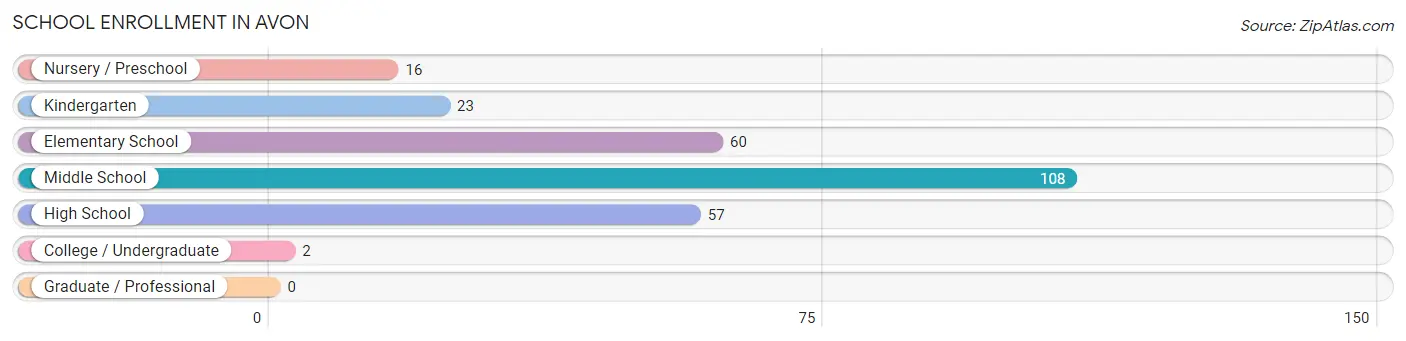
| School Level | # Students | % Students |
| Nursery / Preschool | 16 | 6.0% |
| Kindergarten | 23 | 8.6% |
| Elementary School | 60 | 22.6% |
| Middle School | 108 | 40.6% |
| High School | 57 | 21.4% |
| College / Undergraduate | 2 | 0.7% |
| Graduate / Professional | 0 | 0.0% |
| Total | 266 | 100.0% |
School Enrollment by Age by Funding Source in Avon
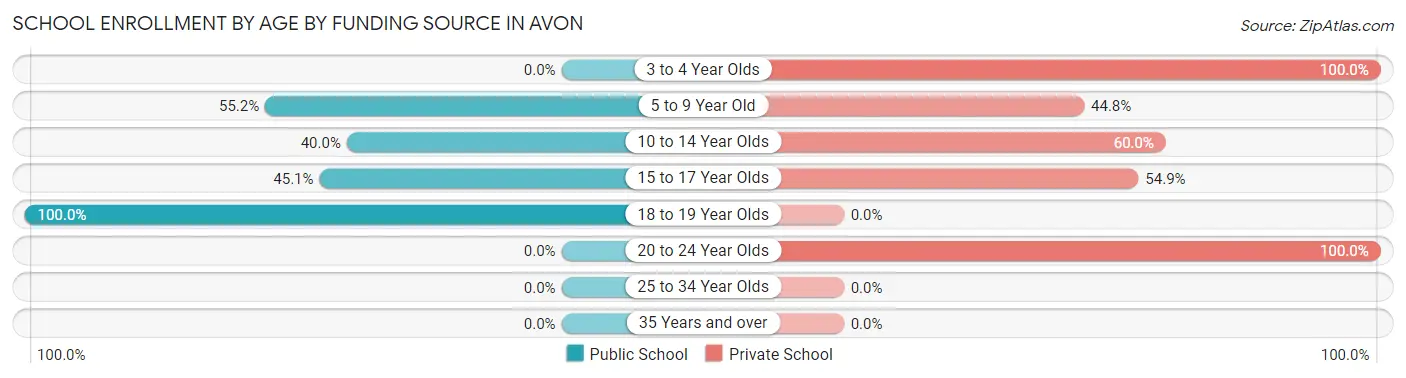
Out of a total of 266 students who are enrolled in schools in Avon, 150 (56.4%) attend a private institution, while the remaining 116 (43.6%) are enrolled in public schools. The age group of 3 to 4 year olds has the highest likelihood of being enrolled in private schools, with 12 (100.0% in the age bracket) enrolled. Conversely, the age group of 18 to 19 year olds has the lowest likelihood of being enrolled in a private school, with 4 (100.0% in the age bracket) attending a public institution.
| Age Bracket | Public School | Private School |
| 3 to 4 Year Olds | 0 (0.0%) | 12 (100.0%) |
| 5 to 9 Year Old | 37 (55.2%) | 30 (44.8%) |
| 10 to 14 Year Olds | 52 (40.0%) | 78 (60.0%) |
| 15 to 17 Year Olds | 23 (45.1%) | 28 (54.9%) |
| 18 to 19 Year Olds | 4 (100.0%) | 0 (0.0%) |
| 20 to 24 Year Olds | 0 (0.0%) | 2 (100.0%) |
| 25 to 34 Year Olds | 0 (0.0%) | 0 (0.0%) |
| 35 Years and over | 0 (0.0%) | 0 (0.0%) |
| Total | 116 (43.6%) | 150 (56.4%) |
Educational Attainment by Field of Study in Avon
Education (38 | 42.7%), science & technology (20 | 22.5%), bio, nature & agricultural (10 | 11.2%), business (6 | 6.7%), and arts & humanities (6 | 6.7%) are the most common fields of study among 89 individuals in Avon who have obtained a bachelor's degree or higher.

| Field of Study | # Graduates | % Graduates |
| Computers & Mathematics | 2 | 2.2% |
| Bio, Nature & Agricultural | 10 | 11.2% |
| Physical & Health Sciences | 0 | 0.0% |
| Psychology | 1 | 1.1% |
| Social Sciences | 0 | 0.0% |
| Engineering | 0 | 0.0% |
| Multidisciplinary Studies | 0 | 0.0% |
| Science & Technology | 20 | 22.5% |
| Business | 6 | 6.7% |
| Education | 38 | 42.7% |
| Literature & Languages | 3 | 3.4% |
| Liberal Arts & History | 0 | 0.0% |
| Visual & Performing Arts | 2 | 2.2% |
| Communications | 1 | 1.1% |
| Arts & Humanities | 6 | 6.7% |
| Total | 89 | 100.0% |
Transportation & Commute in Avon
Vehicle Availability by Sex in Avon
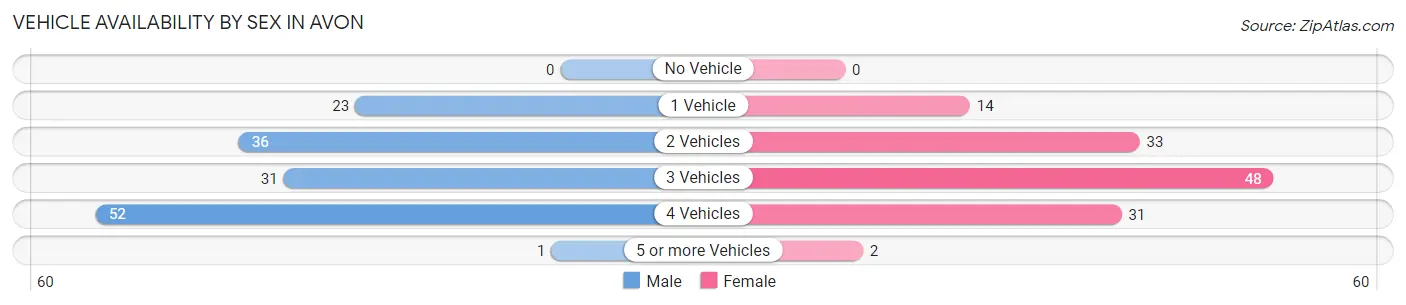
The most prevalent vehicle ownership categories in Avon are males with 4 vehicles (52, accounting for 36.4%) and females with 4 vehicles (31, making up 40.6%).
| Vehicles Available | Male | Female |
| No Vehicle | 0 (0.0%) | 0 (0.0%) |
| 1 Vehicle | 23 (16.1%) | 14 (10.9%) |
| 2 Vehicles | 36 (25.2%) | 33 (25.8%) |
| 3 Vehicles | 31 (21.7%) | 48 (37.5%) |
| 4 Vehicles | 52 (36.4%) | 31 (24.2%) |
| 5 or more Vehicles | 1 (0.7%) | 2 (1.6%) |
| Total | 143 (100.0%) | 128 (100.0%) |
Commute Time in Avon
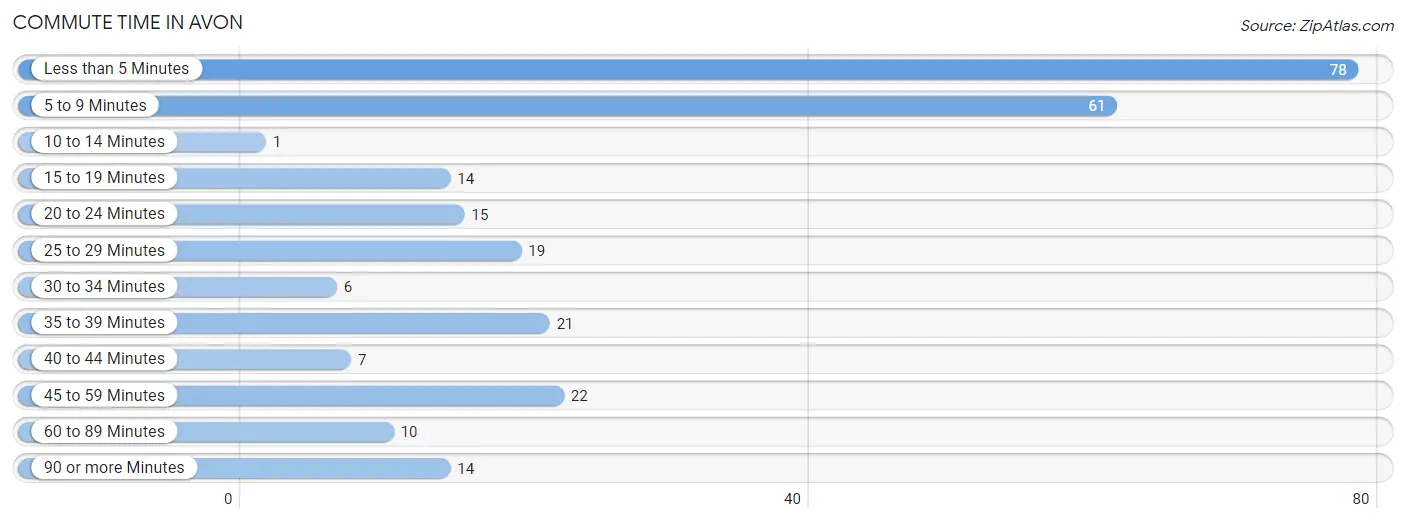
The most frequently occuring commute durations in Avon are less than 5 minutes (78 commuters, 29.1%), 5 to 9 minutes (61 commuters, 22.8%), and 45 to 59 minutes (22 commuters, 8.2%).
| Commute Time | # Commuters | % Commuters |
| Less than 5 Minutes | 78 | 29.1% |
| 5 to 9 Minutes | 61 | 22.8% |
| 10 to 14 Minutes | 1 | 0.4% |
| 15 to 19 Minutes | 14 | 5.2% |
| 20 to 24 Minutes | 15 | 5.6% |
| 25 to 29 Minutes | 19 | 7.1% |
| 30 to 34 Minutes | 6 | 2.2% |
| 35 to 39 Minutes | 21 | 7.8% |
| 40 to 44 Minutes | 7 | 2.6% |
| 45 to 59 Minutes | 22 | 8.2% |
| 60 to 89 Minutes | 10 | 3.7% |
| 90 or more Minutes | 14 | 5.2% |
Commute Time by Sex in Avon
The most common commute times in Avon are less than 5 minutes (47 commuters, 33.6%) for males and less than 5 minutes (31 commuters, 24.2%) for females.
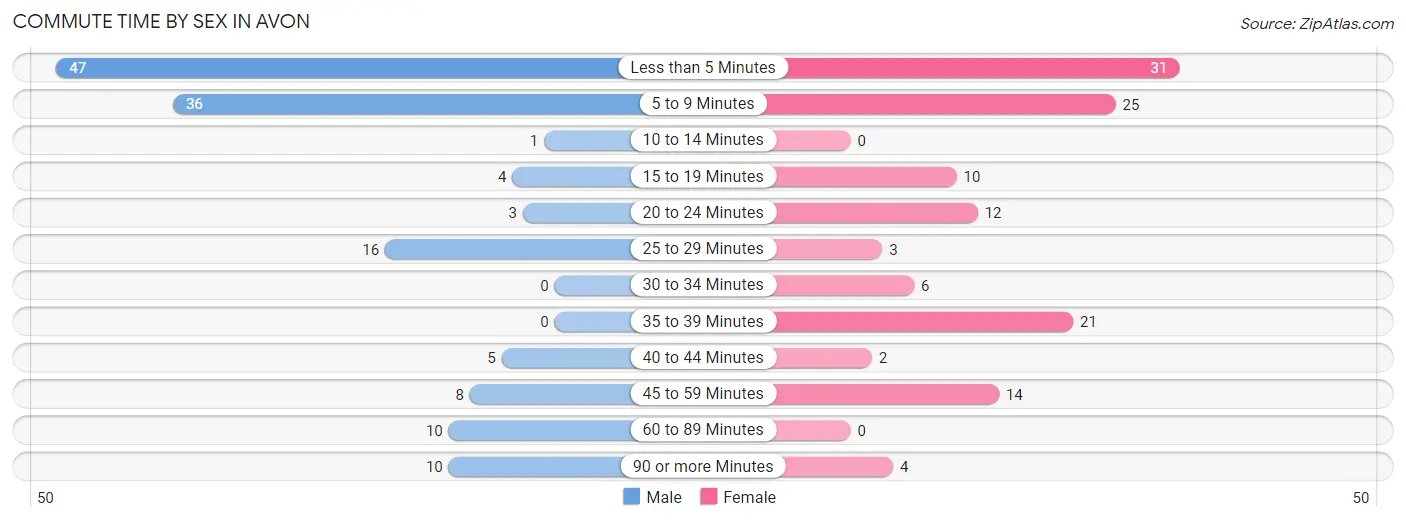
| Commute Time | Male | Female |
| Less than 5 Minutes | 47 (33.6%) | 31 (24.2%) |
| 5 to 9 Minutes | 36 (25.7%) | 25 (19.5%) |
| 10 to 14 Minutes | 1 (0.7%) | 0 (0.0%) |
| 15 to 19 Minutes | 4 (2.9%) | 10 (7.8%) |
| 20 to 24 Minutes | 3 (2.1%) | 12 (9.4%) |
| 25 to 29 Minutes | 16 (11.4%) | 3 (2.3%) |
| 30 to 34 Minutes | 0 (0.0%) | 6 (4.7%) |
| 35 to 39 Minutes | 0 (0.0%) | 21 (16.4%) |
| 40 to 44 Minutes | 5 (3.6%) | 2 (1.6%) |
| 45 to 59 Minutes | 8 (5.7%) | 14 (10.9%) |
| 60 to 89 Minutes | 10 (7.1%) | 0 (0.0%) |
| 90 or more Minutes | 10 (7.1%) | 4 (3.1%) |
Time of Departure to Work by Sex in Avon
The most frequent times of departure to work in Avon are 7:30 AM to 7:59 AM (53, 37.9%) for males and 7:30 AM to 7:59 AM (36, 28.1%) for females.
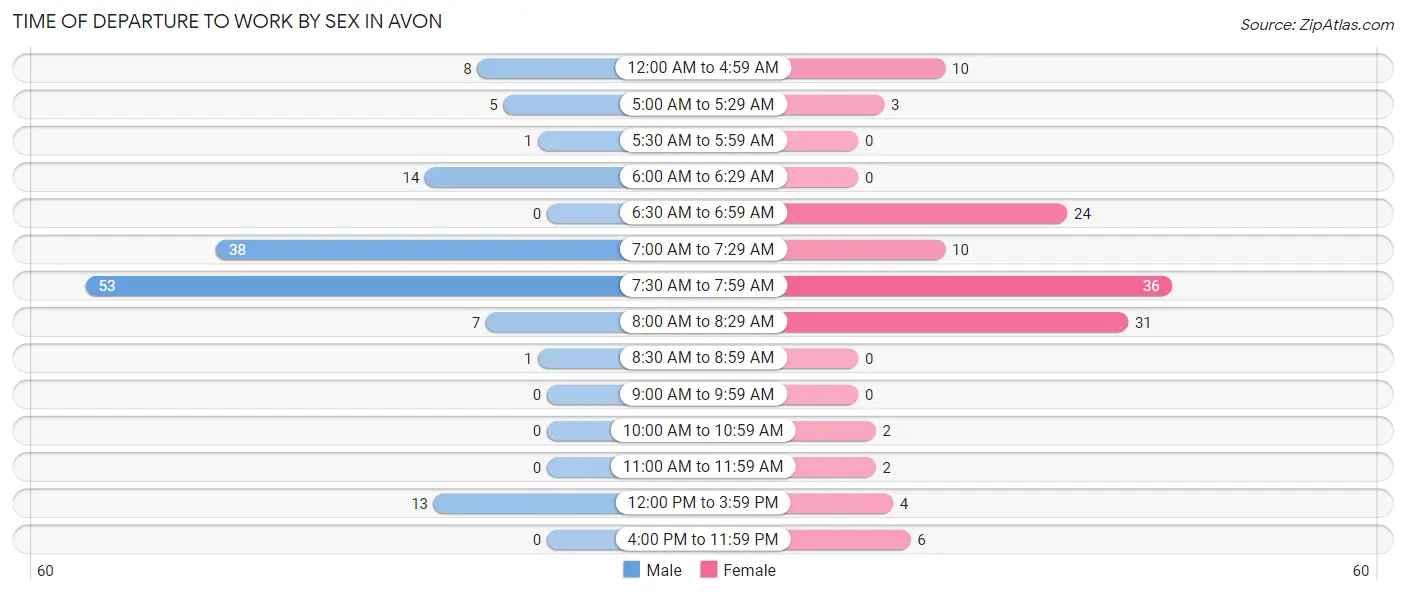
| Time of Departure | Male | Female |
| 12:00 AM to 4:59 AM | 8 (5.7%) | 10 (7.8%) |
| 5:00 AM to 5:29 AM | 5 (3.6%) | 3 (2.3%) |
| 5:30 AM to 5:59 AM | 1 (0.7%) | 0 (0.0%) |
| 6:00 AM to 6:29 AM | 14 (10.0%) | 0 (0.0%) |
| 6:30 AM to 6:59 AM | 0 (0.0%) | 24 (18.8%) |
| 7:00 AM to 7:29 AM | 38 (27.1%) | 10 (7.8%) |
| 7:30 AM to 7:59 AM | 53 (37.9%) | 36 (28.1%) |
| 8:00 AM to 8:29 AM | 7 (5.0%) | 31 (24.2%) |
| 8:30 AM to 8:59 AM | 1 (0.7%) | 0 (0.0%) |
| 9:00 AM to 9:59 AM | 0 (0.0%) | 0 (0.0%) |
| 10:00 AM to 10:59 AM | 0 (0.0%) | 2 (1.6%) |
| 11:00 AM to 11:59 AM | 0 (0.0%) | 2 (1.6%) |
| 12:00 PM to 3:59 PM | 13 (9.3%) | 4 (3.1%) |
| 4:00 PM to 11:59 PM | 0 (0.0%) | 6 (4.7%) |
| Total | 140 (100.0%) | 128 (100.0%) |
Housing Occupancy in Avon
Occupancy by Ownership in Avon
Of the total 239 dwellings in Avon, owner-occupied units account for 194 (81.2%), while renter-occupied units make up 45 (18.8%).
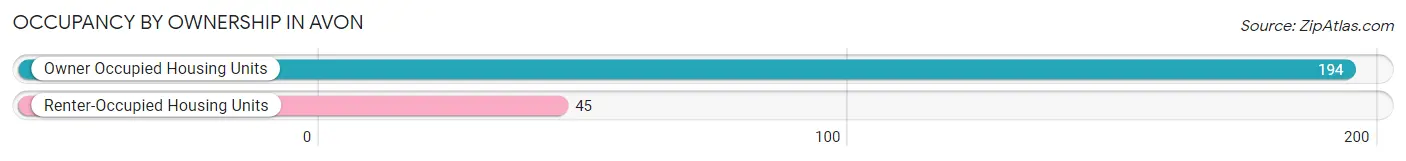
| Occupancy | # Housing Units | % Housing Units |
| Owner Occupied Housing Units | 194 | 81.2% |
| Renter-Occupied Housing Units | 45 | 18.8% |
| Total Occupied Housing Units | 239 | 100.0% |
Occupancy by Household Size in Avon
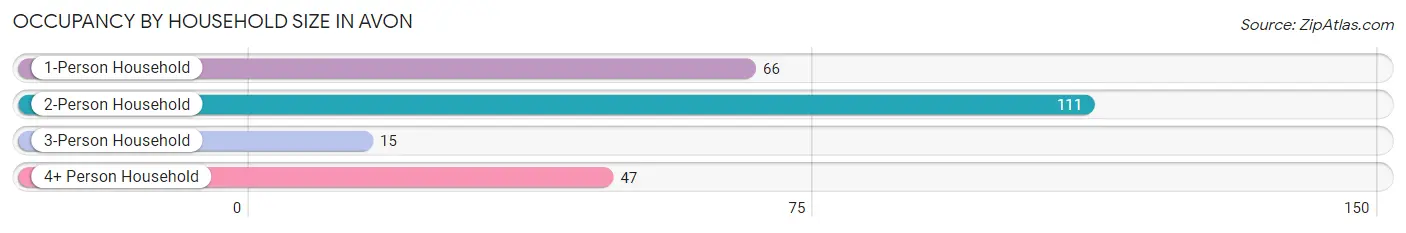
| Household Size | # Housing Units | % Housing Units |
| 1-Person Household | 66 | 27.6% |
| 2-Person Household | 111 | 46.4% |
| 3-Person Household | 15 | 6.3% |
| 4+ Person Household | 47 | 19.7% |
| Total Housing Units | 239 | 100.0% |
Occupancy by Ownership by Household Size in Avon
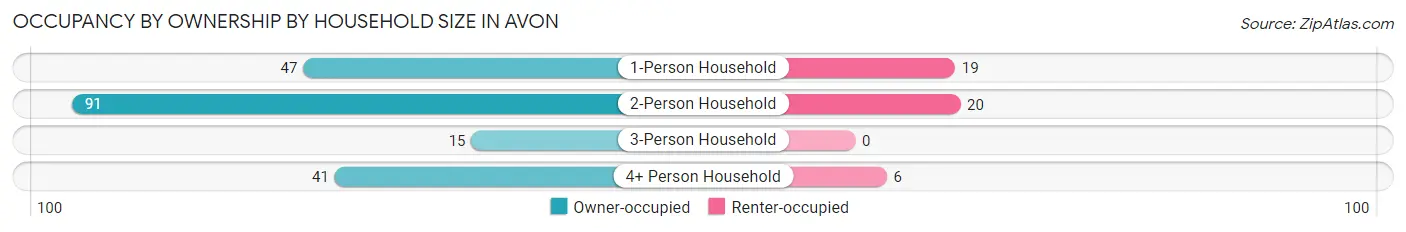
| Household Size | Owner-occupied | Renter-occupied |
| 1-Person Household | 47 (71.2%) | 19 (28.8%) |
| 2-Person Household | 91 (82.0%) | 20 (18.0%) |
| 3-Person Household | 15 (100.0%) | 0 (0.0%) |
| 4+ Person Household | 41 (87.2%) | 6 (12.8%) |
| Total Housing Units | 194 (81.2%) | 45 (18.8%) |
Occupancy by Educational Attainment in Avon
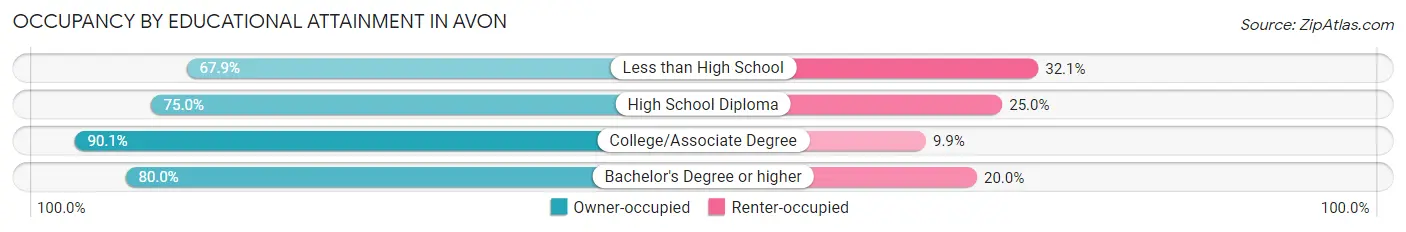
| Household Size | Owner-occupied | Renter-occupied |
| Less than High School | 19 (67.9%) | 9 (32.1%) |
| High School Diploma | 45 (75.0%) | 15 (25.0%) |
| College/Associate Degree | 82 (90.1%) | 9 (9.9%) |
| Bachelor's Degree or higher | 48 (80.0%) | 12 (20.0%) |
Occupancy by Age of Householder in Avon
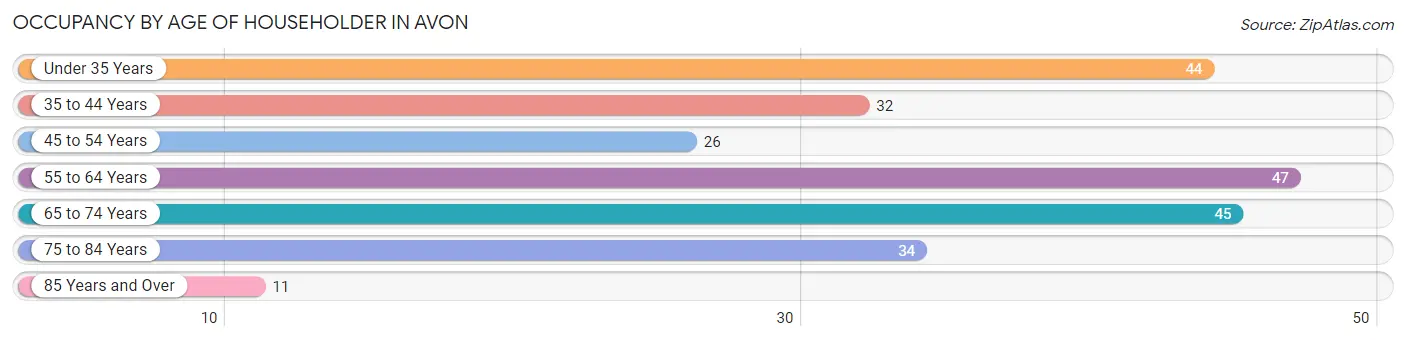
| Age Bracket | # Households | % Households |
| Under 35 Years | 44 | 18.4% |
| 35 to 44 Years | 32 | 13.4% |
| 45 to 54 Years | 26 | 10.9% |
| 55 to 64 Years | 47 | 19.7% |
| 65 to 74 Years | 45 | 18.8% |
| 75 to 84 Years | 34 | 14.2% |
| 85 Years and Over | 11 | 4.6% |
| Total | 239 | 100.0% |
Housing Finances in Avon
Median Income by Occupancy in Avon
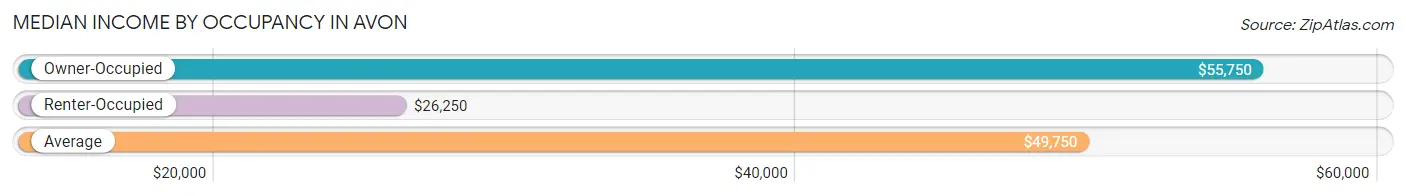
| Occupancy Type | # Households | Median Income |
| Owner-Occupied | 194 (81.2%) | $55,750 |
| Renter-Occupied | 45 (18.8%) | $26,250 |
| Average | 239 (100.0%) | $49,750 |
Occupancy by Householder Income Bracket in Avon
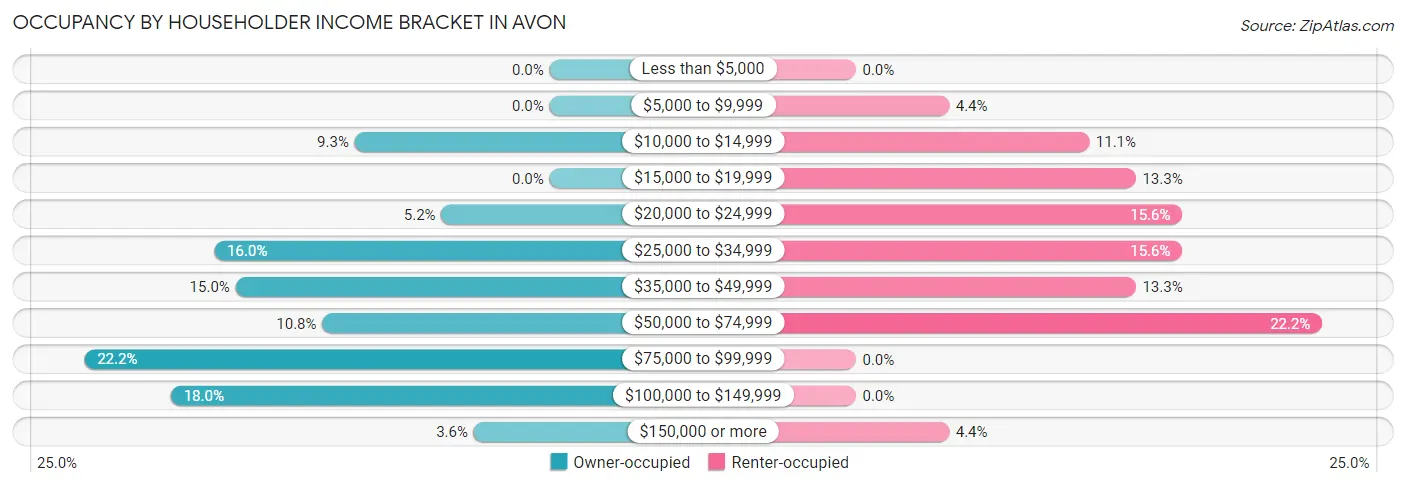
| Income Bracket | Owner-occupied | Renter-occupied |
| Less than $5,000 | 0 (0.0%) | 0 (0.0%) |
| $5,000 to $9,999 | 0 (0.0%) | 2 (4.4%) |
| $10,000 to $14,999 | 18 (9.3%) | 5 (11.1%) |
| $15,000 to $19,999 | 0 (0.0%) | 6 (13.3%) |
| $20,000 to $24,999 | 10 (5.1%) | 7 (15.6%) |
| $25,000 to $34,999 | 31 (16.0%) | 7 (15.6%) |
| $35,000 to $49,999 | 29 (14.9%) | 6 (13.3%) |
| $50,000 to $74,999 | 21 (10.8%) | 10 (22.2%) |
| $75,000 to $99,999 | 43 (22.2%) | 0 (0.0%) |
| $100,000 to $149,999 | 35 (18.0%) | 0 (0.0%) |
| $150,000 or more | 7 (3.6%) | 2 (4.4%) |
| Total | 194 (100.0%) | 45 (100.0%) |
Monthly Housing Cost Tiers in Avon
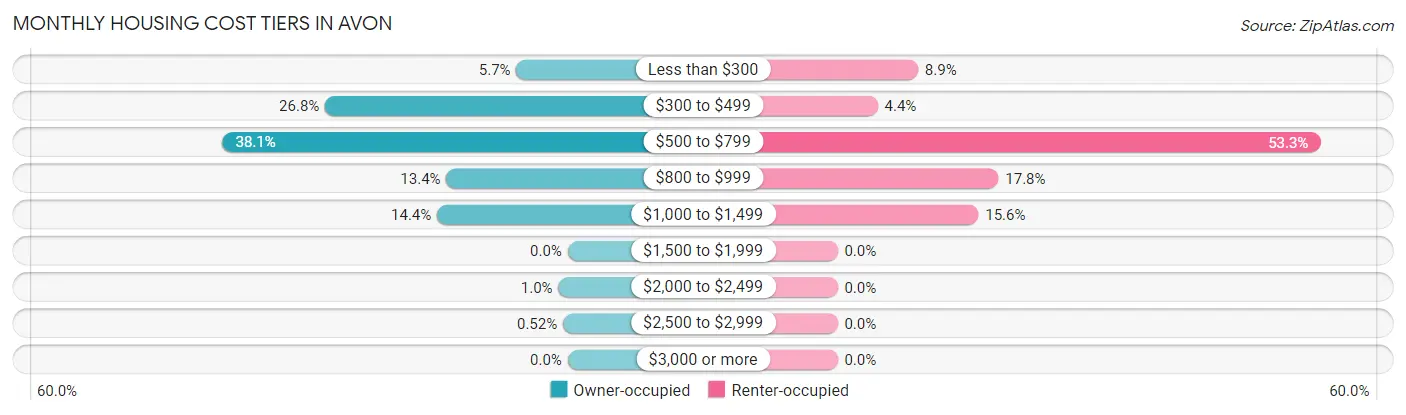
| Monthly Cost | Owner-occupied | Renter-occupied |
| Less than $300 | 11 (5.7%) | 4 (8.9%) |
| $300 to $499 | 52 (26.8%) | 2 (4.4%) |
| $500 to $799 | 74 (38.1%) | 24 (53.3%) |
| $800 to $999 | 26 (13.4%) | 8 (17.8%) |
| $1,000 to $1,499 | 28 (14.4%) | 7 (15.6%) |
| $1,500 to $1,999 | 0 (0.0%) | 0 (0.0%) |
| $2,000 to $2,499 | 2 (1.0%) | 0 (0.0%) |
| $2,500 to $2,999 | 1 (0.5%) | 0 (0.0%) |
| $3,000 or more | 0 (0.0%) | 0 (0.0%) |
| Total | 194 (100.0%) | 45 (100.0%) |
Physical Housing Characteristics in Avon
Housing Structures in Avon
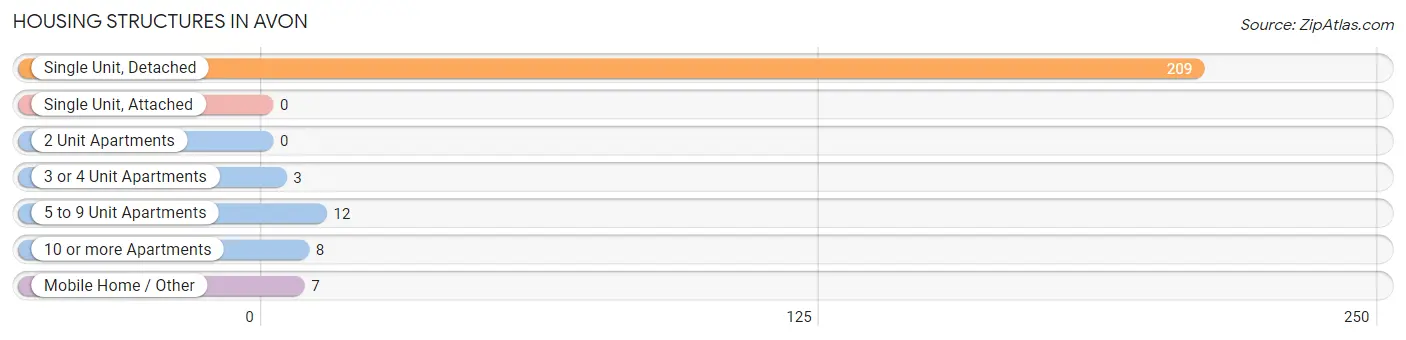
| Structure Type | # Housing Units | % Housing Units |
| Single Unit, Detached | 209 | 87.5% |
| Single Unit, Attached | 0 | 0.0% |
| 2 Unit Apartments | 0 | 0.0% |
| 3 or 4 Unit Apartments | 3 | 1.3% |
| 5 to 9 Unit Apartments | 12 | 5.0% |
| 10 or more Apartments | 8 | 3.4% |
| Mobile Home / Other | 7 | 2.9% |
| Total | 239 | 100.0% |
Housing Structures by Occupancy in Avon
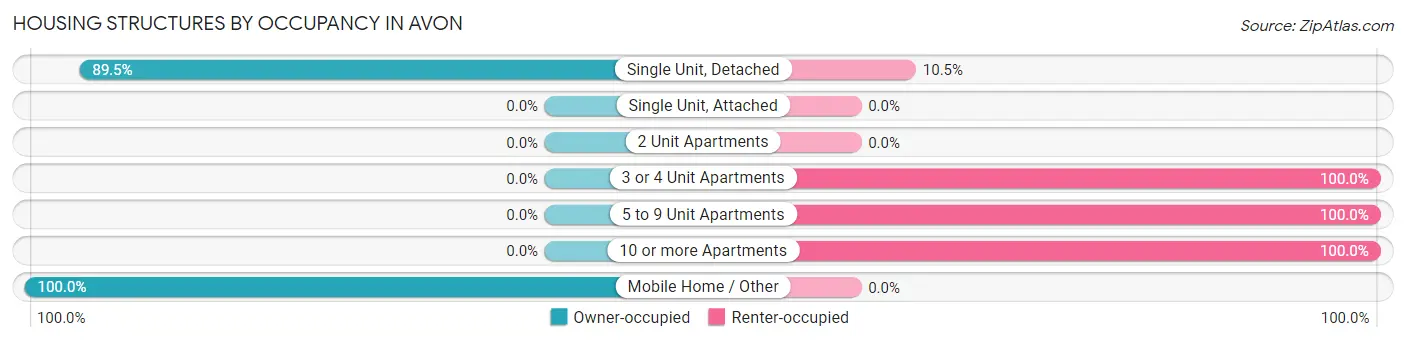
| Structure Type | Owner-occupied | Renter-occupied |
| Single Unit, Detached | 187 (89.5%) | 22 (10.5%) |
| Single Unit, Attached | 0 (0.0%) | 0 (0.0%) |
| 2 Unit Apartments | 0 (0.0%) | 0 (0.0%) |
| 3 or 4 Unit Apartments | 0 (0.0%) | 3 (100.0%) |
| 5 to 9 Unit Apartments | 0 (0.0%) | 12 (100.0%) |
| 10 or more Apartments | 0 (0.0%) | 8 (100.0%) |
| Mobile Home / Other | 7 (100.0%) | 0 (0.0%) |
| Total | 194 (81.2%) | 45 (18.8%) |
Housing Structures by Number of Rooms in Avon
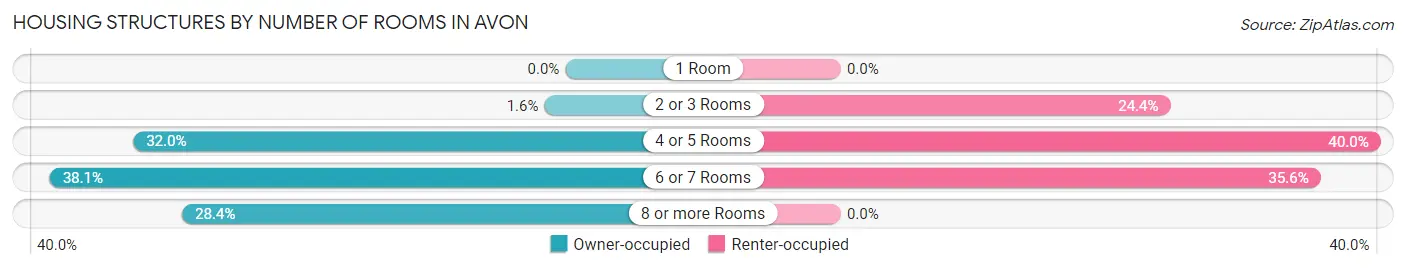
| Number of Rooms | Owner-occupied | Renter-occupied |
| 1 Room | 0 (0.0%) | 0 (0.0%) |
| 2 or 3 Rooms | 3 (1.5%) | 11 (24.4%) |
| 4 or 5 Rooms | 62 (32.0%) | 18 (40.0%) |
| 6 or 7 Rooms | 74 (38.1%) | 16 (35.6%) |
| 8 or more Rooms | 55 (28.3%) | 0 (0.0%) |
| Total | 194 (100.0%) | 45 (100.0%) |
Housing Structure by Heating Type in Avon
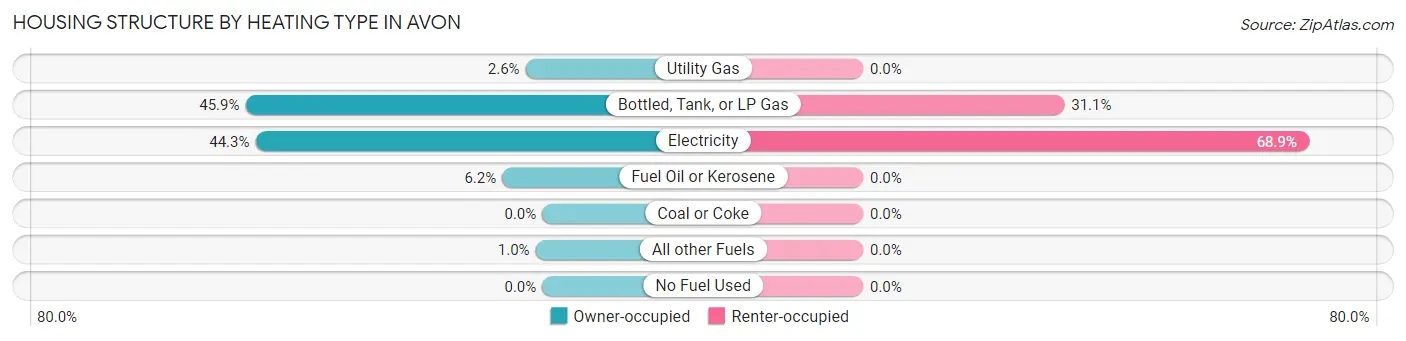
| Heating Type | Owner-occupied | Renter-occupied |
| Utility Gas | 5 (2.6%) | 0 (0.0%) |
| Bottled, Tank, or LP Gas | 89 (45.9%) | 14 (31.1%) |
| Electricity | 86 (44.3%) | 31 (68.9%) |
| Fuel Oil or Kerosene | 12 (6.2%) | 0 (0.0%) |
| Coal or Coke | 0 (0.0%) | 0 (0.0%) |
| All other Fuels | 2 (1.0%) | 0 (0.0%) |
| No Fuel Used | 0 (0.0%) | 0 (0.0%) |
| Total | 194 (100.0%) | 45 (100.0%) |
Household Vehicle Usage in Avon
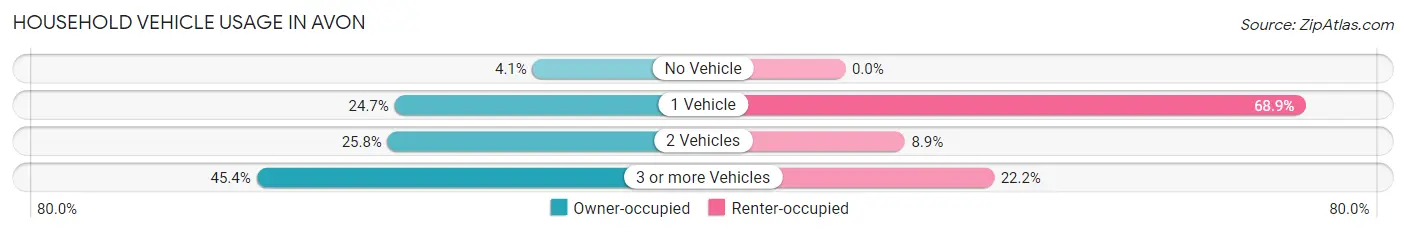
| Vehicles per Household | Owner-occupied | Renter-occupied |
| No Vehicle | 8 (4.1%) | 0 (0.0%) |
| 1 Vehicle | 48 (24.7%) | 31 (68.9%) |
| 2 Vehicles | 50 (25.8%) | 4 (8.9%) |
| 3 or more Vehicles | 88 (45.4%) | 10 (22.2%) |
| Total | 194 (100.0%) | 45 (100.0%) |
Real Estate & Mortgages in Avon
Real Estate and Mortgage Overview in Avon
| Characteristic | Without Mortgage | With Mortgage |
| Housing Units | 112 | 82 |
| Median Property Value | $90,800 | $54,200 |
| Median Household Income | - | - |
| Monthly Housing Costs | $453 | $0 |
| Real Estate Taxes | $1,633 | $3 |
Property Value by Mortgage Status in Avon
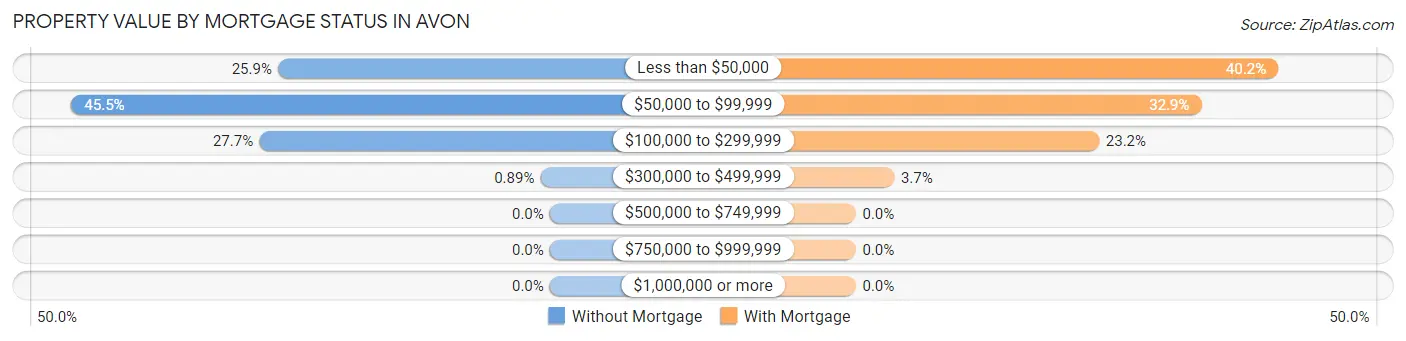
| Property Value | Without Mortgage | With Mortgage |
| Less than $50,000 | 29 (25.9%) | 33 (40.2%) |
| $50,000 to $99,999 | 51 (45.5%) | 27 (32.9%) |
| $100,000 to $299,999 | 31 (27.7%) | 19 (23.2%) |
| $300,000 to $499,999 | 1 (0.9%) | 3 (3.7%) |
| $500,000 to $749,999 | 0 (0.0%) | 0 (0.0%) |
| $750,000 to $999,999 | 0 (0.0%) | 0 (0.0%) |
| $1,000,000 or more | 0 (0.0%) | 0 (0.0%) |
| Total | 112 (100.0%) | 82 (100.0%) |
Household Income by Mortgage Status in Avon
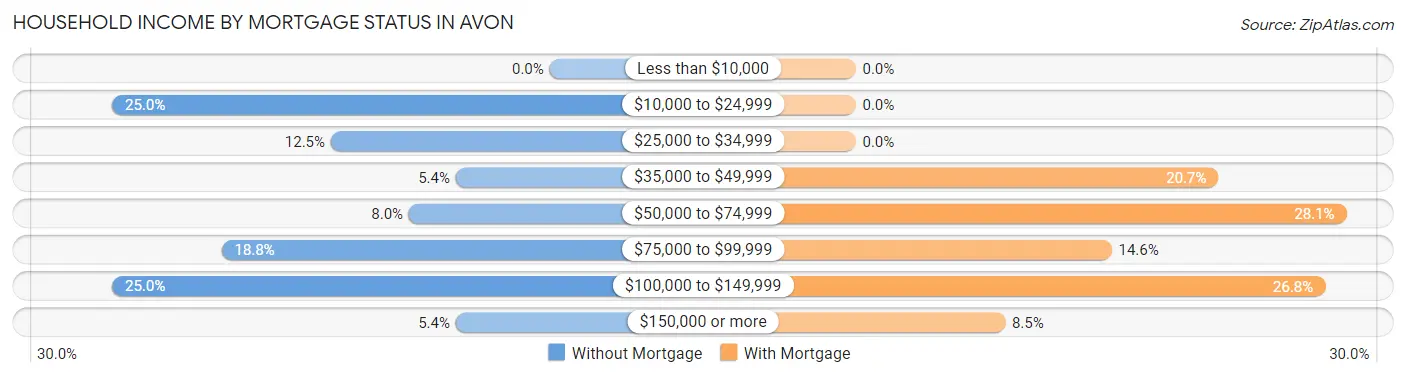
| Household Income | Without Mortgage | With Mortgage |
| Less than $10,000 | 0 (0.0%) | 0 (0.0%) |
| $10,000 to $24,999 | 28 (25.0%) | 0 (0.0%) |
| $25,000 to $34,999 | 14 (12.5%) | 0 (0.0%) |
| $35,000 to $49,999 | 6 (5.4%) | 17 (20.7%) |
| $50,000 to $74,999 | 9 (8.0%) | 23 (28.1%) |
| $75,000 to $99,999 | 21 (18.8%) | 12 (14.6%) |
| $100,000 to $149,999 | 28 (25.0%) | 22 (26.8%) |
| $150,000 or more | 6 (5.4%) | 7 (8.5%) |
| Total | 112 (100.0%) | 82 (100.0%) |
Property Value to Household Income Ratio in Avon
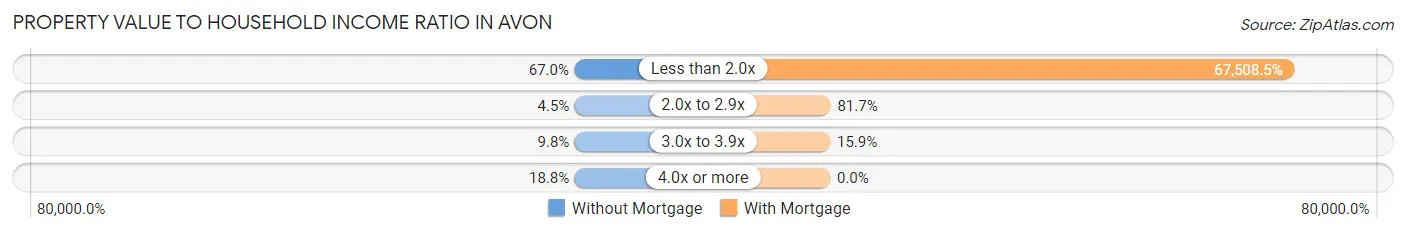
| Value-to-Income Ratio | Without Mortgage | With Mortgage |
| Less than 2.0x | 75 (67.0%) | 55,357 (67,508.5%) |
| 2.0x to 2.9x | 5 (4.5%) | 67 (81.7%) |
| 3.0x to 3.9x | 11 (9.8%) | 13 (15.9%) |
| 4.0x or more | 21 (18.8%) | 0 (0.0%) |
| Total | 112 (100.0%) | 82 (100.0%) |
Real Estate Taxes by Mortgage Status in Avon
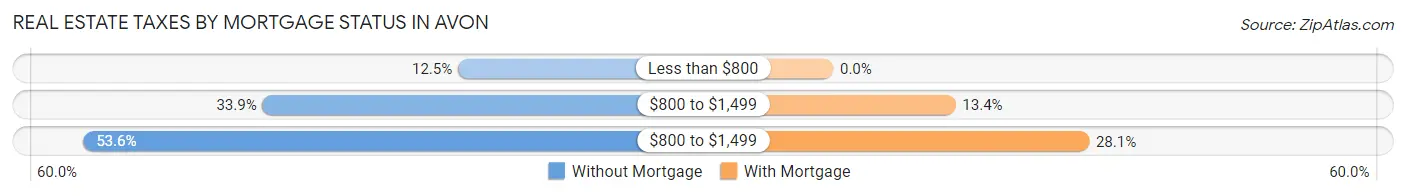
| Property Taxes | Without Mortgage | With Mortgage |
| Less than $800 | 14 (12.5%) | 0 (0.0%) |
| $800 to $1,499 | 38 (33.9%) | 11 (13.4%) |
| $800 to $1,499 | 60 (53.6%) | 23 (28.1%) |
| Total | 112 (100.0%) | 82 (100.0%) |
Health & Disability in Avon
Health Insurance Coverage by Age in Avon
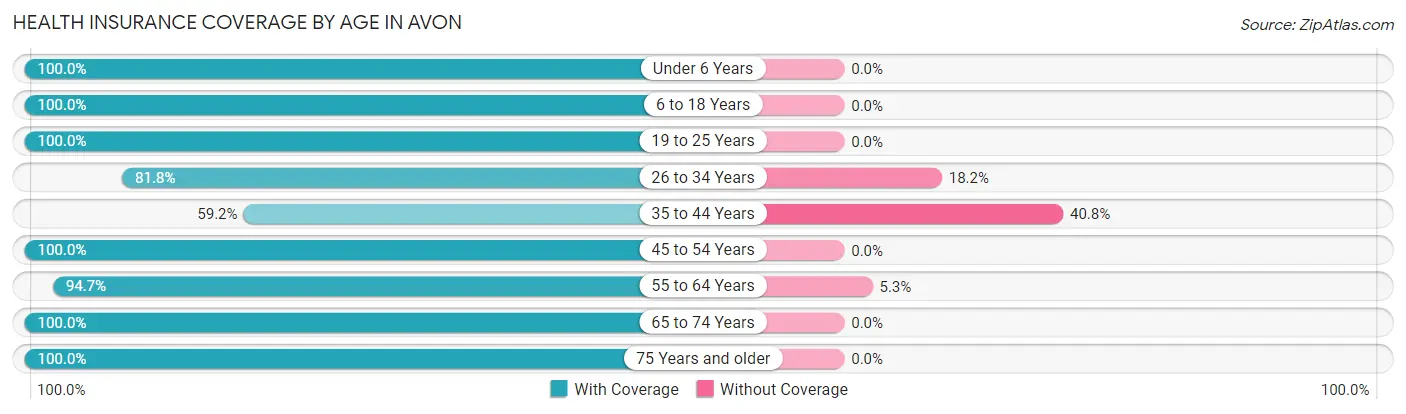
| Age Bracket | With Coverage | Without Coverage |
| Under 6 Years | 60 (100.0%) | 0 (0.0%) |
| 6 to 18 Years | 231 (100.0%) | 0 (0.0%) |
| 19 to 25 Years | 10 (100.0%) | 0 (0.0%) |
| 26 to 34 Years | 54 (81.8%) | 12 (18.2%) |
| 35 to 44 Years | 45 (59.2%) | 31 (40.8%) |
| 45 to 54 Years | 40 (100.0%) | 0 (0.0%) |
| 55 to 64 Years | 90 (94.7%) | 5 (5.3%) |
| 65 to 74 Years | 74 (100.0%) | 0 (0.0%) |
| 75 Years and older | 55 (100.0%) | 0 (0.0%) |
| Total | 659 (93.2%) | 48 (6.8%) |
Health Insurance Coverage by Citizenship Status in Avon
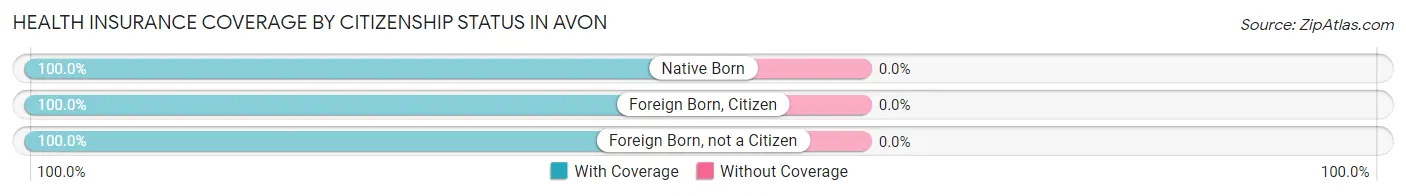
| Citizenship Status | With Coverage | Without Coverage |
| Native Born | 60 (100.0%) | 0 (0.0%) |
| Foreign Born, Citizen | 231 (100.0%) | 0 (0.0%) |
| Foreign Born, not a Citizen | 10 (100.0%) | 0 (0.0%) |
Health Insurance Coverage by Household Income in Avon
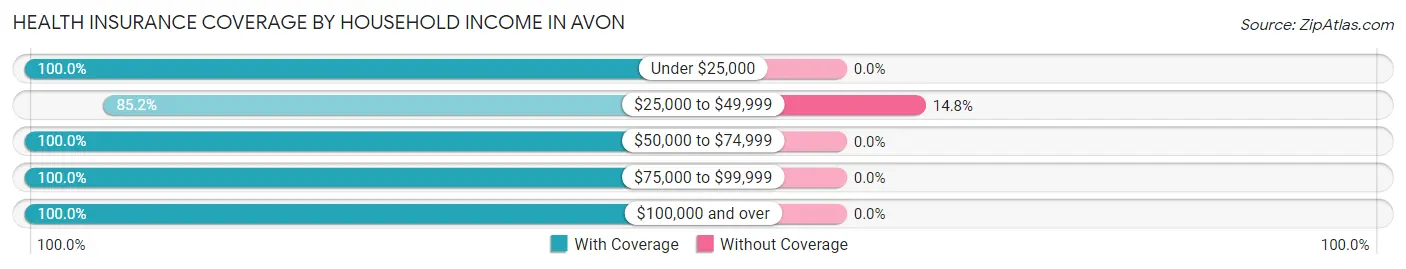
| Household Income | With Coverage | Without Coverage |
| Under $25,000 | 63 (100.0%) | 0 (0.0%) |
| $25,000 to $49,999 | 276 (85.2%) | 48 (14.8%) |
| $50,000 to $74,999 | 107 (100.0%) | 0 (0.0%) |
| $75,000 to $99,999 | 113 (100.0%) | 0 (0.0%) |
| $100,000 and over | 100 (100.0%) | 0 (0.0%) |
Public vs Private Health Insurance Coverage by Age in Avon
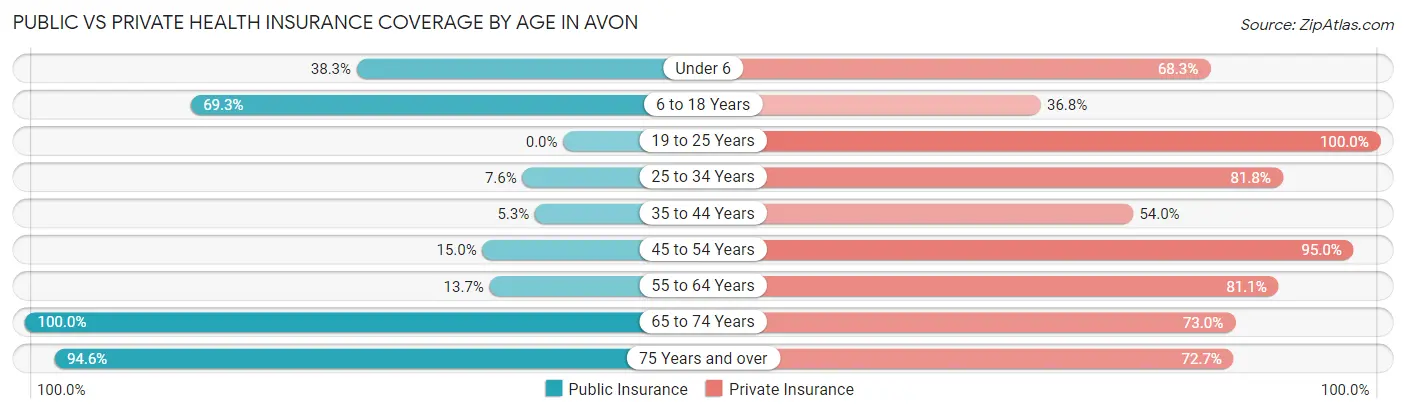
| Age Bracket | Public Insurance | Private Insurance |
| Under 6 | 23 (38.3%) | 41 (68.3%) |
| 6 to 18 Years | 160 (69.3%) | 85 (36.8%) |
| 19 to 25 Years | 0 (0.0%) | 10 (100.0%) |
| 25 to 34 Years | 5 (7.6%) | 54 (81.8%) |
| 35 to 44 Years | 4 (5.3%) | 41 (53.9%) |
| 45 to 54 Years | 6 (15.0%) | 38 (95.0%) |
| 55 to 64 Years | 13 (13.7%) | 77 (81.0%) |
| 65 to 74 Years | 74 (100.0%) | 54 (73.0%) |
| 75 Years and over | 52 (94.6%) | 40 (72.7%) |
| Total | 337 (47.7%) | 440 (62.2%) |
Disability Status by Sex by Age in Avon
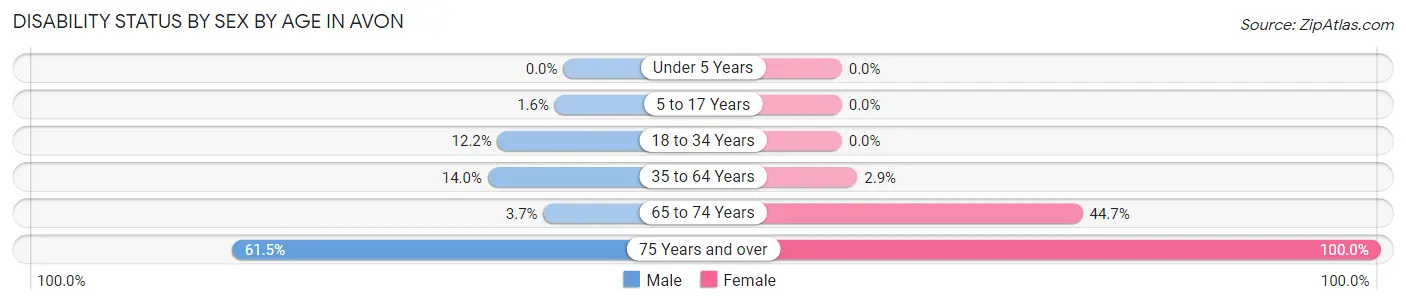
| Age Bracket | Male | Female |
| Under 5 Years | 0 (0.0%) | 0 (0.0%) |
| 5 to 17 Years | 2 (1.6%) | 0 (0.0%) |
| 18 to 34 Years | 5 (12.2%) | 0 (0.0%) |
| 35 to 64 Years | 15 (14.0%) | 3 (2.9%) |
| 65 to 74 Years | 1 (3.7%) | 21 (44.7%) |
| 75 Years and over | 24 (61.5%) | 16 (100.0%) |
Disability Class by Sex by Age in Avon
Disability Class: Hearing Difficulty
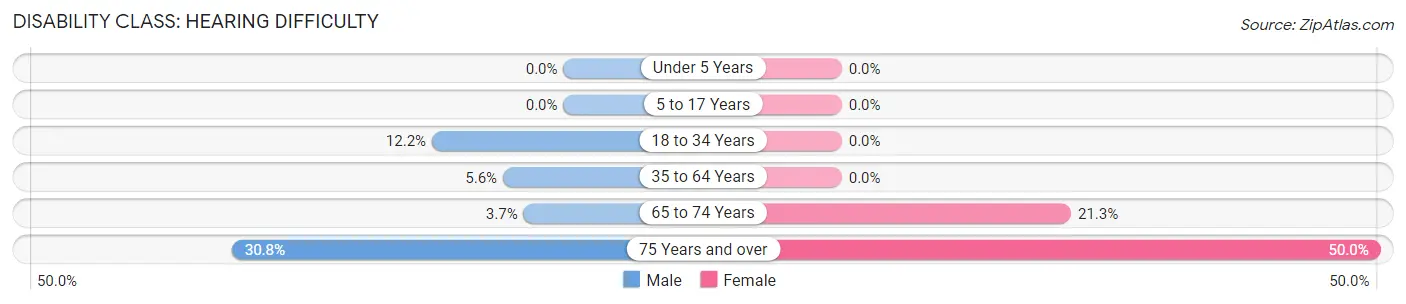
| Age Bracket | Male | Female |
| Under 5 Years | 0 (0.0%) | 0 (0.0%) |
| 5 to 17 Years | 0 (0.0%) | 0 (0.0%) |
| 18 to 34 Years | 5 (12.2%) | 0 (0.0%) |
| 35 to 64 Years | 6 (5.6%) | 0 (0.0%) |
| 65 to 74 Years | 1 (3.7%) | 10 (21.3%) |
| 75 Years and over | 12 (30.8%) | 8 (50.0%) |
Disability Class: Vision Difficulty
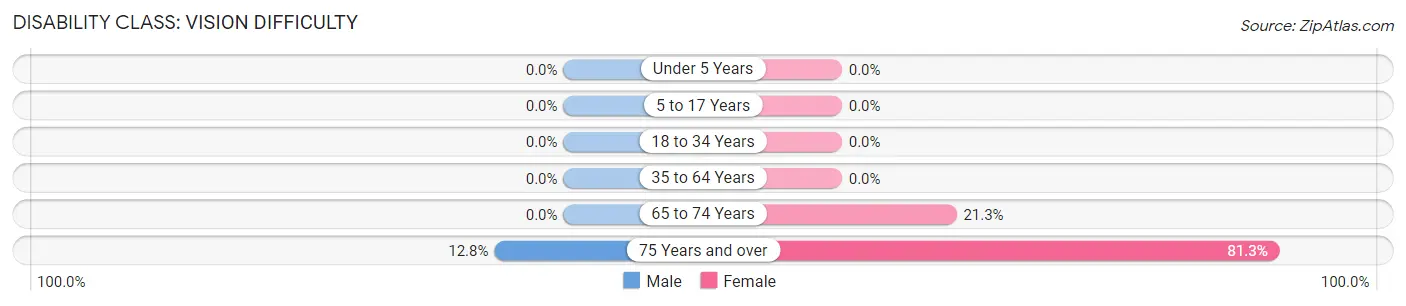
| Age Bracket | Male | Female |
| Under 5 Years | 0 (0.0%) | 0 (0.0%) |
| 5 to 17 Years | 0 (0.0%) | 0 (0.0%) |
| 18 to 34 Years | 0 (0.0%) | 0 (0.0%) |
| 35 to 64 Years | 0 (0.0%) | 0 (0.0%) |
| 65 to 74 Years | 0 (0.0%) | 10 (21.3%) |
| 75 Years and over | 5 (12.8%) | 13 (81.2%) |
Disability Class: Cognitive Difficulty
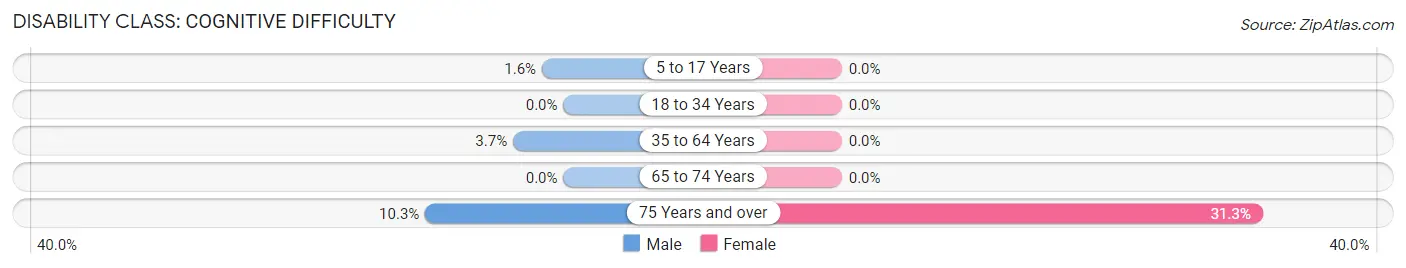
| Age Bracket | Male | Female |
| 5 to 17 Years | 2 (1.6%) | 0 (0.0%) |
| 18 to 34 Years | 0 (0.0%) | 0 (0.0%) |
| 35 to 64 Years | 4 (3.7%) | 0 (0.0%) |
| 65 to 74 Years | 0 (0.0%) | 0 (0.0%) |
| 75 Years and over | 4 (10.3%) | 5 (31.2%) |
Disability Class: Ambulatory Difficulty
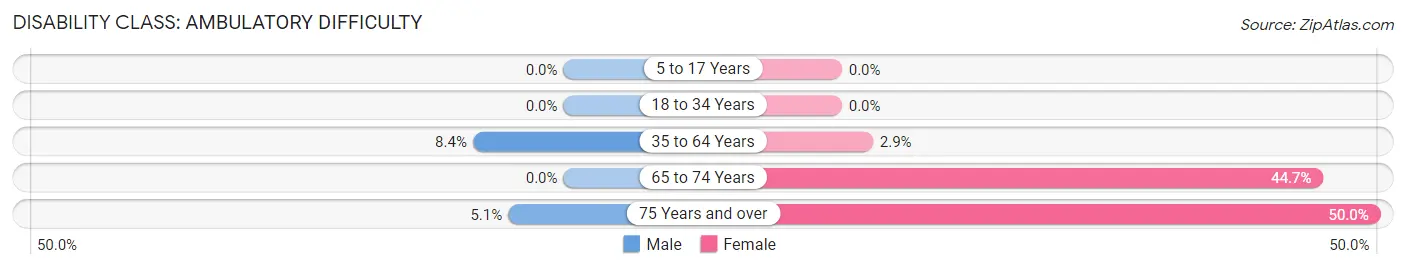
| Age Bracket | Male | Female |
| 5 to 17 Years | 0 (0.0%) | 0 (0.0%) |
| 18 to 34 Years | 0 (0.0%) | 0 (0.0%) |
| 35 to 64 Years | 9 (8.4%) | 3 (2.9%) |
| 65 to 74 Years | 0 (0.0%) | 21 (44.7%) |
| 75 Years and over | 2 (5.1%) | 8 (50.0%) |
Disability Class: Self-Care Difficulty
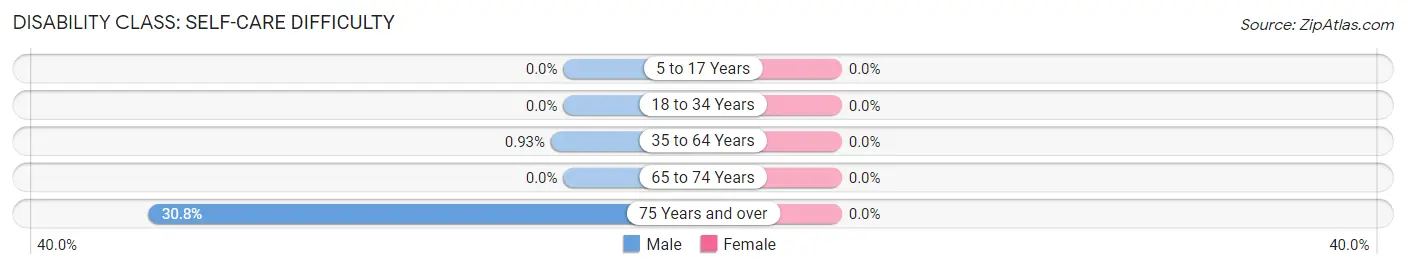
| Age Bracket | Male | Female |
| 5 to 17 Years | 0 (0.0%) | 0 (0.0%) |
| 18 to 34 Years | 0 (0.0%) | 0 (0.0%) |
| 35 to 64 Years | 1 (0.9%) | 0 (0.0%) |
| 65 to 74 Years | 0 (0.0%) | 0 (0.0%) |
| 75 Years and over | 12 (30.8%) | 0 (0.0%) |
Technology Access in Avon
Computing Device Access in Avon
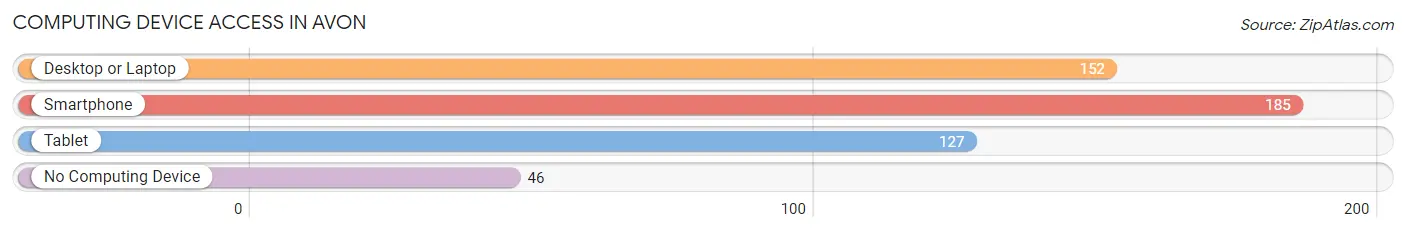
| Device Type | # Households | % Households |
| Desktop or Laptop | 152 | 63.6% |
| Smartphone | 185 | 77.4% |
| Tablet | 127 | 53.1% |
| No Computing Device | 46 | 19.3% |
| Total | 239 | 100.0% |
Internet Access in Avon
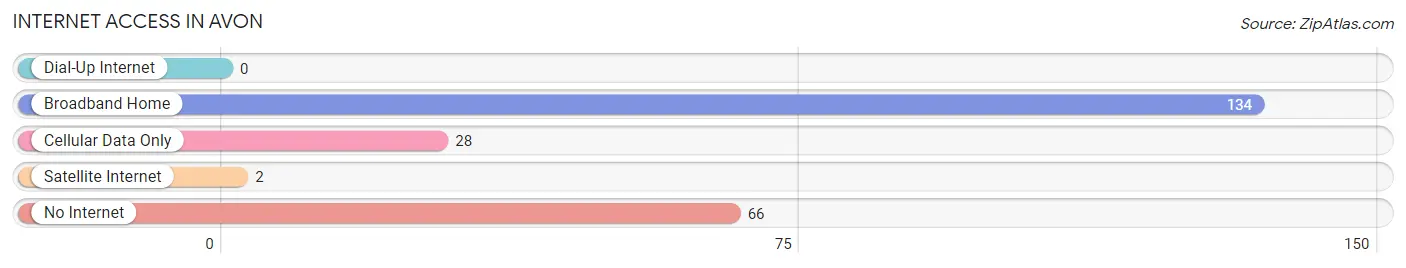
| Internet Type | # Households | % Households |
| Dial-Up Internet | 0 | 0.0% |
| Broadband Home | 134 | 56.1% |
| Cellular Data Only | 28 | 11.7% |
| Satellite Internet | 2 | 0.8% |
| No Internet | 66 | 27.6% |
| Total | 239 | 100.0% |
Avon Summary
Avon, South Dakota is a small town located in Bon Homme County in the southeastern corner of the state. The town was founded in 1883 and has a population of approximately 500 people. The town is situated on the banks of the Missouri River and is surrounded by rolling hills and farmland.
Avon is located in the heart of the Great Plains, and the area is known for its rich agricultural heritage. The town is home to a variety of crops, including corn, soybeans, wheat, and hay. The town is also home to a variety of livestock, including cattle, sheep, and hogs.
The town of Avon is served by two major highways, US Highway 81 and South Dakota Highway 50. The town is also served by a small airport, the Avon Municipal Airport. The town is also served by a variety of local businesses, including a grocery store, a hardware store, a bank, and a post office.
The town of Avon has a rich history. The town was founded in 1883 by a group of settlers from Iowa. The settlers were attracted to the area by the fertile soil and the abundance of natural resources. The town was named after the nearby Avon Creek, which was named after the Avon River in England.
The town of Avon has a strong economy. The town is home to a variety of businesses, including a grocery store, a hardware store, a bank, and a post office. The town is also home to a variety of manufacturing companies, including a furniture factory, a metal fabrication plant, and a plastics factory. The town is also home to a variety of agricultural businesses, including a dairy farm, a feedlot, and a grain elevator.
The town of Avon has a diverse population. The town is home to a variety of ethnicities, including Native American, African American, Hispanic, and Asian. The town is also home to a variety of religious denominations, including Catholic, Lutheran, and Methodist.
The town of Avon has a variety of recreational activities. The town is home to a variety of parks, including a city park, a county park, and a state park. The town is also home to a variety of golf courses, including a nine-hole course and an eighteen-hole course. The town is also home to a variety of museums, including a museum of local history and a museum of Native American culture.
The town of Avon is a great place to live and work. The town has a strong economy, a diverse population, and a variety of recreational activities. The town is also home to a variety of businesses, including a grocery store, a hardware store, a bank, and a post office. The town is also home to a variety of manufacturing companies, including a furniture factory, a metal fabrication plant, and a plastics factory. The town is also home to a variety of agricultural businesses, including a dairy farm, a feedlot, and a grain elevator. The town of Avon is a great place to live and work.
Common Questions
What is Per Capita Income in Avon?
Per Capita income in Avon is $22,043.
What is the Median Family Income in Avon?
Median Family Income in Avon is $74,583.
What is the Median Household income in Avon?
Median Household Income in Avon is $49,750.
What is Income or Wage Gap in Avon?
Income or Wage Gap in Avon is 14.6%.
Women in Avon earn 85.4 cents for every dollar earned by a man.
What is Inequality or Gini Index in Avon?
Inequality or Gini Index in Avon is 0.36.
What is the Total Population of Avon?
Total Population of Avon is 707.
What is the Total Male Population of Avon?
Total Male Population of Avon is 370.
What is the Total Female Population of Avon?
Total Female Population of Avon is 337.
What is the Ratio of Males per 100 Females in Avon?
There are 109.79 Males per 100 Females in Avon.
What is the Ratio of Females per 100 Males in Avon?
There are 91.08 Females per 100 Males in Avon.
What is the Median Population Age in Avon?
Median Population Age in Avon is 34.2 Years.
What is the Average Family Size in Avon
Average Family Size in Avon is 3.8 People.
What is the Average Household Size in Avon
Average Household Size in Avon is 3.0 People.
How Large is the Labor Force in Avon?
There are 279 People in the Labor Forcein in Avon.
What is the Percentage of People in the Labor Force in Avon?
64.0% of People are in the Labor Force in Avon.
What is the Unemployment Rate in Avon?
Unemployment Rate in Avon is 2.2%.