Summit, SD Map & Demographics
Summit Map
Summit Overview
$23,023
PER CAPITA INCOME
$88,438
AVG FAMILY INCOME
$54,375
AVG HOUSEHOLD INCOME
24.2%
WAGE / INCOME GAP [ % ]
75.8¢/ $1
WAGE / INCOME GAP [ $ ]
0.39
INEQUALITY / GINI INDEX
341
TOTAL POPULATION
187
MALE POPULATION
154
FEMALE POPULATION
121.43
MALES / 100 FEMALES
82.35
FEMALES / 100 MALES
28.1
MEDIAN AGE
3.6
AVG FAMILY SIZE
2.9
AVG HOUSEHOLD SIZE
173
LABOR FORCE [ PEOPLE ]
68.1%
PERCENT IN LABOR FORCE
6.4%
UNEMPLOYMENT RATE
Summit Zip Codes
Summit Area Codes
Income in Summit
Income Overview in Summit
Per Capita Income in Summit is $23,023, while median incomes of families and households are $88,438 and $54,375 respectively.
| Characteristic | Number | Measure |
| Per Capita Income | 341 | $23,023 |
| Median Family Income | 80 | $88,438 |
| Mean Family Income | 80 | $75,426 |
| Median Household Income | 116 | $54,375 |
| Mean Household Income | 116 | $63,394 |
| Income Deficit | 80 | $0 |
| Wage / Income Gap (%) | 341 | 24.23% |
| Wage / Income Gap ($) | 341 | 75.77¢ per $1 |
| Gini / Inequality Index | 341 | 0.39 |
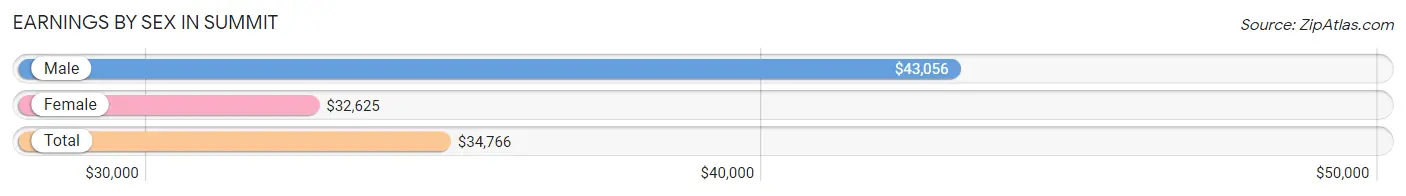
Earnings by Sex in Summit
Average Earnings in Summit are $34,766, $43,056 for men and $32,625 for women, a difference of 24.2%.
| Sex | Number | Average Earnings |
| Male | 110 (59.5%) | $43,056 |
| Female | 75 (40.5%) | $32,625 |
| Total | 185 (100.0%) | $34,766 |
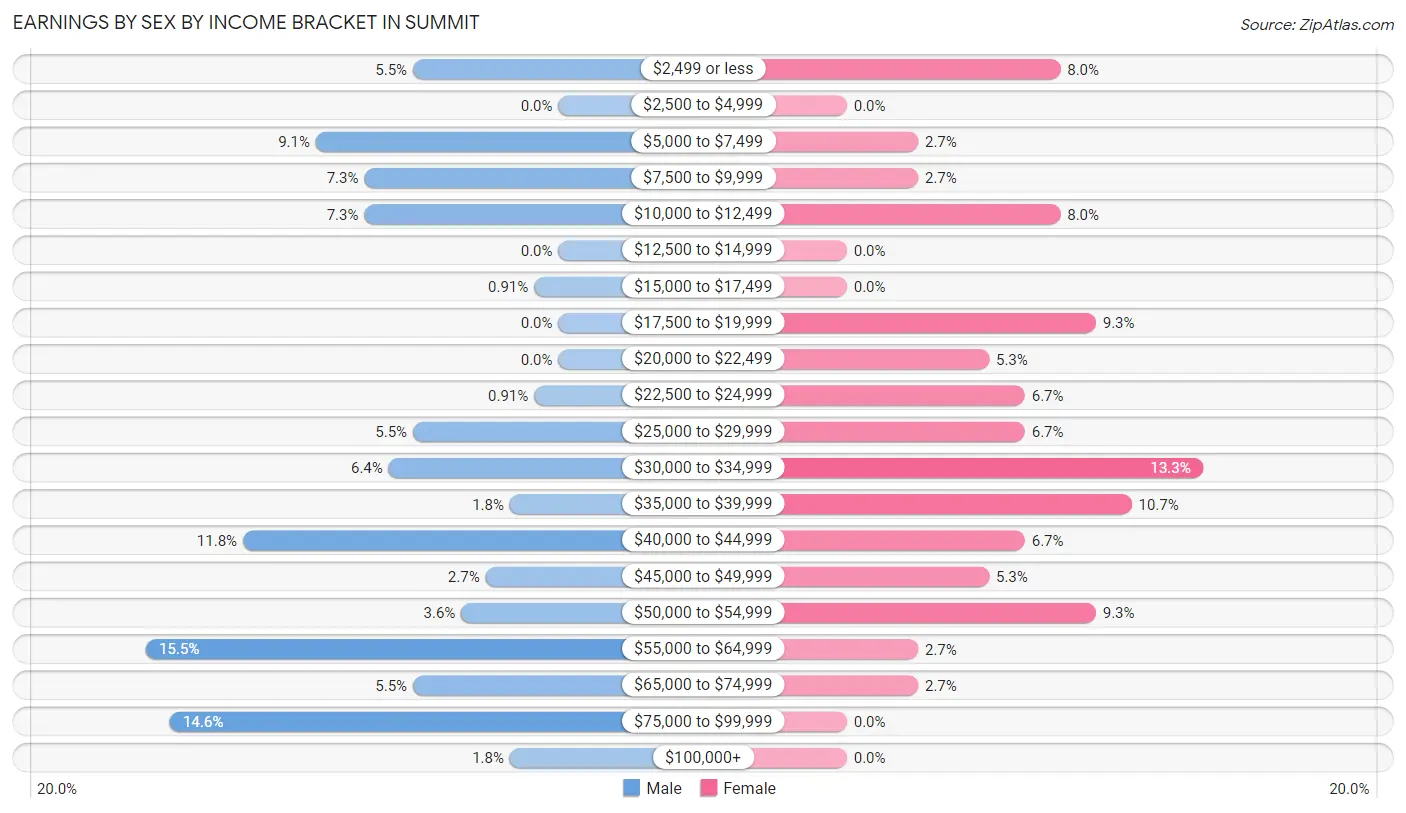
Earnings by Sex by Income Bracket in Summit
The most common earnings brackets in Summit are $55,000 to $64,999 for men (17 | 15.4%) and $30,000 to $34,999 for women (10 | 13.3%).
| Income | Male | Female |
| $2,499 or less | 6 (5.4%) | 6 (8.0%) |
| $2,500 to $4,999 | 0 (0.0%) | 0 (0.0%) |
| $5,000 to $7,499 | 10 (9.1%) | 2 (2.7%) |
| $7,500 to $9,999 | 8 (7.3%) | 2 (2.7%) |
| $10,000 to $12,499 | 8 (7.3%) | 6 (8.0%) |
| $12,500 to $14,999 | 0 (0.0%) | 0 (0.0%) |
| $15,000 to $17,499 | 1 (0.9%) | 0 (0.0%) |
| $17,500 to $19,999 | 0 (0.0%) | 7 (9.3%) |
| $20,000 to $22,499 | 0 (0.0%) | 4 (5.3%) |
| $22,500 to $24,999 | 1 (0.9%) | 5 (6.7%) |
| $25,000 to $29,999 | 6 (5.4%) | 5 (6.7%) |
| $30,000 to $34,999 | 7 (6.4%) | 10 (13.3%) |
| $35,000 to $39,999 | 2 (1.8%) | 8 (10.7%) |
| $40,000 to $44,999 | 13 (11.8%) | 5 (6.7%) |
| $45,000 to $49,999 | 3 (2.7%) | 4 (5.3%) |
| $50,000 to $54,999 | 4 (3.6%) | 7 (9.3%) |
| $55,000 to $64,999 | 17 (15.4%) | 2 (2.7%) |
| $65,000 to $74,999 | 6 (5.4%) | 2 (2.7%) |
| $75,000 to $99,999 | 16 (14.5%) | 0 (0.0%) |
| $100,000+ | 2 (1.8%) | 0 (0.0%) |
| Total | 110 (100.0%) | 75 (100.0%) |
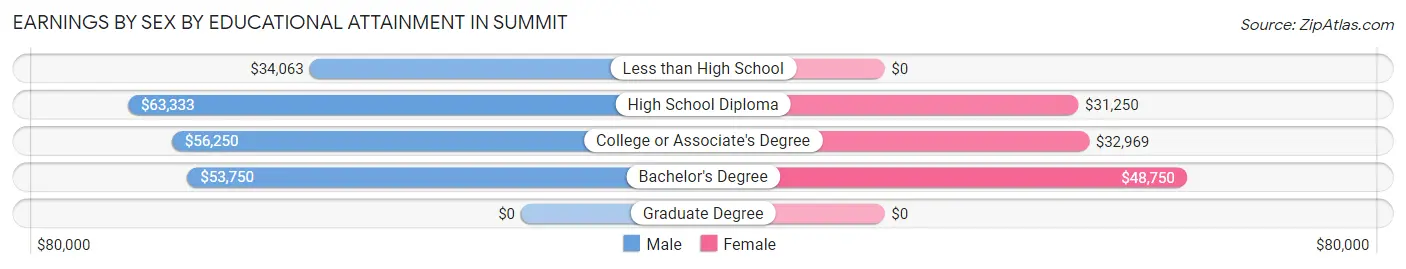
Earnings by Sex by Educational Attainment in Summit
Average earnings in Summit are $53,438 for men and $33,500 for women, a difference of 37.3%. Men with an educational attainment of high school diploma enjoy the highest average annual earnings of $63,333, while those with less than high school education earn the least with $34,063. Women with an educational attainment of bachelor's degree earn the most with the average annual earnings of $48,750, while those with high school diploma education have the smallest earnings of $31,250.
| Educational Attainment | Male Income | Female Income |
| Less than High School | $34,063 | $0 |
| High School Diploma | $63,333 | $31,250 |
| College or Associate's Degree | $56,250 | $32,969 |
| Bachelor's Degree | $53,750 | $48,750 |
| Graduate Degree | - | - |
| Total | $53,438 | $33,500 |
Family Income in Summit
Family Income Brackets in Summit
According to the Summit family income data, there are 24 families falling into the $100,000 to $149,999 income range, which is the most common income bracket and makes up 30.0% of all families.
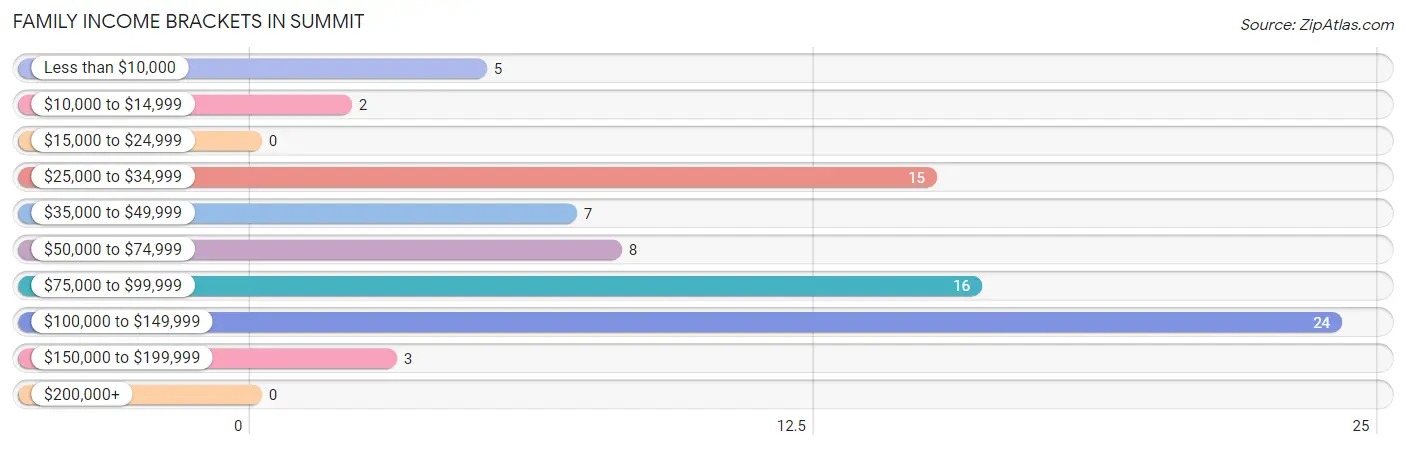
| Income Bracket | # Families | % Families |
| Less than $10,000 | 5 | 6.3% |
| $10,000 to $14,999 | 2 | 2.5% |
| $15,000 to $24,999 | 0 | 0.0% |
| $25,000 to $34,999 | 15 | 18.8% |
| $35,000 to $49,999 | 7 | 8.8% |
| $50,000 to $74,999 | 8 | 10.0% |
| $75,000 to $99,999 | 16 | 20.0% |
| $100,000 to $149,999 | 24 | 30.0% |
| $150,000 to $199,999 | 3 | 3.8% |
| $200,000+ | 0 | 0.0% |
Family Income by Famaliy Size in Summit
6-person families (7 | 8.7%) account for the highest median family income in Summit with $94,375 per family, while 2-person families (28 | 35.0%) have the highest median income of $39,375 per family member.
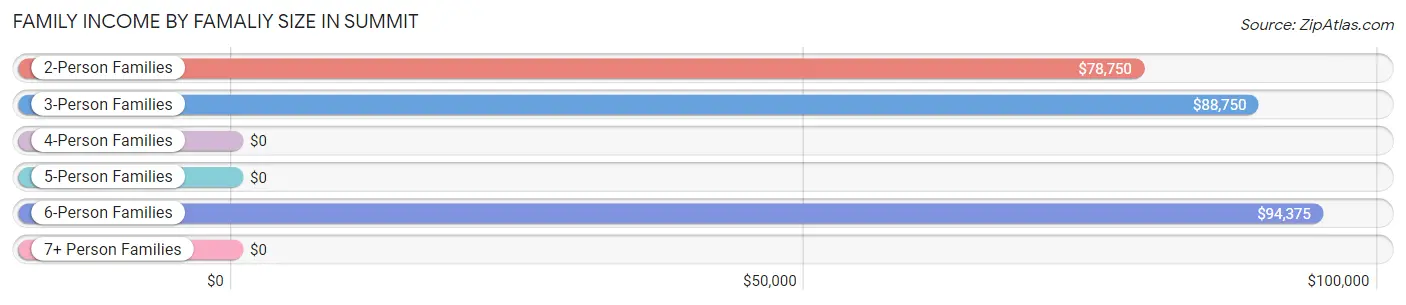
| Income Bracket | # Families | Median Income |
| 2-Person Families | 28 (35.0%) | $78,750 |
| 3-Person Families | 29 (36.2%) | $88,750 |
| 4-Person Families | 4 (5.0%) | $0 |
| 5-Person Families | 12 (15.0%) | $0 |
| 6-Person Families | 7 (8.7%) | $94,375 |
| 7+ Person Families | 0 (0.0%) | $0 |
| Total | 80 (100.0%) | $88,438 |
Family Income by Number of Earners in Summit
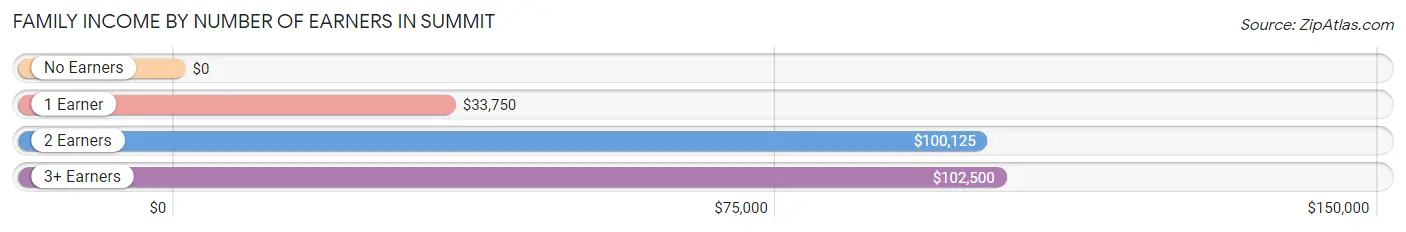
| Number of Earners | # Families | Median Income |
| No Earners | 6 (7.5%) | $0 |
| 1 Earner | 21 (26.3%) | $33,750 |
| 2 Earners | 39 (48.7%) | $100,125 |
| 3+ Earners | 14 (17.5%) | $102,500 |
| Total | 80 (100.0%) | $88,438 |
Household Income in Summit
Household Income Brackets in Summit
With 26 households falling in the category, the $100,000 to $149,999 income range is the most frequent in Summit, accounting for 22.4% of all households. In contrast, only 1 households (0.9%) fall into the $150,000 to $199,999 income bracket, making it the least populous group.
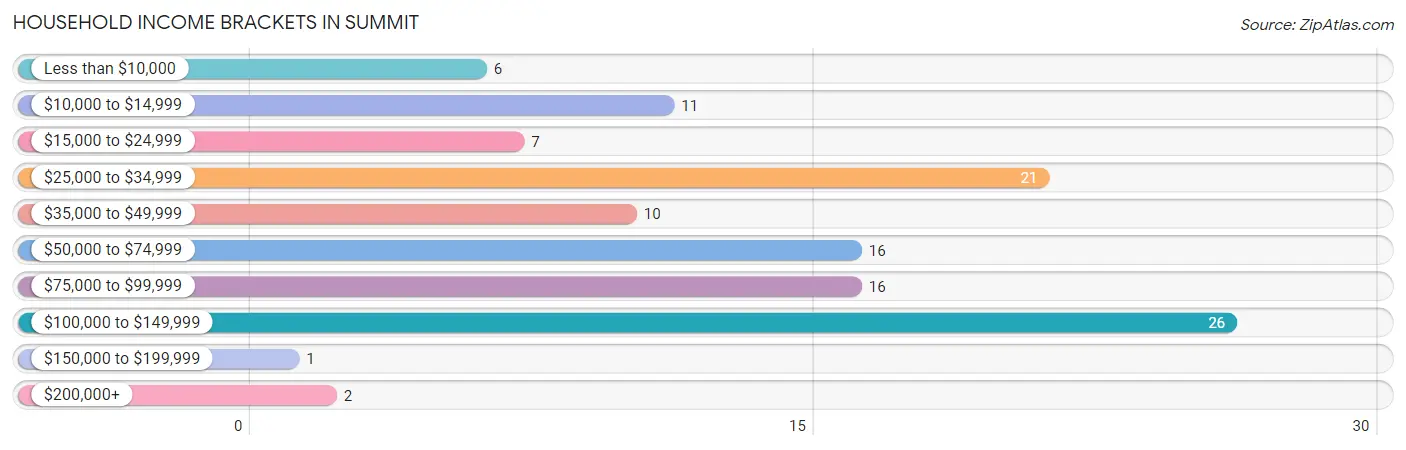
| Income Bracket | # Households | % Households |
| Less than $10,000 | 6 | 5.2% |
| $10,000 to $14,999 | 11 | 9.5% |
| $15,000 to $24,999 | 7 | 6.0% |
| $25,000 to $34,999 | 21 | 18.1% |
| $35,000 to $49,999 | 10 | 8.6% |
| $50,000 to $74,999 | 16 | 13.8% |
| $75,000 to $99,999 | 16 | 13.8% |
| $100,000 to $149,999 | 26 | 22.4% |
| $150,000 to $199,999 | 1 | 0.9% |
| $200,000+ | 2 | 1.7% |
Household Income by Householder Age in Summit
The median household income in Summit is $54,375, with the highest median household income of $101,250 found in the 45 to 64 years age bracket for the primary householder. A total of 40 households (34.5%) fall into this category. Meanwhile, the 15 to 24 years age bracket for the primary householder has the lowest median household income of $0, with 5 households (4.3%) in this group.
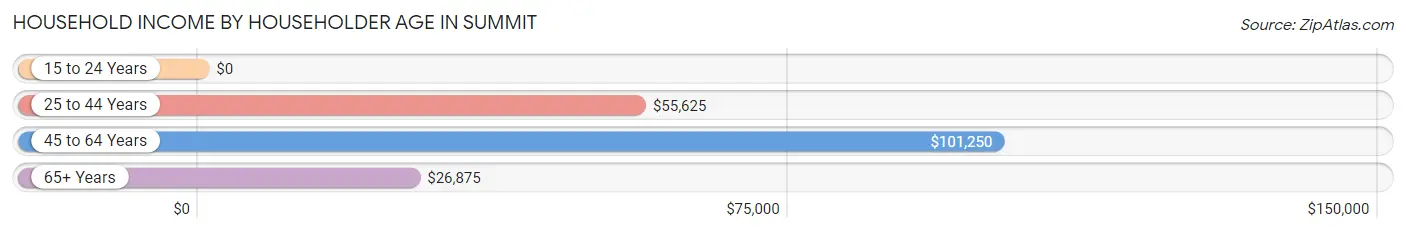
| Income Bracket | # Households | Median Income |
| 15 to 24 Years | 5 (4.3%) | $0 |
| 25 to 44 Years | 43 (37.1%) | $55,625 |
| 45 to 64 Years | 40 (34.5%) | $101,250 |
| 65+ Years | 28 (24.1%) | $26,875 |
| Total | 116 (100.0%) | $54,375 |
Poverty in Summit
Income Below Poverty by Sex and Age in Summit
With 21.4% poverty level for males and 22.1% for females among the residents of Summit, 16 and 17 year old males and 18 to 24 year old females are the most vulnerable to poverty, with 5 males (55.6%) and 12 females (70.6%) in their respective age groups living below the poverty level.
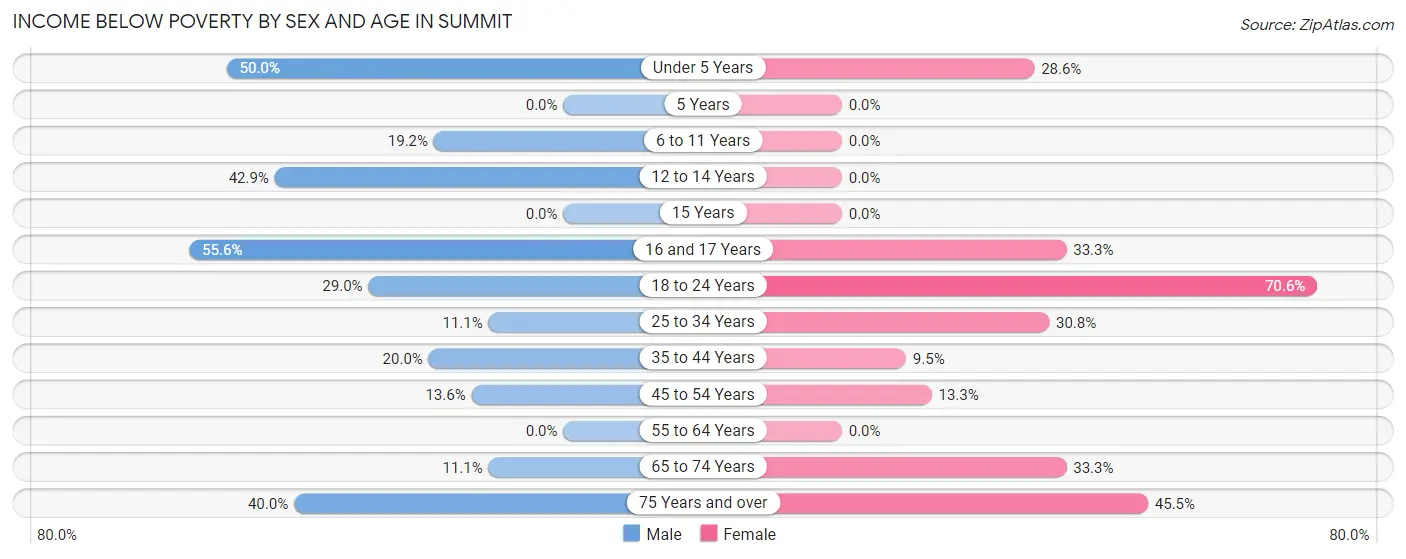
| Age Bracket | Male | Female |
| Under 5 Years | 4 (50.0%) | 4 (28.6%) |
| 5 Years | 0 (0.0%) | 0 (0.0%) |
| 6 to 11 Years | 5 (19.2%) | 0 (0.0%) |
| 12 to 14 Years | 3 (42.9%) | 0 (0.0%) |
| 15 Years | 0 (0.0%) | 0 (0.0%) |
| 16 and 17 Years | 5 (55.6%) | 2 (33.3%) |
| 18 to 24 Years | 11 (28.9%) | 12 (70.6%) |
| 25 to 34 Years | 2 (11.1%) | 4 (30.8%) |
| 35 to 44 Years | 4 (20.0%) | 2 (9.5%) |
| 45 to 54 Years | 3 (13.6%) | 2 (13.3%) |
| 55 to 64 Years | 0 (0.0%) | 0 (0.0%) |
| 65 to 74 Years | 1 (11.1%) | 3 (33.3%) |
| 75 Years and over | 2 (40.0%) | 5 (45.5%) |
| Total | 40 (21.4%) | 34 (22.1%) |
Income Above Poverty by Sex and Age in Summit
According to the poverty statistics in Summit, males aged 5 years and females aged 5 years are the age groups that are most secure financially, with 100.0% of males and 100.0% of females in these age groups living above the poverty line.
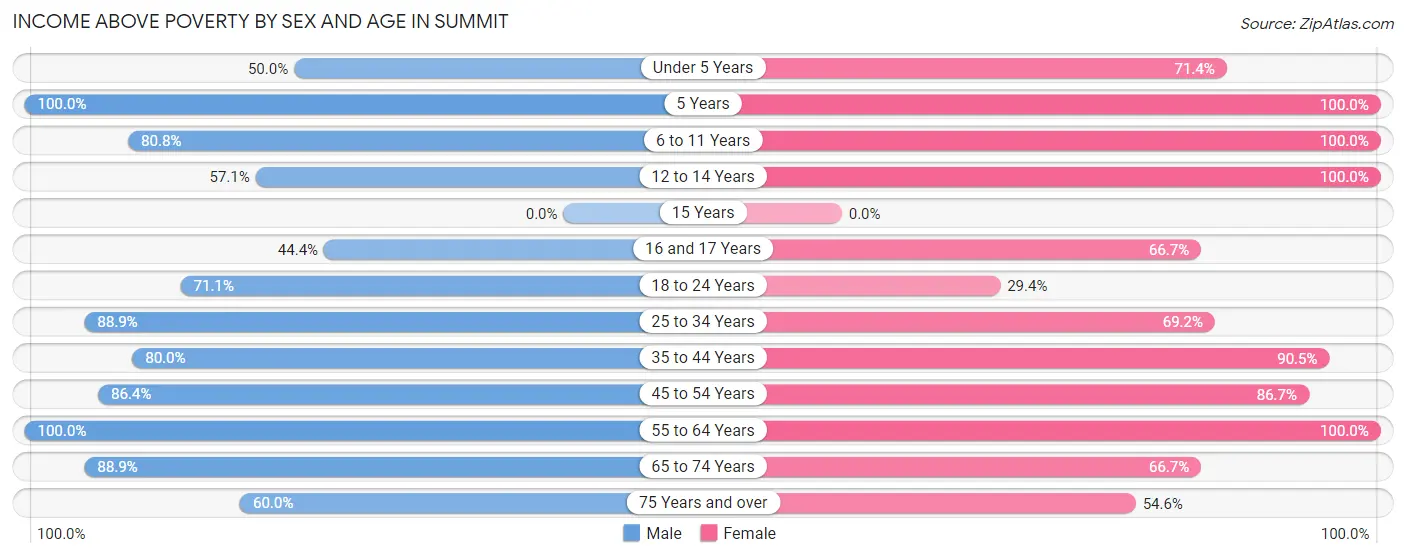
| Age Bracket | Male | Female |
| Under 5 Years | 4 (50.0%) | 10 (71.4%) |
| 5 Years | 3 (100.0%) | 4 (100.0%) |
| 6 to 11 Years | 21 (80.8%) | 18 (100.0%) |
| 12 to 14 Years | 4 (57.1%) | 7 (100.0%) |
| 15 Years | 0 (0.0%) | 0 (0.0%) |
| 16 and 17 Years | 4 (44.4%) | 4 (66.7%) |
| 18 to 24 Years | 27 (71.1%) | 5 (29.4%) |
| 25 to 34 Years | 16 (88.9%) | 9 (69.2%) |
| 35 to 44 Years | 16 (80.0%) | 19 (90.5%) |
| 45 to 54 Years | 19 (86.4%) | 13 (86.7%) |
| 55 to 64 Years | 22 (100.0%) | 19 (100.0%) |
| 65 to 74 Years | 8 (88.9%) | 6 (66.7%) |
| 75 Years and over | 3 (60.0%) | 6 (54.5%) |
| Total | 147 (78.6%) | 120 (77.9%) |
Income Below Poverty Among Married-Couple Families in Summit
The poverty statistics for married-couple families in Summit show that 11.9% or 7 of the total 59 families live below the poverty line. Families with 1 or 2 children have the highest poverty rate of 26.7%, comprising of 4 families. On the other hand, families with no children have the lowest poverty rate of 0.0%, which includes 0 families.
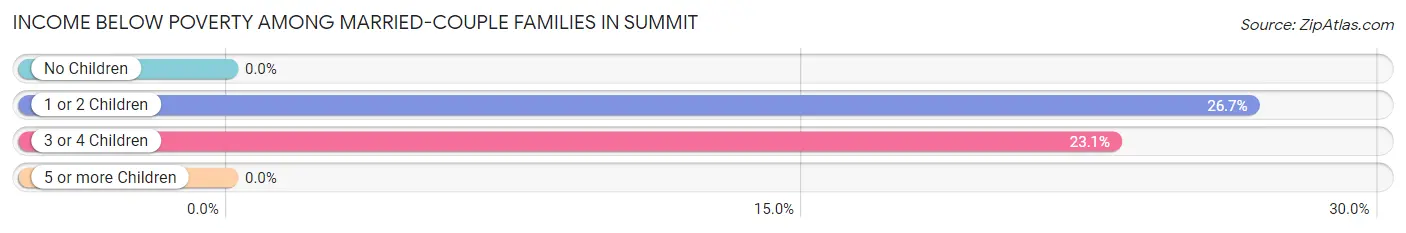
| Children | Above Poverty | Below Poverty |
| No Children | 31 (100.0%) | 0 (0.0%) |
| 1 or 2 Children | 11 (73.3%) | 4 (26.7%) |
| 3 or 4 Children | 10 (76.9%) | 3 (23.1%) |
| 5 or more Children | 0 (0.0%) | 0 (0.0%) |
| Total | 52 (88.1%) | 7 (11.9%) |
Income Below Poverty Among Single-Parent Households in Summit
According to the poverty data in Summit, 14.3% or 2 single-father households and 28.6% or 2 single-mother households are living below the poverty line. Among single-father households, those with 1 or 2 children have the highest poverty rate, with 2 households (14.3%) experiencing poverty. Likewise, among single-mother households, those with 1 or 2 children have the highest poverty rate, with 2 households (66.7%) falling below the poverty line.
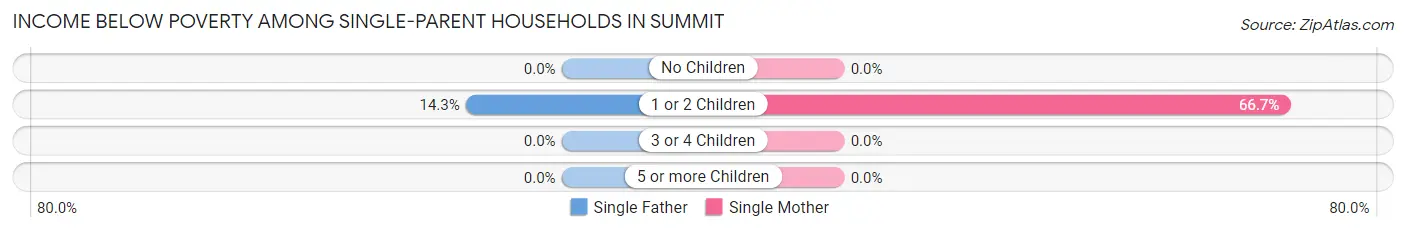
| Children | Single Father | Single Mother |
| No Children | 0 (0.0%) | 0 (0.0%) |
| 1 or 2 Children | 2 (14.3%) | 2 (66.7%) |
| 3 or 4 Children | 0 (0.0%) | 0 (0.0%) |
| 5 or more Children | 0 (0.0%) | 0 (0.0%) |
| Total | 2 (14.3%) | 2 (28.6%) |
Income Below Poverty Among Married-Couple vs Single-Parent Households in Summit
The poverty data for Summit shows that 7 of the married-couple family households (11.9%) and 4 of the single-parent households (19.1%) are living below the poverty level. Within the married-couple family households, those with 1 or 2 children have the highest poverty rate, with 4 households (26.7%) falling below the poverty line. Among the single-parent households, those with 1 or 2 children have the highest poverty rate, with 4 household (23.5%) living below poverty.
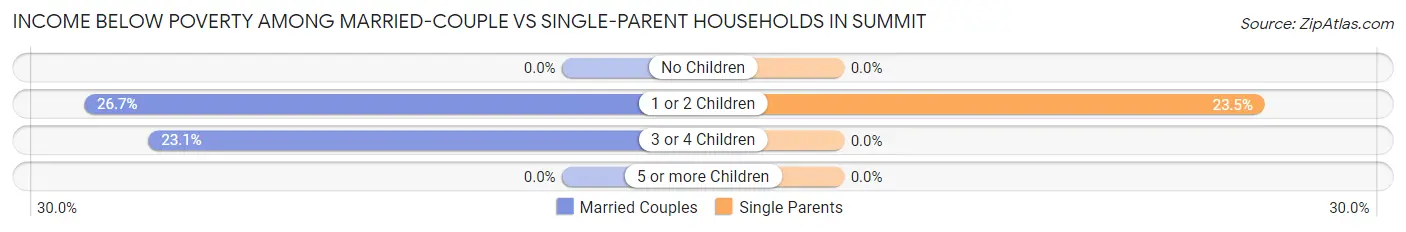
| Children | Married-Couple Families | Single-Parent Households |
| No Children | 0 (0.0%) | 0 (0.0%) |
| 1 or 2 Children | 4 (26.7%) | 4 (23.5%) |
| 3 or 4 Children | 3 (23.1%) | 0 (0.0%) |
| 5 or more Children | 0 (0.0%) | 0 (0.0%) |
| Total | 7 (11.9%) | 4 (19.1%) |
Race in Summit
The most populous races in Summit are White / Caucasian (232 | 68.0%), Native / Alaskan (83 | 24.3%), and Two or more Races (17 | 5.0%).
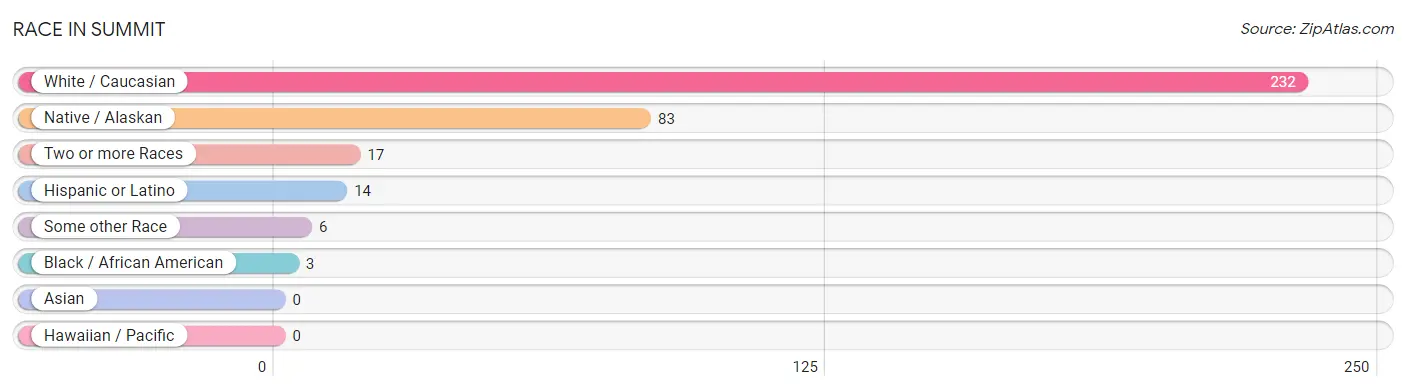
| Race | # Population | % Population |
| Asian | 0 | 0.0% |
| Black / African American | 3 | 0.9% |
| Hawaiian / Pacific | 0 | 0.0% |
| Hispanic or Latino | 14 | 4.1% |
| Native / Alaskan | 83 | 24.3% |
| White / Caucasian | 232 | 68.0% |
| Two or more Races | 17 | 5.0% |
| Some other Race | 6 | 1.8% |
| Total | 341 | 100.0% |
Ancestry in Summit
The most populous ancestries reported in Summit are German (180 | 52.8%), Sioux (76 | 22.3%), Norwegian (32 | 9.4%), Irish (24 | 7.0%), and Polish (21 | 6.2%), together accounting for 97.7% of all Summit residents.
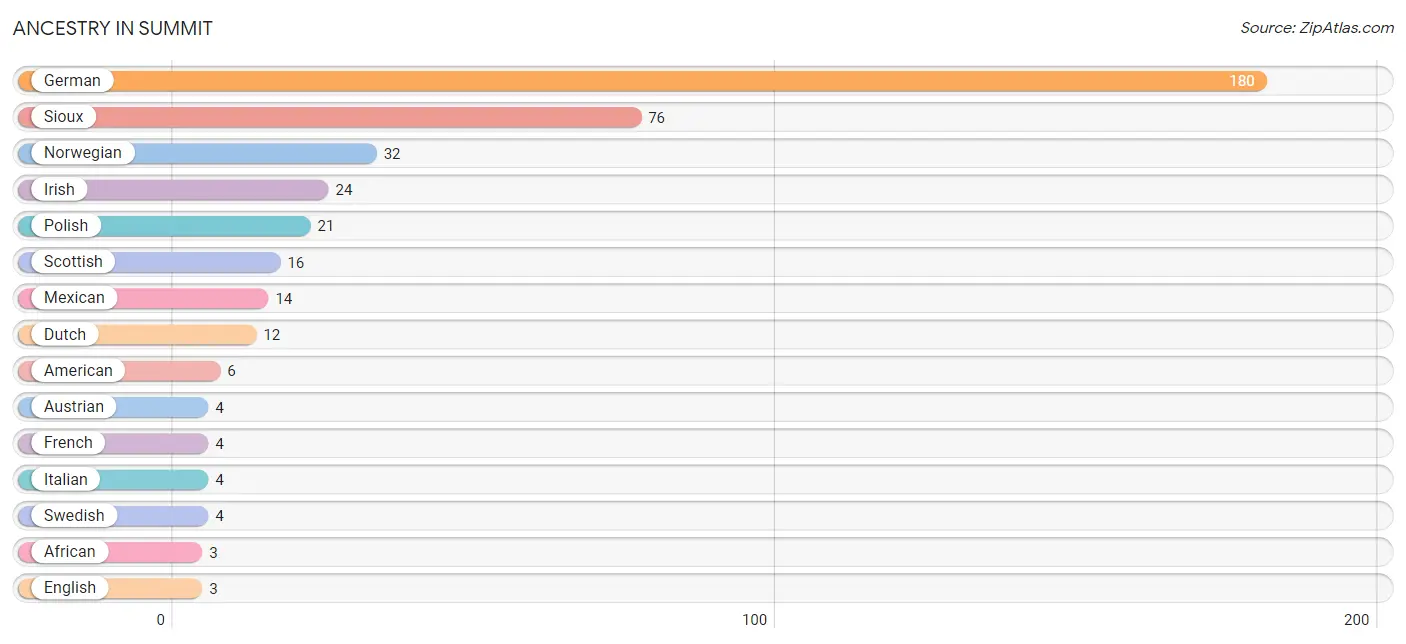
| Ancestry | # Population | % Population |
| African | 3 | 0.9% |
| American | 6 | 1.8% |
| Austrian | 4 | 1.2% |
| Danish | 2 | 0.6% |
| Dutch | 12 | 3.5% |
| English | 3 | 0.9% |
| French | 4 | 1.2% |
| German | 180 | 52.8% |
| Irish | 24 | 7.0% |
| Italian | 4 | 1.2% |
| Korean | 2 | 0.6% |
| Mexican | 14 | 4.1% |
| Norwegian | 32 | 9.4% |
| Polish | 21 | 6.2% |
| Puget Sound Salish | 2 | 0.6% |
| Russian | 1 | 0.3% |
| Scottish | 16 | 4.7% |
| Sioux | 76 | 22.3% |
| Subsaharan African | 3 | 0.9% |
| Swedish | 4 | 1.2% | View All 20 Rows |
Immigrants in Summit

| Immigration Origin | # Population | % Population | View All 0 Rows |
Sex and Age in Summit
Sex and Age in Summit
The most populous age groups in Summit are 5 to 9 Years (24 | 12.8%) for men and 15 to 19 Years (18 | 11.7%) for women.
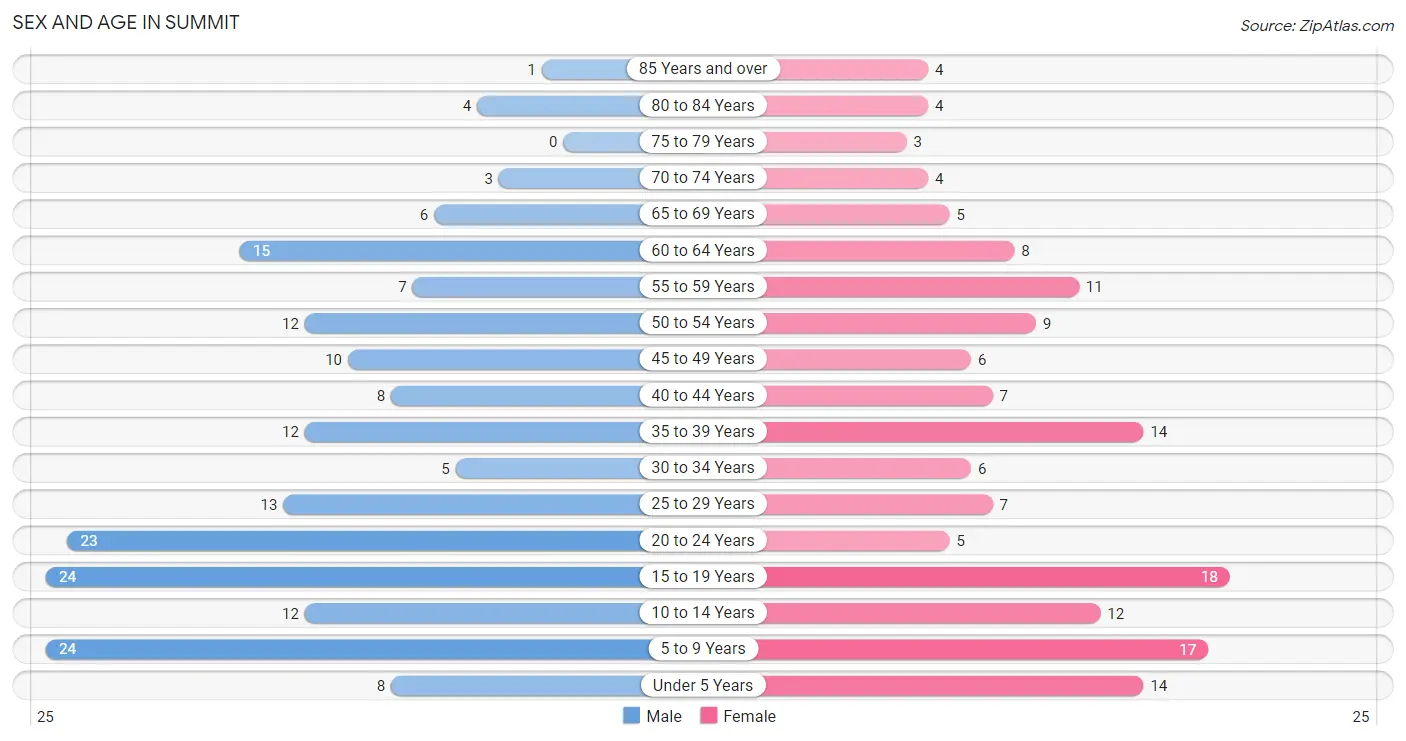
| Age Bracket | Male | Female |
| Under 5 Years | 8 (4.3%) | 14 (9.1%) |
| 5 to 9 Years | 24 (12.8%) | 17 (11.0%) |
| 10 to 14 Years | 12 (6.4%) | 12 (7.8%) |
| 15 to 19 Years | 24 (12.8%) | 18 (11.7%) |
| 20 to 24 Years | 23 (12.3%) | 5 (3.3%) |
| 25 to 29 Years | 13 (7.0%) | 7 (4.5%) |
| 30 to 34 Years | 5 (2.7%) | 6 (3.9%) |
| 35 to 39 Years | 12 (6.4%) | 14 (9.1%) |
| 40 to 44 Years | 8 (4.3%) | 7 (4.5%) |
| 45 to 49 Years | 10 (5.3%) | 6 (3.9%) |
| 50 to 54 Years | 12 (6.4%) | 9 (5.8%) |
| 55 to 59 Years | 7 (3.7%) | 11 (7.1%) |
| 60 to 64 Years | 15 (8.0%) | 8 (5.2%) |
| 65 to 69 Years | 6 (3.2%) | 5 (3.3%) |
| 70 to 74 Years | 3 (1.6%) | 4 (2.6%) |
| 75 to 79 Years | 0 (0.0%) | 3 (1.9%) |
| 80 to 84 Years | 4 (2.1%) | 4 (2.6%) |
| 85 Years and over | 1 (0.5%) | 4 (2.6%) |
| Total | 187 (100.0%) | 154 (100.0%) |
Families and Households in Summit
Median Family Size in Summit
The median family size in Summit is 3.64 persons per family, with single female/mother families (7 | 8.7%) accounting for the largest median family size of 5.57 persons per family. On the other hand, single male/father families (14 | 17.5%) represent the smallest median family size with 3.07 persons per family.
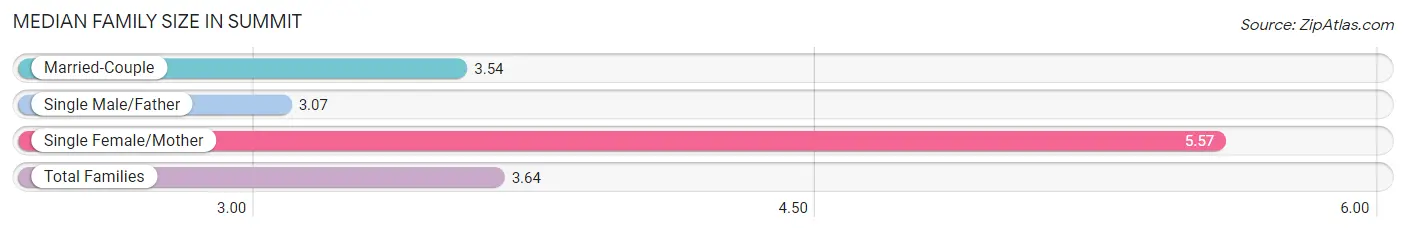
| Family Type | # Families | Family Size |
| Married-Couple | 59 (73.8%) | 3.54 |
| Single Male/Father | 14 (17.5%) | 3.07 |
| Single Female/Mother | 7 (8.7%) | 5.57 |
| Total Families | 80 (100.0%) | 3.64 |
Median Household Size in Summit
The median household size in Summit is 2.94 persons per household, with single female/mother households (7 | 6.0%) accounting for the largest median household size of 6.29 persons per household. non-family households (36 | 31.0%) represent the smallest median household size with 1.08 persons per household.
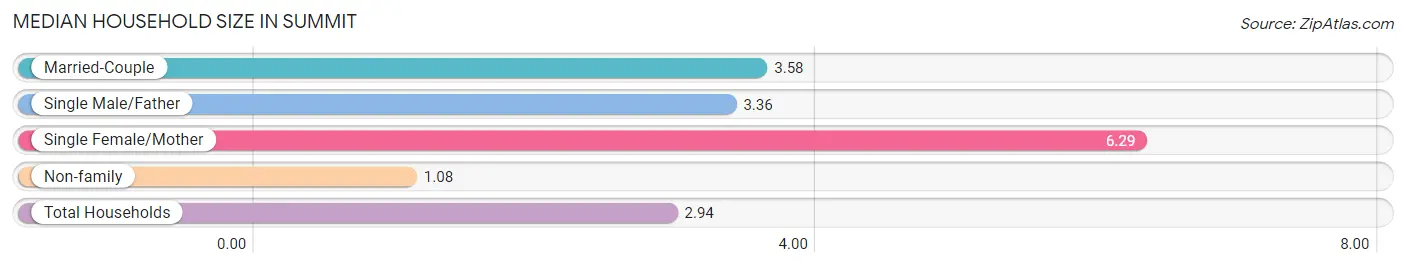
| Household Type | # Households | Household Size |
| Married-Couple | 59 (50.9%) | 3.58 |
| Single Male/Father | 14 (12.1%) | 3.36 |
| Single Female/Mother | 7 (6.0%) | 6.29 |
| Non-family | 36 (31.0%) | 1.08 |
| Total Households | 116 (100.0%) | 2.94 |
Household Size by Marriage Status in Summit
Out of a total of 116 households in Summit, 80 (69.0%) are family households, while 36 (31.0%) are nonfamily households. The most numerous type of family households are 3-person households, comprising 29, and the most common type of nonfamily households are 1-person households, comprising 34.
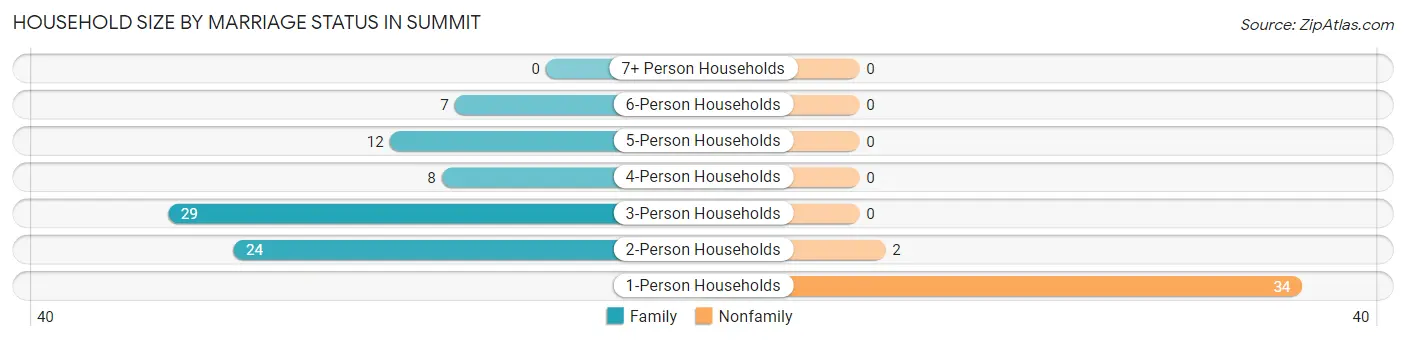
| Household Size | Family Households | Nonfamily Households |
| 1-Person Households | - | 34 (29.3%) |
| 2-Person Households | 24 (20.7%) | 2 (1.7%) |
| 3-Person Households | 29 (25.0%) | 0 (0.0%) |
| 4-Person Households | 8 (6.9%) | 0 (0.0%) |
| 5-Person Households | 12 (10.3%) | 0 (0.0%) |
| 6-Person Households | 7 (6.0%) | 0 (0.0%) |
| 7+ Person Households | 0 (0.0%) | 0 (0.0%) |
| Total | 80 (69.0%) | 36 (31.0%) |
Female Fertility in Summit
Fertility by Age in Summit
Average fertility rate in Summit is 45.0 births per 1,000 women. Women in the age bracket of 20 to 34 years have the highest fertility rate with 167.0 births per 1,000 women. Women in the age bracket of 20 to 34 years acount for 100.0% of all women with births.
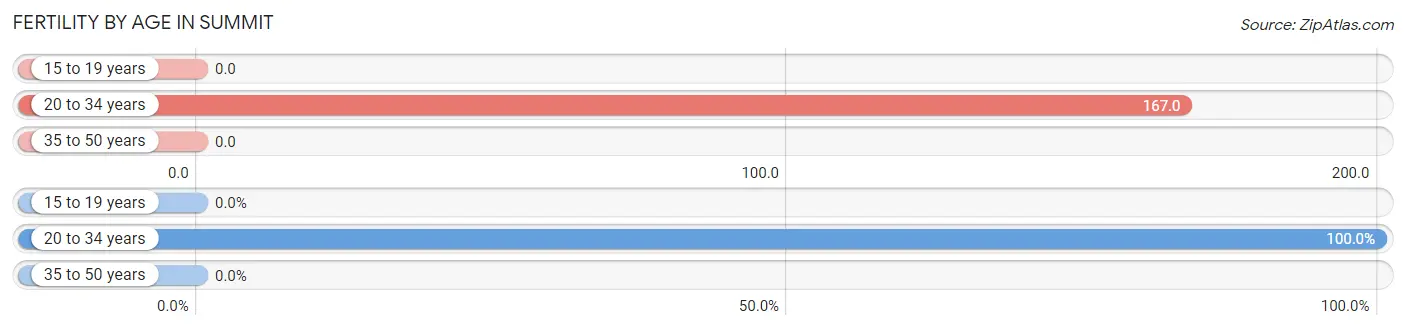
| Age Bracket | Women with Births | Births / 1,000 Women |
| 15 to 19 years | 0 (0.0%) | 0.0 |
| 20 to 34 years | 3 (100.0%) | 167.0 |
| 35 to 50 years | 0 (0.0%) | 0.0 |
| Total | 3 (100.0%) | 45.0 |
Fertility by Age by Marriage Status in Summit
33.3% of women with births (3) in Summit are married. The highest percentage of unmarried women with births falls into 20 to 34 years age bracket with 66.7% of them unmarried at the time of birth, while the lowest percentage of unmarried women with births belong to 20 to 34 years age bracket with 66.7% of them unmarried.
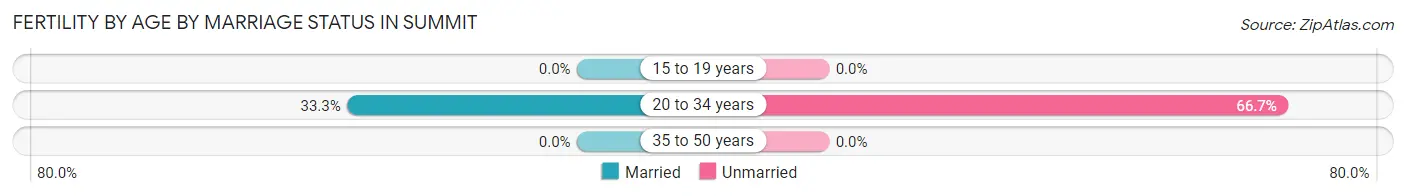
| Age Bracket | Married | Unmarried |
| 15 to 19 years | 0 (0.0%) | 0 (0.0%) |
| 20 to 34 years | 1 (33.3%) | 2 (66.7%) |
| 35 to 50 years | 0 (0.0%) | 0 (0.0%) |
| Total | 1 (33.3%) | 2 (66.7%) |
Fertility by Education in Summit
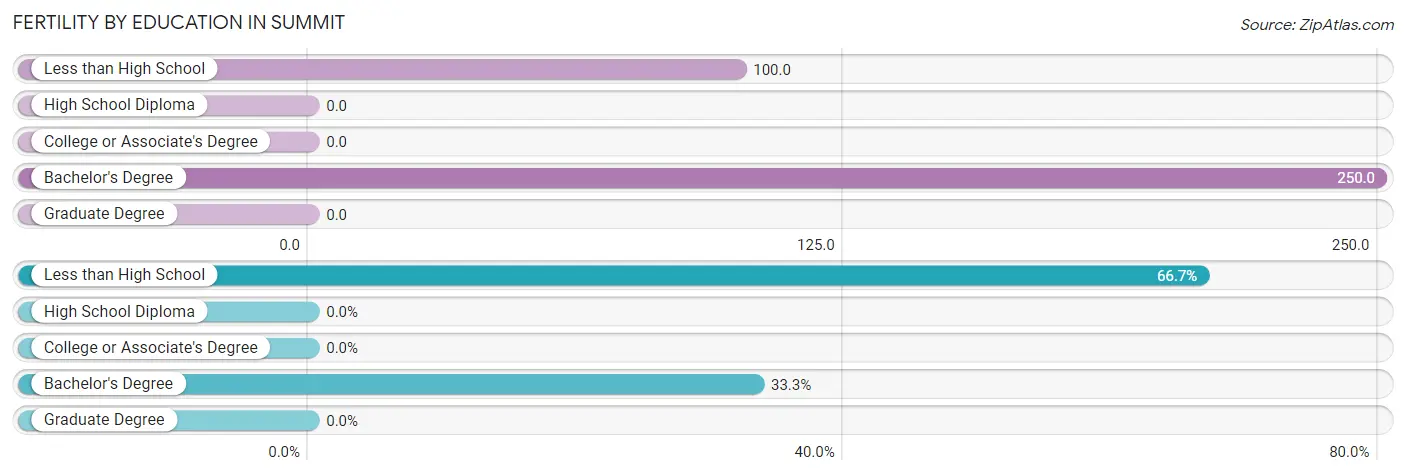
| Educational Attainment | Women with Births | Births / 1,000 Women |
| Less than High School | 2 (66.7%) | 100.0 |
| High School Diploma | 0 (0.0%) | 0.0 |
| College or Associate's Degree | 0 (0.0%) | 0.0 |
| Bachelor's Degree | 1 (33.3%) | 250.0 |
| Graduate Degree | 0 (0.0%) | 0.0 |
| Total | 3 (100.0%) | 45.0 |
Fertility by Education by Marriage Status in Summit
66.7% of women with births in Summit are unmarried. Women with the educational attainment of bachelor's degree are most likely to be married with 100.0% of them married at childbirth, while women with the educational attainment of less than high school are least likely to be married with 100.0% of them unmarried at childbirth.
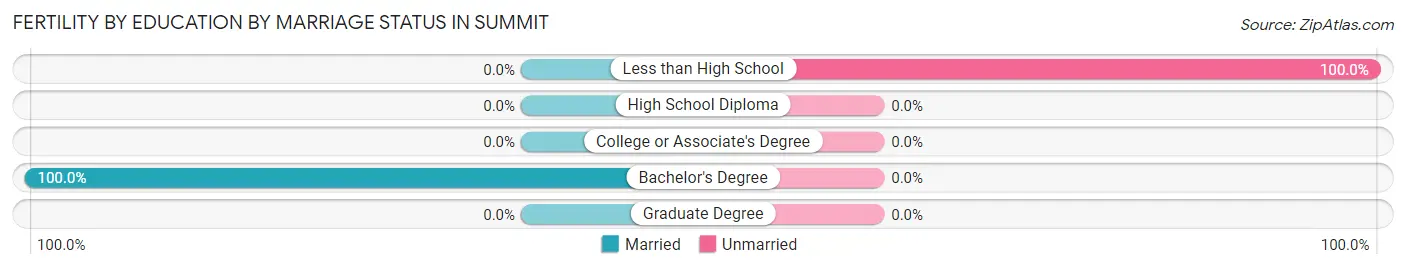
| Educational Attainment | Married | Unmarried |
| Less than High School | 0 (0.0%) | 2 (100.0%) |
| High School Diploma | 0 (0.0%) | 0 (0.0%) |
| College or Associate's Degree | 0 (0.0%) | 0 (0.0%) |
| Bachelor's Degree | 1 (100.0%) | 0 (0.0%) |
| Graduate Degree | 0 (0.0%) | 0 (0.0%) |
| Total | 1 (33.3%) | 2 (66.7%) |
Employment Characteristics in Summit
Employment by Class of Employer in Summit
Among the 161 employed individuals in Summit, private company employees (93 | 57.8%), state government employees (18 | 11.2%), and federal government employees (15 | 9.3%) make up the most common classes of employment.
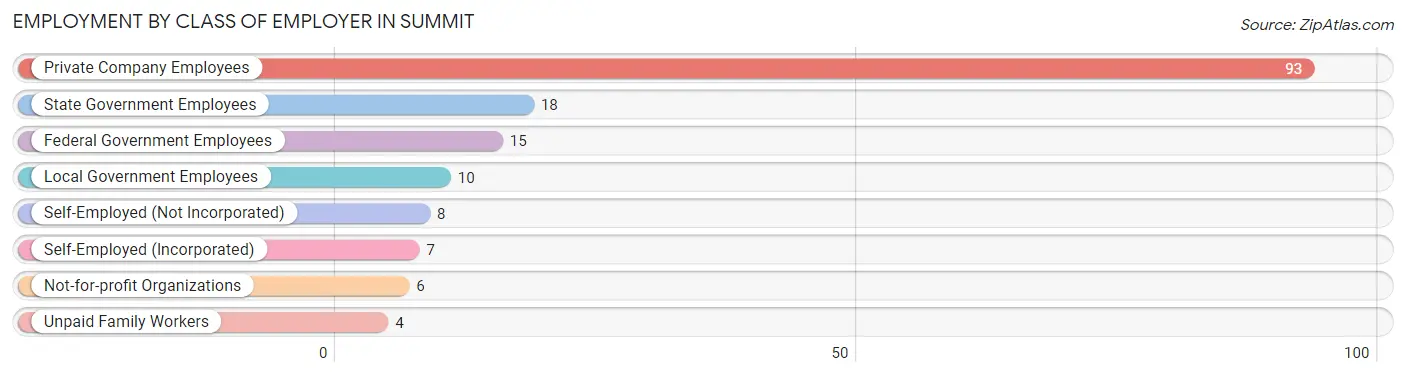
| Employer Class | # Employees | % Employees |
| Private Company Employees | 93 | 57.8% |
| Self-Employed (Incorporated) | 7 | 4.3% |
| Self-Employed (Not Incorporated) | 8 | 5.0% |
| Not-for-profit Organizations | 6 | 3.7% |
| Local Government Employees | 10 | 6.2% |
| State Government Employees | 18 | 11.2% |
| Federal Government Employees | 15 | 9.3% |
| Unpaid Family Workers | 4 | 2.5% |
| Total | 161 | 100.0% |
Employment Status by Age in Summit
According to the labor force statistics for Summit, out of the total population over 16 years of age (254), 68.1% or 173 individuals are in the labor force, with 6.4% or 11 of them unemployed. The age group with the highest labor force participation rate is 35 to 44 years, with 90.2% or 37 individuals in the labor force. Within the labor force, the 20 to 24 years age range has the highest percentage of unemployed individuals, with 26.3% or 5 of them being unemployed.
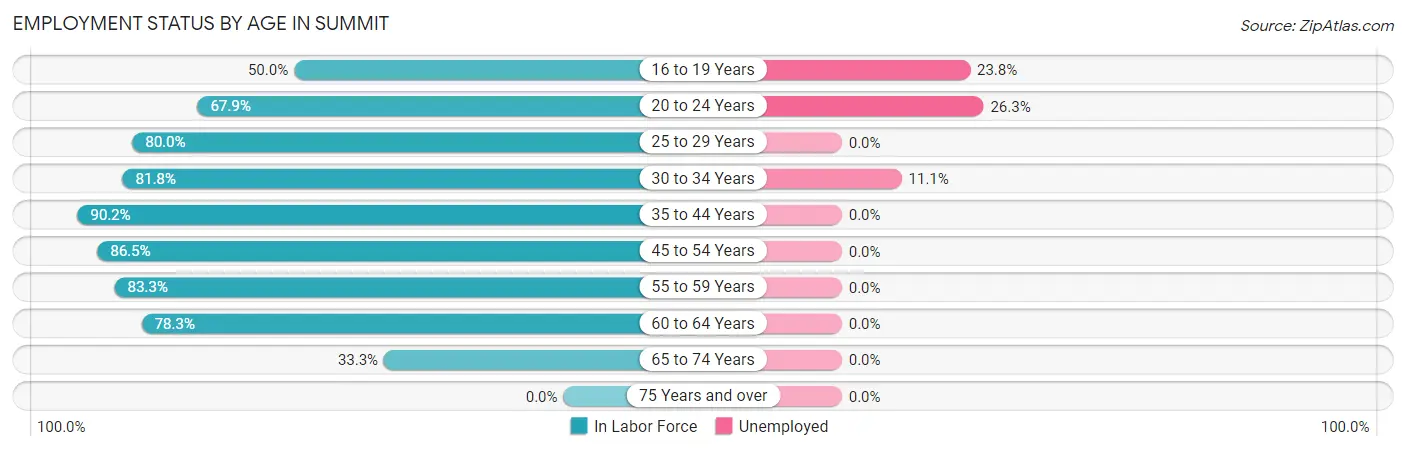
| Age Bracket | In Labor Force | Unemployed |
| 16 to 19 Years | 21 (50.0%) | 5 (23.8%) |
| 20 to 24 Years | 19 (67.9%) | 5 (26.3%) |
| 25 to 29 Years | 16 (80.0%) | 0 (0.0%) |
| 30 to 34 Years | 9 (81.8%) | 1 (11.1%) |
| 35 to 44 Years | 37 (90.2%) | 0 (0.0%) |
| 45 to 54 Years | 32 (86.5%) | 0 (0.0%) |
| 55 to 59 Years | 15 (83.3%) | 0 (0.0%) |
| 60 to 64 Years | 18 (78.3%) | 0 (0.0%) |
| 65 to 74 Years | 6 (33.3%) | 0 (0.0%) |
| 75 Years and over | 0 (0.0%) | 0 (0.0%) |
| Total | 173 (68.1%) | 11 (6.4%) |
Employment Status by Educational Attainment in Summit
According to labor force statistics for Summit, 84.7% of individuals (127) out of the total population between 25 and 64 years of age (150) are in the labor force, with 0.8% or 1 of them being unemployed. The group with the highest labor force participation rate are those with the educational attainment of high school diploma, with 89.5% or 51 individuals in the labor force. Within the labor force, individuals with high school diploma education have the highest percentage of unemployment, with 2.0% or 1 of them being unemployed.
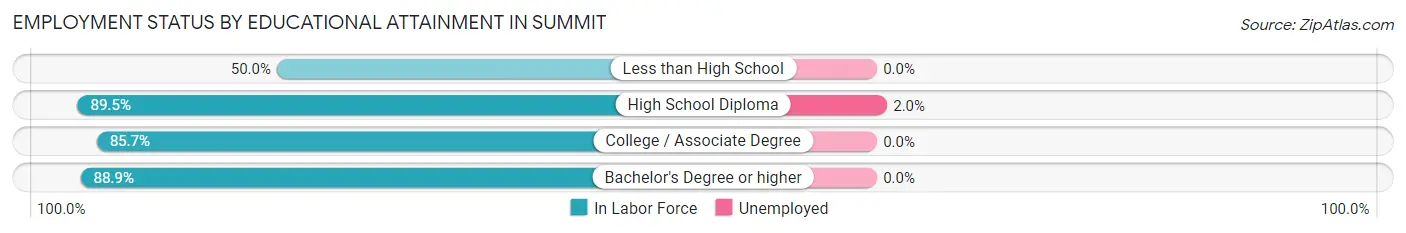
| Educational Attainment | In Labor Force | Unemployed |
| Less than High School | 6 (50.0%) | 0 (0.0%) |
| High School Diploma | 51 (89.5%) | 1 (2.0%) |
| College / Associate Degree | 54 (85.7%) | 0 (0.0%) |
| Bachelor's Degree or higher | 16 (88.9%) | 0 (0.0%) |
| Total | 127 (84.7%) | 1 (0.8%) |
Employment Occupations by Sex in Summit
Management, Business, Science and Arts Occupations
The most common Management, Business, Science and Arts occupations in Summit are Management (22 | 13.6%), Community & Social Service (19 | 11.7%), Education Instruction & Library (19 | 11.7%), Business & Financial (7 | 4.3%), and Computers, Engineering & Science (4 | 2.5%).
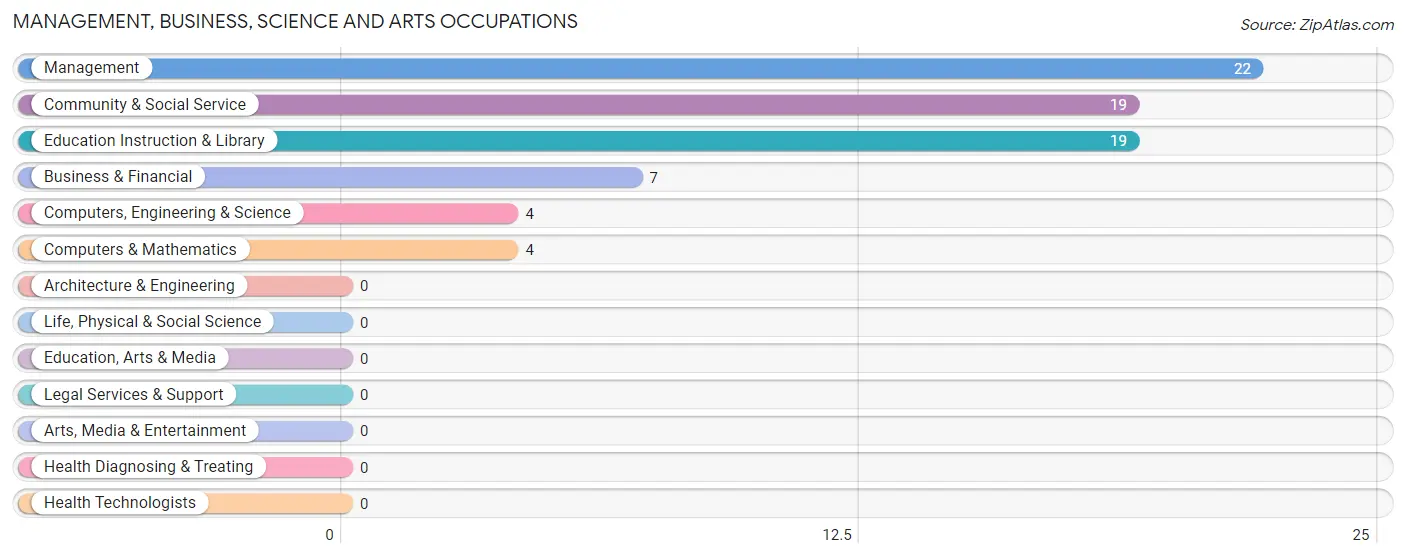
Management, Business, Science and Arts Occupations by Sex
Within the Management, Business, Science and Arts occupations in Summit, the most male-oriented occupations are Computers, Engineering & Science (100.0%), Computers & Mathematics (100.0%), and Management (90.9%), while the most female-oriented occupations are Community & Social Service (78.9%), Education Instruction & Library (78.9%), and Business & Financial (71.4%).
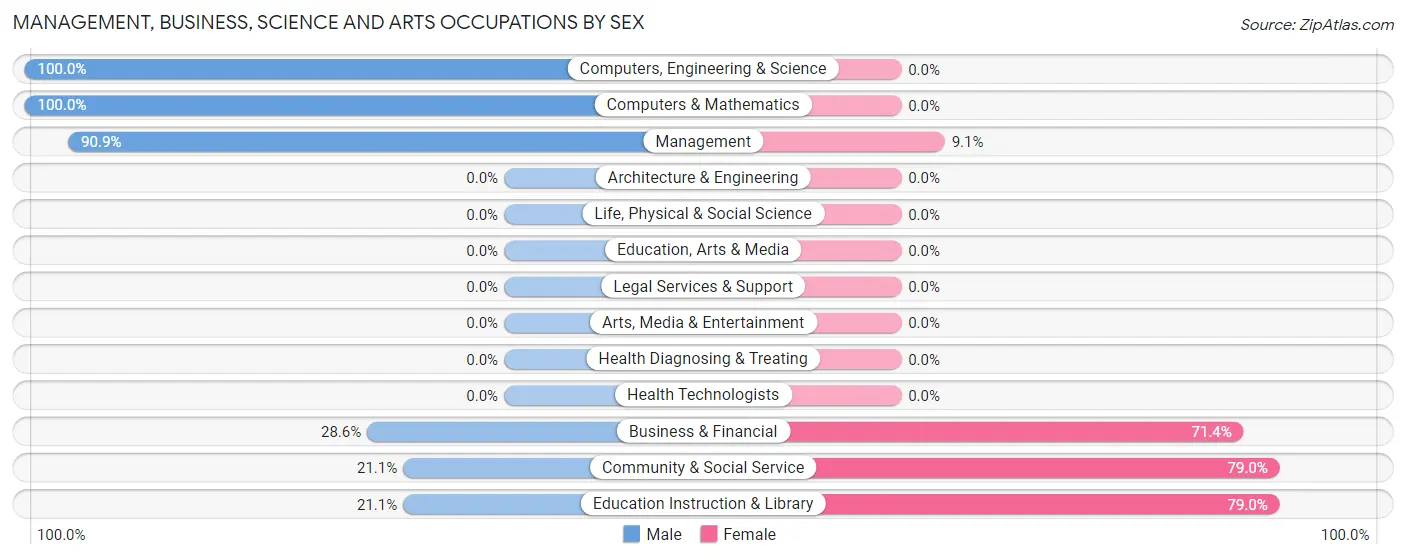
| Occupation | Male | Female |
| Management | 20 (90.9%) | 2 (9.1%) |
| Business & Financial | 2 (28.6%) | 5 (71.4%) |
| Computers, Engineering & Science | 4 (100.0%) | 0 (0.0%) |
| Computers & Mathematics | 4 (100.0%) | 0 (0.0%) |
| Architecture & Engineering | 0 (0.0%) | 0 (0.0%) |
| Life, Physical & Social Science | 0 (0.0%) | 0 (0.0%) |
| Community & Social Service | 4 (21.0%) | 15 (78.9%) |
| Education, Arts & Media | 0 (0.0%) | 0 (0.0%) |
| Legal Services & Support | 0 (0.0%) | 0 (0.0%) |
| Education Instruction & Library | 4 (21.0%) | 15 (78.9%) |
| Arts, Media & Entertainment | 0 (0.0%) | 0 (0.0%) |
| Health Diagnosing & Treating | 0 (0.0%) | 0 (0.0%) |
| Health Technologists | 0 (0.0%) | 0 (0.0%) |
| Total (Category) | 30 (57.7%) | 22 (42.3%) |
| Total (Overall) | 95 (58.6%) | 67 (41.4%) |
Services Occupations
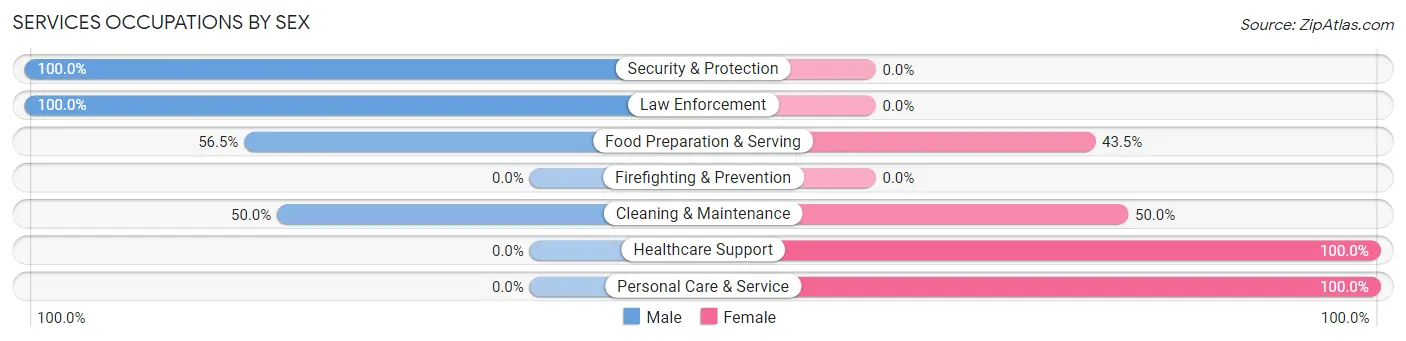
The most common Services occupations in Summit are Food Preparation & Serving (23 | 14.2%), Cleaning & Maintenance (6 | 3.7%), Personal Care & Service (5 | 3.1%), Healthcare Support (2 | 1.2%), and Security & Protection (1 | 0.6%).

Services Occupations by Sex
Within the Services occupations in Summit, the most male-oriented occupations are Security & Protection (100.0%), Law Enforcement (100.0%), and Food Preparation & Serving (56.5%), while the most female-oriented occupations are Healthcare Support (100.0%), Personal Care & Service (100.0%), and Cleaning & Maintenance (50.0%).
| Occupation | Male | Female |
| Healthcare Support | 0 (0.0%) | 2 (100.0%) |
| Security & Protection | 1 (100.0%) | 0 (0.0%) |
| Firefighting & Prevention | 0 (0.0%) | 0 (0.0%) |
| Law Enforcement | 1 (100.0%) | 0 (0.0%) |
| Food Preparation & Serving | 13 (56.5%) | 10 (43.5%) |
| Cleaning & Maintenance | 3 (50.0%) | 3 (50.0%) |
| Personal Care & Service | 0 (0.0%) | 5 (100.0%) |
| Total (Category) | 17 (46.0%) | 20 (54.0%) |
| Total (Overall) | 95 (58.6%) | 67 (41.4%) |
Sales and Office Occupations
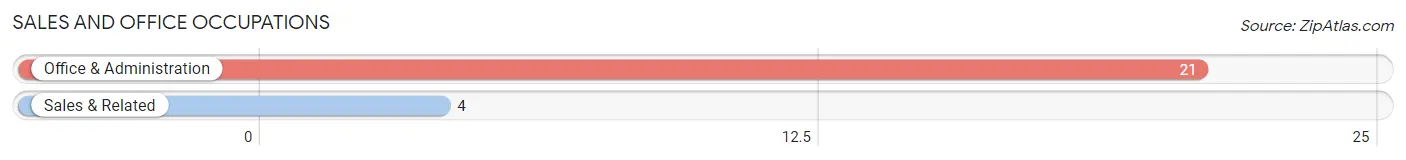
The most common Sales and Office occupations in Summit are Office & Administration (21 | 13.0%), and Sales & Related (4 | 2.5%).
Sales and Office Occupations by Sex
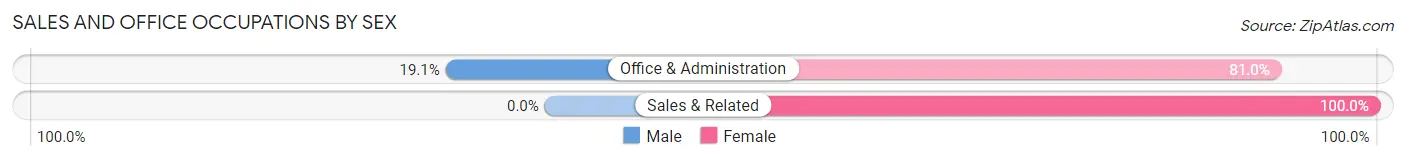
| Occupation | Male | Female |
| Sales & Related | 0 (0.0%) | 4 (100.0%) |
| Office & Administration | 4 (19.1%) | 17 (80.9%) |
| Total (Category) | 4 (16.0%) | 21 (84.0%) |
| Total (Overall) | 95 (58.6%) | 67 (41.4%) |
Natural Resources, Construction and Maintenance Occupations
The most common Natural Resources, Construction and Maintenance occupations in Summit are Construction & Extraction (12 | 7.4%), and Installation, Maintenance & Repair (7 | 4.3%).
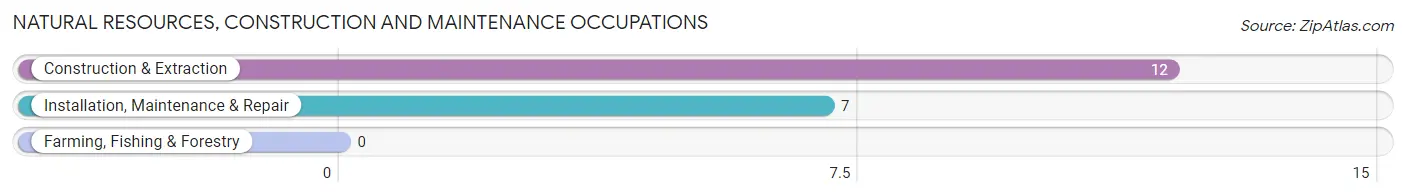
Natural Resources, Construction and Maintenance Occupations by Sex
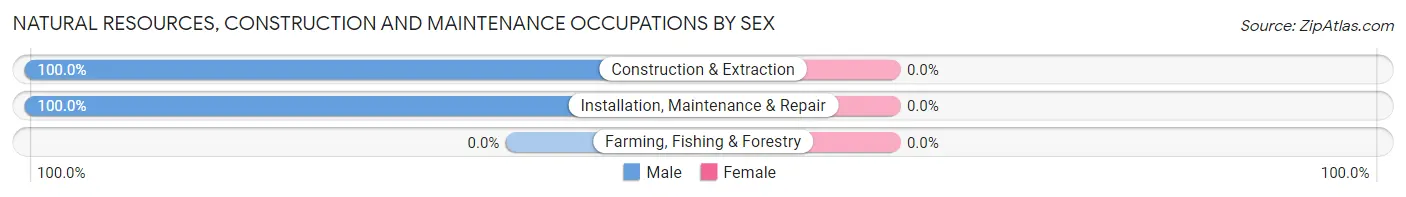
| Occupation | Male | Female |
| Farming, Fishing & Forestry | 0 (0.0%) | 0 (0.0%) |
| Construction & Extraction | 12 (100.0%) | 0 (0.0%) |
| Installation, Maintenance & Repair | 7 (100.0%) | 0 (0.0%) |
| Total (Category) | 19 (100.0%) | 0 (0.0%) |
| Total (Overall) | 95 (58.6%) | 67 (41.4%) |
Production, Transportation and Moving Occupations
The most common Production, Transportation and Moving occupations in Summit are Production (12 | 7.4%), Transportation (10 | 6.2%), and Material Moving (7 | 4.3%).
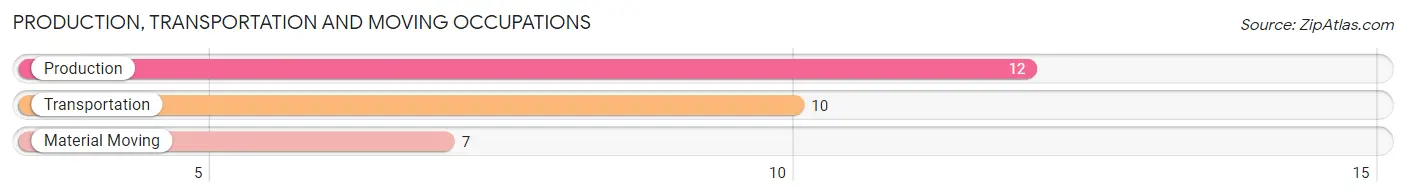
Production, Transportation and Moving Occupations by Sex
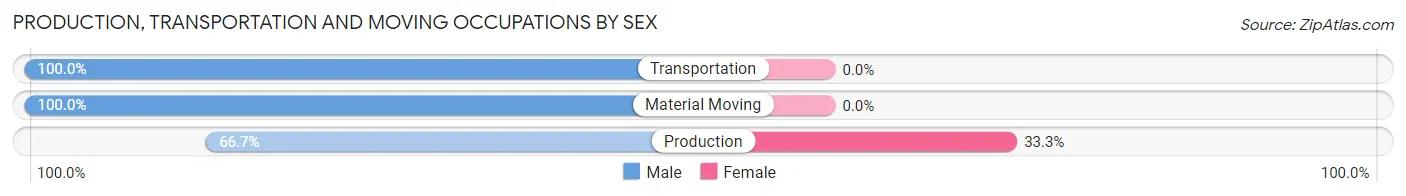
| Occupation | Male | Female |
| Production | 8 (66.7%) | 4 (33.3%) |
| Transportation | 10 (100.0%) | 0 (0.0%) |
| Material Moving | 7 (100.0%) | 0 (0.0%) |
| Total (Category) | 25 (86.2%) | 4 (13.8%) |
| Total (Overall) | 95 (58.6%) | 67 (41.4%) |
Employment Industries by Sex in Summit
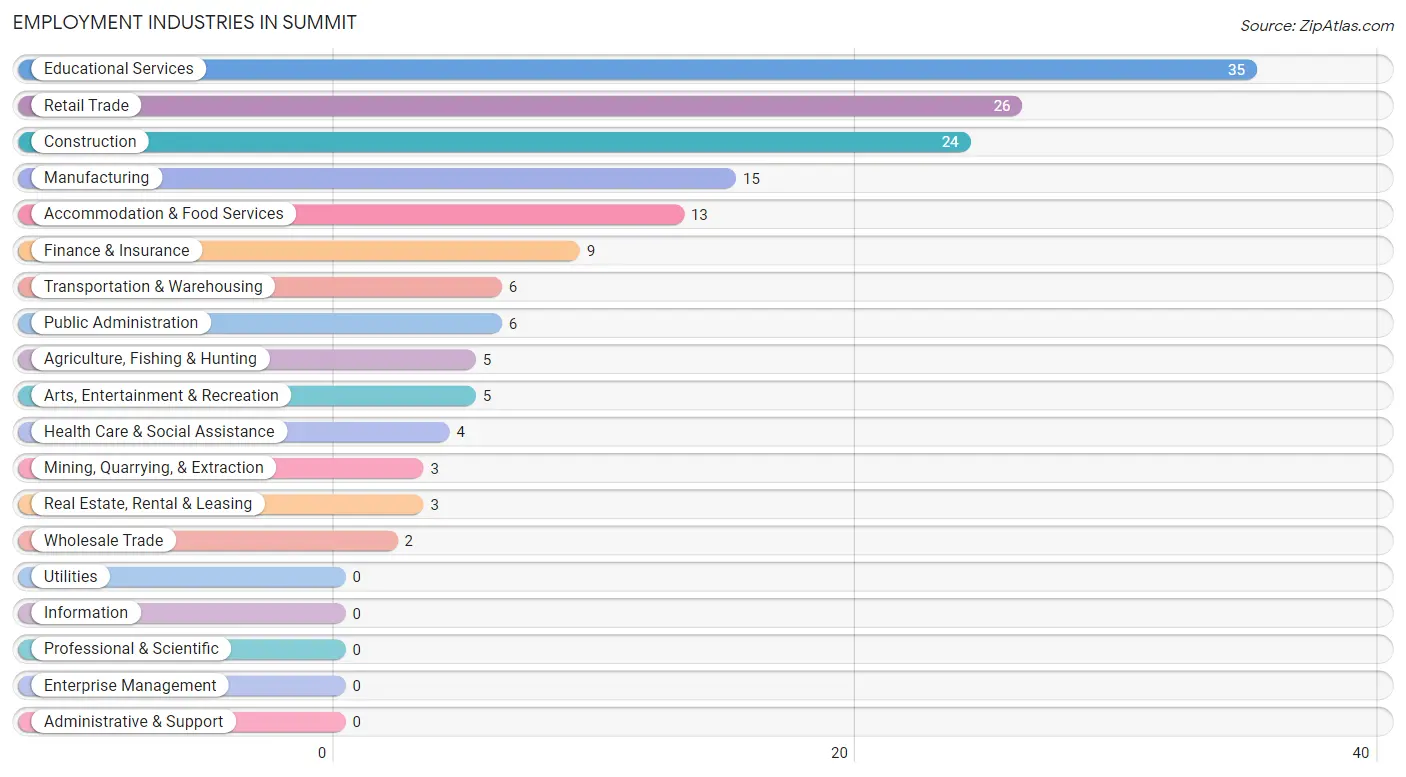
Employment Industries in Summit
The major employment industries in Summit include Educational Services (35 | 21.6%), Retail Trade (26 | 16.1%), Construction (24 | 14.8%), Manufacturing (15 | 9.3%), and Accommodation & Food Services (13 | 8.0%).
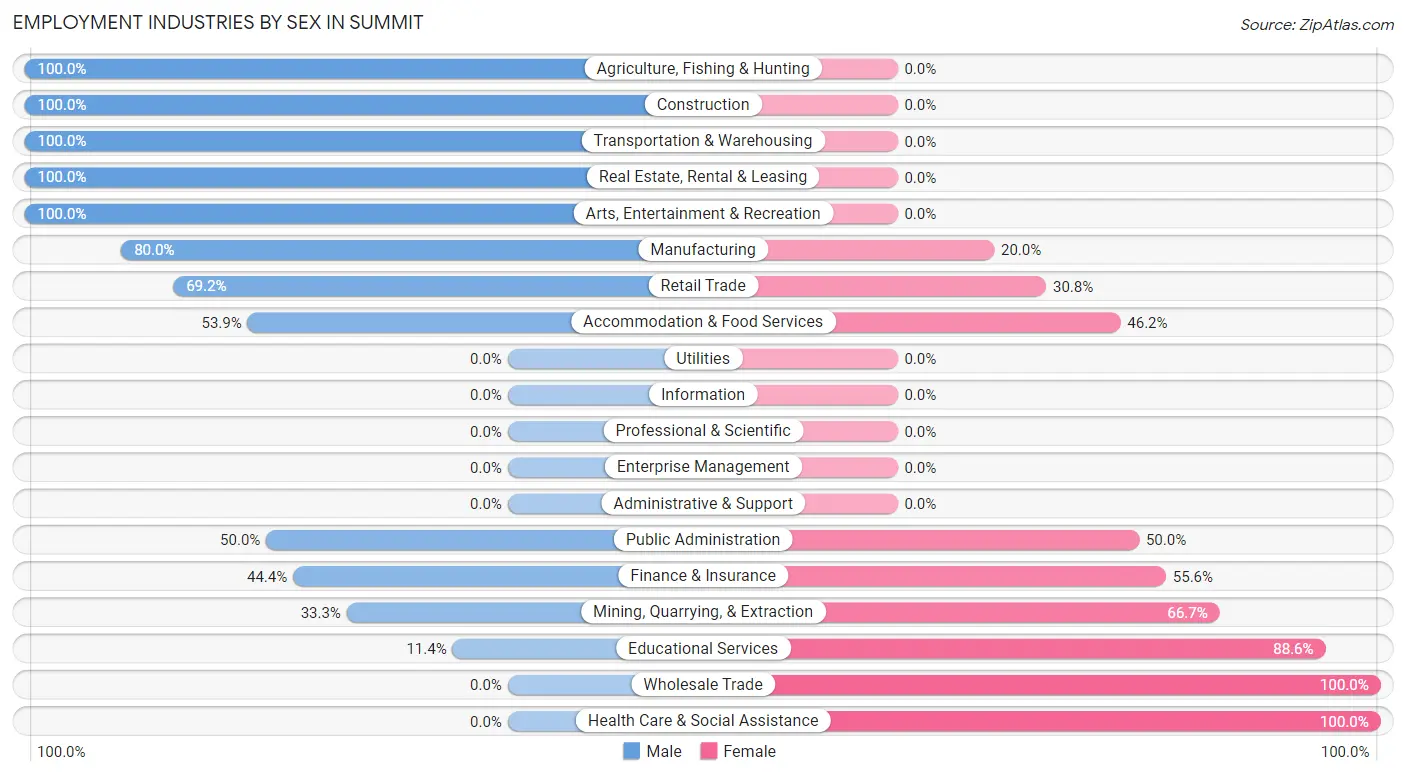
Employment Industries by Sex in Summit
The Summit industries that see more men than women are Agriculture, Fishing & Hunting (100.0%), Construction (100.0%), and Transportation & Warehousing (100.0%), whereas the industries that tend to have a higher number of women are Wholesale Trade (100.0%), Health Care & Social Assistance (100.0%), and Educational Services (88.6%).
| Industry | Male | Female |
| Agriculture, Fishing & Hunting | 5 (100.0%) | 0 (0.0%) |
| Mining, Quarrying, & Extraction | 1 (33.3%) | 2 (66.7%) |
| Construction | 24 (100.0%) | 0 (0.0%) |
| Manufacturing | 12 (80.0%) | 3 (20.0%) |
| Wholesale Trade | 0 (0.0%) | 2 (100.0%) |
| Retail Trade | 18 (69.2%) | 8 (30.8%) |
| Transportation & Warehousing | 6 (100.0%) | 0 (0.0%) |
| Utilities | 0 (0.0%) | 0 (0.0%) |
| Information | 0 (0.0%) | 0 (0.0%) |
| Finance & Insurance | 4 (44.4%) | 5 (55.6%) |
| Real Estate, Rental & Leasing | 3 (100.0%) | 0 (0.0%) |
| Professional & Scientific | 0 (0.0%) | 0 (0.0%) |
| Enterprise Management | 0 (0.0%) | 0 (0.0%) |
| Administrative & Support | 0 (0.0%) | 0 (0.0%) |
| Educational Services | 4 (11.4%) | 31 (88.6%) |
| Health Care & Social Assistance | 0 (0.0%) | 4 (100.0%) |
| Arts, Entertainment & Recreation | 5 (100.0%) | 0 (0.0%) |
| Accommodation & Food Services | 7 (53.8%) | 6 (46.2%) |
| Public Administration | 3 (50.0%) | 3 (50.0%) |
| Total | 95 (58.6%) | 67 (41.4%) |
Education in Summit
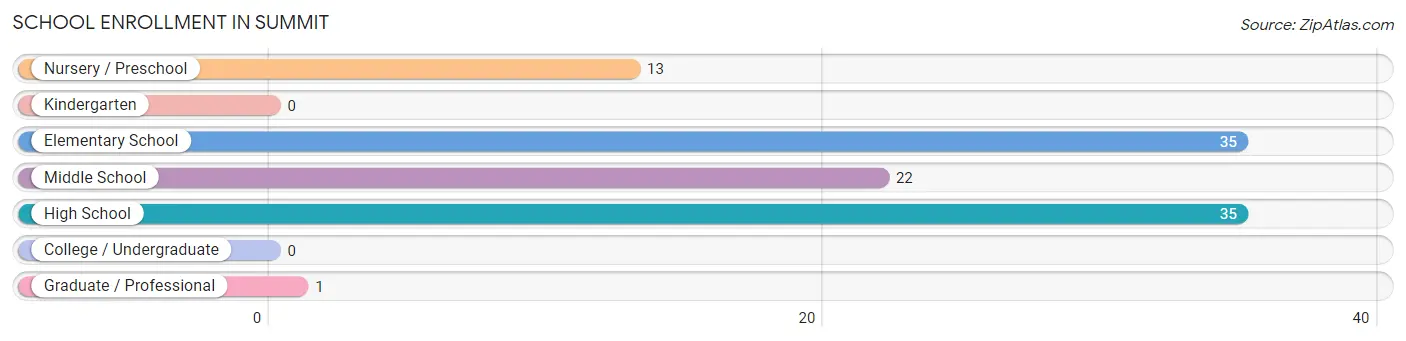
School Enrollment in Summit
The most common levels of schooling among the 106 students in Summit are elementary school (35 | 33.0%), high school (35 | 33.0%), and middle school (22 | 20.7%).
| School Level | # Students | % Students |
| Nursery / Preschool | 13 | 12.3% |
| Kindergarten | 0 | 0.0% |
| Elementary School | 35 | 33.0% |
| Middle School | 22 | 20.7% |
| High School | 35 | 33.0% |
| College / Undergraduate | 0 | 0.0% |
| Graduate / Professional | 1 | 0.9% |
| Total | 106 | 100.0% |
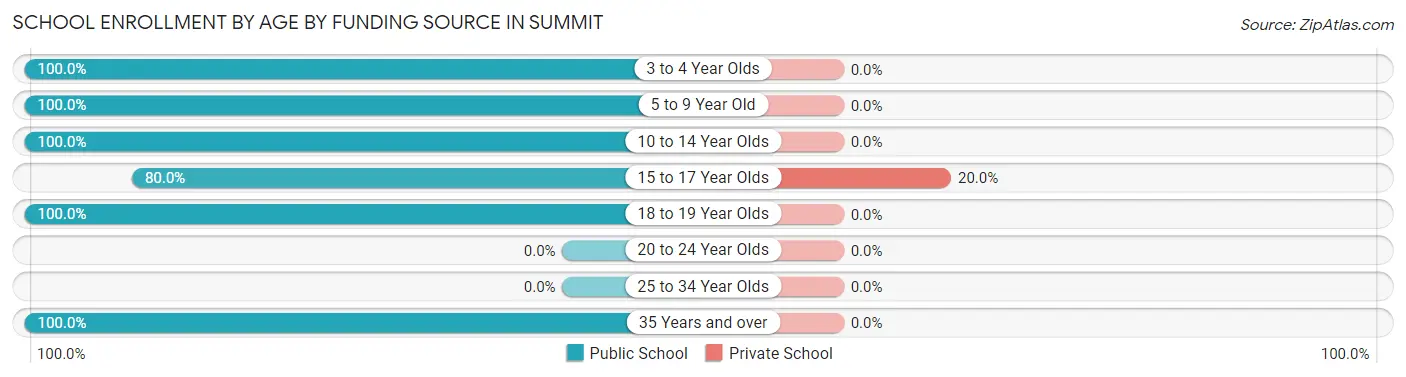
School Enrollment by Age by Funding Source in Summit
Out of a total of 106 students who are enrolled in schools in Summit, 3 (2.8%) attend a private institution, while the remaining 103 (97.2%) are enrolled in public schools. The age group of 15 to 17 year olds has the highest likelihood of being enrolled in private schools, with 3 (20.0% in the age bracket) enrolled. Conversely, the age group of 3 to 4 year olds has the lowest likelihood of being enrolled in a private school, with 6 (100.0% in the age bracket) attending a public institution.
| Age Bracket | Public School | Private School |
| 3 to 4 Year Olds | 6 (100.0%) | 0 (0.0%) |
| 5 to 9 Year Old | 41 (100.0%) | 0 (0.0%) |
| 10 to 14 Year Olds | 24 (100.0%) | 0 (0.0%) |
| 15 to 17 Year Olds | 12 (80.0%) | 3 (20.0%) |
| 18 to 19 Year Olds | 19 (100.0%) | 0 (0.0%) |
| 20 to 24 Year Olds | 0 (0.0%) | 0 (0.0%) |
| 25 to 34 Year Olds | 0 (0.0%) | 0 (0.0%) |
| 35 Years and over | 1 (100.0%) | 0 (0.0%) |
| Total | 103 (97.2%) | 3 (2.8%) |
Educational Attainment by Field of Study in Summit
Education (8 | 40.0%), business (6 | 30.0%), bio, nature & agricultural (4 | 20.0%), social sciences (1 | 5.0%), and literature & languages (1 | 5.0%) are the most common fields of study among 20 individuals in Summit who have obtained a bachelor's degree or higher.
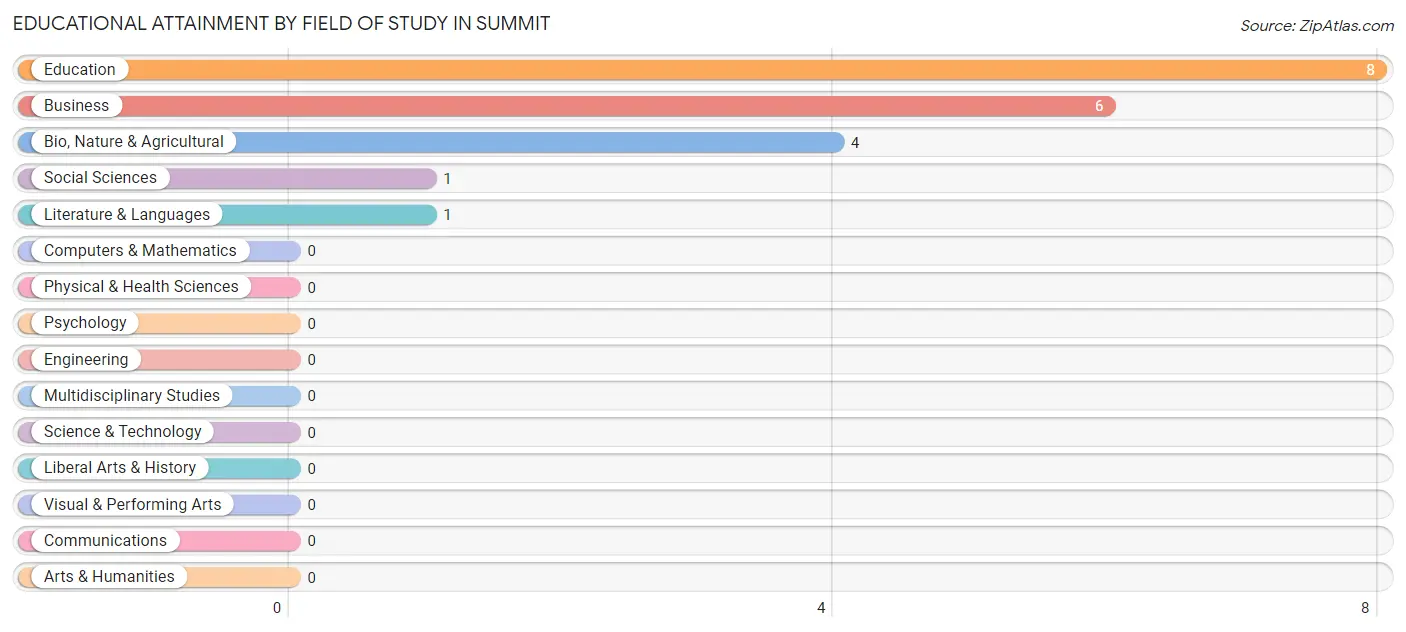
| Field of Study | # Graduates | % Graduates |
| Computers & Mathematics | 0 | 0.0% |
| Bio, Nature & Agricultural | 4 | 20.0% |
| Physical & Health Sciences | 0 | 0.0% |
| Psychology | 0 | 0.0% |
| Social Sciences | 1 | 5.0% |
| Engineering | 0 | 0.0% |
| Multidisciplinary Studies | 0 | 0.0% |
| Science & Technology | 0 | 0.0% |
| Business | 6 | 30.0% |
| Education | 8 | 40.0% |
| Literature & Languages | 1 | 5.0% |
| Liberal Arts & History | 0 | 0.0% |
| Visual & Performing Arts | 0 | 0.0% |
| Communications | 0 | 0.0% |
| Arts & Humanities | 0 | 0.0% |
| Total | 20 | 100.0% |
Transportation & Commute in Summit
Vehicle Availability by Sex in Summit
The most prevalent vehicle ownership categories in Summit are males with 4 vehicles (29, accounting for 30.5%) and females with 4 vehicles (28, making up 43.9%).
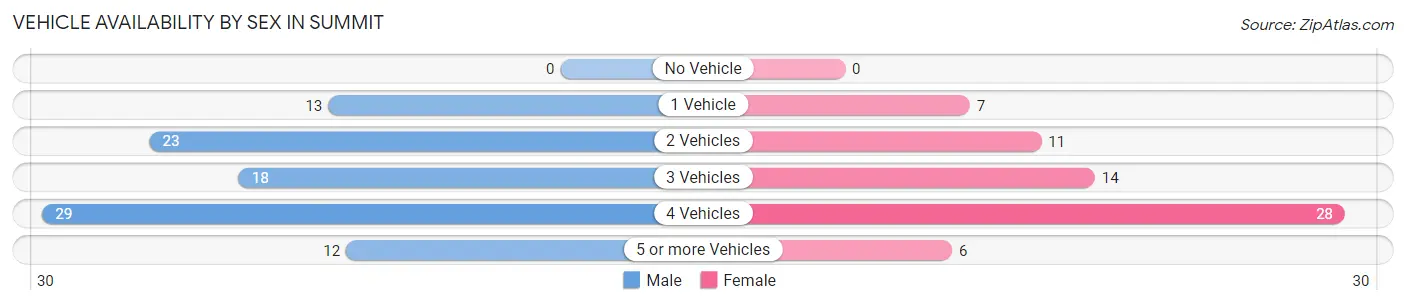
| Vehicles Available | Male | Female |
| No Vehicle | 0 (0.0%) | 0 (0.0%) |
| 1 Vehicle | 13 (13.7%) | 7 (10.6%) |
| 2 Vehicles | 23 (24.2%) | 11 (16.7%) |
| 3 Vehicles | 18 (19.0%) | 14 (21.2%) |
| 4 Vehicles | 29 (30.5%) | 28 (42.4%) |
| 5 or more Vehicles | 12 (12.6%) | 6 (9.1%) |
| Total | 95 (100.0%) | 66 (100.0%) |
Commute Time in Summit
The most frequently occuring commute durations in Summit are 30 to 34 minutes (47 commuters, 31.3%), 5 to 9 minutes (33 commuters, 22.0%), and less than 5 minutes (24 commuters, 16.0%).
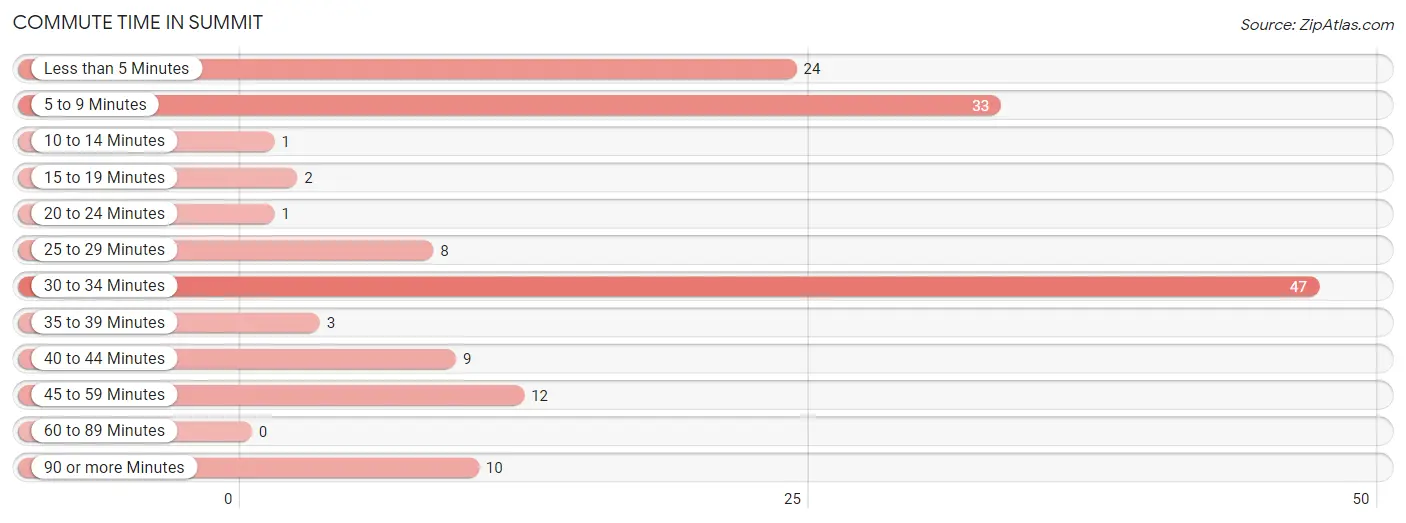
| Commute Time | # Commuters | % Commuters |
| Less than 5 Minutes | 24 | 16.0% |
| 5 to 9 Minutes | 33 | 22.0% |
| 10 to 14 Minutes | 1 | 0.7% |
| 15 to 19 Minutes | 2 | 1.3% |
| 20 to 24 Minutes | 1 | 0.7% |
| 25 to 29 Minutes | 8 | 5.3% |
| 30 to 34 Minutes | 47 | 31.3% |
| 35 to 39 Minutes | 3 | 2.0% |
| 40 to 44 Minutes | 9 | 6.0% |
| 45 to 59 Minutes | 12 | 8.0% |
| 60 to 89 Minutes | 0 | 0.0% |
| 90 or more Minutes | 10 | 6.7% |
Commute Time by Sex in Summit
The most common commute times in Summit are 30 to 34 minutes (26 commuters, 30.2%) for males and 30 to 34 minutes (21 commuters, 32.8%) for females.
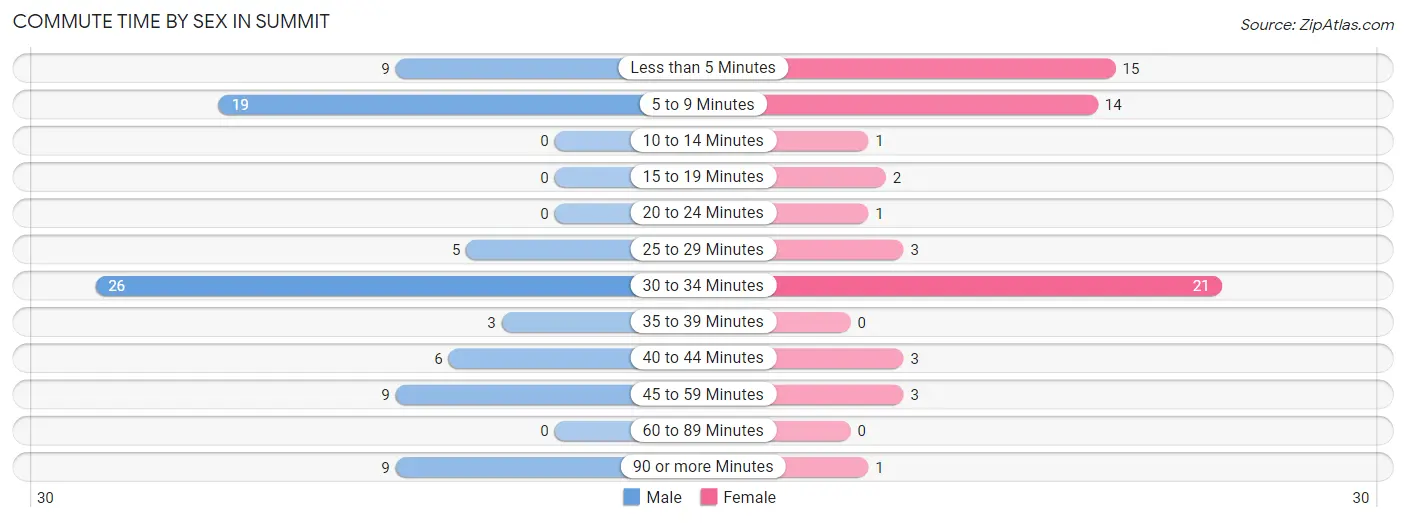
| Commute Time | Male | Female |
| Less than 5 Minutes | 9 (10.5%) | 15 (23.4%) |
| 5 to 9 Minutes | 19 (22.1%) | 14 (21.9%) |
| 10 to 14 Minutes | 0 (0.0%) | 1 (1.6%) |
| 15 to 19 Minutes | 0 (0.0%) | 2 (3.1%) |
| 20 to 24 Minutes | 0 (0.0%) | 1 (1.6%) |
| 25 to 29 Minutes | 5 (5.8%) | 3 (4.7%) |
| 30 to 34 Minutes | 26 (30.2%) | 21 (32.8%) |
| 35 to 39 Minutes | 3 (3.5%) | 0 (0.0%) |
| 40 to 44 Minutes | 6 (7.0%) | 3 (4.7%) |
| 45 to 59 Minutes | 9 (10.5%) | 3 (4.7%) |
| 60 to 89 Minutes | 0 (0.0%) | 0 (0.0%) |
| 90 or more Minutes | 9 (10.5%) | 1 (1.6%) |
Time of Departure to Work by Sex in Summit
The most frequent times of departure to work in Summit are 7:00 AM to 7:29 AM (27, 31.4%) for males and 7:00 AM to 7:29 AM (13, 20.3%) for females.
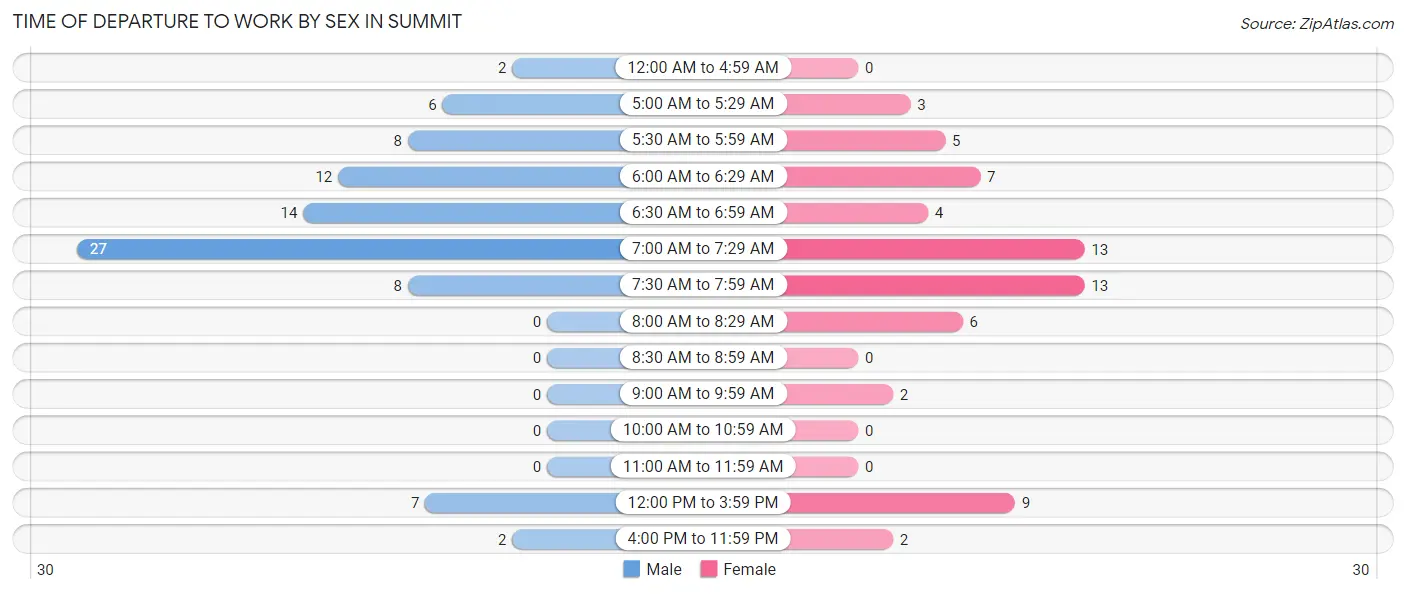
| Time of Departure | Male | Female |
| 12:00 AM to 4:59 AM | 2 (2.3%) | 0 (0.0%) |
| 5:00 AM to 5:29 AM | 6 (7.0%) | 3 (4.7%) |
| 5:30 AM to 5:59 AM | 8 (9.3%) | 5 (7.8%) |
| 6:00 AM to 6:29 AM | 12 (14.0%) | 7 (10.9%) |
| 6:30 AM to 6:59 AM | 14 (16.3%) | 4 (6.2%) |
| 7:00 AM to 7:29 AM | 27 (31.4%) | 13 (20.3%) |
| 7:30 AM to 7:59 AM | 8 (9.3%) | 13 (20.3%) |
| 8:00 AM to 8:29 AM | 0 (0.0%) | 6 (9.4%) |
| 8:30 AM to 8:59 AM | 0 (0.0%) | 0 (0.0%) |
| 9:00 AM to 9:59 AM | 0 (0.0%) | 2 (3.1%) |
| 10:00 AM to 10:59 AM | 0 (0.0%) | 0 (0.0%) |
| 11:00 AM to 11:59 AM | 0 (0.0%) | 0 (0.0%) |
| 12:00 PM to 3:59 PM | 7 (8.1%) | 9 (14.1%) |
| 4:00 PM to 11:59 PM | 2 (2.3%) | 2 (3.1%) |
| Total | 86 (100.0%) | 64 (100.0%) |
Housing Occupancy in Summit
Occupancy by Ownership in Summit
Of the total 116 dwellings in Summit, owner-occupied units account for 75 (64.7%), while renter-occupied units make up 41 (35.3%).
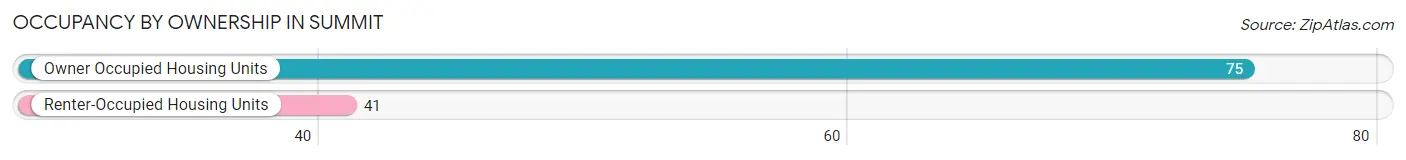
| Occupancy | # Housing Units | % Housing Units |
| Owner Occupied Housing Units | 75 | 64.7% |
| Renter-Occupied Housing Units | 41 | 35.3% |
| Total Occupied Housing Units | 116 | 100.0% |
Occupancy by Household Size in Summit
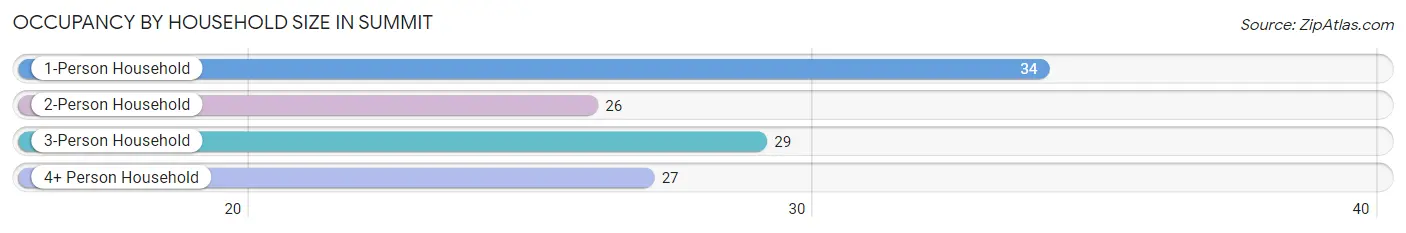
| Household Size | # Housing Units | % Housing Units |
| 1-Person Household | 34 | 29.3% |
| 2-Person Household | 26 | 22.4% |
| 3-Person Household | 29 | 25.0% |
| 4+ Person Household | 27 | 23.3% |
| Total Housing Units | 116 | 100.0% |
Occupancy by Ownership by Household Size in Summit
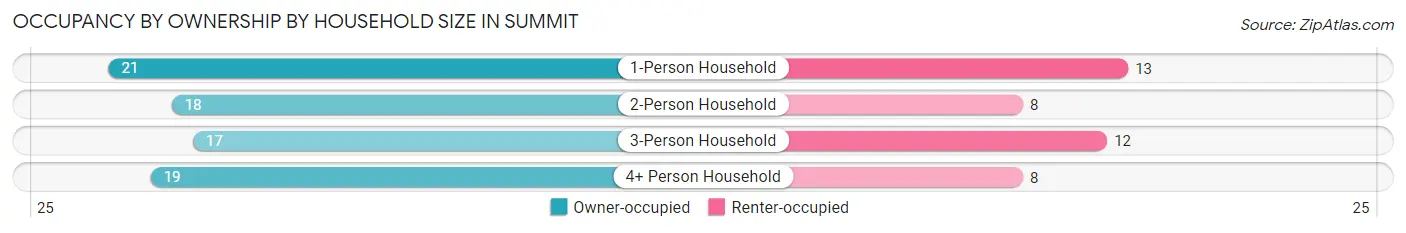
| Household Size | Owner-occupied | Renter-occupied |
| 1-Person Household | 21 (61.8%) | 13 (38.2%) |
| 2-Person Household | 18 (69.2%) | 8 (30.8%) |
| 3-Person Household | 17 (58.6%) | 12 (41.4%) |
| 4+ Person Household | 19 (70.4%) | 8 (29.6%) |
| Total Housing Units | 75 (64.7%) | 41 (35.3%) |
Occupancy by Educational Attainment in Summit
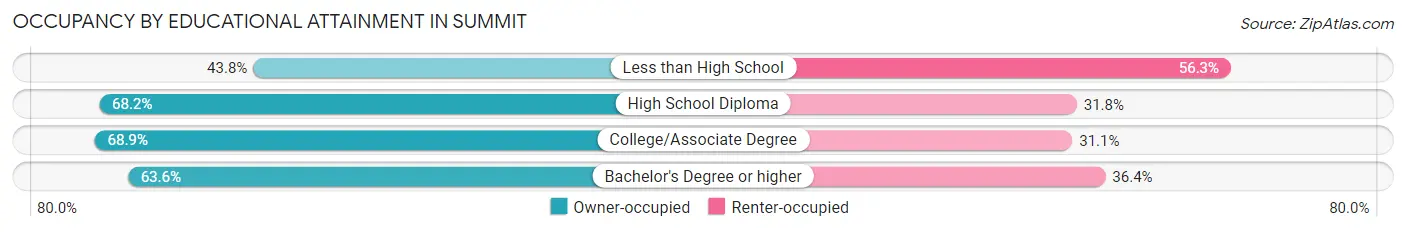
| Household Size | Owner-occupied | Renter-occupied |
| Less than High School | 7 (43.8%) | 9 (56.2%) |
| High School Diploma | 30 (68.2%) | 14 (31.8%) |
| College/Associate Degree | 31 (68.9%) | 14 (31.1%) |
| Bachelor's Degree or higher | 7 (63.6%) | 4 (36.4%) |
Occupancy by Age of Householder in Summit
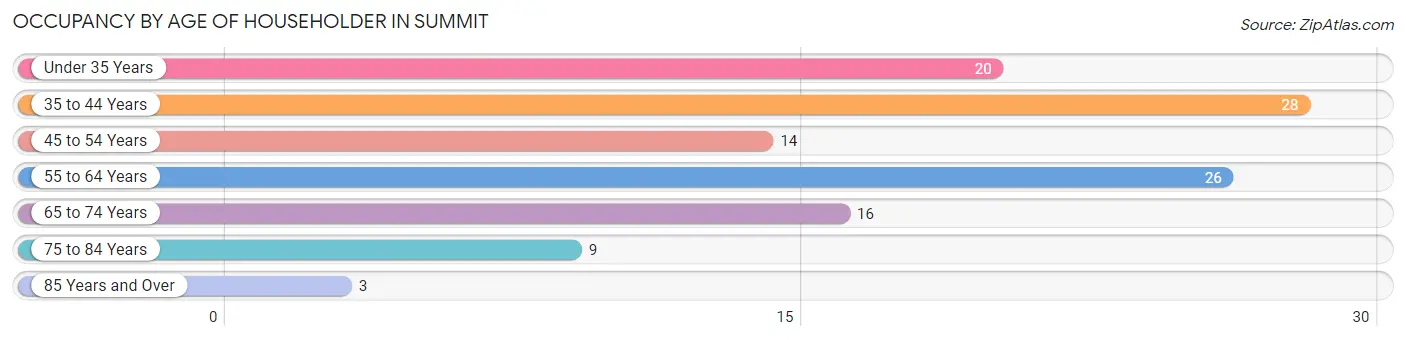
| Age Bracket | # Households | % Households |
| Under 35 Years | 20 | 17.2% |
| 35 to 44 Years | 28 | 24.1% |
| 45 to 54 Years | 14 | 12.1% |
| 55 to 64 Years | 26 | 22.4% |
| 65 to 74 Years | 16 | 13.8% |
| 75 to 84 Years | 9 | 7.8% |
| 85 Years and Over | 3 | 2.6% |
| Total | 116 | 100.0% |
Housing Finances in Summit
Median Income by Occupancy in Summit
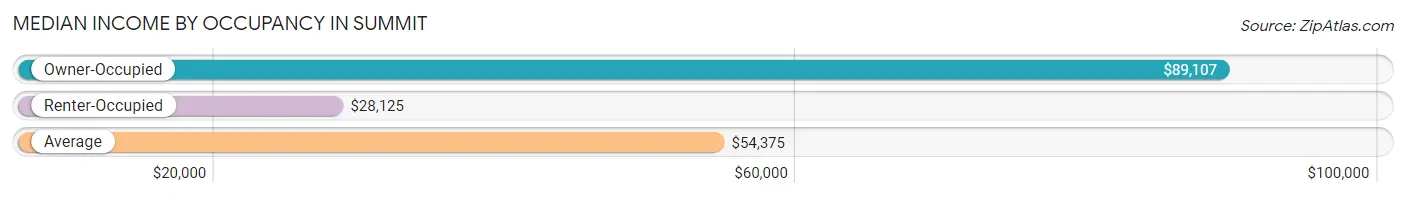
| Occupancy Type | # Households | Median Income |
| Owner-Occupied | 75 (64.7%) | $89,107 |
| Renter-Occupied | 41 (35.3%) | $28,125 |
| Average | 116 (100.0%) | $54,375 |
Occupancy by Householder Income Bracket in Summit

| Income Bracket | Owner-occupied | Renter-occupied |
| Less than $5,000 | 0 (0.0%) | 3 (7.3%) |
| $5,000 to $9,999 | 0 (0.0%) | 3 (7.3%) |
| $10,000 to $14,999 | 5 (6.7%) | 6 (14.6%) |
| $15,000 to $19,999 | 0 (0.0%) | 3 (7.3%) |
| $20,000 to $24,999 | 1 (1.3%) | 3 (7.3%) |
| $25,000 to $34,999 | 14 (18.7%) | 7 (17.1%) |
| $35,000 to $49,999 | 4 (5.3%) | 6 (14.6%) |
| $50,000 to $74,999 | 9 (12.0%) | 7 (17.1%) |
| $75,000 to $99,999 | 15 (20.0%) | 1 (2.4%) |
| $100,000 to $149,999 | 24 (32.0%) | 2 (4.9%) |
| $150,000 or more | 3 (4.0%) | 0 (0.0%) |
| Total | 75 (100.0%) | 41 (100.0%) |
Monthly Housing Cost Tiers in Summit
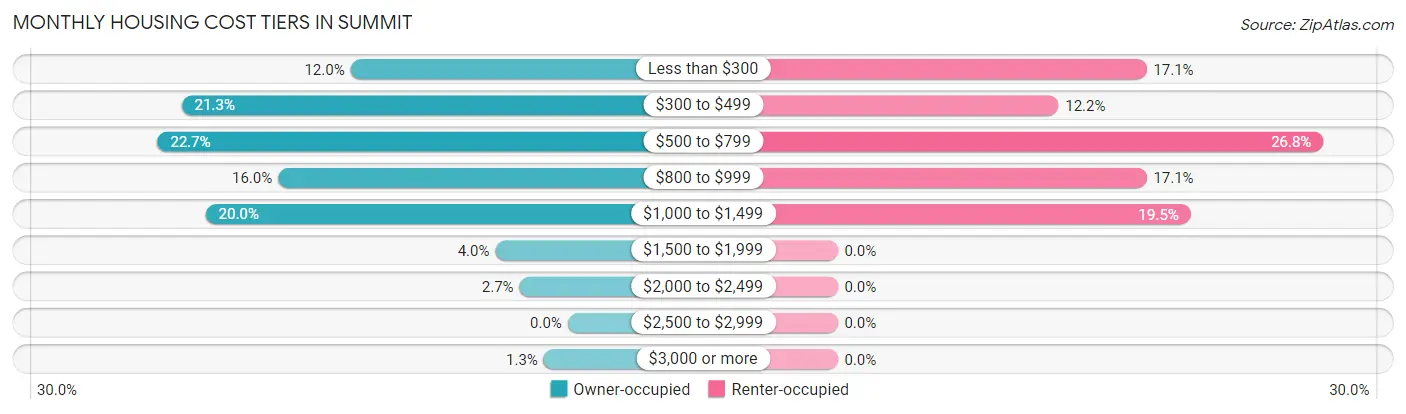
| Monthly Cost | Owner-occupied | Renter-occupied |
| Less than $300 | 9 (12.0%) | 7 (17.1%) |
| $300 to $499 | 16 (21.3%) | 5 (12.2%) |
| $500 to $799 | 17 (22.7%) | 11 (26.8%) |
| $800 to $999 | 12 (16.0%) | 7 (17.1%) |
| $1,000 to $1,499 | 15 (20.0%) | 8 (19.5%) |
| $1,500 to $1,999 | 3 (4.0%) | 0 (0.0%) |
| $2,000 to $2,499 | 2 (2.7%) | 0 (0.0%) |
| $2,500 to $2,999 | 0 (0.0%) | 0 (0.0%) |
| $3,000 or more | 1 (1.3%) | 0 (0.0%) |
| Total | 75 (100.0%) | 41 (100.0%) |
Physical Housing Characteristics in Summit
Housing Structures in Summit
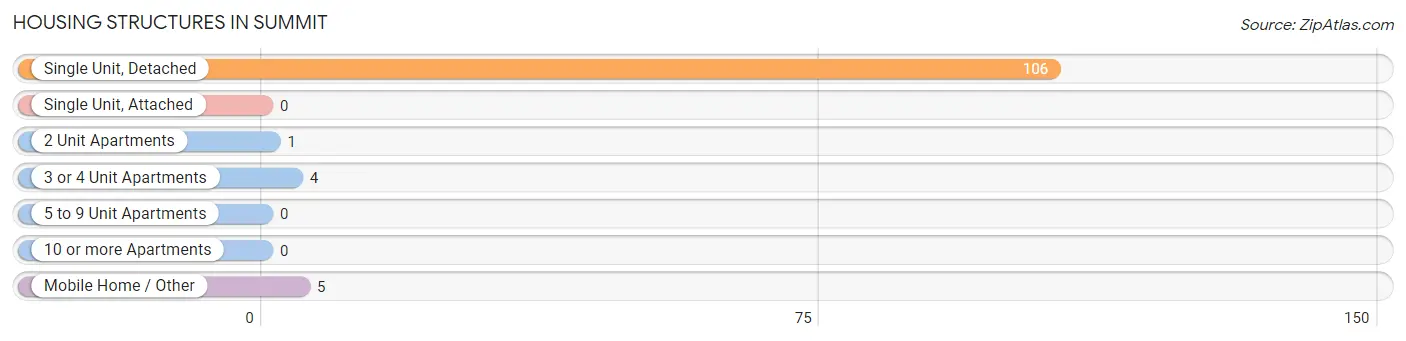
| Structure Type | # Housing Units | % Housing Units |
| Single Unit, Detached | 106 | 91.4% |
| Single Unit, Attached | 0 | 0.0% |
| 2 Unit Apartments | 1 | 0.9% |
| 3 or 4 Unit Apartments | 4 | 3.5% |
| 5 to 9 Unit Apartments | 0 | 0.0% |
| 10 or more Apartments | 0 | 0.0% |
| Mobile Home / Other | 5 | 4.3% |
| Total | 116 | 100.0% |
Housing Structures by Occupancy in Summit
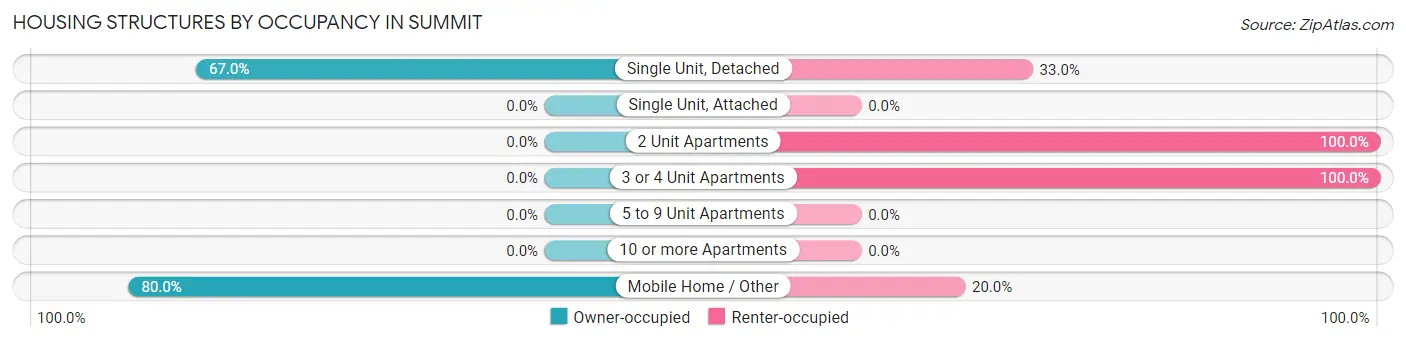
| Structure Type | Owner-occupied | Renter-occupied |
| Single Unit, Detached | 71 (67.0%) | 35 (33.0%) |
| Single Unit, Attached | 0 (0.0%) | 0 (0.0%) |
| 2 Unit Apartments | 0 (0.0%) | 1 (100.0%) |
| 3 or 4 Unit Apartments | 0 (0.0%) | 4 (100.0%) |
| 5 to 9 Unit Apartments | 0 (0.0%) | 0 (0.0%) |
| 10 or more Apartments | 0 (0.0%) | 0 (0.0%) |
| Mobile Home / Other | 4 (80.0%) | 1 (20.0%) |
| Total | 75 (64.7%) | 41 (35.3%) |
Housing Structures by Number of Rooms in Summit
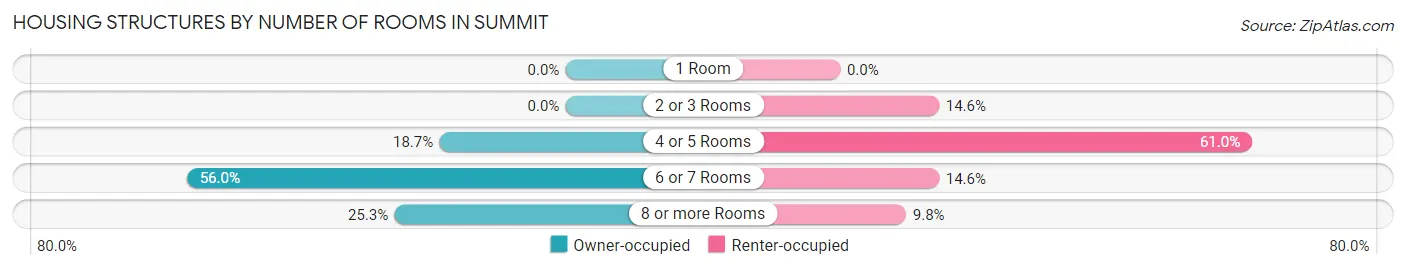
| Number of Rooms | Owner-occupied | Renter-occupied |
| 1 Room | 0 (0.0%) | 0 (0.0%) |
| 2 or 3 Rooms | 0 (0.0%) | 6 (14.6%) |
| 4 or 5 Rooms | 14 (18.7%) | 25 (61.0%) |
| 6 or 7 Rooms | 42 (56.0%) | 6 (14.6%) |
| 8 or more Rooms | 19 (25.3%) | 4 (9.8%) |
| Total | 75 (100.0%) | 41 (100.0%) |
Housing Structure by Heating Type in Summit
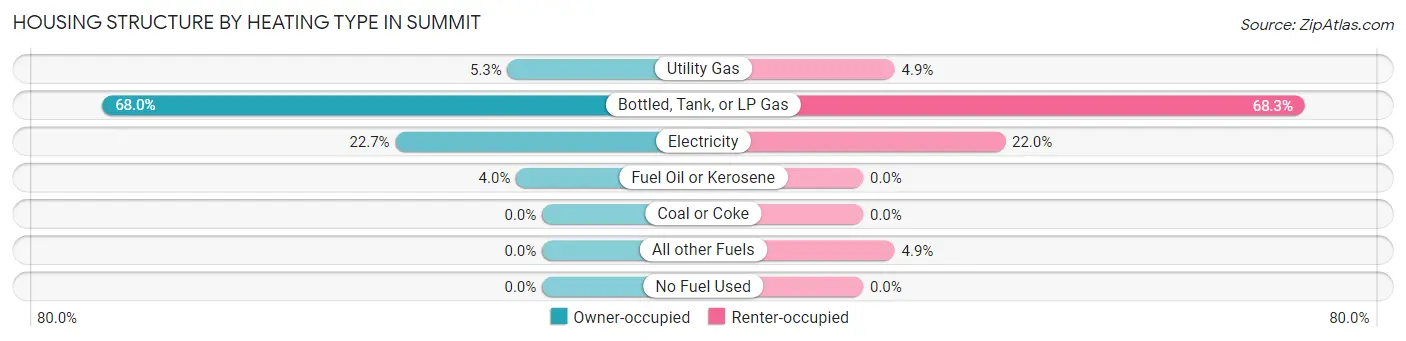
| Heating Type | Owner-occupied | Renter-occupied |
| Utility Gas | 4 (5.3%) | 2 (4.9%) |
| Bottled, Tank, or LP Gas | 51 (68.0%) | 28 (68.3%) |
| Electricity | 17 (22.7%) | 9 (22.0%) |
| Fuel Oil or Kerosene | 3 (4.0%) | 0 (0.0%) |
| Coal or Coke | 0 (0.0%) | 0 (0.0%) |
| All other Fuels | 0 (0.0%) | 2 (4.9%) |
| No Fuel Used | 0 (0.0%) | 0 (0.0%) |
| Total | 75 (100.0%) | 41 (100.0%) |
Household Vehicle Usage in Summit
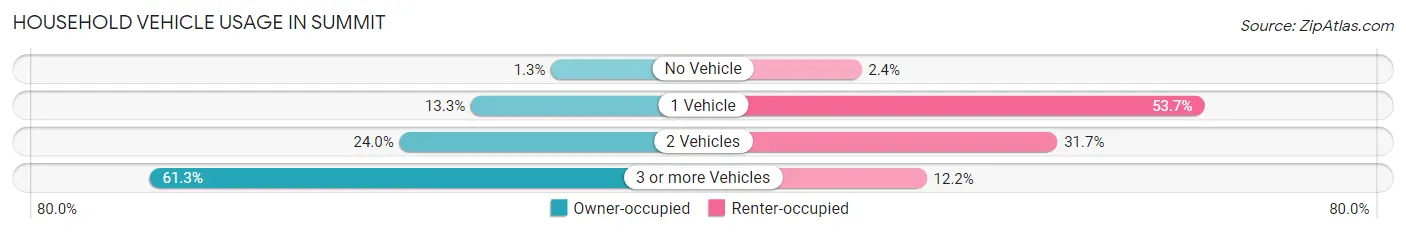
| Vehicles per Household | Owner-occupied | Renter-occupied |
| No Vehicle | 1 (1.3%) | 1 (2.4%) |
| 1 Vehicle | 10 (13.3%) | 22 (53.7%) |
| 2 Vehicles | 18 (24.0%) | 13 (31.7%) |
| 3 or more Vehicles | 46 (61.3%) | 5 (12.2%) |
| Total | 75 (100.0%) | 41 (100.0%) |
Real Estate & Mortgages in Summit
Real Estate and Mortgage Overview in Summit
| Characteristic | Without Mortgage | With Mortgage |
| Housing Units | 40 | 35 |
| Median Property Value | $67,100 | $95,000 |
| Median Household Income | - | - |
| Monthly Housing Costs | $455 | $1 |
| Real Estate Taxes | $933 | $1 |
Property Value by Mortgage Status in Summit
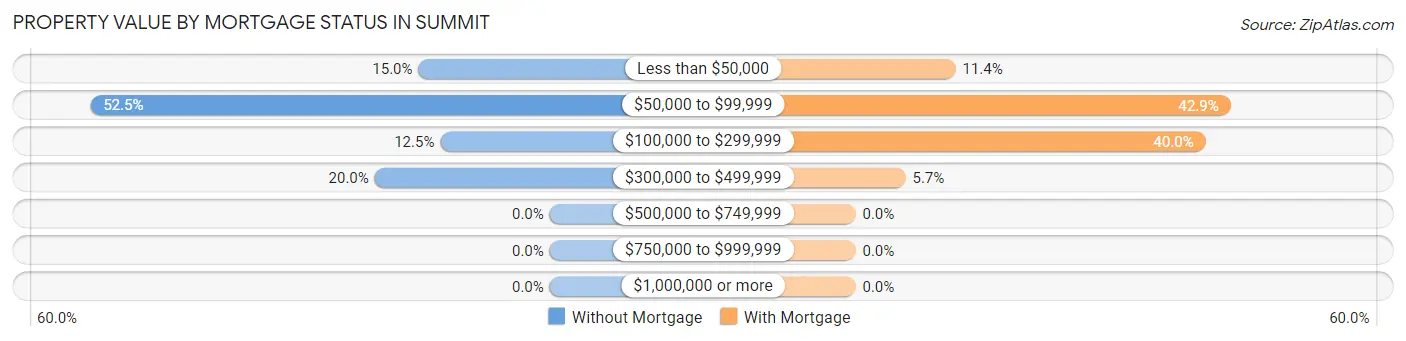
| Property Value | Without Mortgage | With Mortgage |
| Less than $50,000 | 6 (15.0%) | 4 (11.4%) |
| $50,000 to $99,999 | 21 (52.5%) | 15 (42.9%) |
| $100,000 to $299,999 | 5 (12.5%) | 14 (40.0%) |
| $300,000 to $499,999 | 8 (20.0%) | 2 (5.7%) |
| $500,000 to $749,999 | 0 (0.0%) | 0 (0.0%) |
| $750,000 to $999,999 | 0 (0.0%) | 0 (0.0%) |
| $1,000,000 or more | 0 (0.0%) | 0 (0.0%) |
| Total | 40 (100.0%) | 35 (100.0%) |
Household Income by Mortgage Status in Summit
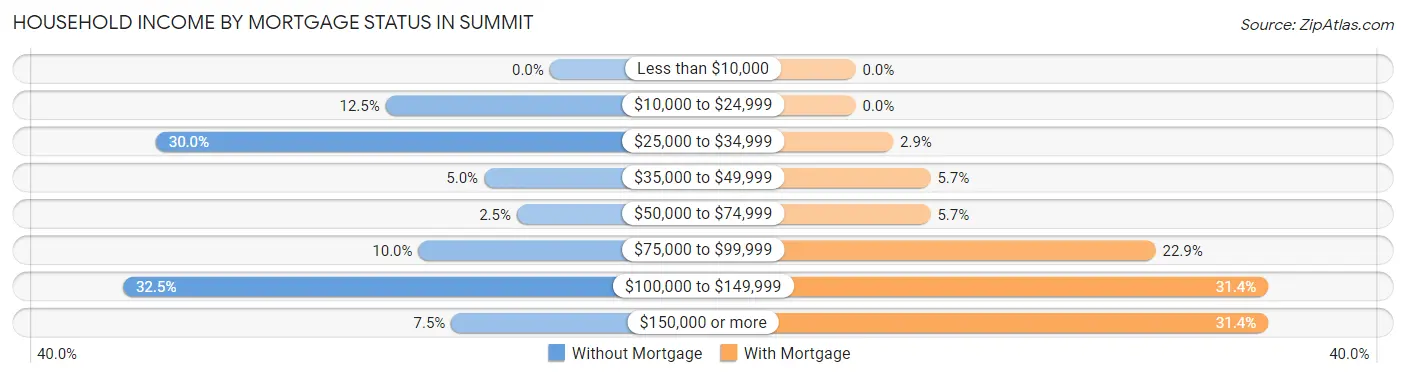
| Household Income | Without Mortgage | With Mortgage |
| Less than $10,000 | 0 (0.0%) | 0 (0.0%) |
| $10,000 to $24,999 | 5 (12.5%) | 0 (0.0%) |
| $25,000 to $34,999 | 12 (30.0%) | 1 (2.9%) |
| $35,000 to $49,999 | 2 (5.0%) | 2 (5.7%) |
| $50,000 to $74,999 | 1 (2.5%) | 2 (5.7%) |
| $75,000 to $99,999 | 4 (10.0%) | 8 (22.9%) |
| $100,000 to $149,999 | 13 (32.5%) | 11 (31.4%) |
| $150,000 or more | 3 (7.5%) | 11 (31.4%) |
| Total | 40 (100.0%) | 35 (100.0%) |
Property Value to Household Income Ratio in Summit
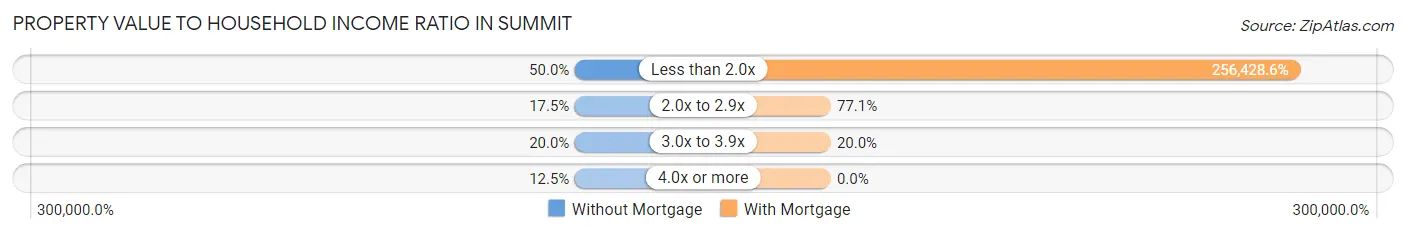
| Value-to-Income Ratio | Without Mortgage | With Mortgage |
| Less than 2.0x | 20 (50.0%) | 89,750 (256,428.6%) |
| 2.0x to 2.9x | 7 (17.5%) | 27 (77.1%) |
| 3.0x to 3.9x | 8 (20.0%) | 7 (20.0%) |
| 4.0x or more | 5 (12.5%) | 0 (0.0%) |
| Total | 40 (100.0%) | 35 (100.0%) |
Real Estate Taxes by Mortgage Status in Summit
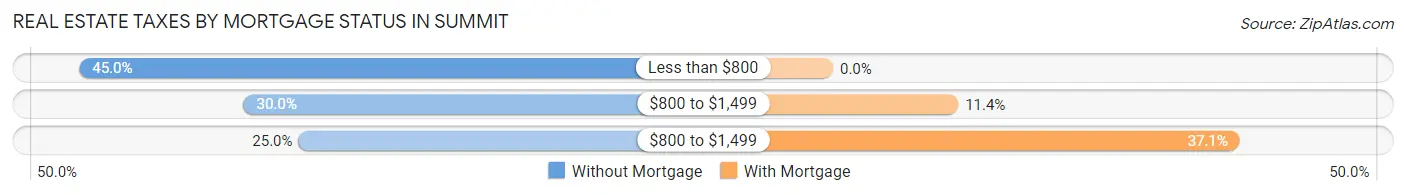
| Property Taxes | Without Mortgage | With Mortgage |
| Less than $800 | 18 (45.0%) | 0 (0.0%) |
| $800 to $1,499 | 12 (30.0%) | 4 (11.4%) |
| $800 to $1,499 | 10 (25.0%) | 13 (37.1%) |
| Total | 40 (100.0%) | 35 (100.0%) |
Health & Disability in Summit
Health Insurance Coverage by Age in Summit
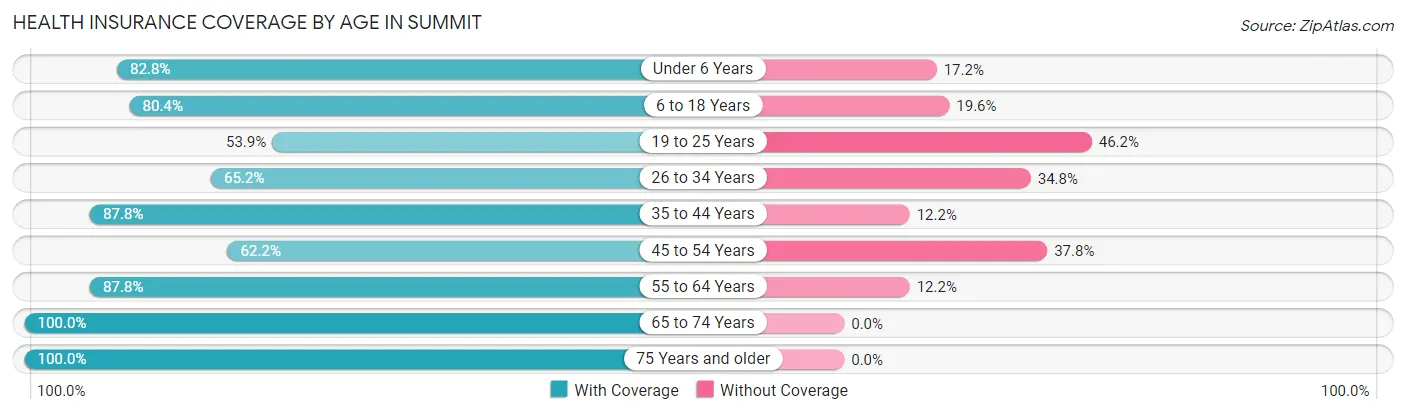
| Age Bracket | With Coverage | Without Coverage |
| Under 6 Years | 24 (82.8%) | 5 (17.2%) |
| 6 to 18 Years | 78 (80.4%) | 19 (19.6%) |
| 19 to 25 Years | 21 (53.8%) | 18 (46.2%) |
| 26 to 34 Years | 15 (65.2%) | 8 (34.8%) |
| 35 to 44 Years | 36 (87.8%) | 5 (12.2%) |
| 45 to 54 Years | 23 (62.2%) | 14 (37.8%) |
| 55 to 64 Years | 36 (87.8%) | 5 (12.2%) |
| 65 to 74 Years | 18 (100.0%) | 0 (0.0%) |
| 75 Years and older | 16 (100.0%) | 0 (0.0%) |
| Total | 267 (78.3%) | 74 (21.7%) |
Health Insurance Coverage by Citizenship Status in Summit
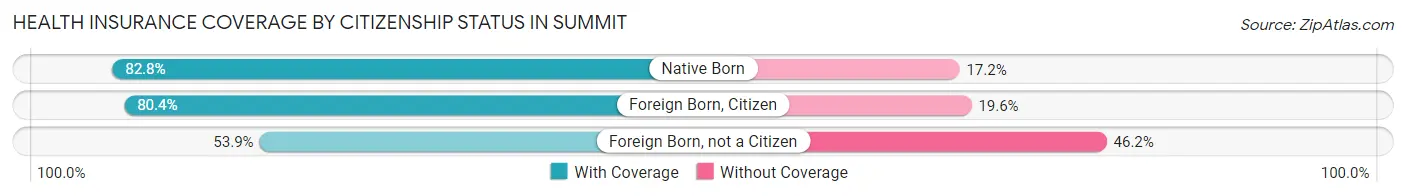
| Citizenship Status | With Coverage | Without Coverage |
| Native Born | 24 (82.8%) | 5 (17.2%) |
| Foreign Born, Citizen | 78 (80.4%) | 19 (19.6%) |
| Foreign Born, not a Citizen | 21 (53.8%) | 18 (46.2%) |
Health Insurance Coverage by Household Income in Summit
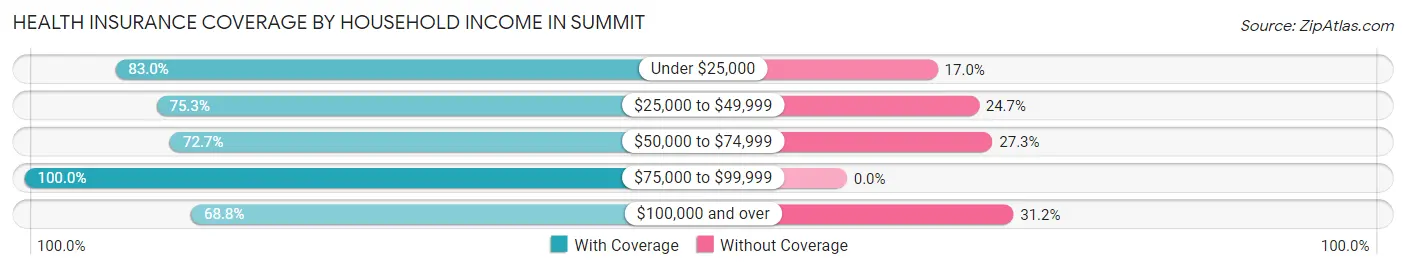
| Household Income | With Coverage | Without Coverage |
| Under $25,000 | 39 (83.0%) | 8 (17.0%) |
| $25,000 to $49,999 | 70 (75.3%) | 23 (24.7%) |
| $50,000 to $74,999 | 24 (72.7%) | 9 (27.3%) |
| $75,000 to $99,999 | 59 (100.0%) | 0 (0.0%) |
| $100,000 and over | 75 (68.8%) | 34 (31.2%) |
Public vs Private Health Insurance Coverage by Age in Summit
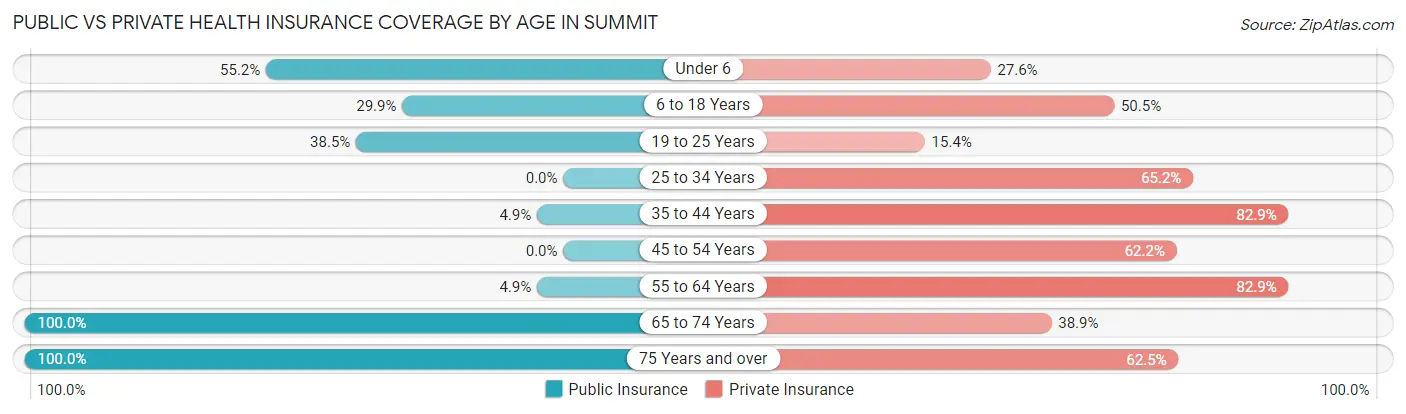
| Age Bracket | Public Insurance | Private Insurance |
| Under 6 | 16 (55.2%) | 8 (27.6%) |
| 6 to 18 Years | 29 (29.9%) | 49 (50.5%) |
| 19 to 25 Years | 15 (38.5%) | 6 (15.4%) |
| 25 to 34 Years | 0 (0.0%) | 15 (65.2%) |
| 35 to 44 Years | 2 (4.9%) | 34 (82.9%) |
| 45 to 54 Years | 0 (0.0%) | 23 (62.2%) |
| 55 to 64 Years | 2 (4.9%) | 34 (82.9%) |
| 65 to 74 Years | 18 (100.0%) | 7 (38.9%) |
| 75 Years and over | 16 (100.0%) | 10 (62.5%) |
| Total | 98 (28.7%) | 186 (54.5%) |
Disability Status by Sex by Age in Summit
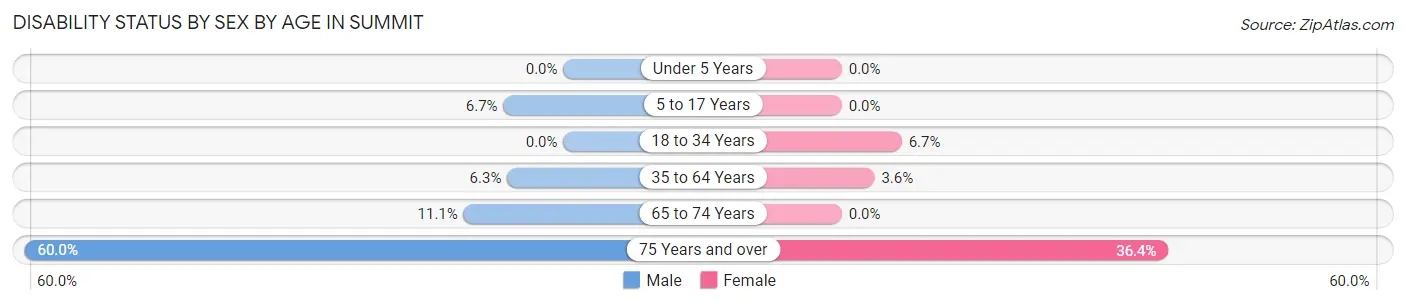
| Age Bracket | Male | Female |
| Under 5 Years | 0 (0.0%) | 0 (0.0%) |
| 5 to 17 Years | 3 (6.7%) | 0 (0.0%) |
| 18 to 34 Years | 0 (0.0%) | 2 (6.7%) |
| 35 to 64 Years | 4 (6.2%) | 2 (3.6%) |
| 65 to 74 Years | 1 (11.1%) | 0 (0.0%) |
| 75 Years and over | 3 (60.0%) | 4 (36.4%) |
Disability Class by Sex by Age in Summit
Disability Class: Hearing Difficulty
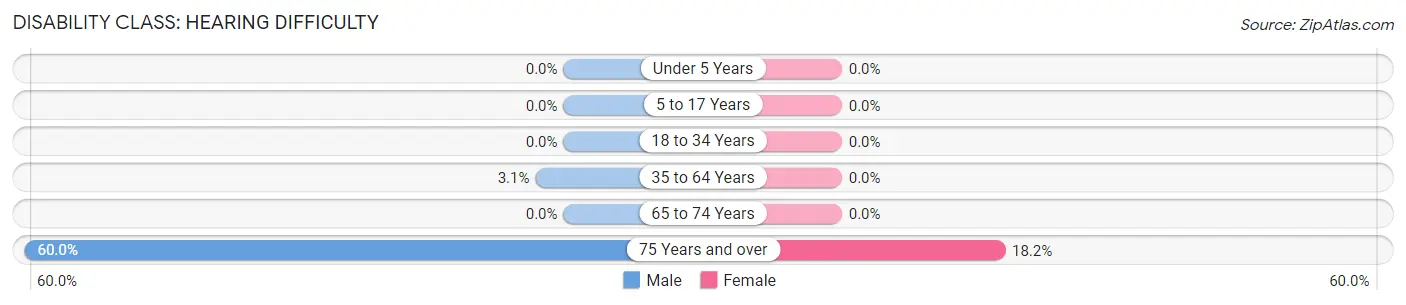
| Age Bracket | Male | Female |
| Under 5 Years | 0 (0.0%) | 0 (0.0%) |
| 5 to 17 Years | 0 (0.0%) | 0 (0.0%) |
| 18 to 34 Years | 0 (0.0%) | 0 (0.0%) |
| 35 to 64 Years | 2 (3.1%) | 0 (0.0%) |
| 65 to 74 Years | 0 (0.0%) | 0 (0.0%) |
| 75 Years and over | 3 (60.0%) | 2 (18.2%) |
Disability Class: Vision Difficulty
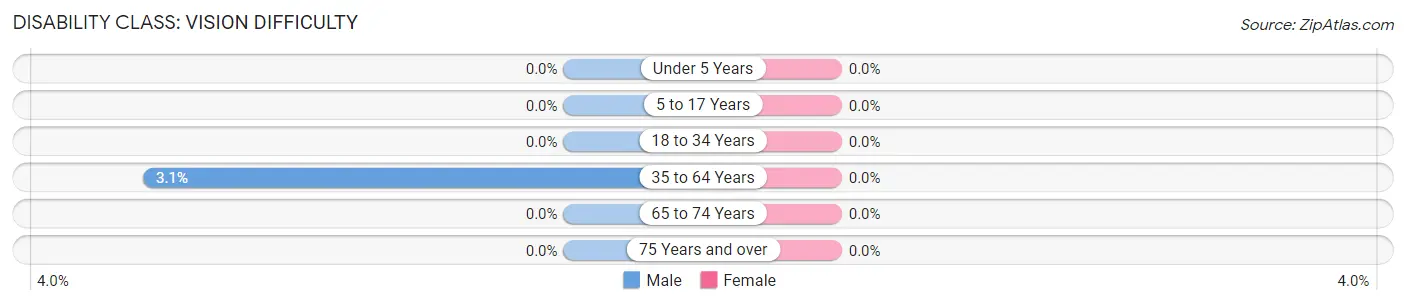
| Age Bracket | Male | Female |
| Under 5 Years | 0 (0.0%) | 0 (0.0%) |
| 5 to 17 Years | 0 (0.0%) | 0 (0.0%) |
| 18 to 34 Years | 0 (0.0%) | 0 (0.0%) |
| 35 to 64 Years | 2 (3.1%) | 0 (0.0%) |
| 65 to 74 Years | 0 (0.0%) | 0 (0.0%) |
| 75 Years and over | 0 (0.0%) | 0 (0.0%) |
Disability Class: Cognitive Difficulty
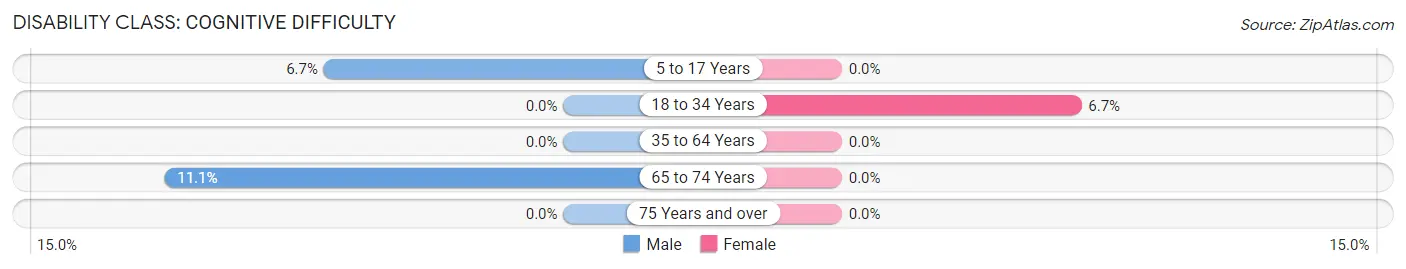
| Age Bracket | Male | Female |
| 5 to 17 Years | 3 (6.7%) | 0 (0.0%) |
| 18 to 34 Years | 0 (0.0%) | 2 (6.7%) |
| 35 to 64 Years | 0 (0.0%) | 0 (0.0%) |
| 65 to 74 Years | 1 (11.1%) | 0 (0.0%) |
| 75 Years and over | 0 (0.0%) | 0 (0.0%) |
Disability Class: Ambulatory Difficulty
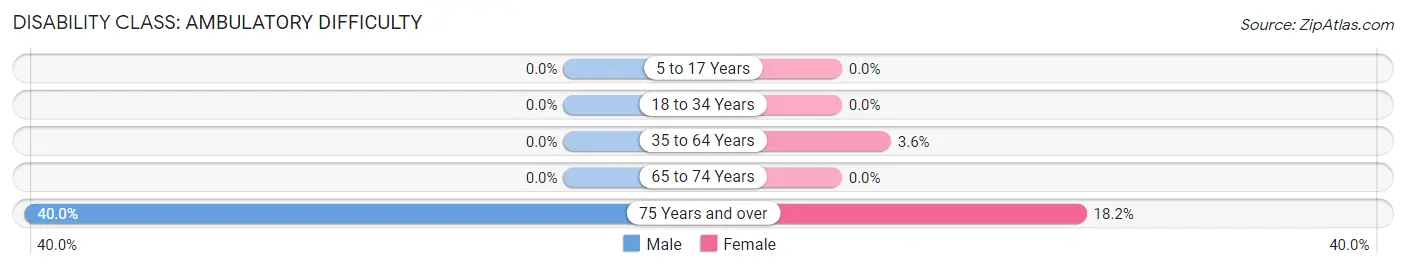
| Age Bracket | Male | Female |
| 5 to 17 Years | 0 (0.0%) | 0 (0.0%) |
| 18 to 34 Years | 0 (0.0%) | 0 (0.0%) |
| 35 to 64 Years | 0 (0.0%) | 2 (3.6%) |
| 65 to 74 Years | 0 (0.0%) | 0 (0.0%) |
| 75 Years and over | 2 (40.0%) | 2 (18.2%) |
Disability Class: Self-Care Difficulty
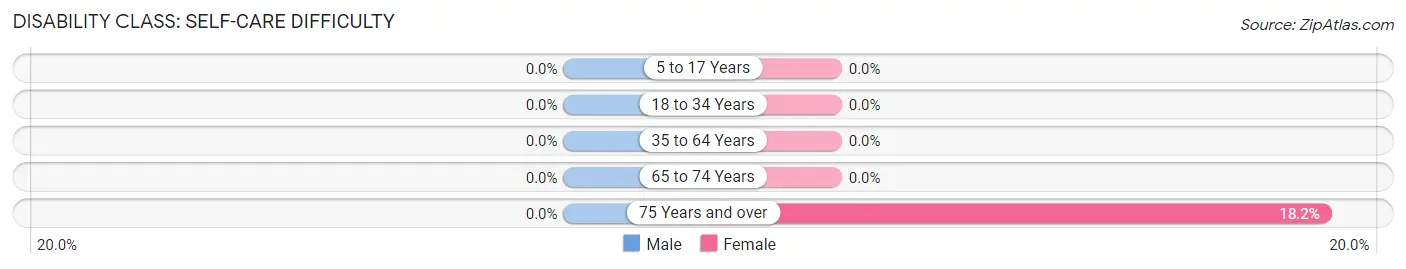
| Age Bracket | Male | Female |
| 5 to 17 Years | 0 (0.0%) | 0 (0.0%) |
| 18 to 34 Years | 0 (0.0%) | 0 (0.0%) |
| 35 to 64 Years | 0 (0.0%) | 0 (0.0%) |
| 65 to 74 Years | 0 (0.0%) | 0 (0.0%) |
| 75 Years and over | 0 (0.0%) | 2 (18.2%) |
Technology Access in Summit
Computing Device Access in Summit
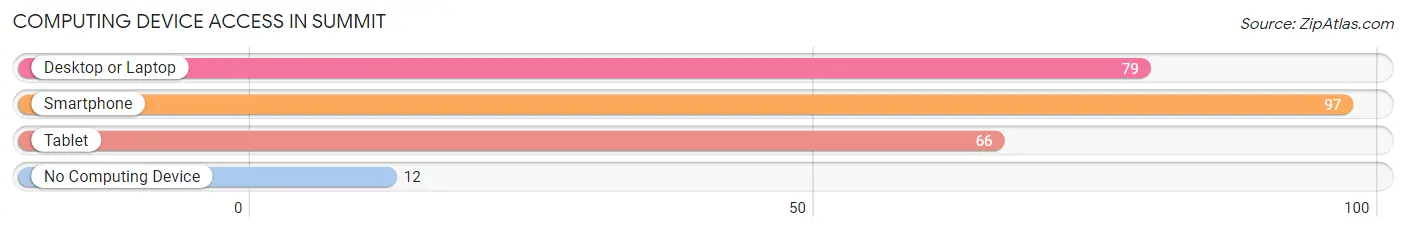
| Device Type | # Households | % Households |
| Desktop or Laptop | 79 | 68.1% |
| Smartphone | 97 | 83.6% |
| Tablet | 66 | 56.9% |
| No Computing Device | 12 | 10.3% |
| Total | 116 | 100.0% |
Internet Access in Summit
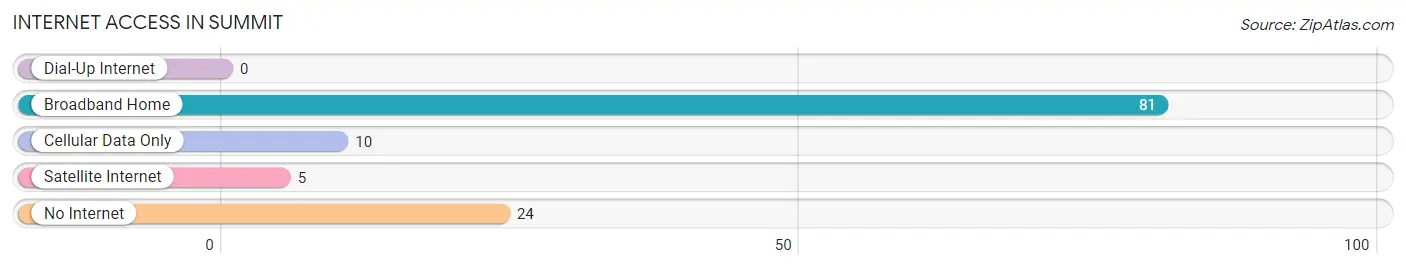
| Internet Type | # Households | % Households |
| Dial-Up Internet | 0 | 0.0% |
| Broadband Home | 81 | 69.8% |
| Cellular Data Only | 10 | 8.6% |
| Satellite Internet | 5 | 4.3% |
| No Internet | 24 | 20.7% |
| Total | 116 | 100.0% |
Summit Summary
Summit is a small unincorporated community located in the Black Hills of South Dakota. It is situated in the northern part of the state, just south of the Wyoming border. The community is located in Pennington County, and is part of the Rapid City, South Dakota Metropolitan Statistical Area.
History
The area that is now Summit was first settled in the late 1800s by homesteaders. The town was originally known as “Summit Station”, and was established in 1887 when the Chicago, Burlington & Quincy Railroad built a line through the area. The town was officially incorporated in 1889, and the name was changed to Summit.
The town was a popular stop for travelers and settlers heading west, and it quickly grew into a bustling community. The town was home to a variety of businesses, including a hotel, saloon, general store, and post office.
In the early 1900s, the town began to decline as the railroad line was abandoned and the population began to move away. The town was eventually abandoned in the 1950s, and the buildings were left to decay.
In the late 1970s, the town was rediscovered by a group of local historians and preservationists. The group worked to restore the town and its buildings, and it was eventually listed on the National Register of Historic Places in 1982.
Today, Summit is a popular tourist destination, and is home to a variety of historic buildings, including the Summit Hotel, the Summit Saloon, and the Summit General Store.
Geography
Summit is located in the northern part of South Dakota, just south of the Wyoming border. The town is situated in the Black Hills region of the state, and is surrounded by rolling hills and forests.
The town is located in Pennington County, and is part of the Rapid City, South Dakota Metropolitan Statistical Area. The nearest major city is Rapid City, which is located about 40 miles to the south.
Economy
Summit is a small, rural community, and the economy is largely based on tourism. The town is home to a variety of historic buildings and attractions, and it is a popular destination for visitors to the Black Hills region.
The town is also home to a few small businesses, including a general store, a restaurant, and a bed and breakfast.
Demographics
As of the 2010 census, the population of Summit was 39. The racial makeup of the town was 100% White. The median household income was $31,250, and the median age was 44.
Conclusion
Summit is a small, unincorporated community located in the Black Hills of South Dakota. The town was established in the late 1800s, and was once a bustling stop for travelers and settlers heading west. Today, the town is a popular tourist destination, and is home to a variety of historic buildings and attractions. The economy of Summit is largely based on tourism, and the town is home to a few small businesses. As of the 2010 census, the population of Summit was 39.
Common Questions
What is Per Capita Income in Summit?
Per Capita income in Summit is $23,023.
What is the Median Family Income in Summit?
Median Family Income in Summit is $88,438.
What is the Median Household income in Summit?
Median Household Income in Summit is $54,375.
What is Income or Wage Gap in Summit?
Income or Wage Gap in Summit is 24.2%.
Women in Summit earn 75.8 cents for every dollar earned by a man.
What is Inequality or Gini Index in Summit?
Inequality or Gini Index in Summit is 0.39.
What is the Total Population of Summit?
Total Population of Summit is 341.
What is the Total Male Population of Summit?
Total Male Population of Summit is 187.
What is the Total Female Population of Summit?
Total Female Population of Summit is 154.
What is the Ratio of Males per 100 Females in Summit?
There are 121.43 Males per 100 Females in Summit.
What is the Ratio of Females per 100 Males in Summit?
There are 82.35 Females per 100 Males in Summit.
What is the Median Population Age in Summit?
Median Population Age in Summit is 28.1 Years.
What is the Average Family Size in Summit
Average Family Size in Summit is 3.6 People.
What is the Average Household Size in Summit
Average Household Size in Summit is 2.9 People.
How Large is the Labor Force in Summit?
There are 173 People in the Labor Forcein in Summit.
What is the Percentage of People in the Labor Force in Summit?
68.1% of People are in the Labor Force in Summit.
What is the Unemployment Rate in Summit?
Unemployment Rate in Summit is 6.4%.