South Shore, SD Map & Demographics
South Shore Map
South Shore Overview
$49,453
PER CAPITA INCOME
$54,896
AVG FAMILY INCOME
$54,821
AVG HOUSEHOLD INCOME
48.5%
WAGE / INCOME GAP [ % ]
51.5¢/ $1
WAGE / INCOME GAP [ $ ]
0.62
INEQUALITY / GINI INDEX
226
TOTAL POPULATION
125
MALE POPULATION
101
FEMALE POPULATION
123.76
MALES / 100 FEMALES
80.80
FEMALES / 100 MALES
52.3
MEDIAN AGE
2.9
AVG FAMILY SIZE
2.1
AVG HOUSEHOLD SIZE
135
LABOR FORCE [ PEOPLE ]
72.2%
PERCENT IN LABOR FORCE
South Shore Zip Codes
South Shore Area Codes
Income in South Shore
Income Overview in South Shore
Per Capita Income in South Shore is $49,453, while median incomes of families and households are $54,896 and $54,821 respectively.
| Characteristic | Number | Measure |
| Per Capita Income | 226 | $49,453 |
| Median Family Income | 55 | $54,896 |
| Mean Family Income | 55 | $59,725 |
| Median Household Income | 106 | $54,821 |
| Mean Household Income | 106 | $107,787 |
| Income Deficit | 55 | $0 |
| Wage / Income Gap (%) | 226 | 48.47% |
| Wage / Income Gap ($) | 226 | 51.53¢ per $1 |
| Gini / Inequality Index | 226 | 0.62 |
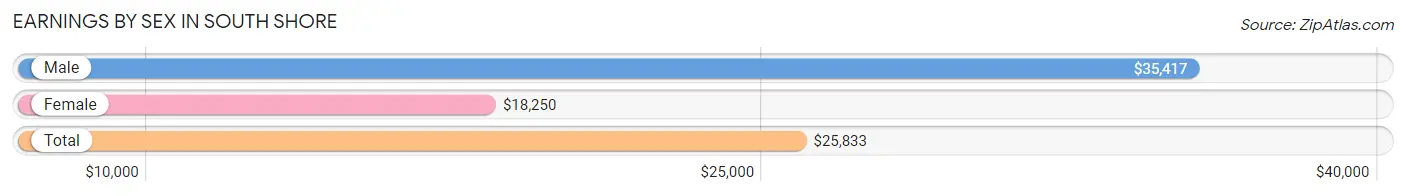
Earnings by Sex in South Shore
Average Earnings in South Shore are $25,833, $35,417 for men and $18,250 for women, a difference of 48.5%.
| Sex | Number | Average Earnings |
| Male | 83 (59.3%) | $35,417 |
| Female | 57 (40.7%) | $18,250 |
| Total | 140 (100.0%) | $25,833 |
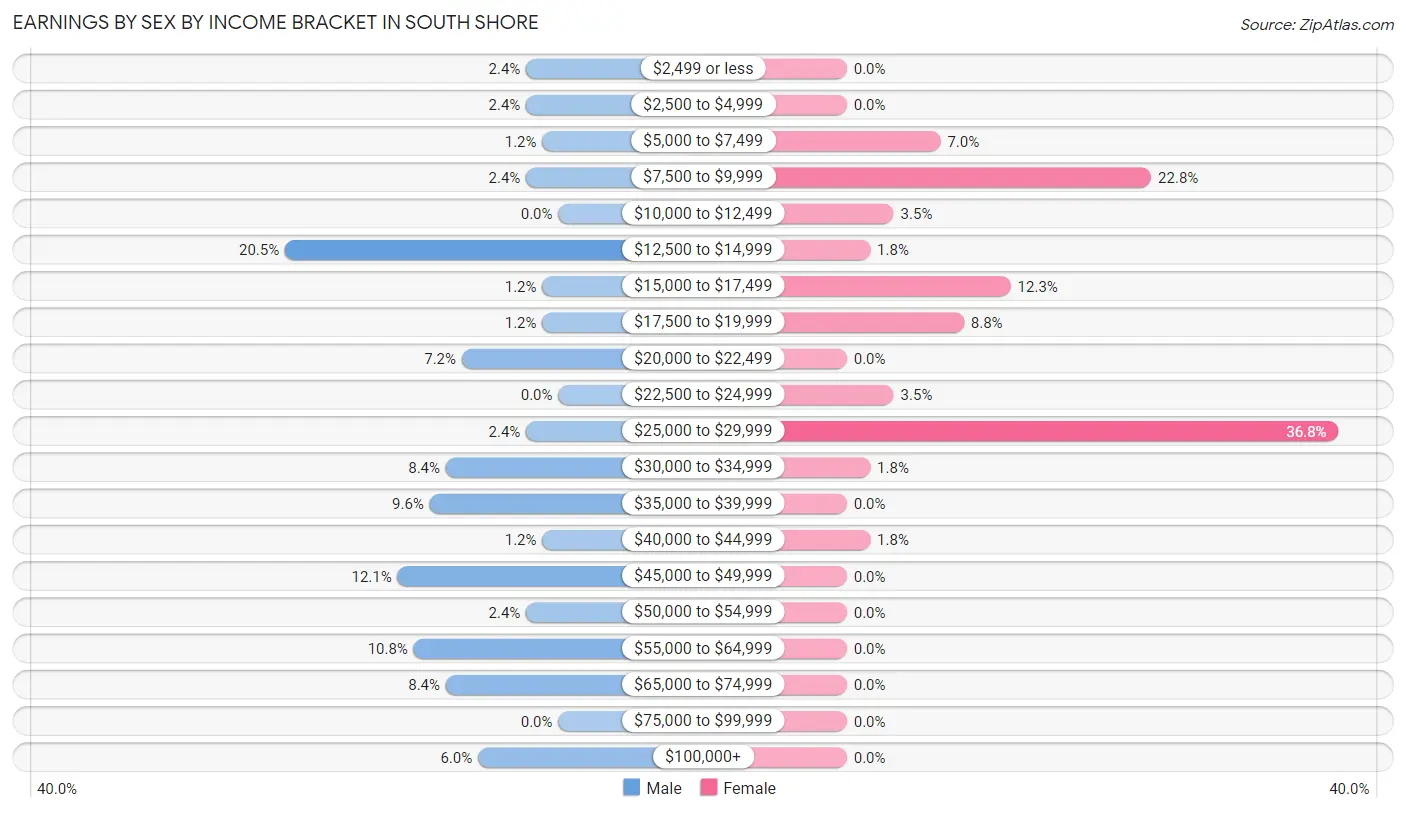
Earnings by Sex by Income Bracket in South Shore
The most common earnings brackets in South Shore are $12,500 to $14,999 for men (17 | 20.5%) and $25,000 to $29,999 for women (21 | 36.8%).
| Income | Male | Female |
| $2,499 or less | 2 (2.4%) | 0 (0.0%) |
| $2,500 to $4,999 | 2 (2.4%) | 0 (0.0%) |
| $5,000 to $7,499 | 1 (1.2%) | 4 (7.0%) |
| $7,500 to $9,999 | 2 (2.4%) | 13 (22.8%) |
| $10,000 to $12,499 | 0 (0.0%) | 2 (3.5%) |
| $12,500 to $14,999 | 17 (20.5%) | 1 (1.8%) |
| $15,000 to $17,499 | 1 (1.2%) | 7 (12.3%) |
| $17,500 to $19,999 | 1 (1.2%) | 5 (8.8%) |
| $20,000 to $22,499 | 6 (7.2%) | 0 (0.0%) |
| $22,500 to $24,999 | 0 (0.0%) | 2 (3.5%) |
| $25,000 to $29,999 | 2 (2.4%) | 21 (36.8%) |
| $30,000 to $34,999 | 7 (8.4%) | 1 (1.8%) |
| $35,000 to $39,999 | 8 (9.6%) | 0 (0.0%) |
| $40,000 to $44,999 | 1 (1.2%) | 1 (1.8%) |
| $45,000 to $49,999 | 10 (12.0%) | 0 (0.0%) |
| $50,000 to $54,999 | 2 (2.4%) | 0 (0.0%) |
| $55,000 to $64,999 | 9 (10.8%) | 0 (0.0%) |
| $65,000 to $74,999 | 7 (8.4%) | 0 (0.0%) |
| $75,000 to $99,999 | 0 (0.0%) | 0 (0.0%) |
| $100,000+ | 5 (6.0%) | 0 (0.0%) |
| Total | 83 (100.0%) | 57 (100.0%) |
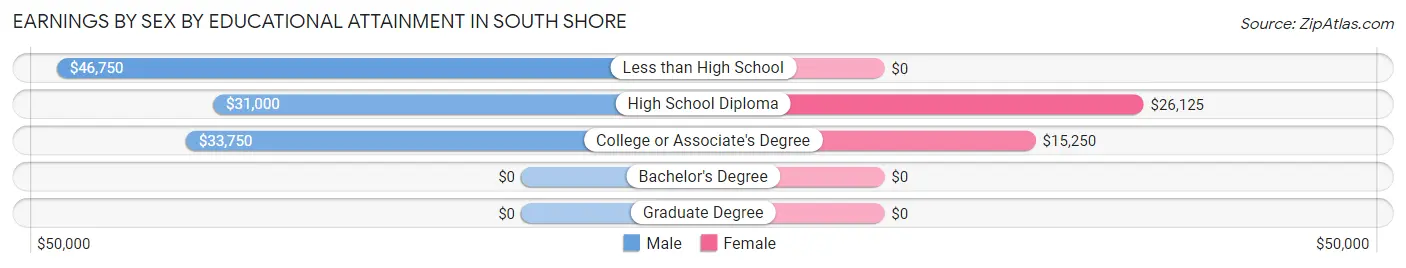
Earnings by Sex by Educational Attainment in South Shore
Average earnings in South Shore are $35,417 for men and $17,500 for women, a difference of 50.6%. Men with an educational attainment of less than high school enjoy the highest average annual earnings of $46,750, while those with high school diploma education earn the least with $31,000. Women with an educational attainment of high school diploma earn the most with the average annual earnings of $26,125, while those with college or associate's degree education have the smallest earnings of $15,250.
| Educational Attainment | Male Income | Female Income |
| Less than High School | $46,750 | $0 |
| High School Diploma | $31,000 | $26,125 |
| College or Associate's Degree | $33,750 | $15,250 |
| Bachelor's Degree | - | - |
| Graduate Degree | - | - |
| Total | $35,417 | $17,500 |
Family Income in South Shore
Family Income Brackets in South Shore
According to the South Shore family income data, there are 27 families falling into the $50,000 to $74,999 income range, which is the most common income bracket and makes up 49.1% of all families.
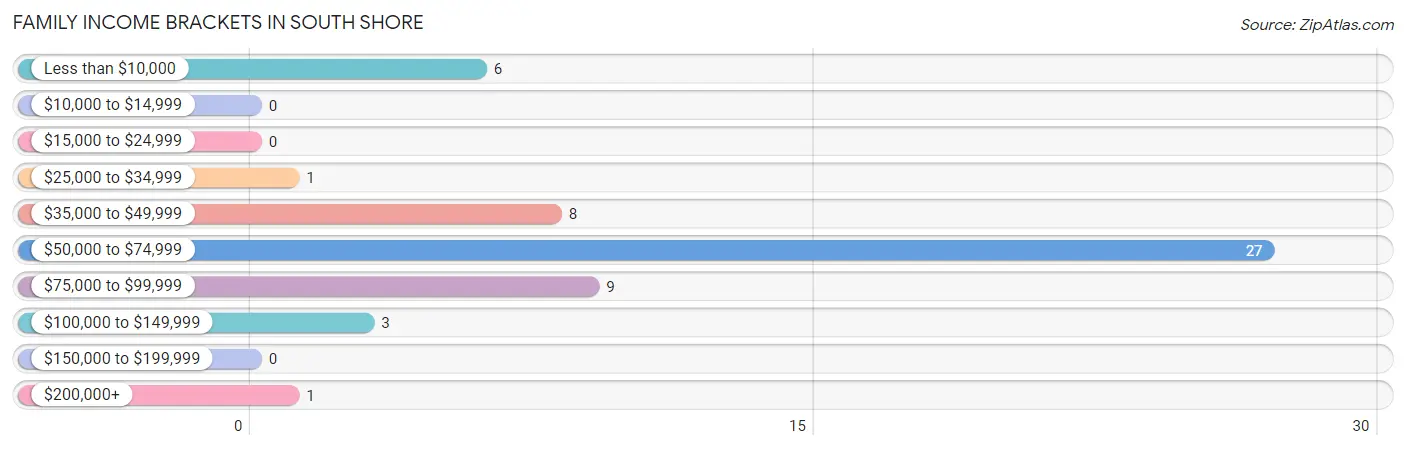
| Income Bracket | # Families | % Families |
| Less than $10,000 | 6 | 10.9% |
| $10,000 to $14,999 | 0 | 0.0% |
| $15,000 to $24,999 | 0 | 0.0% |
| $25,000 to $34,999 | 1 | 1.8% |
| $35,000 to $49,999 | 8 | 14.5% |
| $50,000 to $74,999 | 27 | 49.1% |
| $75,000 to $99,999 | 9 | 16.4% |
| $100,000 to $149,999 | 3 | 5.5% |
| $150,000 to $199,999 | 0 | 0.0% |
| $200,000+ | 1 | 1.8% |
Family Income by Famaliy Size in South Shore
4-person families (10 | 18.2%) account for the highest median family income in South Shore with $58,750 per family, while 2-person families (35 | 63.6%) have the highest median income of $27,443 per family member.
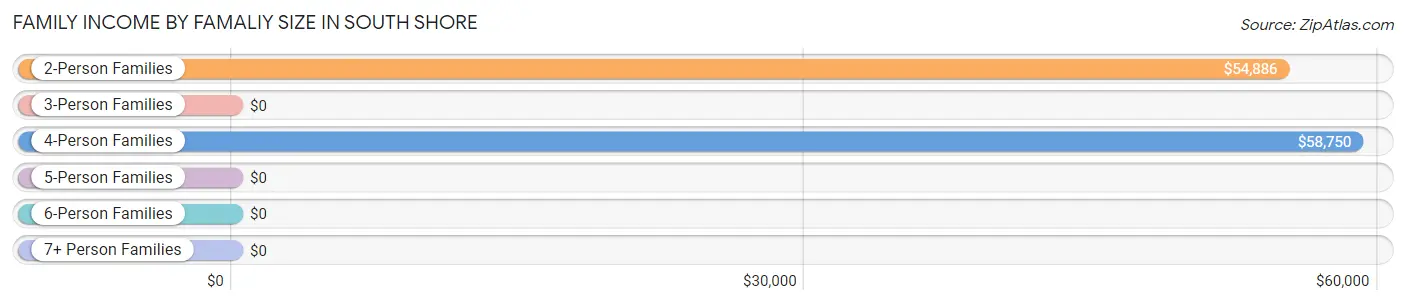
| Income Bracket | # Families | Median Income |
| 2-Person Families | 35 (63.6%) | $54,886 |
| 3-Person Families | 6 (10.9%) | $0 |
| 4-Person Families | 10 (18.2%) | $58,750 |
| 5-Person Families | 1 (1.8%) | $0 |
| 6-Person Families | 3 (5.4%) | $0 |
| 7+ Person Families | 0 (0.0%) | $0 |
| Total | 55 (100.0%) | $54,896 |
Family Income by Number of Earners in South Shore
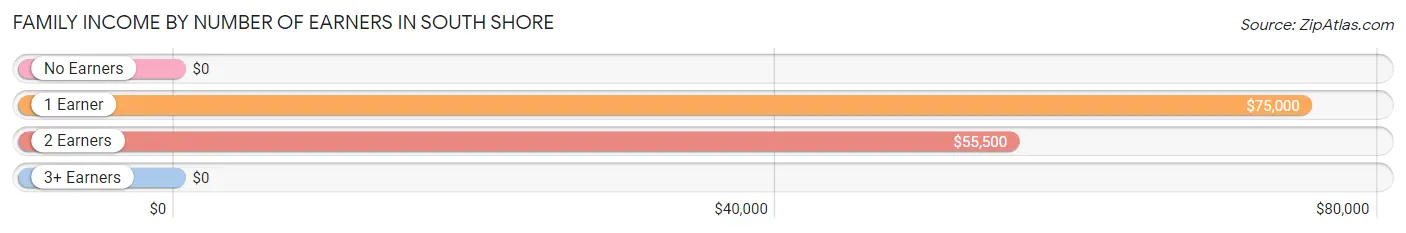
| Number of Earners | # Families | Median Income |
| No Earners | 8 (14.5%) | $0 |
| 1 Earner | 16 (29.1%) | $75,000 |
| 2 Earners | 28 (50.9%) | $55,500 |
| 3+ Earners | 3 (5.4%) | $0 |
| Total | 55 (100.0%) | $54,896 |
Household Income in South Shore
Household Income Brackets in South Shore
With 35 households falling in the category, the $50,000 to $74,999 income range is the most frequent in South Shore, accounting for 33.0% of all households.
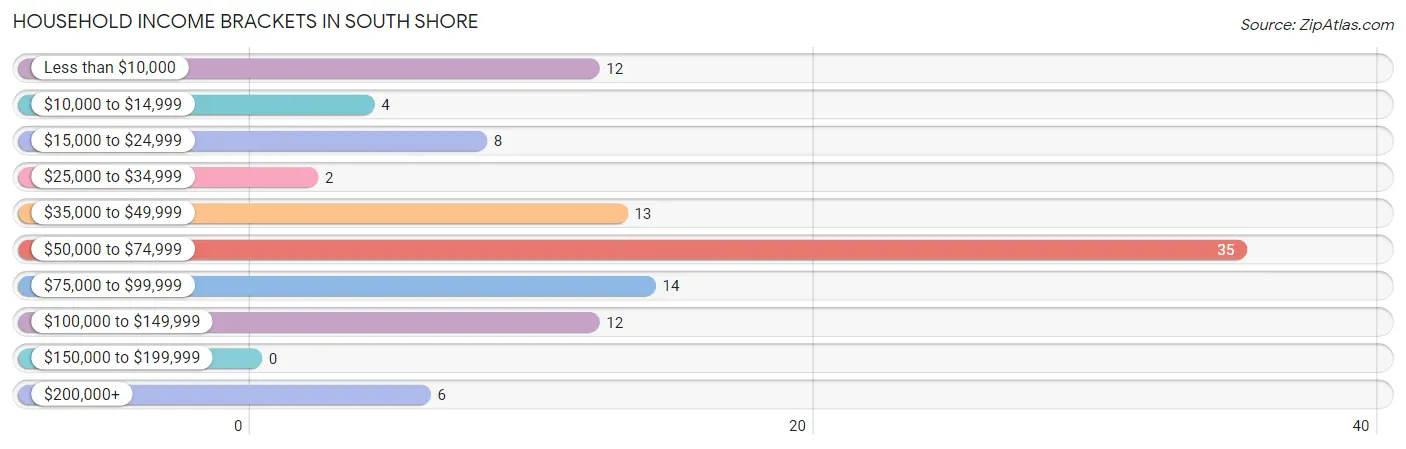
| Income Bracket | # Households | % Households |
| Less than $10,000 | 12 | 11.3% |
| $10,000 to $14,999 | 4 | 3.8% |
| $15,000 to $24,999 | 8 | 7.5% |
| $25,000 to $34,999 | 2 | 1.9% |
| $35,000 to $49,999 | 13 | 12.3% |
| $50,000 to $74,999 | 35 | 33.0% |
| $75,000 to $99,999 | 14 | 13.2% |
| $100,000 to $149,999 | 12 | 11.3% |
| $150,000 to $199,999 | 0 | 0.0% |
| $200,000+ | 6 | 5.7% |
Household Income by Householder Age in South Shore
The median household income in South Shore is $54,821, with the highest median household income of $61,000 found in the 45 to 64 years age bracket for the primary householder. A total of 38 households (35.8%) fall into this category. Meanwhile, the 15 to 24 years age bracket for the primary householder has the lowest median household income of $0, with 4 households (3.8%) in this group.
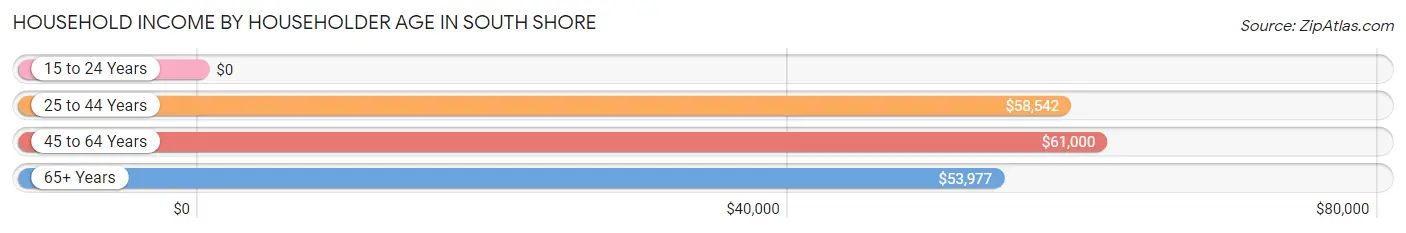
| Income Bracket | # Households | Median Income |
| 15 to 24 Years | 4 (3.8%) | $0 |
| 25 to 44 Years | 21 (19.8%) | $58,542 |
| 45 to 64 Years | 38 (35.8%) | $61,000 |
| 65+ Years | 43 (40.6%) | $53,977 |
| Total | 106 (100.0%) | $54,821 |
Poverty in South Shore
Income Below Poverty by Sex and Age in South Shore
With 12.8% poverty level for males and 32.7% for females among the residents of South Shore, under 5 year old males and under 5 year old females are the most vulnerable to poverty, with 4 males (100.0%) and 4 females (100.0%) in their respective age groups living below the poverty level.
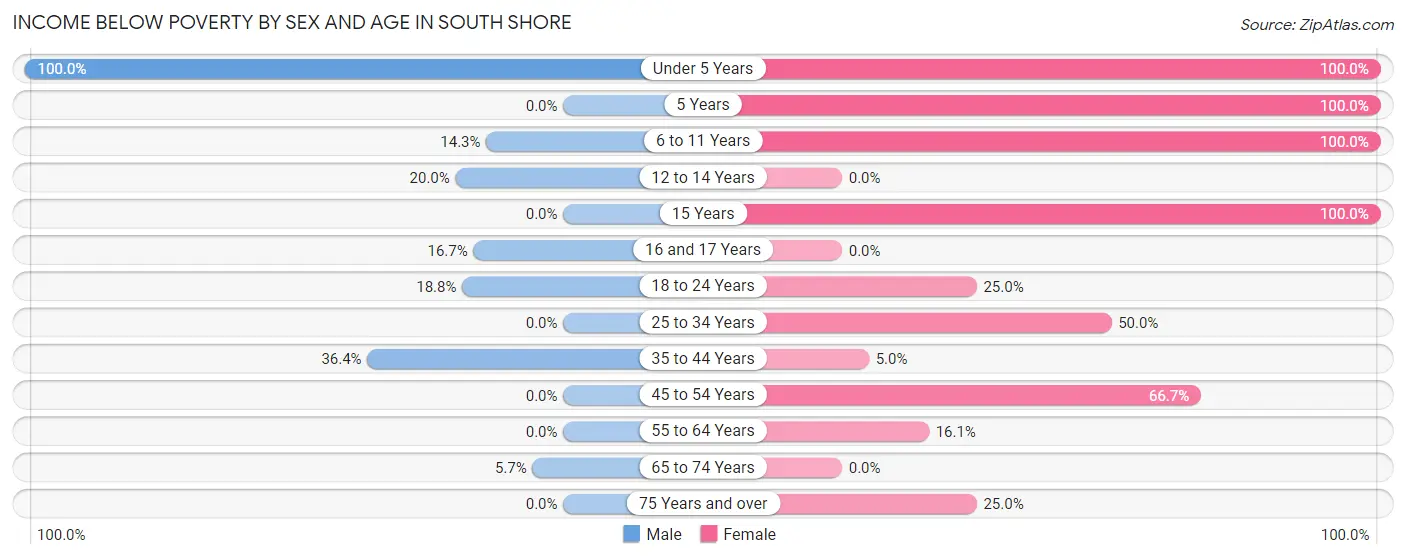
| Age Bracket | Male | Female |
| Under 5 Years | 4 (100.0%) | 4 (100.0%) |
| 5 Years | 0 (0.0%) | 4 (100.0%) |
| 6 to 11 Years | 1 (14.3%) | 8 (100.0%) |
| 12 to 14 Years | 1 (20.0%) | 0 (0.0%) |
| 15 Years | 0 (0.0%) | 1 (100.0%) |
| 16 and 17 Years | 1 (16.7%) | 0 (0.0%) |
| 18 to 24 Years | 3 (18.8%) | 1 (25.0%) |
| 25 to 34 Years | 0 (0.0%) | 2 (50.0%) |
| 35 to 44 Years | 4 (36.4%) | 1 (5.0%) |
| 45 to 54 Years | 0 (0.0%) | 6 (66.7%) |
| 55 to 64 Years | 0 (0.0%) | 5 (16.1%) |
| 65 to 74 Years | 2 (5.7%) | 0 (0.0%) |
| 75 Years and over | 0 (0.0%) | 1 (25.0%) |
| Total | 16 (12.8%) | 33 (32.7%) |
Income Above Poverty by Sex and Age in South Shore
According to the poverty statistics in South Shore, males aged 15 years and females aged 12 to 14 years are the age groups that are most secure financially, with 100.0% of males and 100.0% of females in these age groups living above the poverty line.
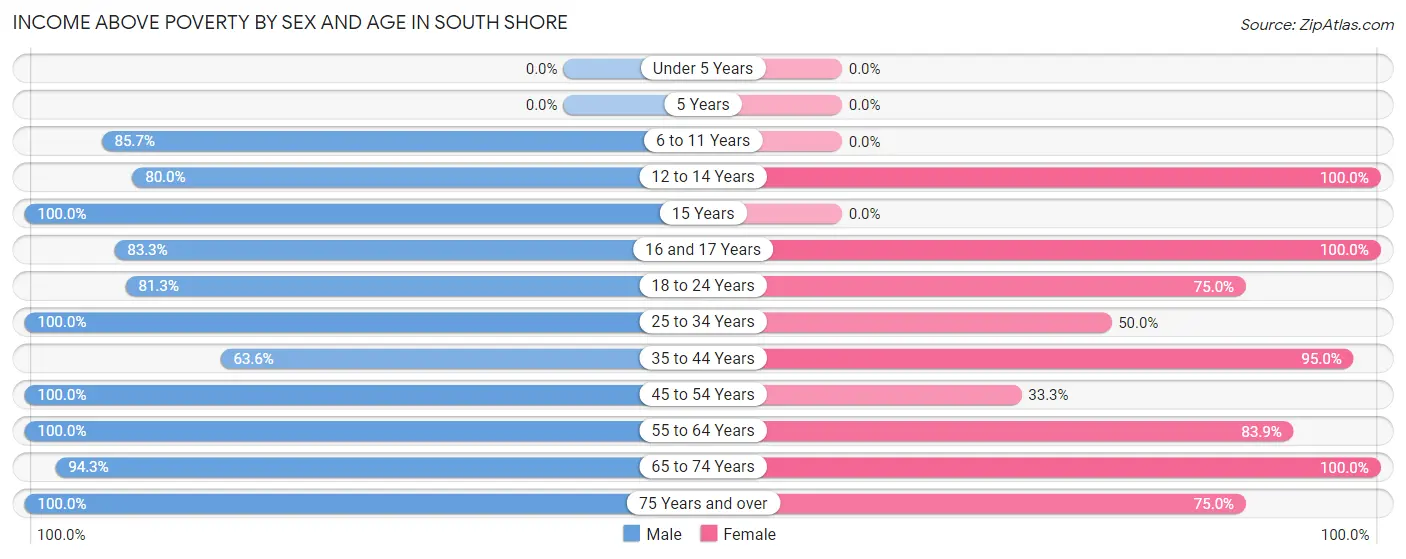
| Age Bracket | Male | Female |
| Under 5 Years | 0 (0.0%) | 0 (0.0%) |
| 5 Years | 0 (0.0%) | 0 (0.0%) |
| 6 to 11 Years | 6 (85.7%) | 0 (0.0%) |
| 12 to 14 Years | 4 (80.0%) | 3 (100.0%) |
| 15 Years | 3 (100.0%) | 0 (0.0%) |
| 16 and 17 Years | 5 (83.3%) | 1 (100.0%) |
| 18 to 24 Years | 13 (81.2%) | 3 (75.0%) |
| 25 to 34 Years | 5 (100.0%) | 2 (50.0%) |
| 35 to 44 Years | 7 (63.6%) | 19 (95.0%) |
| 45 to 54 Years | 13 (100.0%) | 3 (33.3%) |
| 55 to 64 Years | 18 (100.0%) | 26 (83.9%) |
| 65 to 74 Years | 33 (94.3%) | 8 (100.0%) |
| 75 Years and over | 2 (100.0%) | 3 (75.0%) |
| Total | 109 (87.2%) | 68 (67.3%) |
Income Below Poverty Among Married-Couple Families in South Shore
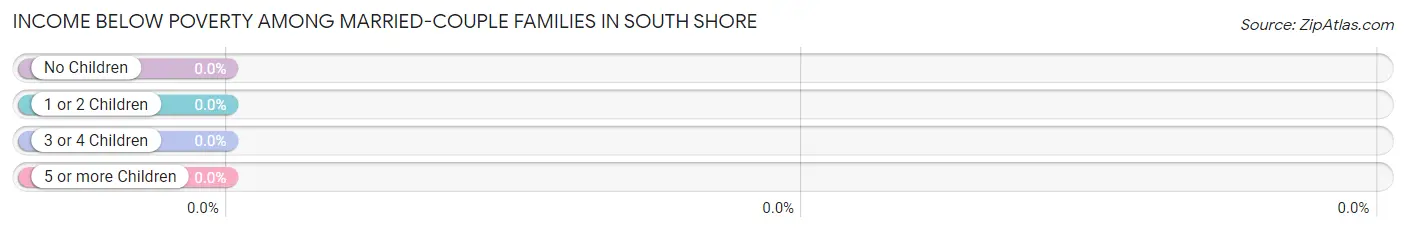
| Children | Above Poverty | Below Poverty |
| No Children | 27 (100.0%) | 0 (0.0%) |
| 1 or 2 Children | 8 (100.0%) | 0 (0.0%) |
| 3 or 4 Children | 1 (100.0%) | 0 (0.0%) |
| 5 or more Children | 0 (0.0%) | 0 (0.0%) |
| Total | 36 (100.0%) | 0 (0.0%) |
Income Below Poverty Among Single-Parent Households in South Shore
According to the poverty data in South Shore, 22.2% or 2 single-father households and 40.0% or 4 single-mother households are living below the poverty line. Among single-father households, those with 1 or 2 children have the highest poverty rate, with 2 households (28.6%) experiencing poverty. Likewise, among single-mother households, those with 1 or 2 children have the highest poverty rate, with 2 households (100.0%) falling below the poverty line.
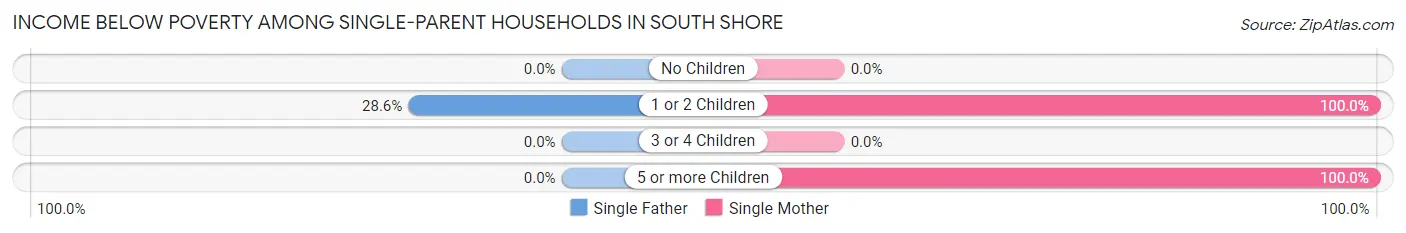
| Children | Single Father | Single Mother |
| No Children | 0 (0.0%) | 0 (0.0%) |
| 1 or 2 Children | 2 (28.6%) | 2 (100.0%) |
| 3 or 4 Children | 0 (0.0%) | 0 (0.0%) |
| 5 or more Children | 0 (0.0%) | 2 (100.0%) |
| Total | 2 (22.2%) | 4 (40.0%) |
Income Below Poverty Among Married-Couple vs Single-Parent Households in South Shore
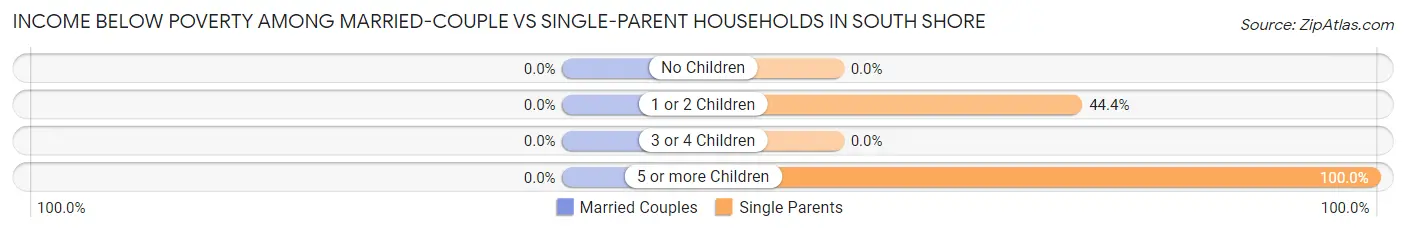
| Children | Married-Couple Families | Single-Parent Households |
| No Children | 0 (0.0%) | 0 (0.0%) |
| 1 or 2 Children | 0 (0.0%) | 4 (44.4%) |
| 3 or 4 Children | 0 (0.0%) | 0 (0.0%) |
| 5 or more Children | 0 (0.0%) | 2 (100.0%) |
| Total | 0 (0.0%) | 6 (31.6%) |
Race in South Shore
The most populous races in South Shore are White / Caucasian (220 | 97.4%), and Native / Alaskan (6 | 2.6%).
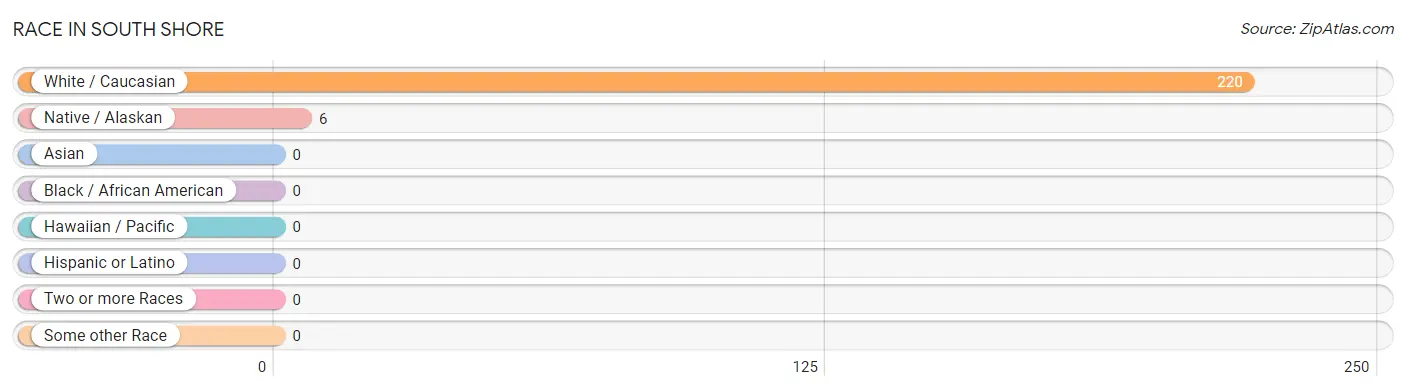
| Race | # Population | % Population |
| Asian | 0 | 0.0% |
| Black / African American | 0 | 0.0% |
| Hawaiian / Pacific | 0 | 0.0% |
| Hispanic or Latino | 0 | 0.0% |
| Native / Alaskan | 6 | 2.6% |
| White / Caucasian | 220 | 97.4% |
| Two or more Races | 0 | 0.0% |
| Some other Race | 0 | 0.0% |
| Total | 226 | 100.0% |
Ancestry in South Shore
The most populous ancestries reported in South Shore are German (134 | 59.3%), Norwegian (72 | 31.9%), Danish (13 | 5.8%), English (11 | 4.9%), and American (7 | 3.1%), together accounting for 104.9% of all South Shore residents.
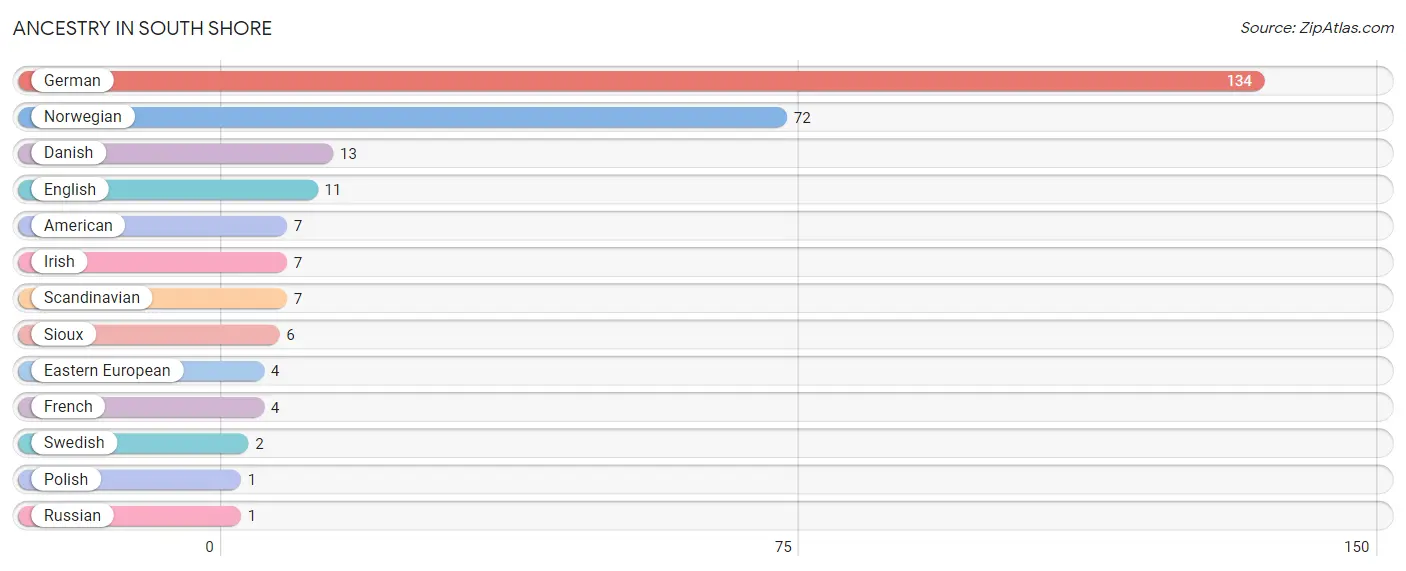
| Ancestry | # Population | % Population |
| American | 7 | 3.1% |
| Danish | 13 | 5.8% |
| Eastern European | 4 | 1.8% |
| English | 11 | 4.9% |
| French | 4 | 1.8% |
| German | 134 | 59.3% |
| Irish | 7 | 3.1% |
| Norwegian | 72 | 31.9% |
| Polish | 1 | 0.4% |
| Russian | 1 | 0.4% |
| Scandinavian | 7 | 3.1% |
| Sioux | 6 | 2.6% |
| Swedish | 2 | 0.9% | View All 13 Rows |
Immigrants in South Shore

| Immigration Origin | # Population | % Population | View All 0 Rows |
Sex and Age in South Shore
Sex and Age in South Shore
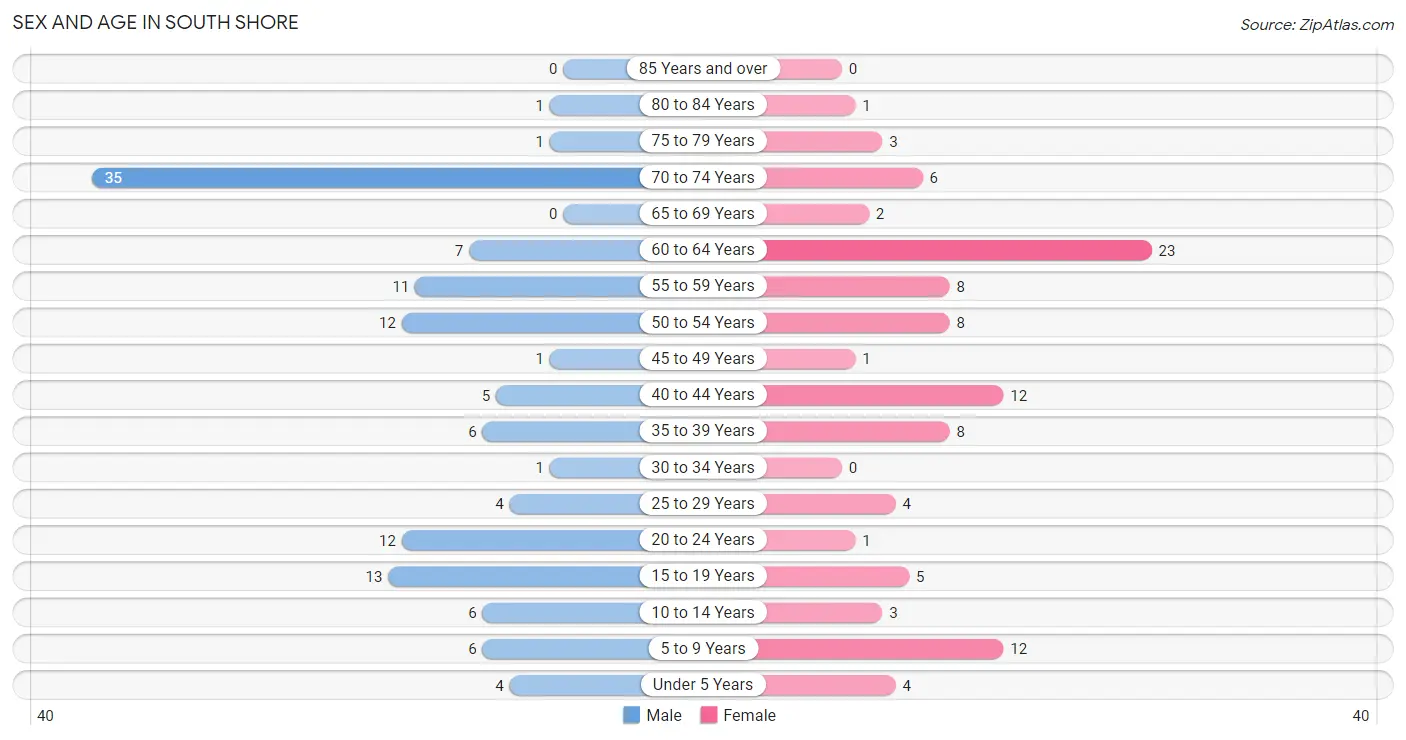
The most populous age groups in South Shore are 70 to 74 Years (35 | 28.0%) for men and 60 to 64 Years (23 | 22.8%) for women.
| Age Bracket | Male | Female |
| Under 5 Years | 4 (3.2%) | 4 (4.0%) |
| 5 to 9 Years | 6 (4.8%) | 12 (11.9%) |
| 10 to 14 Years | 6 (4.8%) | 3 (3.0%) |
| 15 to 19 Years | 13 (10.4%) | 5 (5.0%) |
| 20 to 24 Years | 12 (9.6%) | 1 (1.0%) |
| 25 to 29 Years | 4 (3.2%) | 4 (4.0%) |
| 30 to 34 Years | 1 (0.8%) | 0 (0.0%) |
| 35 to 39 Years | 6 (4.8%) | 8 (7.9%) |
| 40 to 44 Years | 5 (4.0%) | 12 (11.9%) |
| 45 to 49 Years | 1 (0.8%) | 1 (1.0%) |
| 50 to 54 Years | 12 (9.6%) | 8 (7.9%) |
| 55 to 59 Years | 11 (8.8%) | 8 (7.9%) |
| 60 to 64 Years | 7 (5.6%) | 23 (22.8%) |
| 65 to 69 Years | 0 (0.0%) | 2 (2.0%) |
| 70 to 74 Years | 35 (28.0%) | 6 (5.9%) |
| 75 to 79 Years | 1 (0.8%) | 3 (3.0%) |
| 80 to 84 Years | 1 (0.8%) | 1 (1.0%) |
| 85 Years and over | 0 (0.0%) | 0 (0.0%) |
| Total | 125 (100.0%) | 101 (100.0%) |
Families and Households in South Shore
Median Family Size in South Shore
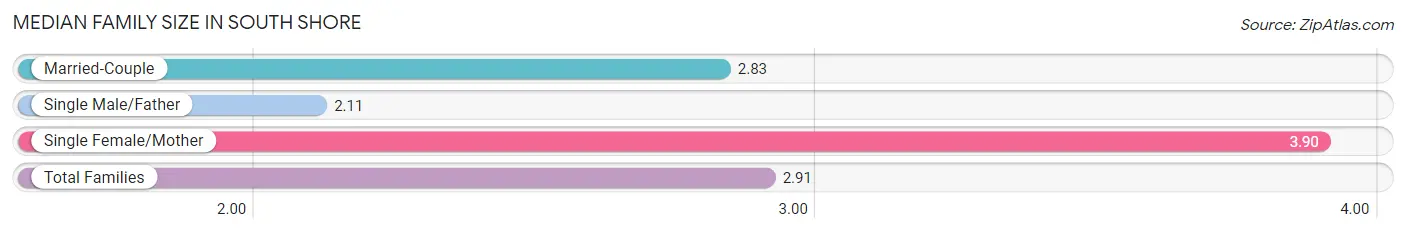
The median family size in South Shore is 2.91 persons per family, with single female/mother families (10 | 18.2%) accounting for the largest median family size of 3.9 persons per family. On the other hand, single male/father families (9 | 16.4%) represent the smallest median family size with 2.11 persons per family.
| Family Type | # Families | Family Size |
| Married-Couple | 36 (65.4%) | 2.83 |
| Single Male/Father | 9 (16.4%) | 2.11 |
| Single Female/Mother | 10 (18.2%) | 3.90 |
| Total Families | 55 (100.0%) | 2.91 |
Median Household Size in South Shore
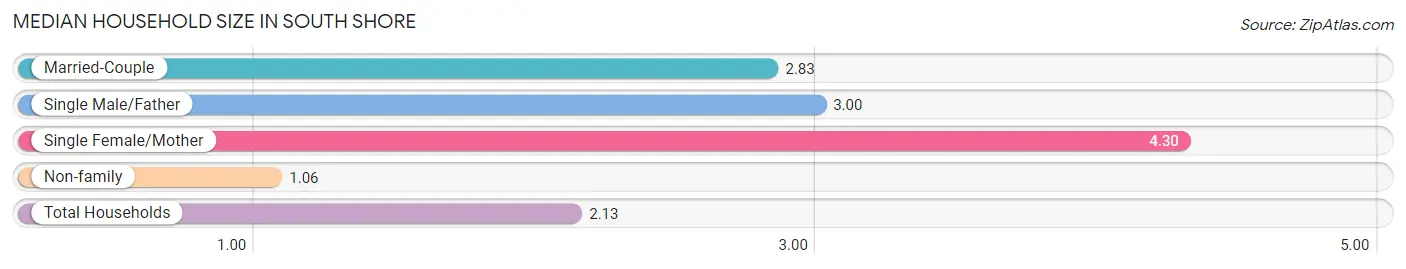
The median household size in South Shore is 2.13 persons per household, with single female/mother households (10 | 9.4%) accounting for the largest median household size of 4.3 persons per household. non-family households (51 | 48.1%) represent the smallest median household size with 1.06 persons per household.
| Household Type | # Households | Household Size |
| Married-Couple | 36 (34.0%) | 2.83 |
| Single Male/Father | 9 (8.5%) | 3.00 |
| Single Female/Mother | 10 (9.4%) | 4.30 |
| Non-family | 51 (48.1%) | 1.06 |
| Total Households | 106 (100.0%) | 2.13 |
Household Size by Marriage Status in South Shore
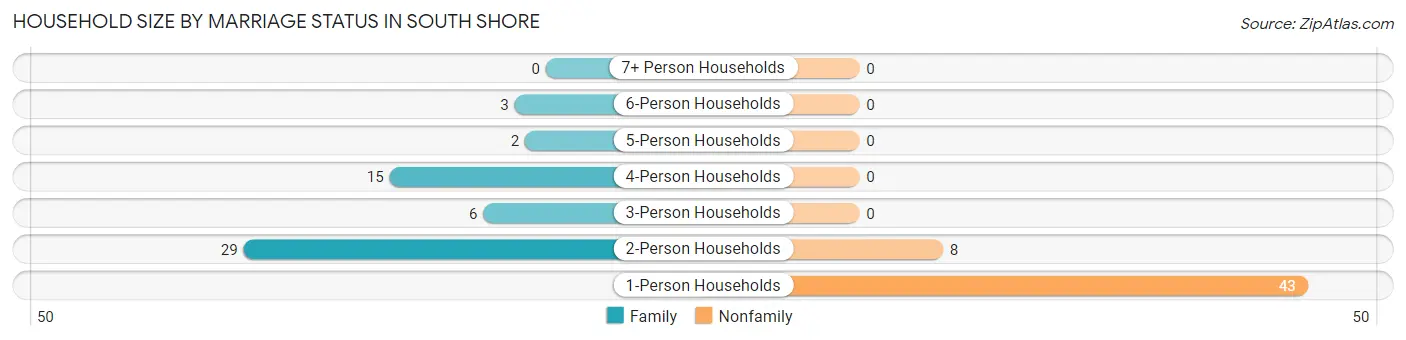
Out of a total of 106 households in South Shore, 55 (51.9%) are family households, while 51 (48.1%) are nonfamily households. The most numerous type of family households are 2-person households, comprising 29, and the most common type of nonfamily households are 1-person households, comprising 43.
| Household Size | Family Households | Nonfamily Households |
| 1-Person Households | - | 43 (40.6%) |
| 2-Person Households | 29 (27.4%) | 8 (7.5%) |
| 3-Person Households | 6 (5.7%) | 0 (0.0%) |
| 4-Person Households | 15 (14.1%) | 0 (0.0%) |
| 5-Person Households | 2 (1.9%) | 0 (0.0%) |
| 6-Person Households | 3 (2.8%) | 0 (0.0%) |
| 7+ Person Households | 0 (0.0%) | 0 (0.0%) |
| Total | 55 (51.9%) | 51 (48.1%) |
Female Fertility in South Shore
Fertility by Age in South Shore
| Age Bracket | Women with Births | Births / 1,000 Women |
| 15 to 19 years | 0 (0.0%) | 0.0 |
| 20 to 34 years | 0 (0.0%) | 0.0 |
| 35 to 50 years | 0 (0.0%) | 0.0 |
| Total | 0 (0.0%) | 0.0 |
Fertility by Age by Marriage Status in South Shore
| Age Bracket | Married | Unmarried |
| 15 to 19 years | 0 (0.0%) | 0 (0.0%) |
| 20 to 34 years | 0 (0.0%) | 0 (0.0%) |
| 35 to 50 years | 0 (0.0%) | 0 (0.0%) |
| Total | 0 (0.0%) | 0 (0.0%) |
Fertility by Education in South Shore
| Educational Attainment | Women with Births | Births / 1,000 Women |
| Less than High School | 0 (0.0%) | 0.0 |
| High School Diploma | 0 (0.0%) | 0.0 |
| College or Associate's Degree | 0 (0.0%) | 0.0 |
| Bachelor's Degree | 0 (0.0%) | 0.0 |
| Graduate Degree | 0 (0.0%) | 0.0 |
| Total | 0 (0.0%) | 0.0 |
Fertility by Education by Marriage Status in South Shore
| Educational Attainment | Married | Unmarried |
| Less than High School | 0 (0.0%) | 0 (0.0%) |
| High School Diploma | 0 (0.0%) | 0 (0.0%) |
| College or Associate's Degree | 0 (0.0%) | 0 (0.0%) |
| Bachelor's Degree | 0 (0.0%) | 0 (0.0%) |
| Graduate Degree | 0 (0.0%) | 0 (0.0%) |
| Total | 0 (0.0%) | 0 (0.0%) |
Employment Characteristics in South Shore
Employment by Class of Employer in South Shore
Among the 135 employed individuals in South Shore, private company employees (106 | 78.5%), self-employed (not incorporated) (20 | 14.8%), and state government employees (4 | 3.0%) make up the most common classes of employment.
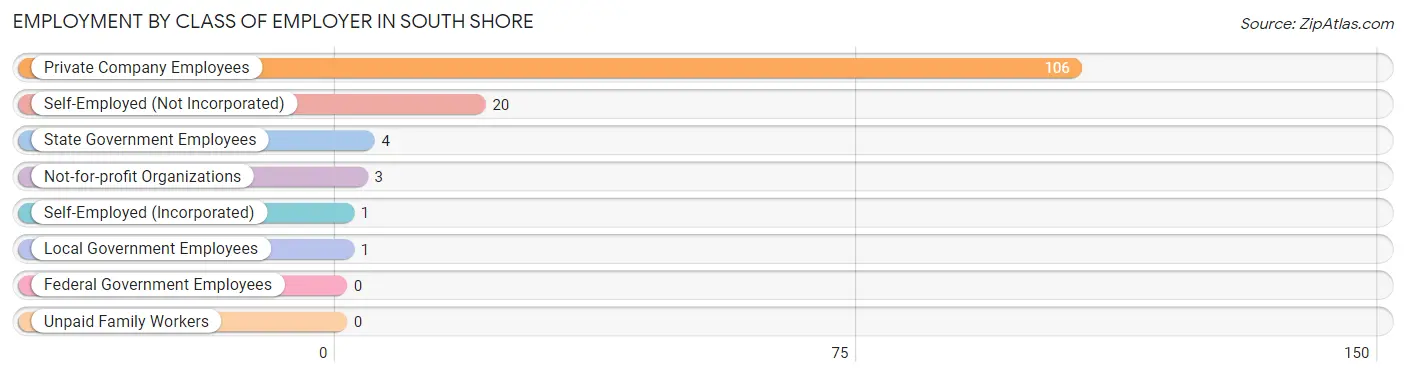
| Employer Class | # Employees | % Employees |
| Private Company Employees | 106 | 78.5% |
| Self-Employed (Incorporated) | 1 | 0.7% |
| Self-Employed (Not Incorporated) | 20 | 14.8% |
| Not-for-profit Organizations | 3 | 2.2% |
| Local Government Employees | 1 | 0.7% |
| State Government Employees | 4 | 3.0% |
| Federal Government Employees | 0 | 0.0% |
| Unpaid Family Workers | 0 | 0.0% |
| Total | 135 | 100.0% |
Employment Status by Age in South Shore
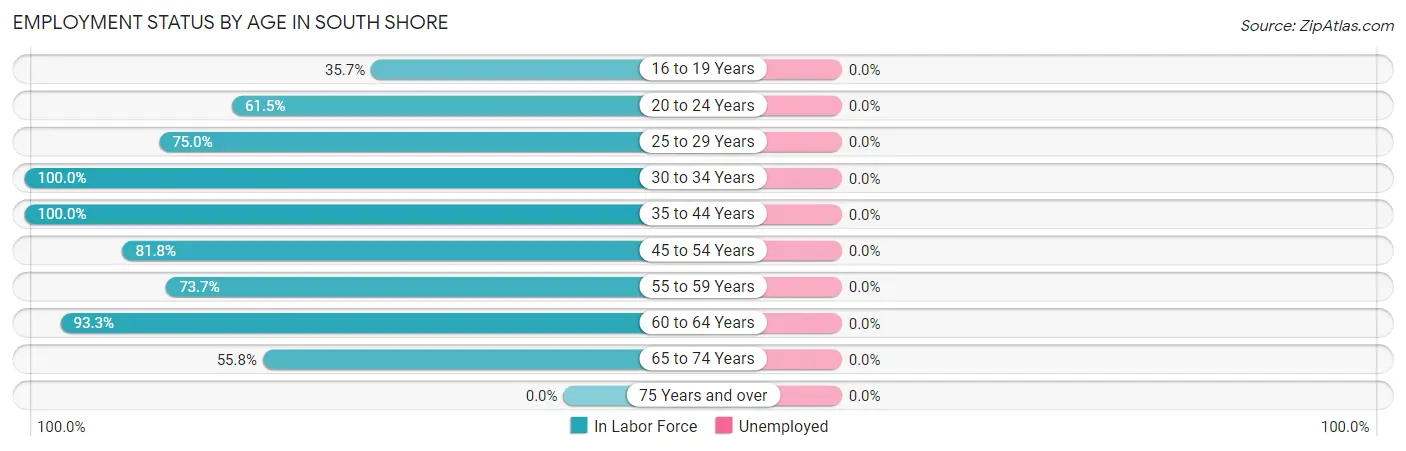
| Age Bracket | In Labor Force | Unemployed |
| 16 to 19 Years | 5 (35.7%) | 0 (0.0%) |
| 20 to 24 Years | 8 (61.5%) | 0 (0.0%) |
| 25 to 29 Years | 6 (75.0%) | 0 (0.0%) |
| 30 to 34 Years | 1 (100.0%) | 0 (0.0%) |
| 35 to 44 Years | 31 (100.0%) | 0 (0.0%) |
| 45 to 54 Years | 18 (81.8%) | 0 (0.0%) |
| 55 to 59 Years | 14 (73.7%) | 0 (0.0%) |
| 60 to 64 Years | 28 (93.3%) | 0 (0.0%) |
| 65 to 74 Years | 24 (55.8%) | 0 (0.0%) |
| 75 Years and over | 0 (0.0%) | 0 (0.0%) |
| Total | 135 (72.2%) | 0 (0.0%) |
Employment Status by Educational Attainment in South Shore
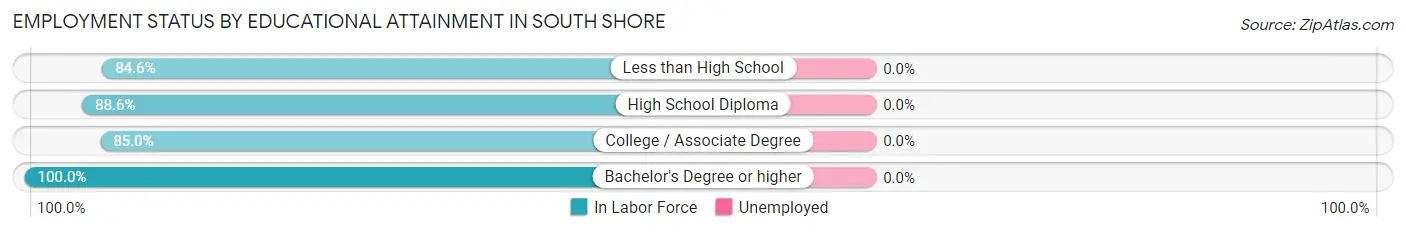
| Educational Attainment | In Labor Force | Unemployed |
| Less than High School | 11 (84.6%) | 0 (0.0%) |
| High School Diploma | 39 (88.6%) | 0 (0.0%) |
| College / Associate Degree | 34 (85.0%) | 0 (0.0%) |
| Bachelor's Degree or higher | 14 (100.0%) | 0 (0.0%) |
| Total | 98 (88.3%) | 0 (0.0%) |
Employment Occupations by Sex in South Shore
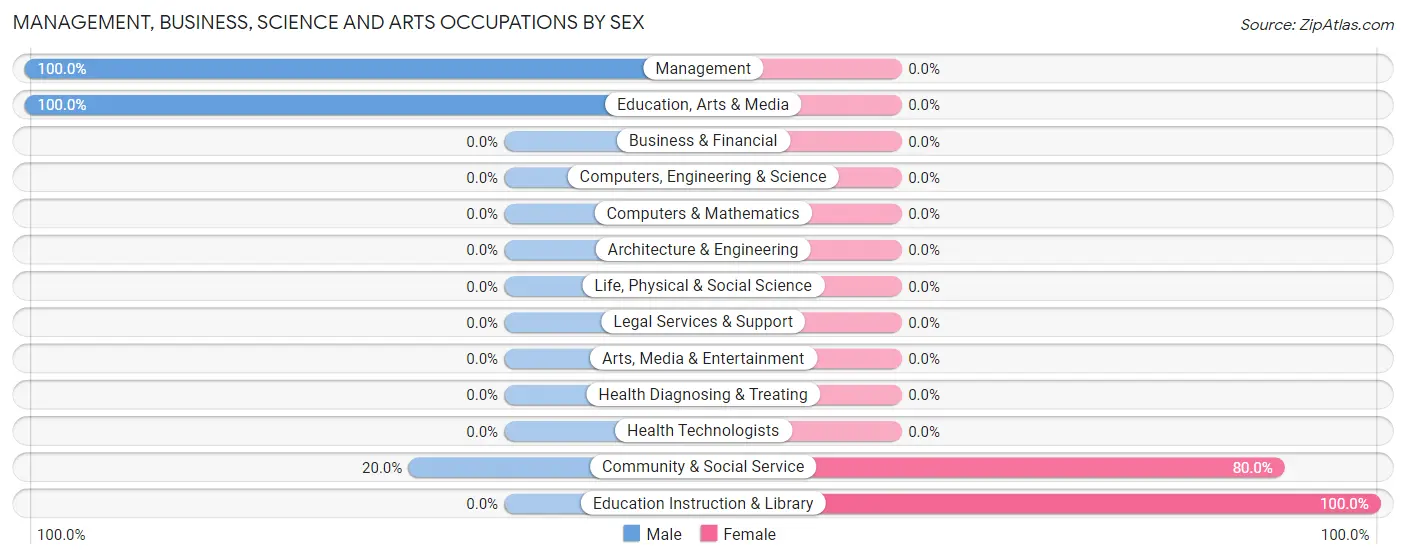
Management, Business, Science and Arts Occupations
The most common Management, Business, Science and Arts occupations in South Shore are Management (6 | 4.4%), Community & Social Service (5 | 3.7%), Education Instruction & Library (4 | 3.0%), and Education, Arts & Media (1 | 0.7%).
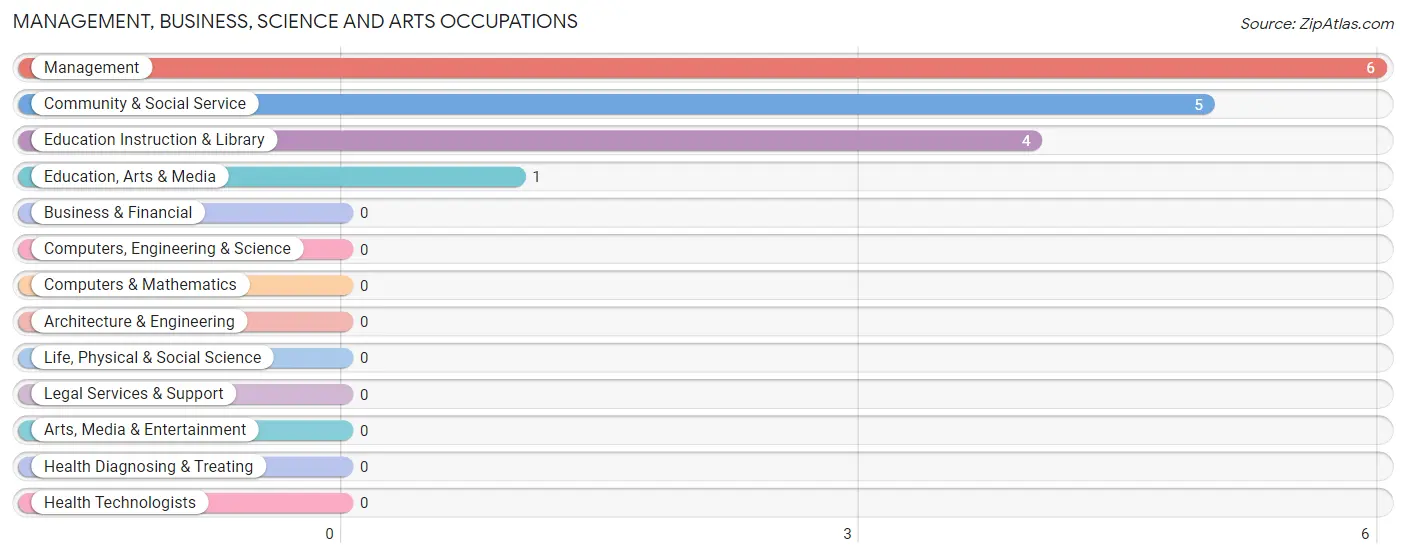
Management, Business, Science and Arts Occupations by Sex
Within the Management, Business, Science and Arts occupations in South Shore, the most male-oriented occupations are Management (100.0%), Education, Arts & Media (100.0%), and Community & Social Service (20.0%), while the most female-oriented occupations are Education Instruction & Library (100.0%), and Community & Social Service (80.0%).
| Occupation | Male | Female |
| Management | 6 (100.0%) | 0 (0.0%) |
| Business & Financial | 0 (0.0%) | 0 (0.0%) |
| Computers, Engineering & Science | 0 (0.0%) | 0 (0.0%) |
| Computers & Mathematics | 0 (0.0%) | 0 (0.0%) |
| Architecture & Engineering | 0 (0.0%) | 0 (0.0%) |
| Life, Physical & Social Science | 0 (0.0%) | 0 (0.0%) |
| Community & Social Service | 1 (20.0%) | 4 (80.0%) |
| Education, Arts & Media | 1 (100.0%) | 0 (0.0%) |
| Legal Services & Support | 0 (0.0%) | 0 (0.0%) |
| Education Instruction & Library | 0 (0.0%) | 4 (100.0%) |
| Arts, Media & Entertainment | 0 (0.0%) | 0 (0.0%) |
| Health Diagnosing & Treating | 0 (0.0%) | 0 (0.0%) |
| Health Technologists | 0 (0.0%) | 0 (0.0%) |
| Total (Category) | 7 (63.6%) | 4 (36.4%) |
| Total (Overall) | 79 (58.5%) | 56 (41.5%) |
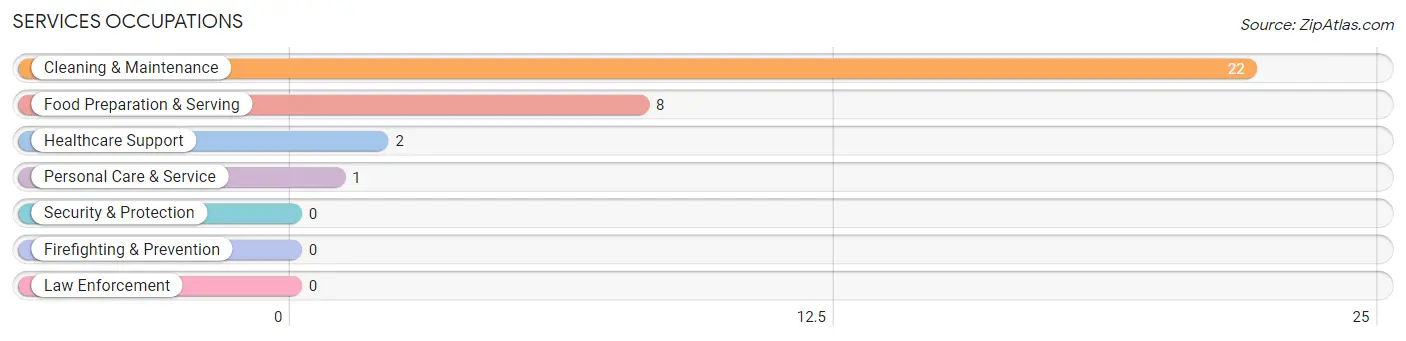
Services Occupations
The most common Services occupations in South Shore are Cleaning & Maintenance (22 | 16.3%), Food Preparation & Serving (8 | 5.9%), Healthcare Support (2 | 1.5%), and Personal Care & Service (1 | 0.7%).
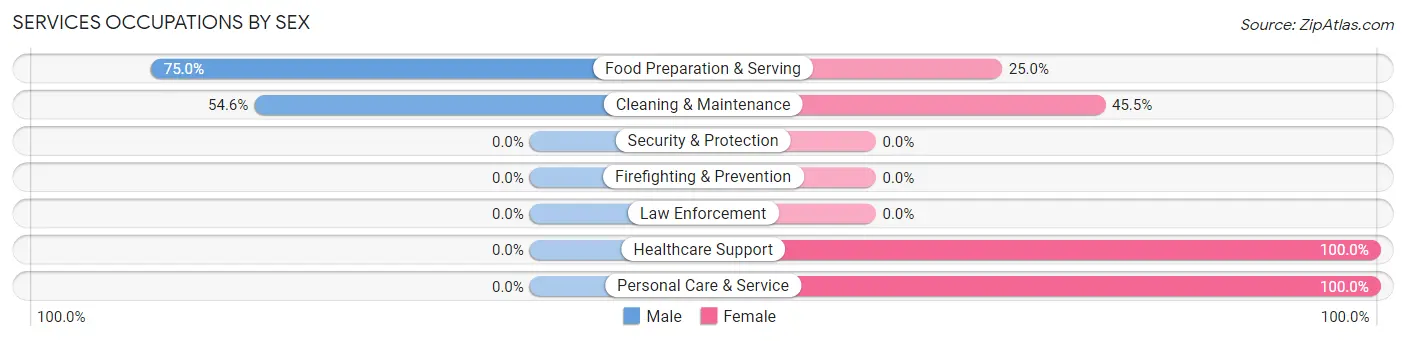
Services Occupations by Sex
Within the Services occupations in South Shore, the most male-oriented occupations are Food Preparation & Serving (75.0%), and Cleaning & Maintenance (54.5%), while the most female-oriented occupations are Healthcare Support (100.0%), Personal Care & Service (100.0%), and Cleaning & Maintenance (45.5%).
| Occupation | Male | Female |
| Healthcare Support | 0 (0.0%) | 2 (100.0%) |
| Security & Protection | 0 (0.0%) | 0 (0.0%) |
| Firefighting & Prevention | 0 (0.0%) | 0 (0.0%) |
| Law Enforcement | 0 (0.0%) | 0 (0.0%) |
| Food Preparation & Serving | 6 (75.0%) | 2 (25.0%) |
| Cleaning & Maintenance | 12 (54.5%) | 10 (45.5%) |
| Personal Care & Service | 0 (0.0%) | 1 (100.0%) |
| Total (Category) | 18 (54.5%) | 15 (45.5%) |
| Total (Overall) | 79 (58.5%) | 56 (41.5%) |
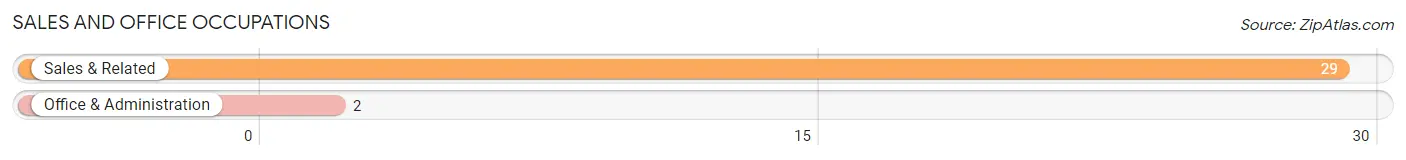
Sales and Office Occupations
The most common Sales and Office occupations in South Shore are Sales & Related (29 | 21.5%), and Office & Administration (2 | 1.5%).
Sales and Office Occupations by Sex
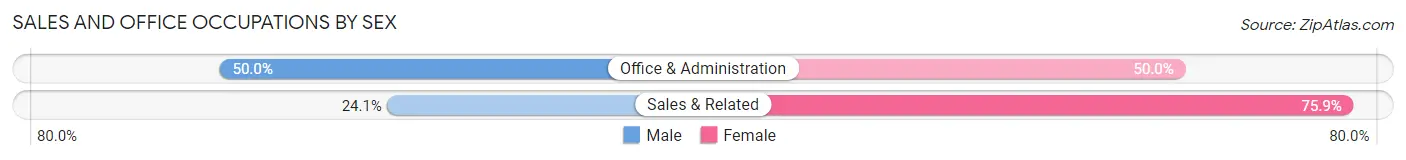
| Occupation | Male | Female |
| Sales & Related | 7 (24.1%) | 22 (75.9%) |
| Office & Administration | 1 (50.0%) | 1 (50.0%) |
| Total (Category) | 8 (25.8%) | 23 (74.2%) |
| Total (Overall) | 79 (58.5%) | 56 (41.5%) |
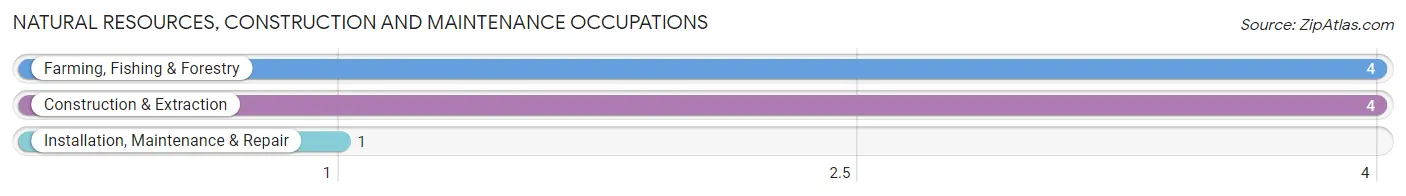
Natural Resources, Construction and Maintenance Occupations
The most common Natural Resources, Construction and Maintenance occupations in South Shore are Farming, Fishing & Forestry (4 | 3.0%), Construction & Extraction (4 | 3.0%), and Installation, Maintenance & Repair (1 | 0.7%).
Natural Resources, Construction and Maintenance Occupations by Sex
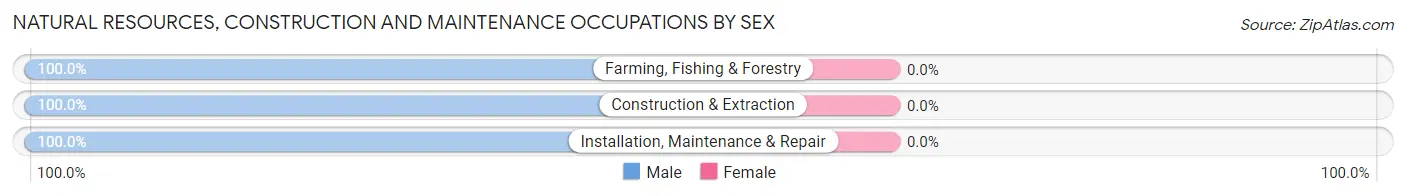
| Occupation | Male | Female |
| Farming, Fishing & Forestry | 4 (100.0%) | 0 (0.0%) |
| Construction & Extraction | 4 (100.0%) | 0 (0.0%) |
| Installation, Maintenance & Repair | 1 (100.0%) | 0 (0.0%) |
| Total (Category) | 9 (100.0%) | 0 (0.0%) |
| Total (Overall) | 79 (58.5%) | 56 (41.5%) |
Production, Transportation and Moving Occupations
The most common Production, Transportation and Moving occupations in South Shore are Material Moving (27 | 20.0%), Production (12 | 8.9%), and Transportation (12 | 8.9%).
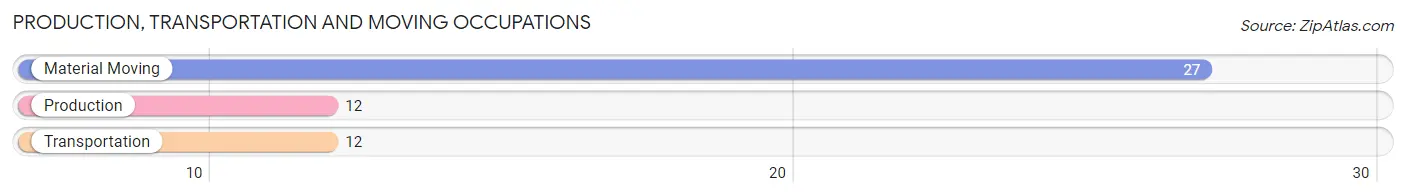
Production, Transportation and Moving Occupations by Sex
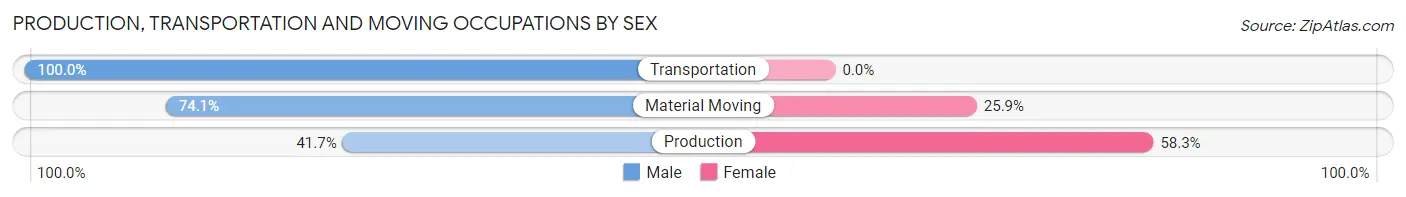
| Occupation | Male | Female |
| Production | 5 (41.7%) | 7 (58.3%) |
| Transportation | 12 (100.0%) | 0 (0.0%) |
| Material Moving | 20 (74.1%) | 7 (25.9%) |
| Total (Category) | 37 (72.6%) | 14 (27.5%) |
| Total (Overall) | 79 (58.5%) | 56 (41.5%) |
Employment Industries by Sex in South Shore
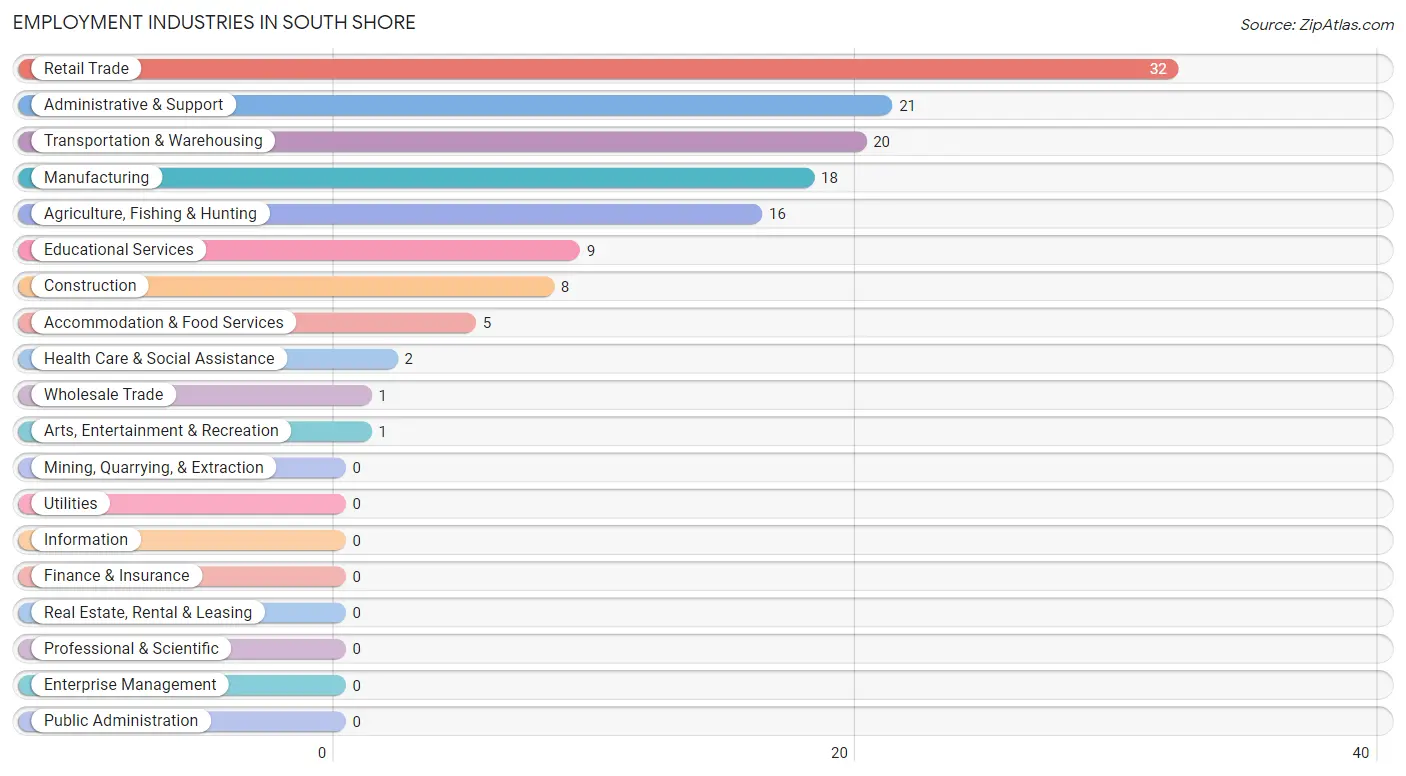
Employment Industries in South Shore
The major employment industries in South Shore include Retail Trade (32 | 23.7%), Administrative & Support (21 | 15.6%), Transportation & Warehousing (20 | 14.8%), Manufacturing (18 | 13.3%), and Agriculture, Fishing & Hunting (16 | 11.8%).
Employment Industries by Sex in South Shore
The South Shore industries that see more men than women are Agriculture, Fishing & Hunting (100.0%), Construction (100.0%), and Wholesale Trade (100.0%), whereas the industries that tend to have a higher number of women are Health Care & Social Assistance (100.0%), Educational Services (77.8%), and Retail Trade (75.0%).
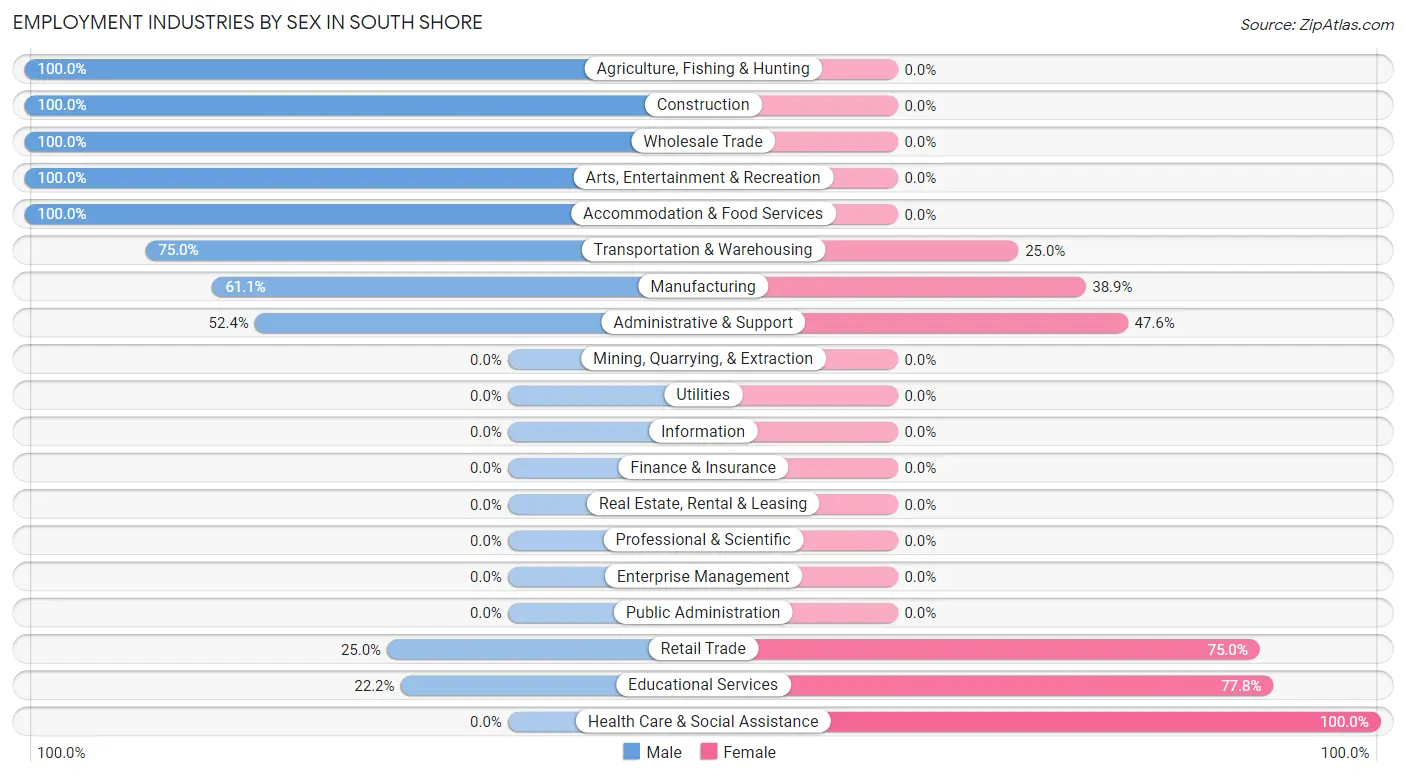
| Industry | Male | Female |
| Agriculture, Fishing & Hunting | 16 (100.0%) | 0 (0.0%) |
| Mining, Quarrying, & Extraction | 0 (0.0%) | 0 (0.0%) |
| Construction | 8 (100.0%) | 0 (0.0%) |
| Manufacturing | 11 (61.1%) | 7 (38.9%) |
| Wholesale Trade | 1 (100.0%) | 0 (0.0%) |
| Retail Trade | 8 (25.0%) | 24 (75.0%) |
| Transportation & Warehousing | 15 (75.0%) | 5 (25.0%) |
| Utilities | 0 (0.0%) | 0 (0.0%) |
| Information | 0 (0.0%) | 0 (0.0%) |
| Finance & Insurance | 0 (0.0%) | 0 (0.0%) |
| Real Estate, Rental & Leasing | 0 (0.0%) | 0 (0.0%) |
| Professional & Scientific | 0 (0.0%) | 0 (0.0%) |
| Enterprise Management | 0 (0.0%) | 0 (0.0%) |
| Administrative & Support | 11 (52.4%) | 10 (47.6%) |
| Educational Services | 2 (22.2%) | 7 (77.8%) |
| Health Care & Social Assistance | 0 (0.0%) | 2 (100.0%) |
| Arts, Entertainment & Recreation | 1 (100.0%) | 0 (0.0%) |
| Accommodation & Food Services | 5 (100.0%) | 0 (0.0%) |
| Public Administration | 0 (0.0%) | 0 (0.0%) |
| Total | 79 (58.5%) | 56 (41.5%) |
Education in South Shore
School Enrollment in South Shore
The most common levels of schooling among the 45 students in South Shore are elementary school (14 | 31.1%), high school (11 | 24.4%), and middle school (9 | 20.0%).
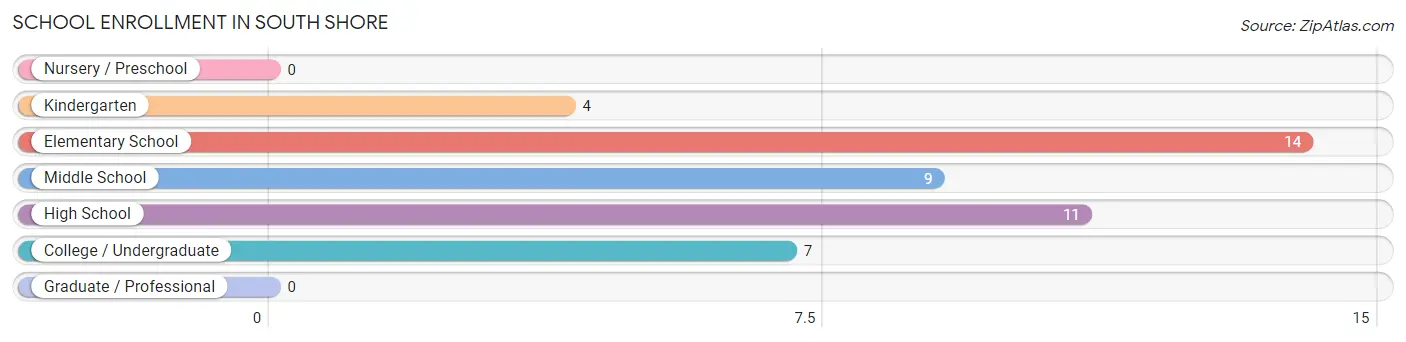
| School Level | # Students | % Students |
| Nursery / Preschool | 0 | 0.0% |
| Kindergarten | 4 | 8.9% |
| Elementary School | 14 | 31.1% |
| Middle School | 9 | 20.0% |
| High School | 11 | 24.4% |
| College / Undergraduate | 7 | 15.6% |
| Graduate / Professional | 0 | 0.0% |
| Total | 45 | 100.0% |
School Enrollment by Age by Funding Source in South Shore
Out of a total of 45 students who are enrolled in schools in South Shore, 6 (13.3%) attend a private institution, while the remaining 39 (86.7%) are enrolled in public schools. The age group of 15 to 17 year olds has the highest likelihood of being enrolled in private schools, with 3 (27.3% in the age bracket) enrolled. Conversely, the age group of 18 to 19 year olds has the lowest likelihood of being enrolled in a private school, with 2 (100.0% in the age bracket) attending a public institution.
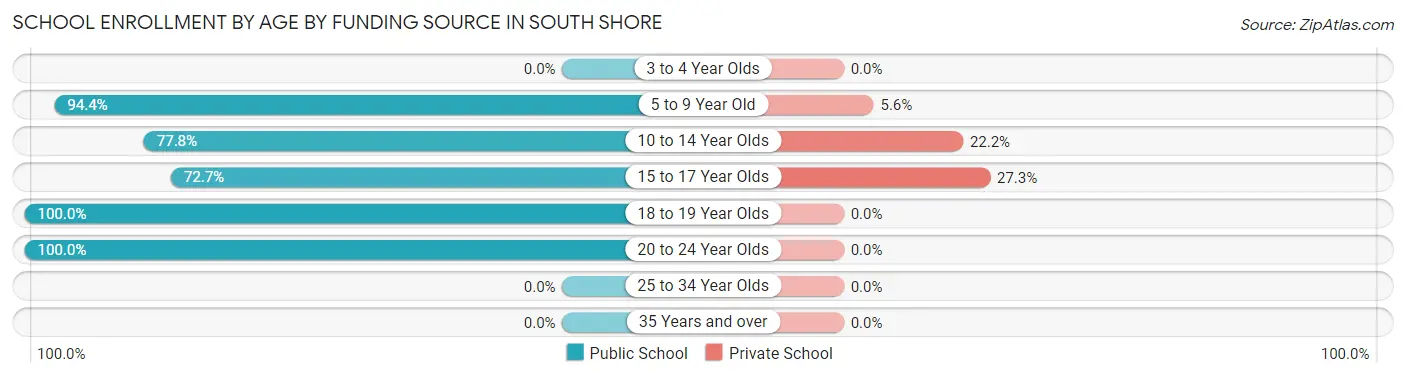
| Age Bracket | Public School | Private School |
| 3 to 4 Year Olds | 0 (0.0%) | 0 (0.0%) |
| 5 to 9 Year Old | 17 (94.4%) | 1 (5.6%) |
| 10 to 14 Year Olds | 7 (77.8%) | 2 (22.2%) |
| 15 to 17 Year Olds | 8 (72.7%) | 3 (27.3%) |
| 18 to 19 Year Olds | 2 (100.0%) | 0 (0.0%) |
| 20 to 24 Year Olds | 5 (100.0%) | 0 (0.0%) |
| 25 to 34 Year Olds | 0 (0.0%) | 0 (0.0%) |
| 35 Years and over | 0 (0.0%) | 0 (0.0%) |
| Total | 39 (86.7%) | 6 (13.3%) |
Educational Attainment by Field of Study in South Shore
Education (16 | 84.2%), business (2 | 10.5%), and bio, nature & agricultural (1 | 5.3%) are the most common fields of study among 19 individuals in South Shore who have obtained a bachelor's degree or higher.
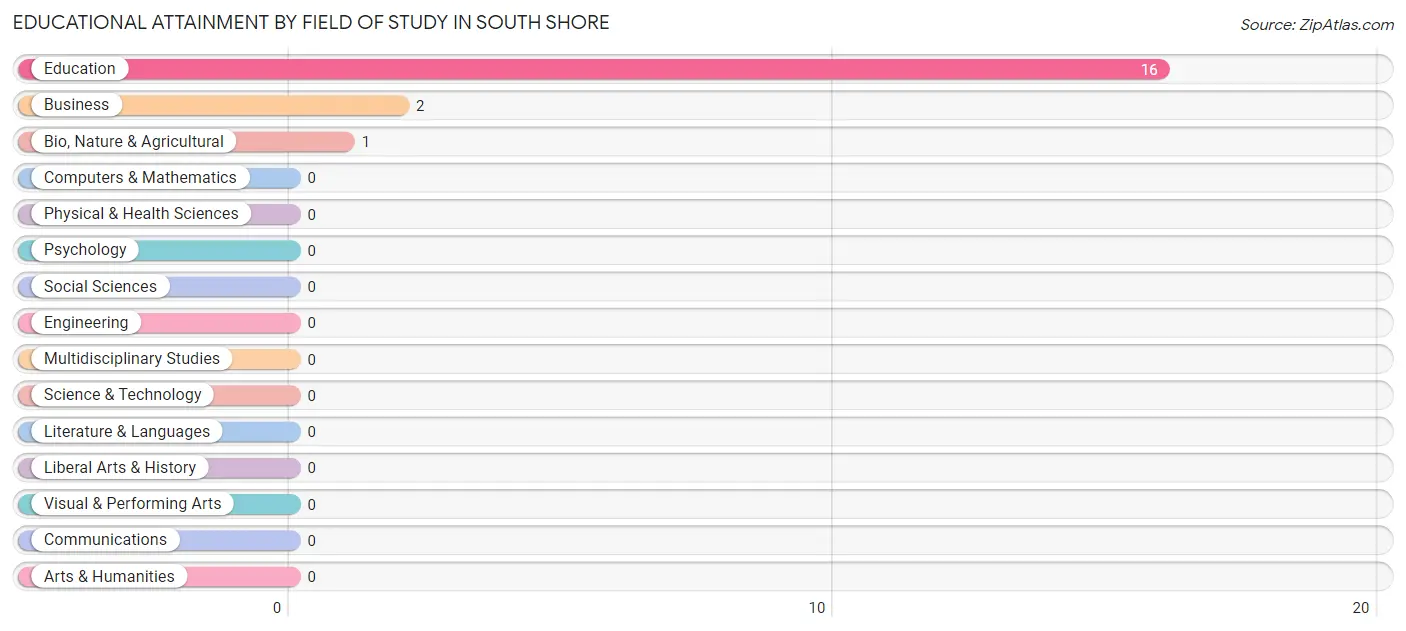
| Field of Study | # Graduates | % Graduates |
| Computers & Mathematics | 0 | 0.0% |
| Bio, Nature & Agricultural | 1 | 5.3% |
| Physical & Health Sciences | 0 | 0.0% |
| Psychology | 0 | 0.0% |
| Social Sciences | 0 | 0.0% |
| Engineering | 0 | 0.0% |
| Multidisciplinary Studies | 0 | 0.0% |
| Science & Technology | 0 | 0.0% |
| Business | 2 | 10.5% |
| Education | 16 | 84.2% |
| Literature & Languages | 0 | 0.0% |
| Liberal Arts & History | 0 | 0.0% |
| Visual & Performing Arts | 0 | 0.0% |
| Communications | 0 | 0.0% |
| Arts & Humanities | 0 | 0.0% |
| Total | 19 | 100.0% |
Transportation & Commute in South Shore
Vehicle Availability by Sex in South Shore
The most prevalent vehicle ownership categories in South Shore are males with 2 vehicles (50, accounting for 63.3%) and females with 2 vehicles (31, making up 89.3%).
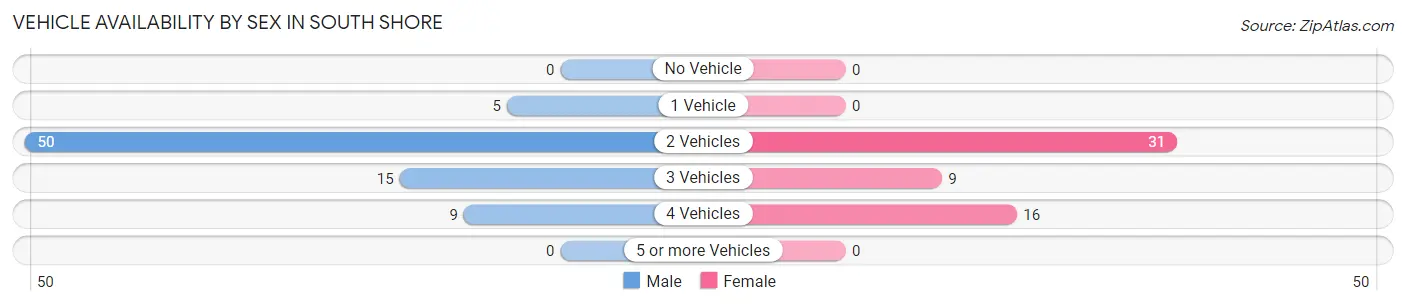
| Vehicles Available | Male | Female |
| No Vehicle | 0 (0.0%) | 0 (0.0%) |
| 1 Vehicle | 5 (6.3%) | 0 (0.0%) |
| 2 Vehicles | 50 (63.3%) | 31 (55.4%) |
| 3 Vehicles | 15 (19.0%) | 9 (16.1%) |
| 4 Vehicles | 9 (11.4%) | 16 (28.6%) |
| 5 or more Vehicles | 0 (0.0%) | 0 (0.0%) |
| Total | 79 (100.0%) | 56 (100.0%) |
Commute Time in South Shore
The most frequently occuring commute durations in South Shore are 30 to 34 minutes (44 commuters, 32.6%), 25 to 29 minutes (43 commuters, 31.9%), and less than 5 minutes (12 commuters, 8.9%).
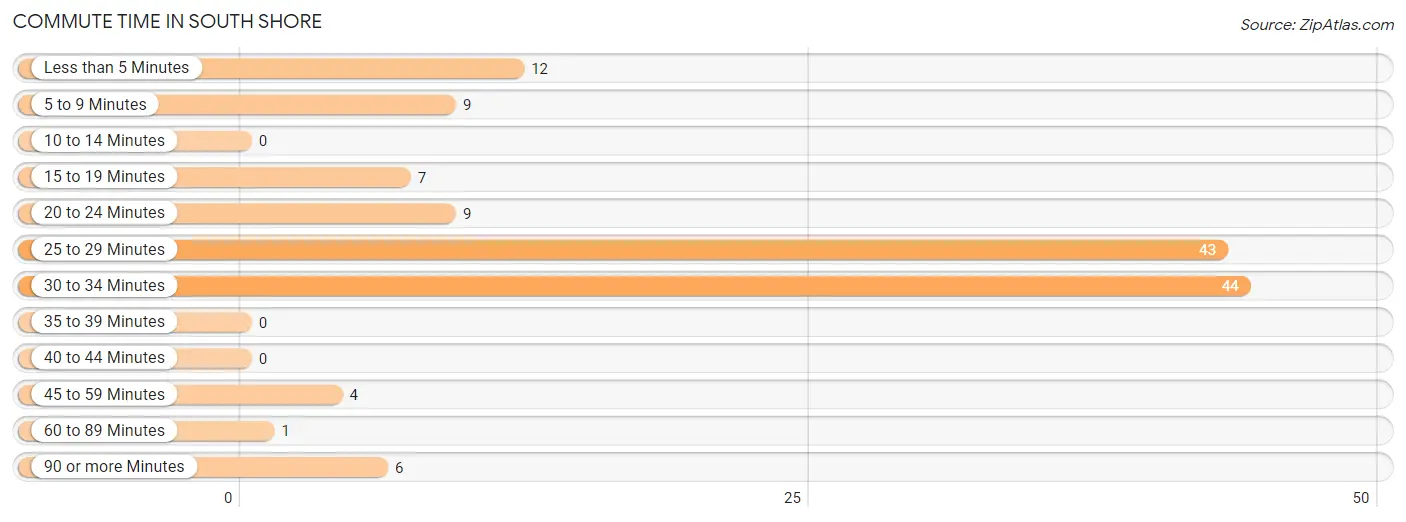
| Commute Time | # Commuters | % Commuters |
| Less than 5 Minutes | 12 | 8.9% |
| 5 to 9 Minutes | 9 | 6.7% |
| 10 to 14 Minutes | 0 | 0.0% |
| 15 to 19 Minutes | 7 | 5.2% |
| 20 to 24 Minutes | 9 | 6.7% |
| 25 to 29 Minutes | 43 | 31.9% |
| 30 to 34 Minutes | 44 | 32.6% |
| 35 to 39 Minutes | 0 | 0.0% |
| 40 to 44 Minutes | 0 | 0.0% |
| 45 to 59 Minutes | 4 | 3.0% |
| 60 to 89 Minutes | 1 | 0.7% |
| 90 or more Minutes | 6 | 4.4% |
Commute Time by Sex in South Shore
The most common commute times in South Shore are 25 to 29 minutes (29 commuters, 36.7%) for males and 30 to 34 minutes (28 commuters, 50.0%) for females.
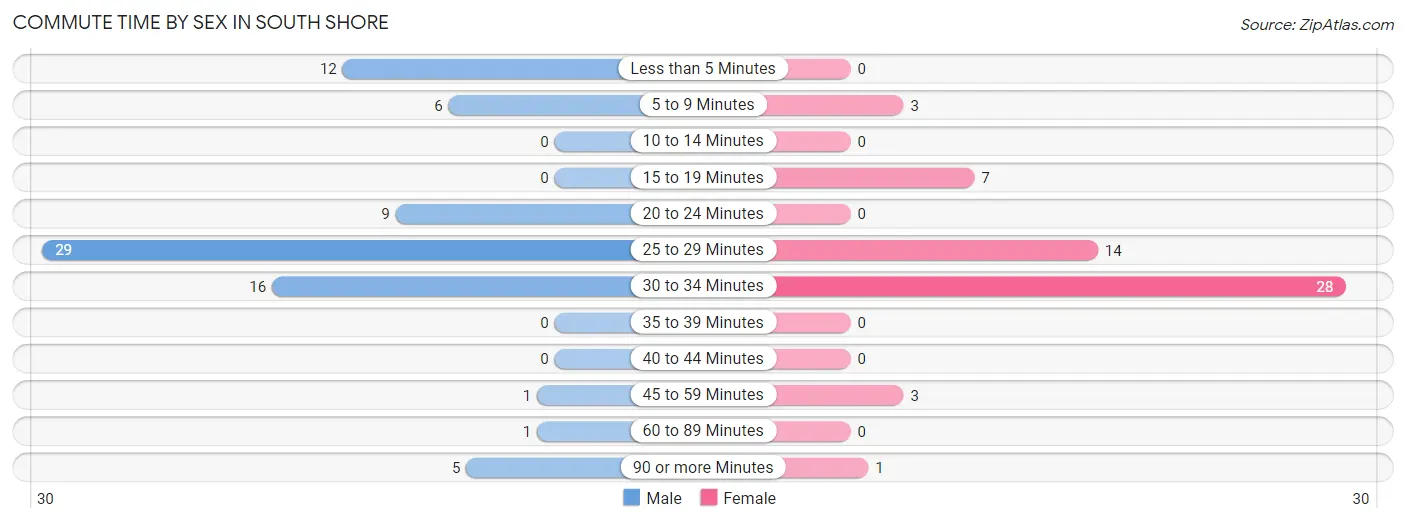
| Commute Time | Male | Female |
| Less than 5 Minutes | 12 (15.2%) | 0 (0.0%) |
| 5 to 9 Minutes | 6 (7.6%) | 3 (5.4%) |
| 10 to 14 Minutes | 0 (0.0%) | 0 (0.0%) |
| 15 to 19 Minutes | 0 (0.0%) | 7 (12.5%) |
| 20 to 24 Minutes | 9 (11.4%) | 0 (0.0%) |
| 25 to 29 Minutes | 29 (36.7%) | 14 (25.0%) |
| 30 to 34 Minutes | 16 (20.3%) | 28 (50.0%) |
| 35 to 39 Minutes | 0 (0.0%) | 0 (0.0%) |
| 40 to 44 Minutes | 0 (0.0%) | 0 (0.0%) |
| 45 to 59 Minutes | 1 (1.3%) | 3 (5.4%) |
| 60 to 89 Minutes | 1 (1.3%) | 0 (0.0%) |
| 90 or more Minutes | 5 (6.3%) | 1 (1.8%) |
Time of Departure to Work by Sex in South Shore
The most frequent times of departure to work in South Shore are 12:00 AM to 4:59 AM (30, 38.0%) for males and 7:30 AM to 7:59 AM (23, 41.1%) for females.
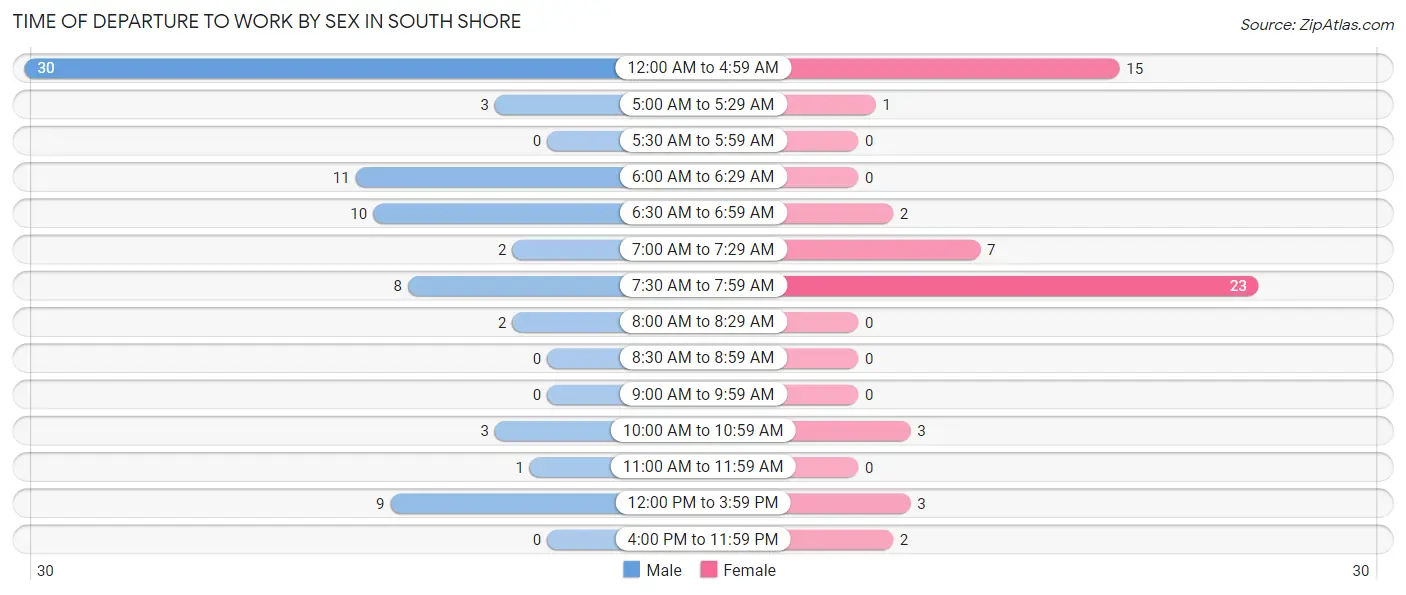
| Time of Departure | Male | Female |
| 12:00 AM to 4:59 AM | 30 (38.0%) | 15 (26.8%) |
| 5:00 AM to 5:29 AM | 3 (3.8%) | 1 (1.8%) |
| 5:30 AM to 5:59 AM | 0 (0.0%) | 0 (0.0%) |
| 6:00 AM to 6:29 AM | 11 (13.9%) | 0 (0.0%) |
| 6:30 AM to 6:59 AM | 10 (12.7%) | 2 (3.6%) |
| 7:00 AM to 7:29 AM | 2 (2.5%) | 7 (12.5%) |
| 7:30 AM to 7:59 AM | 8 (10.1%) | 23 (41.1%) |
| 8:00 AM to 8:29 AM | 2 (2.5%) | 0 (0.0%) |
| 8:30 AM to 8:59 AM | 0 (0.0%) | 0 (0.0%) |
| 9:00 AM to 9:59 AM | 0 (0.0%) | 0 (0.0%) |
| 10:00 AM to 10:59 AM | 3 (3.8%) | 3 (5.4%) |
| 11:00 AM to 11:59 AM | 1 (1.3%) | 0 (0.0%) |
| 12:00 PM to 3:59 PM | 9 (11.4%) | 3 (5.4%) |
| 4:00 PM to 11:59 PM | 0 (0.0%) | 2 (3.6%) |
| Total | 79 (100.0%) | 56 (100.0%) |
Housing Occupancy in South Shore
Occupancy by Ownership in South Shore
Of the total 106 dwellings in South Shore, owner-occupied units account for 88 (83.0%), while renter-occupied units make up 18 (17.0%).
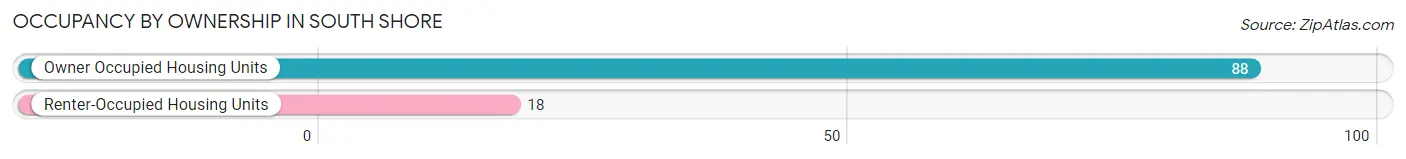
| Occupancy | # Housing Units | % Housing Units |
| Owner Occupied Housing Units | 88 | 83.0% |
| Renter-Occupied Housing Units | 18 | 17.0% |
| Total Occupied Housing Units | 106 | 100.0% |
Occupancy by Household Size in South Shore
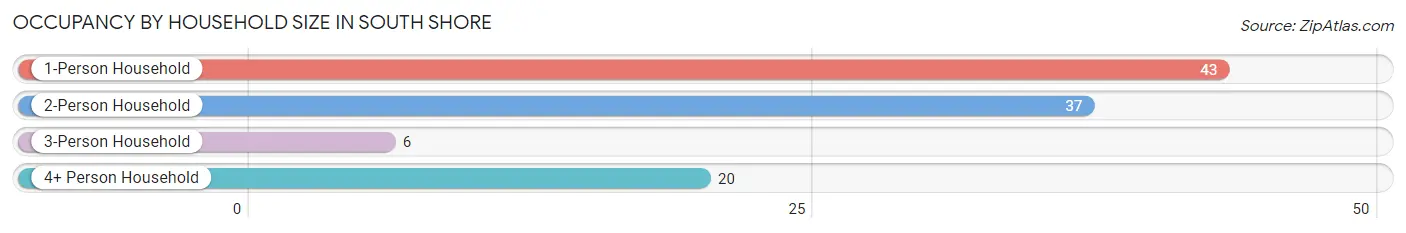
| Household Size | # Housing Units | % Housing Units |
| 1-Person Household | 43 | 40.6% |
| 2-Person Household | 37 | 34.9% |
| 3-Person Household | 6 | 5.7% |
| 4+ Person Household | 20 | 18.9% |
| Total Housing Units | 106 | 100.0% |
Occupancy by Ownership by Household Size in South Shore
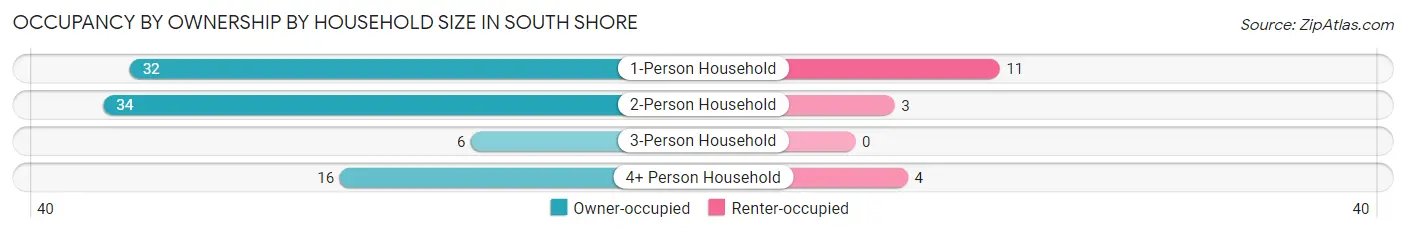
| Household Size | Owner-occupied | Renter-occupied |
| 1-Person Household | 32 (74.4%) | 11 (25.6%) |
| 2-Person Household | 34 (91.9%) | 3 (8.1%) |
| 3-Person Household | 6 (100.0%) | 0 (0.0%) |
| 4+ Person Household | 16 (80.0%) | 4 (20.0%) |
| Total Housing Units | 88 (83.0%) | 18 (17.0%) |
Occupancy by Educational Attainment in South Shore
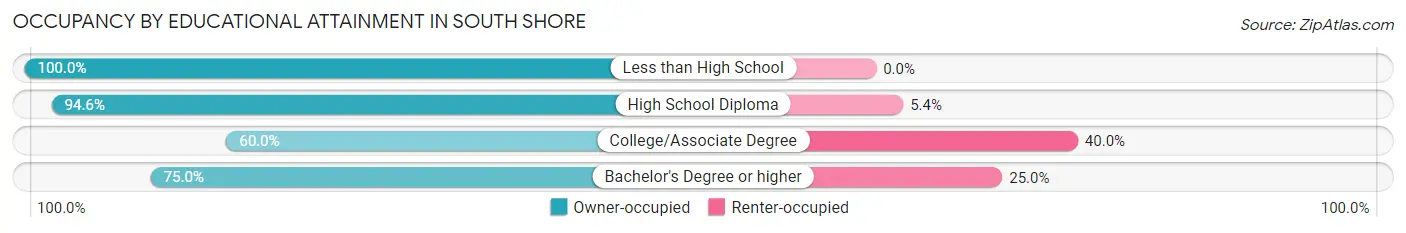
| Household Size | Owner-occupied | Renter-occupied |
| Less than High School | 11 (100.0%) | 0 (0.0%) |
| High School Diploma | 53 (94.6%) | 3 (5.4%) |
| College/Associate Degree | 21 (60.0%) | 14 (40.0%) |
| Bachelor's Degree or higher | 3 (75.0%) | 1 (25.0%) |
Occupancy by Age of Householder in South Shore
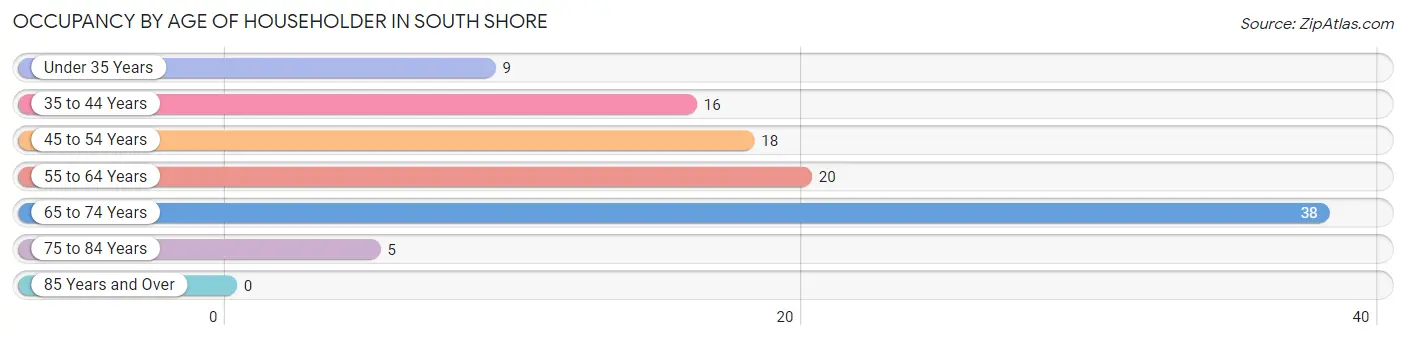
| Age Bracket | # Households | % Households |
| Under 35 Years | 9 | 8.5% |
| 35 to 44 Years | 16 | 15.1% |
| 45 to 54 Years | 18 | 17.0% |
| 55 to 64 Years | 20 | 18.9% |
| 65 to 74 Years | 38 | 35.8% |
| 75 to 84 Years | 5 | 4.7% |
| 85 Years and Over | 0 | 0.0% |
| Total | 106 | 100.0% |
Housing Finances in South Shore
Median Income by Occupancy in South Shore
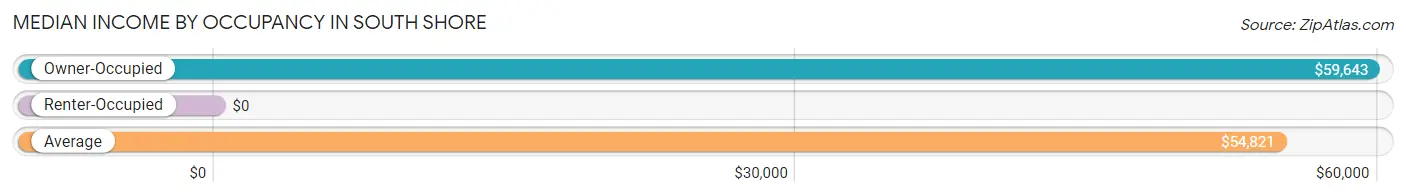
| Occupancy Type | # Households | Median Income |
| Owner-Occupied | 88 (83.0%) | $59,643 |
| Renter-Occupied | 18 (17.0%) | $0 |
| Average | 106 (100.0%) | $54,821 |
Occupancy by Householder Income Bracket in South Shore
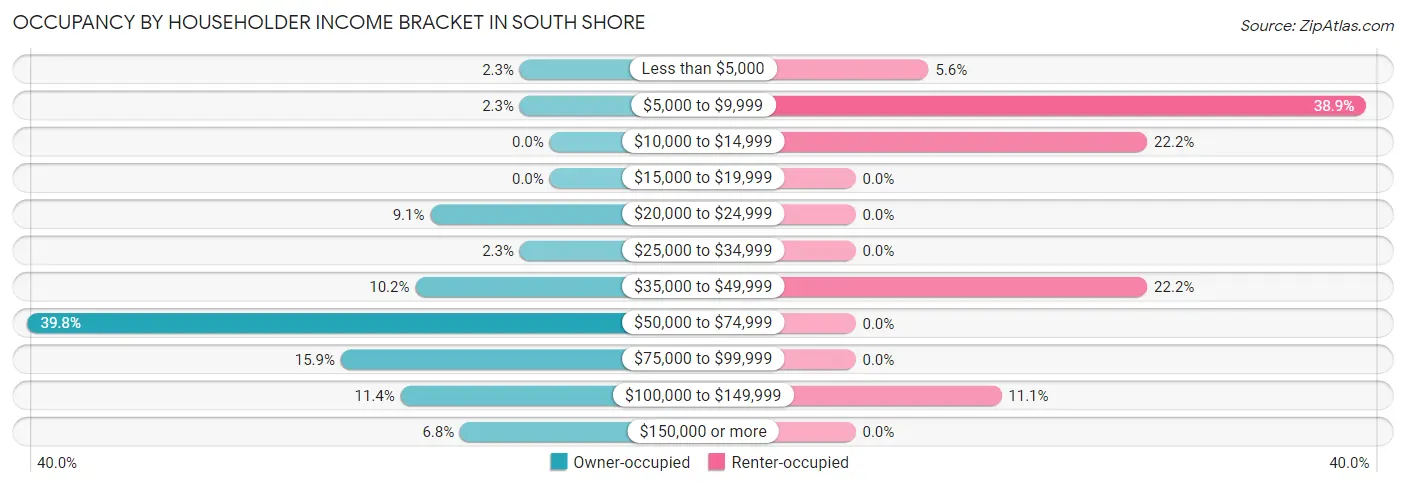
| Income Bracket | Owner-occupied | Renter-occupied |
| Less than $5,000 | 2 (2.3%) | 1 (5.6%) |
| $5,000 to $9,999 | 2 (2.3%) | 7 (38.9%) |
| $10,000 to $14,999 | 0 (0.0%) | 4 (22.2%) |
| $15,000 to $19,999 | 0 (0.0%) | 0 (0.0%) |
| $20,000 to $24,999 | 8 (9.1%) | 0 (0.0%) |
| $25,000 to $34,999 | 2 (2.3%) | 0 (0.0%) |
| $35,000 to $49,999 | 9 (10.2%) | 4 (22.2%) |
| $50,000 to $74,999 | 35 (39.8%) | 0 (0.0%) |
| $75,000 to $99,999 | 14 (15.9%) | 0 (0.0%) |
| $100,000 to $149,999 | 10 (11.4%) | 2 (11.1%) |
| $150,000 or more | 6 (6.8%) | 0 (0.0%) |
| Total | 88 (100.0%) | 18 (100.0%) |
Monthly Housing Cost Tiers in South Shore
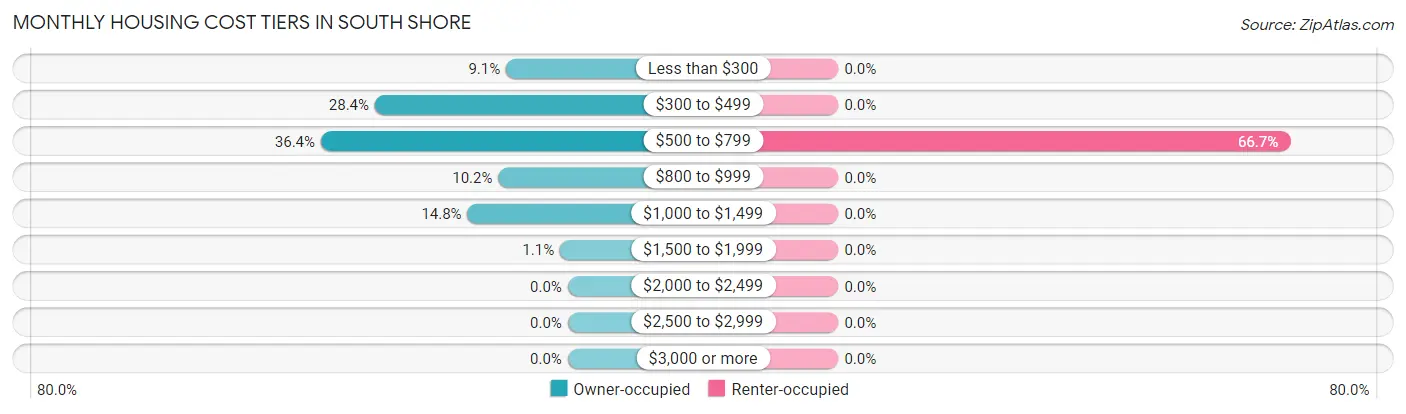
| Monthly Cost | Owner-occupied | Renter-occupied |
| Less than $300 | 8 (9.1%) | 0 (0.0%) |
| $300 to $499 | 25 (28.4%) | 0 (0.0%) |
| $500 to $799 | 32 (36.4%) | 12 (66.7%) |
| $800 to $999 | 9 (10.2%) | 0 (0.0%) |
| $1,000 to $1,499 | 13 (14.8%) | 0 (0.0%) |
| $1,500 to $1,999 | 1 (1.1%) | 0 (0.0%) |
| $2,000 to $2,499 | 0 (0.0%) | 0 (0.0%) |
| $2,500 to $2,999 | 0 (0.0%) | 0 (0.0%) |
| $3,000 or more | 0 (0.0%) | 0 (0.0%) |
| Total | 88 (100.0%) | 18 (100.0%) |
Physical Housing Characteristics in South Shore
Housing Structures in South Shore
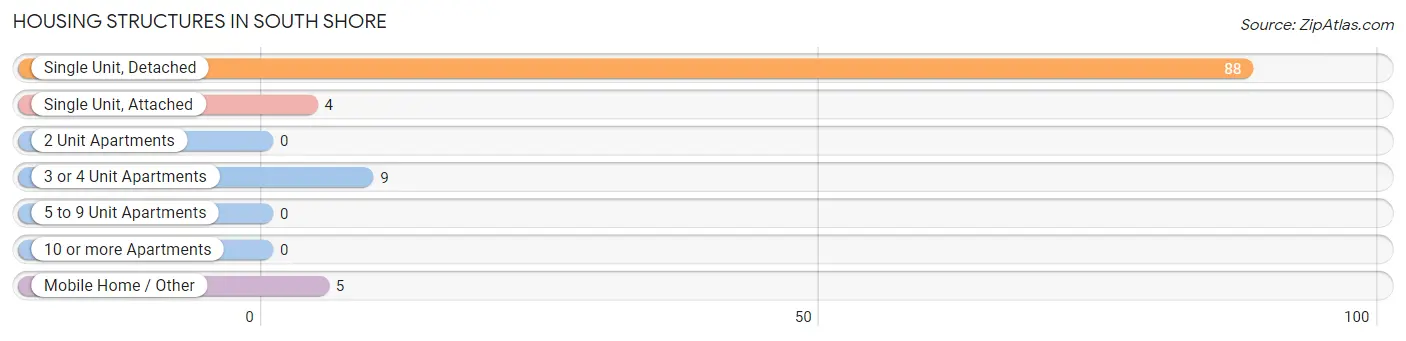
| Structure Type | # Housing Units | % Housing Units |
| Single Unit, Detached | 88 | 83.0% |
| Single Unit, Attached | 4 | 3.8% |
| 2 Unit Apartments | 0 | 0.0% |
| 3 or 4 Unit Apartments | 9 | 8.5% |
| 5 to 9 Unit Apartments | 0 | 0.0% |
| 10 or more Apartments | 0 | 0.0% |
| Mobile Home / Other | 5 | 4.7% |
| Total | 106 | 100.0% |
Housing Structures by Occupancy in South Shore
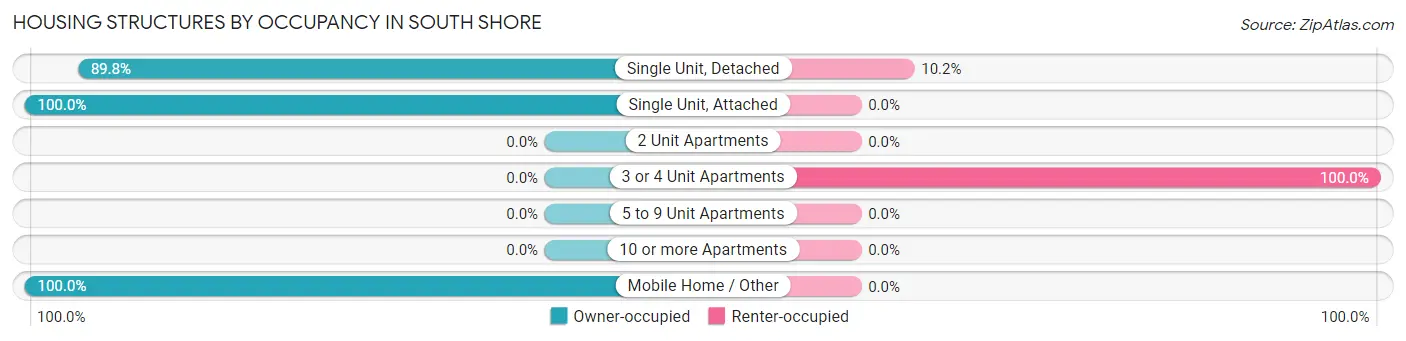
| Structure Type | Owner-occupied | Renter-occupied |
| Single Unit, Detached | 79 (89.8%) | 9 (10.2%) |
| Single Unit, Attached | 4 (100.0%) | 0 (0.0%) |
| 2 Unit Apartments | 0 (0.0%) | 0 (0.0%) |
| 3 or 4 Unit Apartments | 0 (0.0%) | 9 (100.0%) |
| 5 to 9 Unit Apartments | 0 (0.0%) | 0 (0.0%) |
| 10 or more Apartments | 0 (0.0%) | 0 (0.0%) |
| Mobile Home / Other | 5 (100.0%) | 0 (0.0%) |
| Total | 88 (83.0%) | 18 (17.0%) |
Housing Structures by Number of Rooms in South Shore
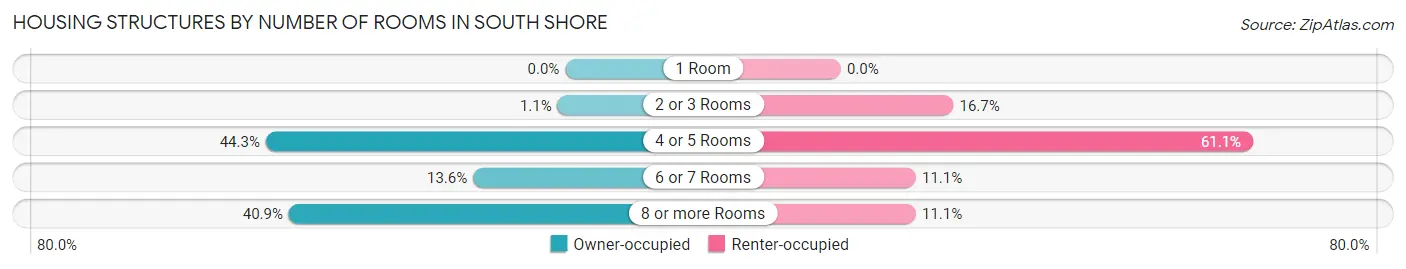
| Number of Rooms | Owner-occupied | Renter-occupied |
| 1 Room | 0 (0.0%) | 0 (0.0%) |
| 2 or 3 Rooms | 1 (1.1%) | 3 (16.7%) |
| 4 or 5 Rooms | 39 (44.3%) | 11 (61.1%) |
| 6 or 7 Rooms | 12 (13.6%) | 2 (11.1%) |
| 8 or more Rooms | 36 (40.9%) | 2 (11.1%) |
| Total | 88 (100.0%) | 18 (100.0%) |
Housing Structure by Heating Type in South Shore
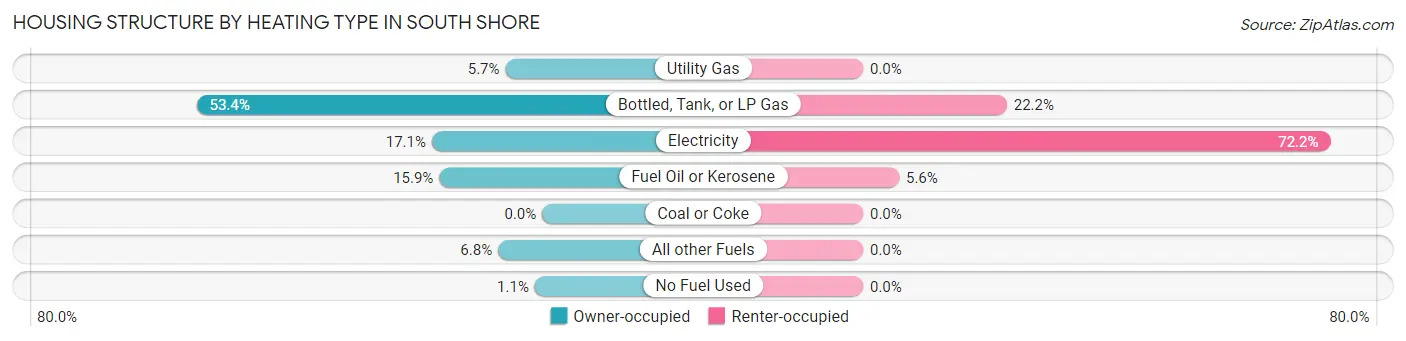
| Heating Type | Owner-occupied | Renter-occupied |
| Utility Gas | 5 (5.7%) | 0 (0.0%) |
| Bottled, Tank, or LP Gas | 47 (53.4%) | 4 (22.2%) |
| Electricity | 15 (17.1%) | 13 (72.2%) |
| Fuel Oil or Kerosene | 14 (15.9%) | 1 (5.6%) |
| Coal or Coke | 0 (0.0%) | 0 (0.0%) |
| All other Fuels | 6 (6.8%) | 0 (0.0%) |
| No Fuel Used | 1 (1.1%) | 0 (0.0%) |
| Total | 88 (100.0%) | 18 (100.0%) |
Household Vehicle Usage in South Shore
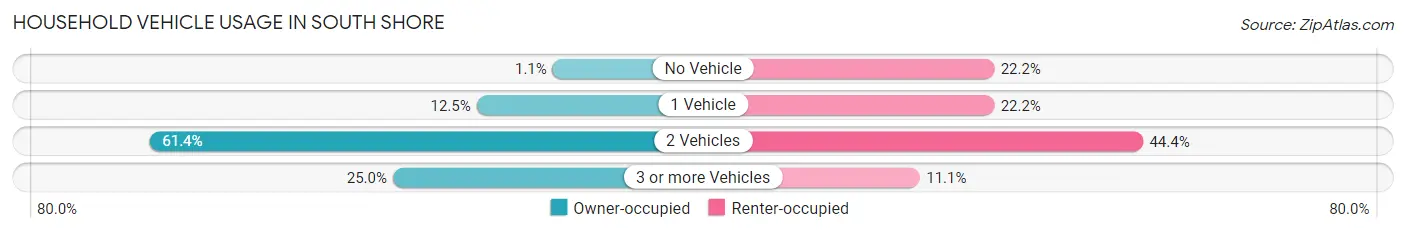
| Vehicles per Household | Owner-occupied | Renter-occupied |
| No Vehicle | 1 (1.1%) | 4 (22.2%) |
| 1 Vehicle | 11 (12.5%) | 4 (22.2%) |
| 2 Vehicles | 54 (61.4%) | 8 (44.4%) |
| 3 or more Vehicles | 22 (25.0%) | 2 (11.1%) |
| Total | 88 (100.0%) | 18 (100.0%) |
Real Estate & Mortgages in South Shore
Real Estate and Mortgage Overview in South Shore
| Characteristic | Without Mortgage | With Mortgage |
| Housing Units | 53 | 35 |
| Median Property Value | $59,300 | $85,000 |
| Median Household Income | $54,479 | $1 |
| Monthly Housing Costs | $446 | $0 |
| Real Estate Taxes | $850 | $0 |
Property Value by Mortgage Status in South Shore
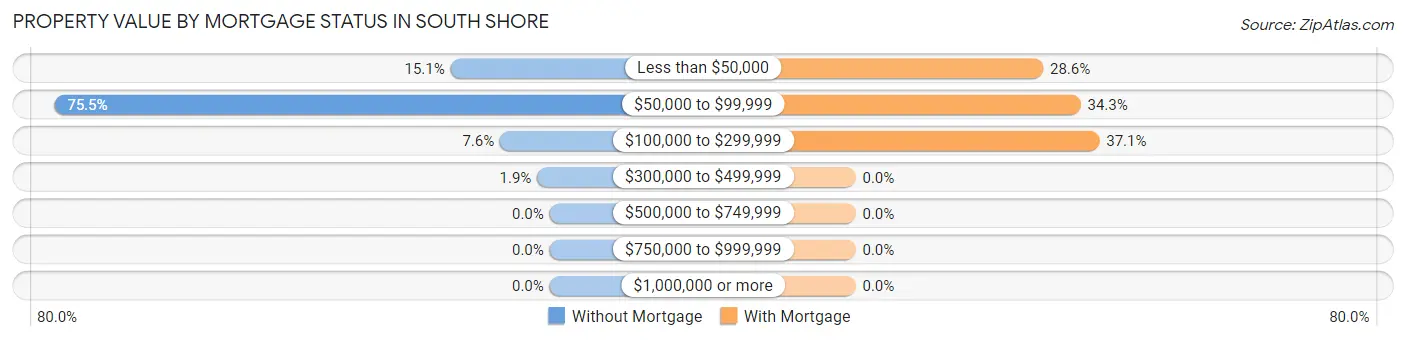
| Property Value | Without Mortgage | With Mortgage |
| Less than $50,000 | 8 (15.1%) | 10 (28.6%) |
| $50,000 to $99,999 | 40 (75.5%) | 12 (34.3%) |
| $100,000 to $299,999 | 4 (7.5%) | 13 (37.1%) |
| $300,000 to $499,999 | 1 (1.9%) | 0 (0.0%) |
| $500,000 to $749,999 | 0 (0.0%) | 0 (0.0%) |
| $750,000 to $999,999 | 0 (0.0%) | 0 (0.0%) |
| $1,000,000 or more | 0 (0.0%) | 0 (0.0%) |
| Total | 53 (100.0%) | 35 (100.0%) |
Household Income by Mortgage Status in South Shore
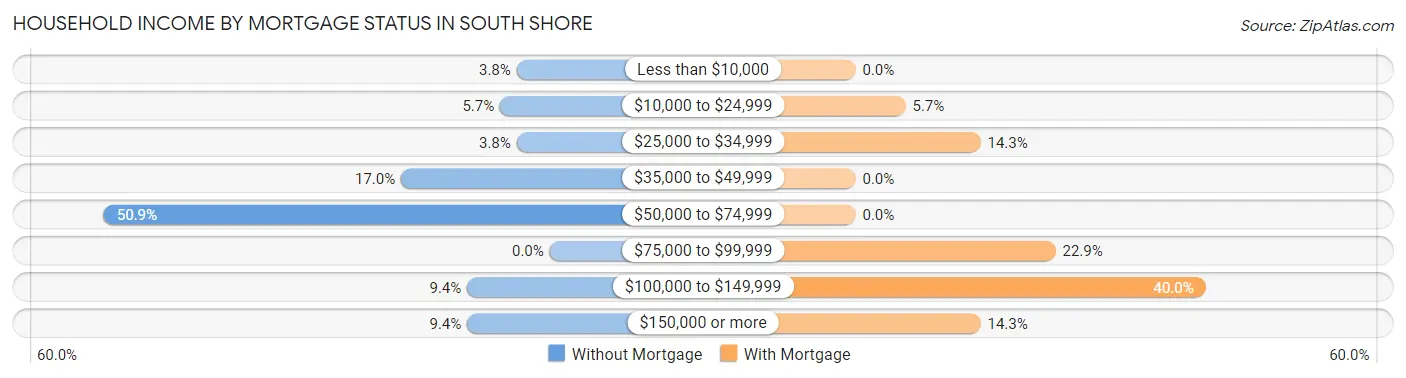
| Household Income | Without Mortgage | With Mortgage |
| Less than $10,000 | 2 (3.8%) | 0 (0.0%) |
| $10,000 to $24,999 | 3 (5.7%) | 2 (5.7%) |
| $25,000 to $34,999 | 2 (3.8%) | 5 (14.3%) |
| $35,000 to $49,999 | 9 (17.0%) | 0 (0.0%) |
| $50,000 to $74,999 | 27 (50.9%) | 0 (0.0%) |
| $75,000 to $99,999 | 0 (0.0%) | 8 (22.9%) |
| $100,000 to $149,999 | 5 (9.4%) | 14 (40.0%) |
| $150,000 or more | 5 (9.4%) | 5 (14.3%) |
| Total | 53 (100.0%) | 35 (100.0%) |
Property Value to Household Income Ratio in South Shore
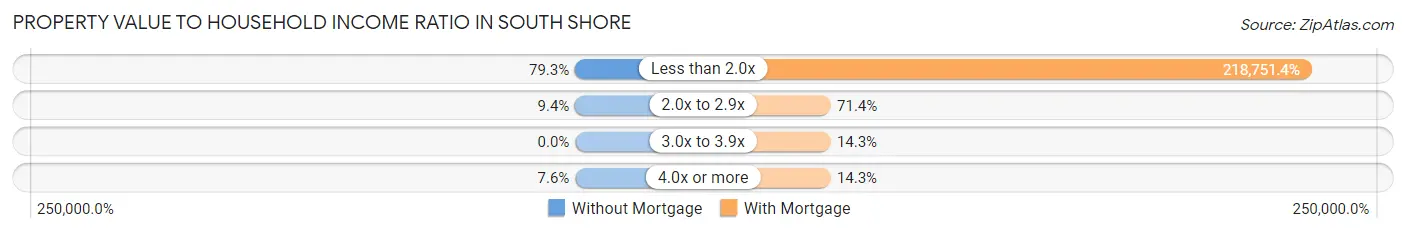
| Value-to-Income Ratio | Without Mortgage | With Mortgage |
| Less than 2.0x | 42 (79.2%) | 76,563 (218,751.4%) |
| 2.0x to 2.9x | 5 (9.4%) | 25 (71.4%) |
| 3.0x to 3.9x | 0 (0.0%) | 5 (14.3%) |
| 4.0x or more | 4 (7.5%) | 5 (14.3%) |
| Total | 53 (100.0%) | 35 (100.0%) |
Real Estate Taxes by Mortgage Status in South Shore
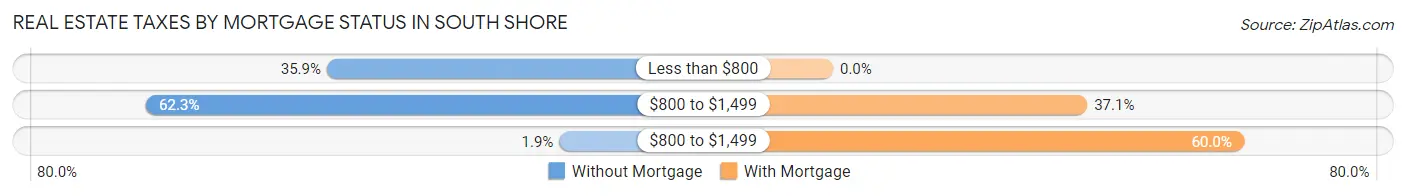
| Property Taxes | Without Mortgage | With Mortgage |
| Less than $800 | 19 (35.8%) | 0 (0.0%) |
| $800 to $1,499 | 33 (62.3%) | 13 (37.1%) |
| $800 to $1,499 | 1 (1.9%) | 21 (60.0%) |
| Total | 53 (100.0%) | 35 (100.0%) |
Health & Disability in South Shore
Health Insurance Coverage by Age in South Shore
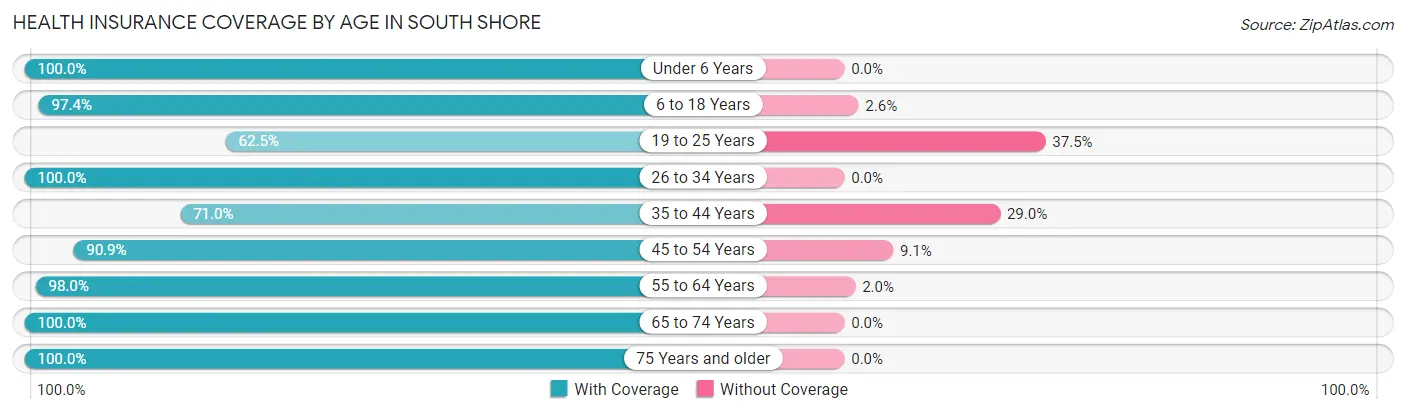
| Age Bracket | With Coverage | Without Coverage |
| Under 6 Years | 12 (100.0%) | 0 (0.0%) |
| 6 to 18 Years | 37 (97.4%) | 1 (2.6%) |
| 19 to 25 Years | 10 (62.5%) | 6 (37.5%) |
| 26 to 34 Years | 9 (100.0%) | 0 (0.0%) |
| 35 to 44 Years | 22 (71.0%) | 9 (29.0%) |
| 45 to 54 Years | 20 (90.9%) | 2 (9.1%) |
| 55 to 64 Years | 48 (98.0%) | 1 (2.0%) |
| 65 to 74 Years | 43 (100.0%) | 0 (0.0%) |
| 75 Years and older | 6 (100.0%) | 0 (0.0%) |
| Total | 207 (91.6%) | 19 (8.4%) |
Health Insurance Coverage by Citizenship Status in South Shore
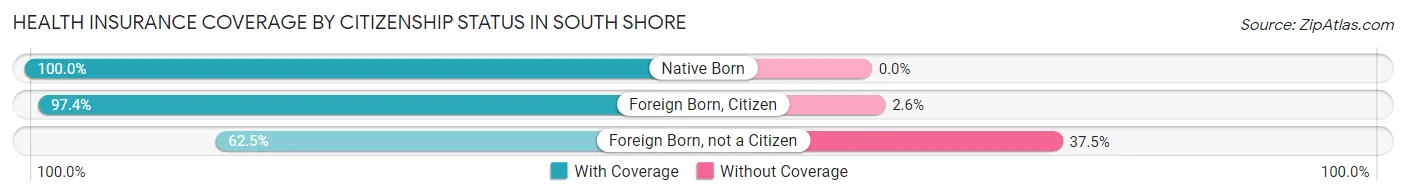
| Citizenship Status | With Coverage | Without Coverage |
| Native Born | 12 (100.0%) | 0 (0.0%) |
| Foreign Born, Citizen | 37 (97.4%) | 1 (2.6%) |
| Foreign Born, not a Citizen | 10 (62.5%) | 6 (37.5%) |
Health Insurance Coverage by Household Income in South Shore
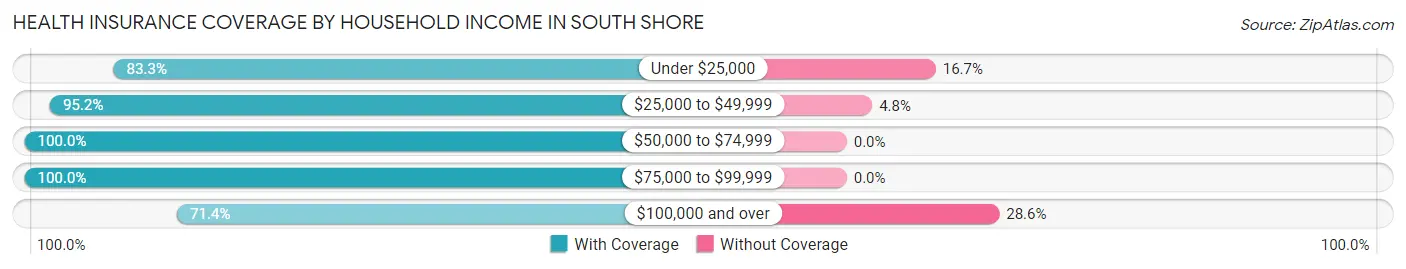
| Household Income | With Coverage | Without Coverage |
| Under $25,000 | 40 (83.3%) | 8 (16.7%) |
| $25,000 to $49,999 | 20 (95.2%) | 1 (4.8%) |
| $50,000 to $74,999 | 94 (100.0%) | 0 (0.0%) |
| $75,000 to $99,999 | 28 (100.0%) | 0 (0.0%) |
| $100,000 and over | 25 (71.4%) | 10 (28.6%) |
Public vs Private Health Insurance Coverage by Age in South Shore
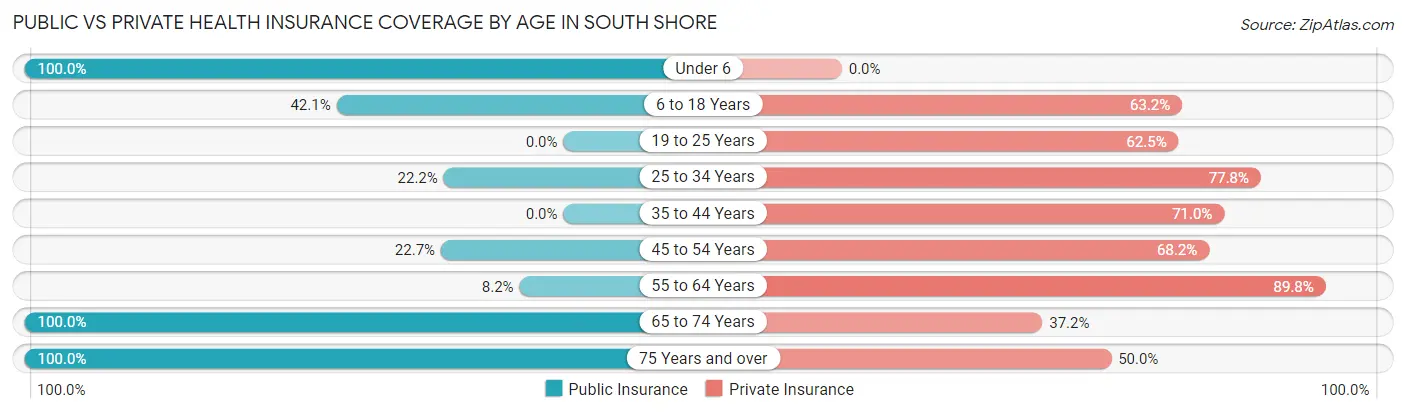
| Age Bracket | Public Insurance | Private Insurance |
| Under 6 | 12 (100.0%) | 0 (0.0%) |
| 6 to 18 Years | 16 (42.1%) | 24 (63.2%) |
| 19 to 25 Years | 0 (0.0%) | 10 (62.5%) |
| 25 to 34 Years | 2 (22.2%) | 7 (77.8%) |
| 35 to 44 Years | 0 (0.0%) | 22 (71.0%) |
| 45 to 54 Years | 5 (22.7%) | 15 (68.2%) |
| 55 to 64 Years | 4 (8.2%) | 44 (89.8%) |
| 65 to 74 Years | 43 (100.0%) | 16 (37.2%) |
| 75 Years and over | 6 (100.0%) | 3 (50.0%) |
| Total | 88 (38.9%) | 141 (62.4%) |
Disability Status by Sex by Age in South Shore
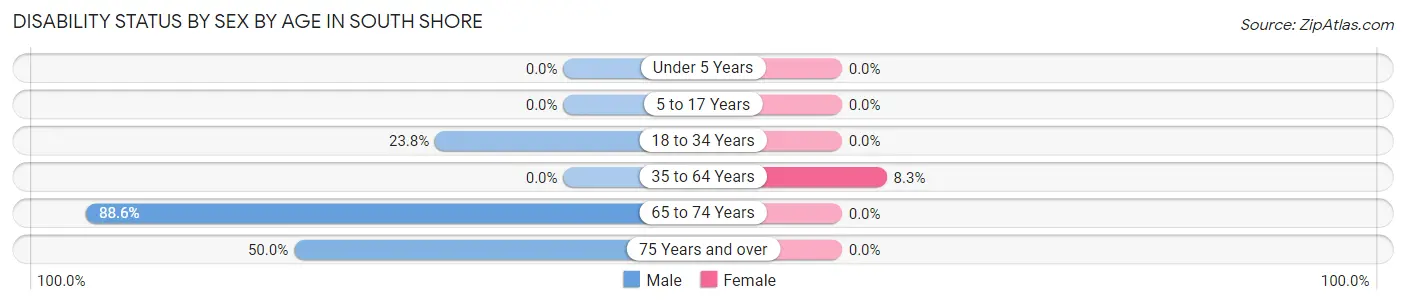
| Age Bracket | Male | Female |
| Under 5 Years | 0 (0.0%) | 0 (0.0%) |
| 5 to 17 Years | 0 (0.0%) | 0 (0.0%) |
| 18 to 34 Years | 5 (23.8%) | 0 (0.0%) |
| 35 to 64 Years | 0 (0.0%) | 5 (8.3%) |
| 65 to 74 Years | 31 (88.6%) | 0 (0.0%) |
| 75 Years and over | 1 (50.0%) | 0 (0.0%) |
Disability Class by Sex by Age in South Shore
Disability Class: Hearing Difficulty
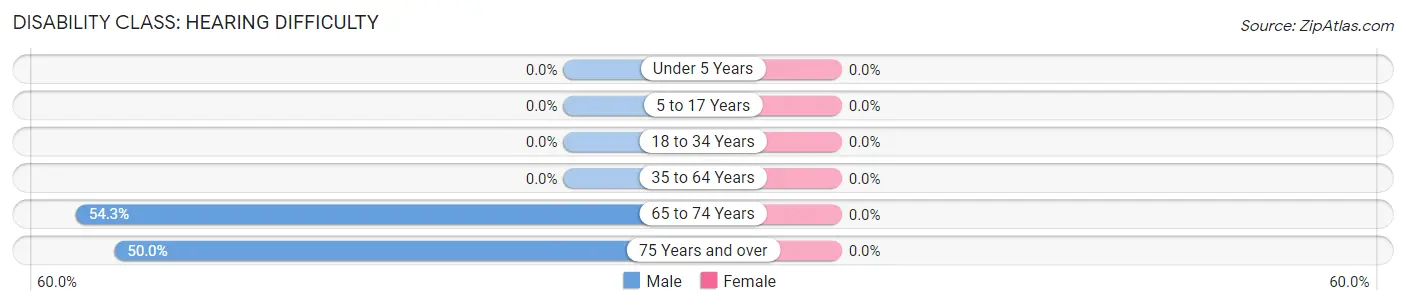
| Age Bracket | Male | Female |
| Under 5 Years | 0 (0.0%) | 0 (0.0%) |
| 5 to 17 Years | 0 (0.0%) | 0 (0.0%) |
| 18 to 34 Years | 0 (0.0%) | 0 (0.0%) |
| 35 to 64 Years | 0 (0.0%) | 0 (0.0%) |
| 65 to 74 Years | 19 (54.3%) | 0 (0.0%) |
| 75 Years and over | 1 (50.0%) | 0 (0.0%) |
Disability Class: Vision Difficulty
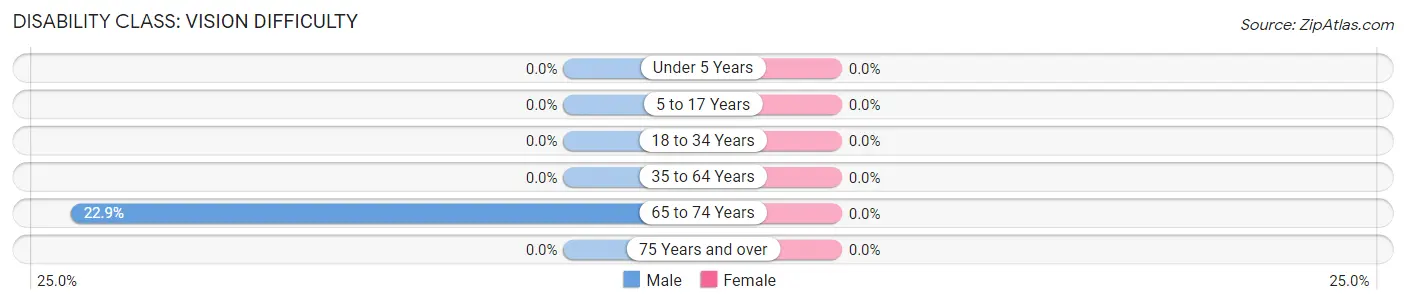
| Age Bracket | Male | Female |
| Under 5 Years | 0 (0.0%) | 0 (0.0%) |
| 5 to 17 Years | 0 (0.0%) | 0 (0.0%) |
| 18 to 34 Years | 0 (0.0%) | 0 (0.0%) |
| 35 to 64 Years | 0 (0.0%) | 0 (0.0%) |
| 65 to 74 Years | 8 (22.9%) | 0 (0.0%) |
| 75 Years and over | 0 (0.0%) | 0 (0.0%) |
Disability Class: Cognitive Difficulty
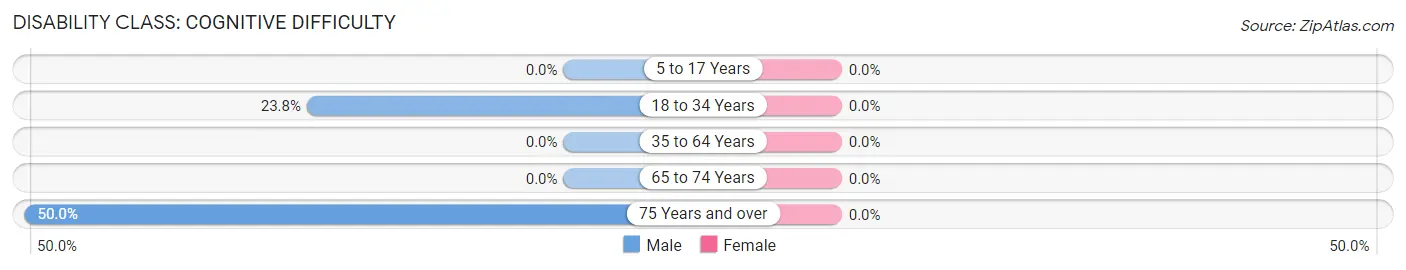
| Age Bracket | Male | Female |
| 5 to 17 Years | 0 (0.0%) | 0 (0.0%) |
| 18 to 34 Years | 5 (23.8%) | 0 (0.0%) |
| 35 to 64 Years | 0 (0.0%) | 0 (0.0%) |
| 65 to 74 Years | 0 (0.0%) | 0 (0.0%) |
| 75 Years and over | 1 (50.0%) | 0 (0.0%) |
Disability Class: Ambulatory Difficulty
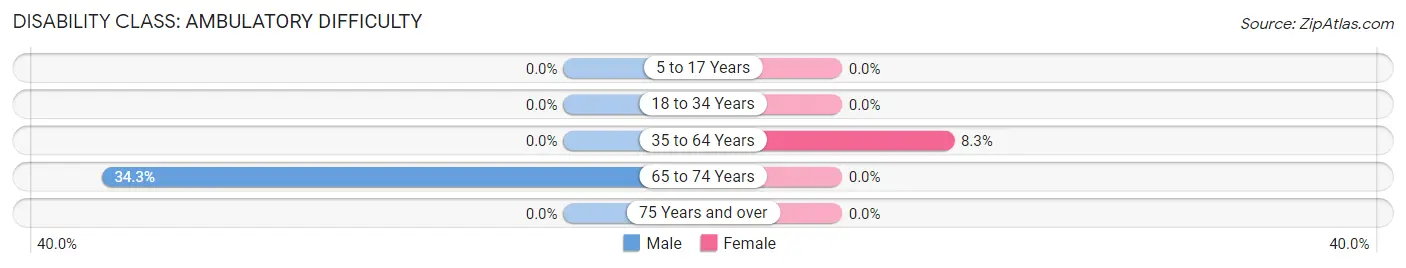
| Age Bracket | Male | Female |
| 5 to 17 Years | 0 (0.0%) | 0 (0.0%) |
| 18 to 34 Years | 0 (0.0%) | 0 (0.0%) |
| 35 to 64 Years | 0 (0.0%) | 5 (8.3%) |
| 65 to 74 Years | 12 (34.3%) | 0 (0.0%) |
| 75 Years and over | 0 (0.0%) | 0 (0.0%) |
Disability Class: Self-Care Difficulty
| Age Bracket | Male | Female |
| 5 to 17 Years | 0 (0.0%) | 0 (0.0%) |
| 18 to 34 Years | 0 (0.0%) | 0 (0.0%) |
| 35 to 64 Years | 0 (0.0%) | 0 (0.0%) |
| 65 to 74 Years | 0 (0.0%) | 0 (0.0%) |
| 75 Years and over | 0 (0.0%) | 0 (0.0%) |
Technology Access in South Shore
Computing Device Access in South Shore
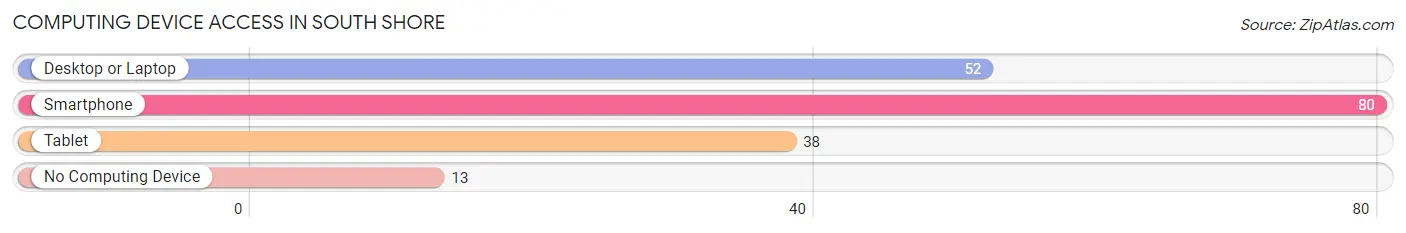
| Device Type | # Households | % Households |
| Desktop or Laptop | 52 | 49.1% |
| Smartphone | 80 | 75.5% |
| Tablet | 38 | 35.8% |
| No Computing Device | 13 | 12.3% |
| Total | 106 | 100.0% |
Internet Access in South Shore
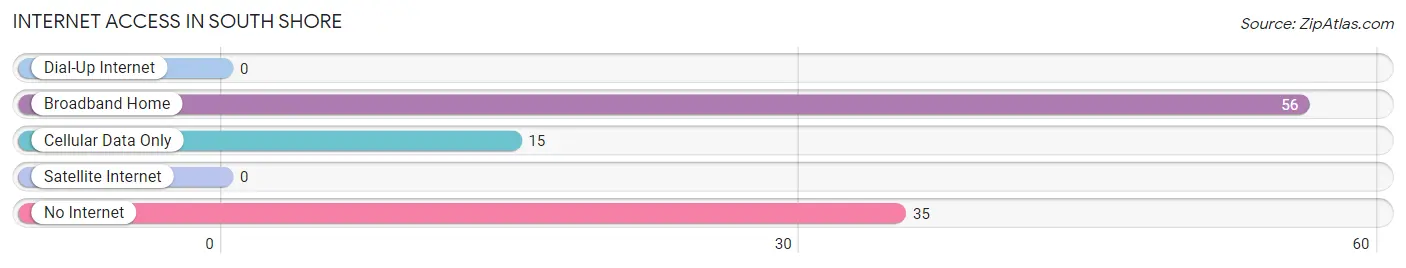
| Internet Type | # Households | % Households |
| Dial-Up Internet | 0 | 0.0% |
| Broadband Home | 56 | 52.8% |
| Cellular Data Only | 15 | 14.1% |
| Satellite Internet | 0 | 0.0% |
| No Internet | 35 | 33.0% |
| Total | 106 | 100.0% |
South Shore Summary
South Shore is a small town located in the southeastern corner of South Dakota, along the Missouri River. It is part of the Yankton Sioux Reservation and is the county seat of Charles Mix County. The town has a population of approximately 1,000 people and is located about 30 miles south of Yankton, the state’s second-largest city.
History
South Shore was founded in 1881 by the Yankton Sioux Tribe. The town was originally known as “Little Sioux” and was the first permanent settlement in the area. The town was renamed South Shore in 1883 when the railroad arrived. The town was incorporated in 1887 and has remained a small, rural community ever since.
The town was the site of a major battle between the Yankton Sioux and the United States Army in 1881. The battle, known as the Battle of Little Sioux, was part of the Sioux Wars and resulted in a victory for the Yankton Sioux.
Geography
South Shore is located in the southeastern corner of South Dakota, along the Missouri River. The town is situated on the banks of the river and is surrounded by rolling hills and prairies. The town is located about 30 miles south of Yankton, the state’s second-largest city.
The climate in South Shore is continental, with cold winters and hot, humid summers. The average annual temperature is around 50 degrees Fahrenheit. The town receives an average of 25 inches of precipitation per year, with most of it falling in the spring and summer months.
Economy
The economy of South Shore is largely based on agriculture and tourism. The town is home to several small farms and ranches, as well as a few small businesses. Tourism is also an important part of the local economy, with visitors coming to the area to enjoy the natural beauty of the Missouri River and the surrounding hills and prairies.
Demographics
As of the 2010 census, the population of South Shore was 1,000 people. The racial makeup of the town was 95.2% White, 0.7% African American, 0.7% Native American, 0.3% Asian, 0.1% Pacific Islander, and 2.1% from other races. The median household income was $37,500 and the median family income was $45,000. The per capita income was $18,000.
South Shore is a small, rural town with a rich history and a strong sense of community. The town is home to a diverse population and offers a variety of activities and attractions for visitors and residents alike. The town is a great place to live, work, and play, and is a great example of the beauty and charm of small-town South Dakota.
Common Questions
What is Per Capita Income in South Shore?
Per Capita income in South Shore is $49,453.
What is the Median Family Income in South Shore?
Median Family Income in South Shore is $54,896.
What is the Median Household income in South Shore?
Median Household Income in South Shore is $54,821.
What is Income or Wage Gap in South Shore?
Income or Wage Gap in South Shore is 48.5%.
Women in South Shore earn 51.5 cents for every dollar earned by a man.
What is Inequality or Gini Index in South Shore?
Inequality or Gini Index in South Shore is 0.62.
What is the Total Population of South Shore?
Total Population of South Shore is 226.
What is the Total Male Population of South Shore?
Total Male Population of South Shore is 125.
What is the Total Female Population of South Shore?
Total Female Population of South Shore is 101.
What is the Ratio of Males per 100 Females in South Shore?
There are 123.76 Males per 100 Females in South Shore.
What is the Ratio of Females per 100 Males in South Shore?
There are 80.80 Females per 100 Males in South Shore.
What is the Median Population Age in South Shore?
Median Population Age in South Shore is 52.3 Years.
What is the Average Family Size in South Shore
Average Family Size in South Shore is 2.9 People.
What is the Average Household Size in South Shore
Average Household Size in South Shore is 2.1 People.
How Large is the Labor Force in South Shore?
There are 135 People in the Labor Forcein in South Shore.
What is the Percentage of People in the Labor Force in South Shore?
72.2% of People are in the Labor Force in South Shore.