Winner, SD Map & Demographics
Winner Map
Winner Overview
$26,135
PER CAPITA INCOME
$65,956
AVG FAMILY INCOME
$52,500
AVG HOUSEHOLD INCOME
0.7%
WAGE / INCOME GAP [ % ]
99.3¢/ $1
WAGE / INCOME GAP [ $ ]
0.43
INEQUALITY / GINI INDEX
2,905
TOTAL POPULATION
1,525
MALE POPULATION
1,380
FEMALE POPULATION
110.51
MALES / 100 FEMALES
90.49
FEMALES / 100 MALES
43.7
MEDIAN AGE
3.1
AVG FAMILY SIZE
2.5
AVG HOUSEHOLD SIZE
1,420
LABOR FORCE [ PEOPLE ]
60.7%
PERCENT IN LABOR FORCE
8.7%
UNEMPLOYMENT RATE
Winner Zip Codes
Winner Area Codes
Income in Winner
Income Overview in Winner
Per Capita Income in Winner is $26,135, while median incomes of families and households are $65,956 and $52,500 respectively.
| Characteristic | Number | Measure |
| Per Capita Income | 2,905 | $26,135 |
| Median Family Income | 718 | $65,956 |
| Mean Family Income | 718 | $75,468 |
| Median Household Income | 1,078 | $52,500 |
| Mean Household Income | 1,078 | $64,958 |
| Income Deficit | 718 | $0 |
| Wage / Income Gap (%) | 2,905 | 0.71% |
| Wage / Income Gap ($) | 2,905 | 99.29¢ per $1 |
| Gini / Inequality Index | 2,905 | 0.43 |
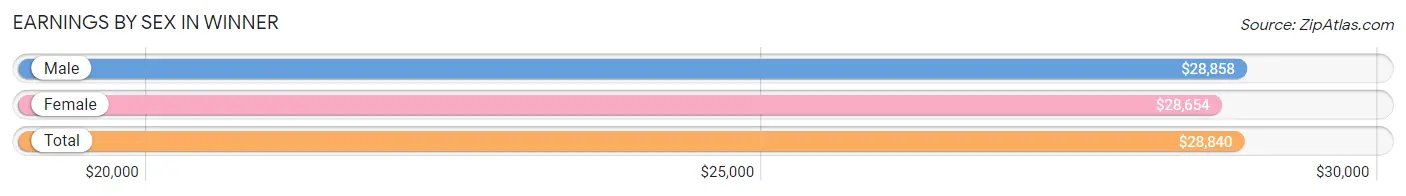
Earnings by Sex in Winner
Average Earnings in Winner are $28,840, $28,858 for men and $28,654 for women, a difference of 0.7%.
| Sex | Number | Average Earnings |
| Male | 861 (58.1%) | $28,858 |
| Female | 620 (41.9%) | $28,654 |
| Total | 1,481 (100.0%) | $28,840 |
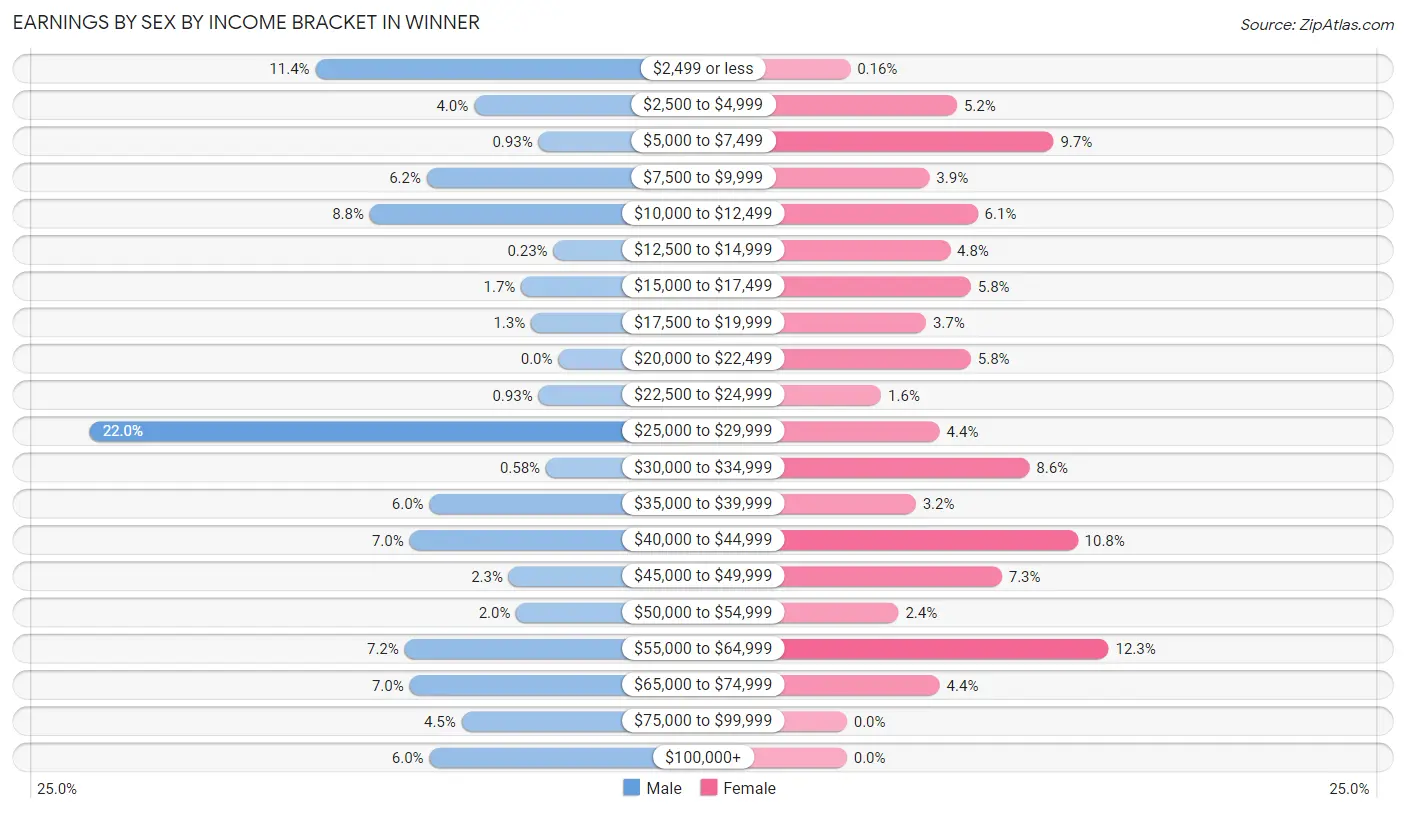
Earnings by Sex by Income Bracket in Winner
The most common earnings brackets in Winner are $25,000 to $29,999 for men (189 | 22.0%) and $55,000 to $64,999 for women (76 | 12.3%).
| Income | Male | Female |
| $2,499 or less | 98 (11.4%) | 1 (0.2%) |
| $2,500 to $4,999 | 34 (4.0%) | 32 (5.2%) |
| $5,000 to $7,499 | 8 (0.9%) | 60 (9.7%) |
| $7,500 to $9,999 | 53 (6.2%) | 24 (3.9%) |
| $10,000 to $12,499 | 76 (8.8%) | 38 (6.1%) |
| $12,500 to $14,999 | 2 (0.2%) | 30 (4.8%) |
| $15,000 to $17,499 | 15 (1.7%) | 36 (5.8%) |
| $17,500 to $19,999 | 11 (1.3%) | 23 (3.7%) |
| $20,000 to $22,499 | 0 (0.0%) | 36 (5.8%) |
| $22,500 to $24,999 | 8 (0.9%) | 10 (1.6%) |
| $25,000 to $29,999 | 189 (22.0%) | 27 (4.3%) |
| $30,000 to $34,999 | 5 (0.6%) | 53 (8.6%) |
| $35,000 to $39,999 | 52 (6.0%) | 20 (3.2%) |
| $40,000 to $44,999 | 60 (7.0%) | 67 (10.8%) |
| $45,000 to $49,999 | 20 (2.3%) | 45 (7.3%) |
| $50,000 to $54,999 | 17 (2.0%) | 15 (2.4%) |
| $55,000 to $64,999 | 62 (7.2%) | 76 (12.3%) |
| $65,000 to $74,999 | 60 (7.0%) | 27 (4.3%) |
| $75,000 to $99,999 | 39 (4.5%) | 0 (0.0%) |
| $100,000+ | 52 (6.0%) | 0 (0.0%) |
| Total | 861 (100.0%) | 620 (100.0%) |
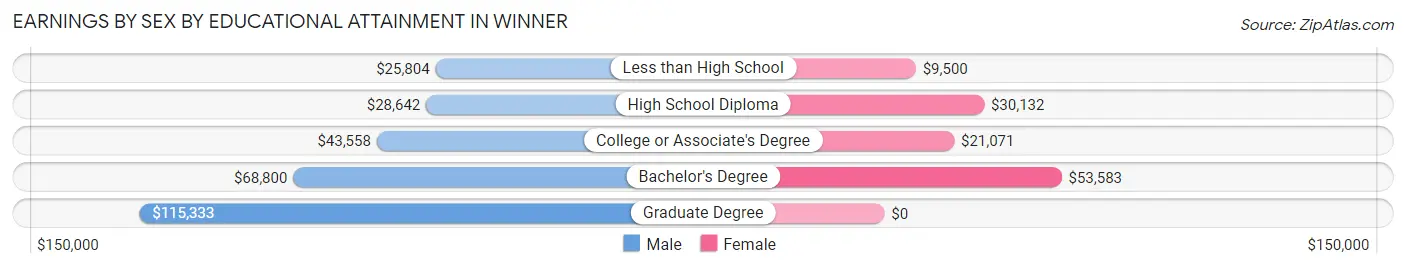
Earnings by Sex by Educational Attainment in Winner
Average earnings in Winner are $29,577 for men and $30,283 for women, a difference of 2.3%. Men with an educational attainment of graduate degree enjoy the highest average annual earnings of $115,333, while those with less than high school education earn the least with $25,804. Women with an educational attainment of bachelor's degree earn the most with the average annual earnings of $53,583, while those with less than high school education have the smallest earnings of $9,500.
| Educational Attainment | Male Income | Female Income |
| Less than High School | $25,804 | $9,500 |
| High School Diploma | $28,642 | $30,132 |
| College or Associate's Degree | $43,558 | $21,071 |
| Bachelor's Degree | $68,800 | $53,583 |
| Graduate Degree | $115,333 | $0 |
| Total | $29,577 | $30,283 |
Family Income in Winner
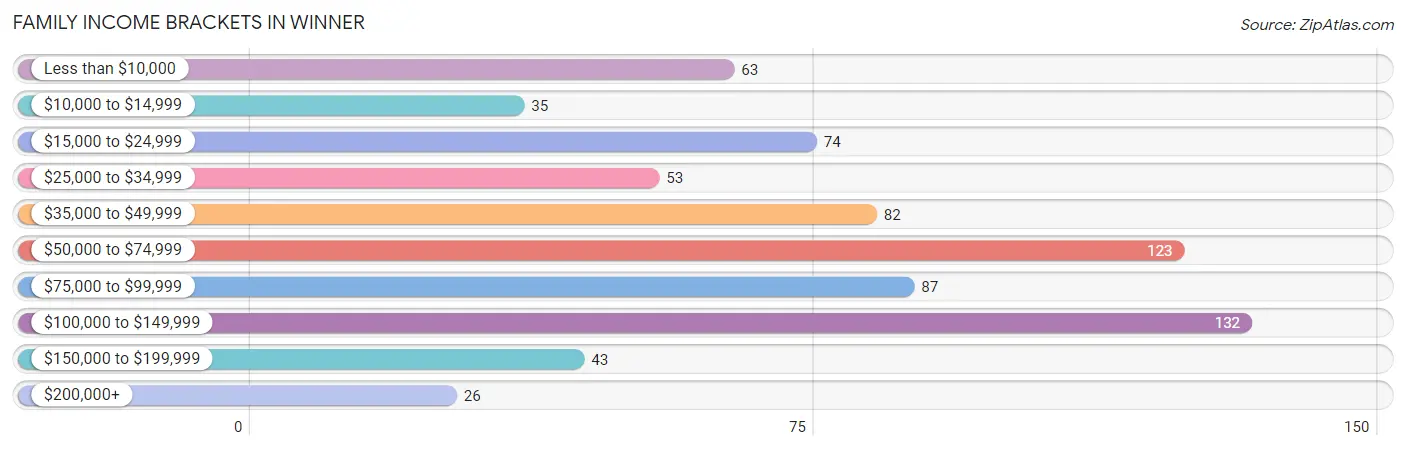
Family Income Brackets in Winner
According to the Winner family income data, there are 132 families falling into the $100,000 to $149,999 income range, which is the most common income bracket and makes up 18.4% of all families. Conversely, the $200,000+ income bracket is the least frequent group with only 26 families (3.6%) belonging to this category.
| Income Bracket | # Families | % Families |
| Less than $10,000 | 63 | 8.8% |
| $10,000 to $14,999 | 35 | 4.9% |
| $15,000 to $24,999 | 74 | 10.3% |
| $25,000 to $34,999 | 53 | 7.4% |
| $35,000 to $49,999 | 82 | 11.4% |
| $50,000 to $74,999 | 123 | 17.1% |
| $75,000 to $99,999 | 87 | 12.1% |
| $100,000 to $149,999 | 132 | 18.4% |
| $150,000 to $199,999 | 43 | 6.0% |
| $200,000+ | 26 | 3.6% |
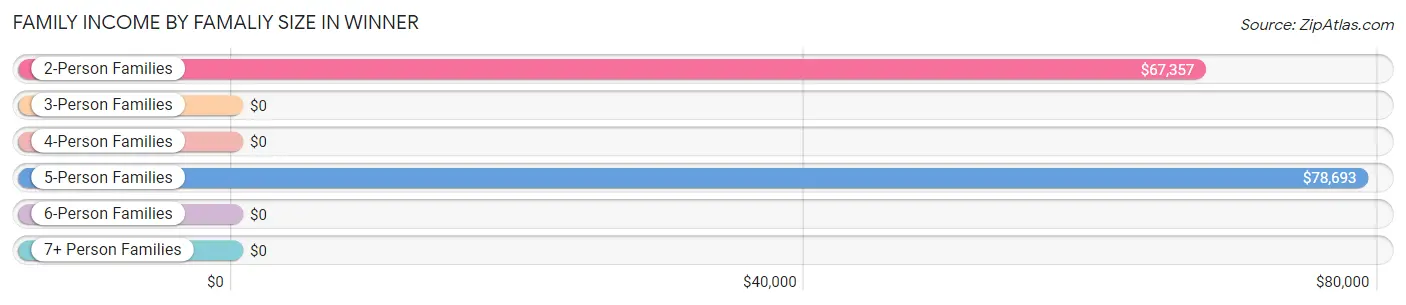
Family Income by Famaliy Size in Winner
5-person families (37 | 5.1%) account for the highest median family income in Winner with $78,693 per family, while 2-person families (428 | 59.6%) have the highest median income of $33,678 per family member.
| Income Bracket | # Families | Median Income |
| 2-Person Families | 428 (59.6%) | $67,357 |
| 3-Person Families | 147 (20.5%) | $0 |
| 4-Person Families | 74 (10.3%) | $0 |
| 5-Person Families | 37 (5.1%) | $78,693 |
| 6-Person Families | 32 (4.5%) | $0 |
| 7+ Person Families | 0 (0.0%) | $0 |
| Total | 718 (100.0%) | $65,956 |
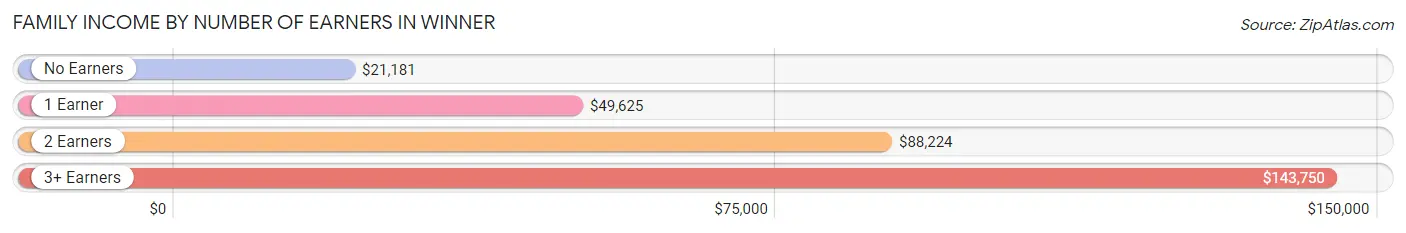
Family Income by Number of Earners in Winner
The median family income in Winner is $65,956, with families comprising 3+ earners (32) having the highest median family income of $143,750, while families with no earners (117) have the lowest median family income of $21,181, accounting for 4.5% and 16.3% of families, respectively.
| Number of Earners | # Families | Median Income |
| No Earners | 117 (16.3%) | $21,181 |
| 1 Earner | 274 (38.2%) | $49,625 |
| 2 Earners | 295 (41.1%) | $88,224 |
| 3+ Earners | 32 (4.5%) | $143,750 |
| Total | 718 (100.0%) | $65,956 |
Household Income in Winner
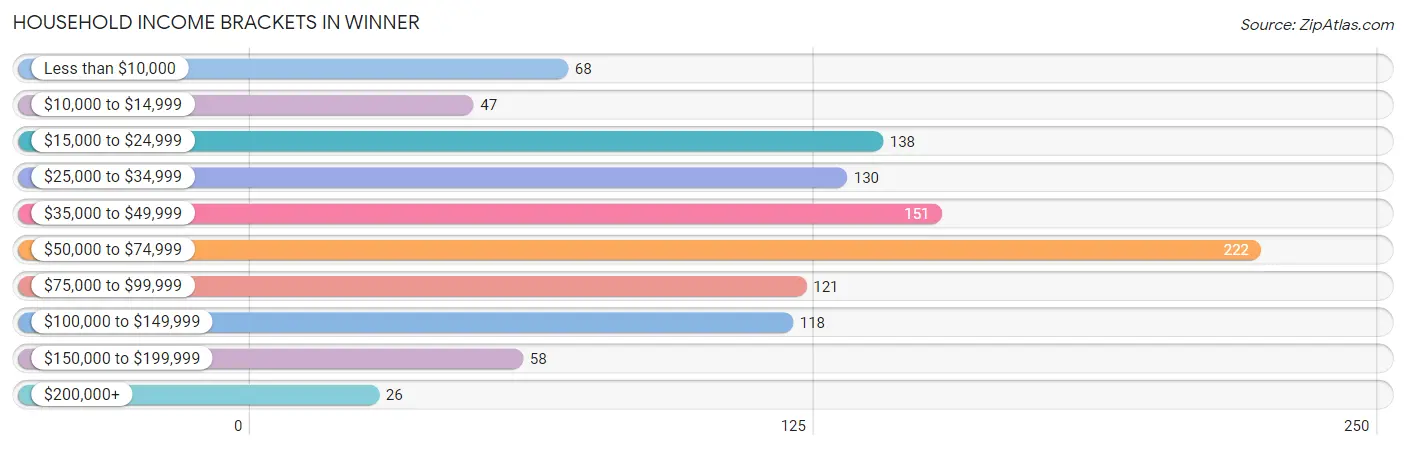
Household Income Brackets in Winner
With 222 households falling in the category, the $50,000 to $74,999 income range is the most frequent in Winner, accounting for 20.6% of all households. In contrast, only 26 households (2.4%) fall into the $200,000+ income bracket, making it the least populous group.
| Income Bracket | # Households | % Households |
| Less than $10,000 | 68 | 6.3% |
| $10,000 to $14,999 | 47 | 4.4% |
| $15,000 to $24,999 | 138 | 12.8% |
| $25,000 to $34,999 | 130 | 12.1% |
| $35,000 to $49,999 | 151 | 14.0% |
| $50,000 to $74,999 | 222 | 20.6% |
| $75,000 to $99,999 | 121 | 11.2% |
| $100,000 to $149,999 | 118 | 10.9% |
| $150,000 to $199,999 | 58 | 5.4% |
| $200,000+ | 26 | 2.4% |
Household Income by Householder Age in Winner
The median household income in Winner is $52,500, with the highest median household income of $57,813 found in the 45 to 64 years age bracket for the primary householder. A total of 370 households (34.3%) fall into this category. Meanwhile, the 15 to 24 years age bracket for the primary householder has the lowest median household income of $0, with 24 households (2.2%) in this group.
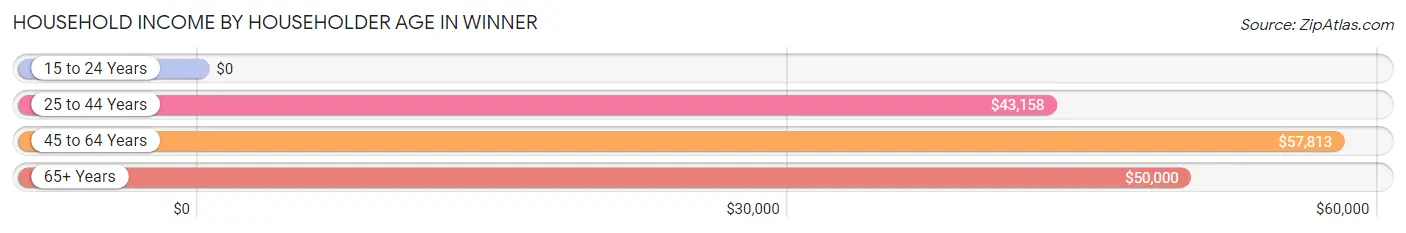
| Income Bracket | # Households | Median Income |
| 15 to 24 Years | 24 (2.2%) | $0 |
| 25 to 44 Years | 310 (28.8%) | $43,158 |
| 45 to 64 Years | 370 (34.3%) | $57,813 |
| 65+ Years | 374 (34.7%) | $50,000 |
| Total | 1,078 (100.0%) | $52,500 |
Poverty in Winner
Income Below Poverty by Sex and Age in Winner
With 22.4% poverty level for males and 33.6% for females among the residents of Winner, 6 to 11 year old males and 5 year old females are the most vulnerable to poverty, with 49 males (53.8%) and 23 females (100.0%) in their respective age groups living below the poverty level.
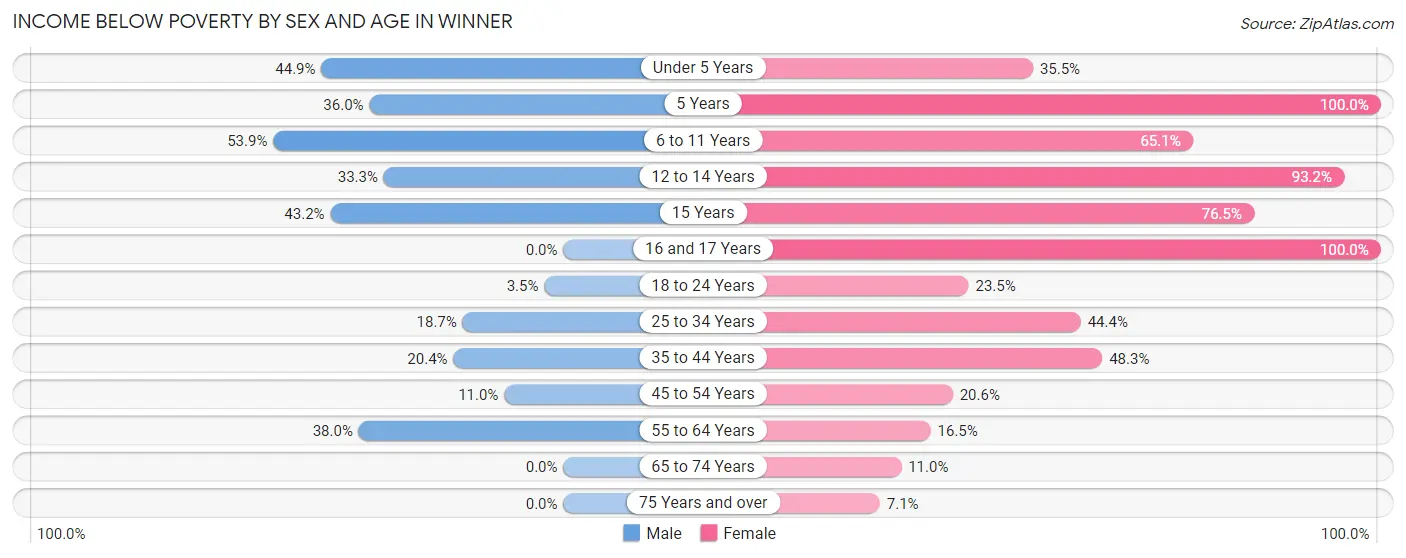
| Age Bracket | Male | Female |
| Under 5 Years | 53 (44.9%) | 22 (35.5%) |
| 5 Years | 9 (36.0%) | 23 (100.0%) |
| 6 to 11 Years | 49 (53.8%) | 69 (65.1%) |
| 12 to 14 Years | 14 (33.3%) | 41 (93.2%) |
| 15 Years | 16 (43.2%) | 13 (76.5%) |
| 16 and 17 Years | 0 (0.0%) | 10 (100.0%) |
| 18 to 24 Years | 3 (3.5%) | 8 (23.5%) |
| 25 to 34 Years | 46 (18.7%) | 102 (44.4%) |
| 35 to 44 Years | 30 (20.4%) | 73 (48.3%) |
| 45 to 54 Years | 19 (11.0%) | 35 (20.6%) |
| 55 to 64 Years | 79 (38.0%) | 32 (16.5%) |
| 65 to 74 Years | 0 (0.0%) | 16 (11.0%) |
| 75 Years and over | 0 (0.0%) | 12 (7.1%) |
| Total | 318 (22.4%) | 456 (33.6%) |
Income Above Poverty by Sex and Age in Winner
According to the poverty statistics in Winner, males aged 16 and 17 years and females aged 75 years and over are the age groups that are most secure financially, with 100.0% of males and 92.9% of females in these age groups living above the poverty line.
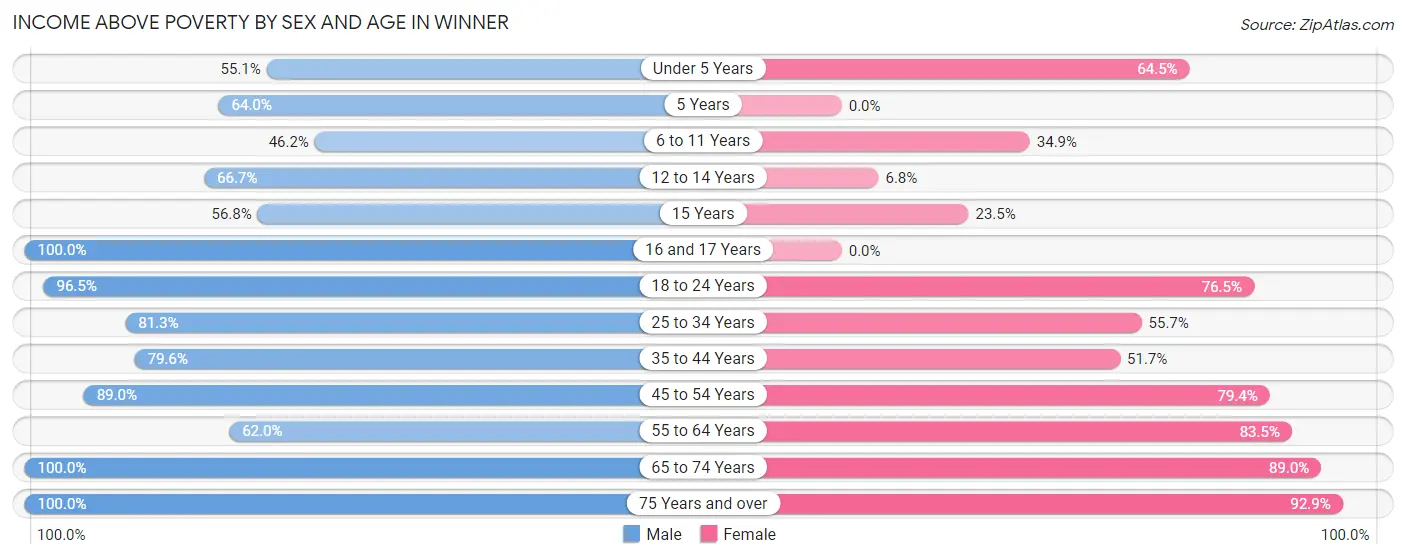
| Age Bracket | Male | Female |
| Under 5 Years | 65 (55.1%) | 40 (64.5%) |
| 5 Years | 16 (64.0%) | 0 (0.0%) |
| 6 to 11 Years | 42 (46.2%) | 37 (34.9%) |
| 12 to 14 Years | 28 (66.7%) | 3 (6.8%) |
| 15 Years | 21 (56.8%) | 4 (23.5%) |
| 16 and 17 Years | 14 (100.0%) | 0 (0.0%) |
| 18 to 24 Years | 82 (96.5%) | 26 (76.5%) |
| 25 to 34 Years | 200 (81.3%) | 128 (55.6%) |
| 35 to 44 Years | 117 (79.6%) | 78 (51.7%) |
| 45 to 54 Years | 154 (89.0%) | 135 (79.4%) |
| 55 to 64 Years | 129 (62.0%) | 162 (83.5%) |
| 65 to 74 Years | 138 (100.0%) | 129 (89.0%) |
| 75 Years and over | 95 (100.0%) | 158 (92.9%) |
| Total | 1,101 (77.6%) | 900 (66.4%) |
Income Below Poverty Among Married-Couple Families in Winner
The poverty statistics for married-couple families in Winner show that 7.1% or 36 of the total 506 families live below the poverty line. Families with 3 or 4 children have the highest poverty rate of 25.6%, comprising of 10 families. On the other hand, families with no children have the lowest poverty rate of 4.8%, which includes 18 families.
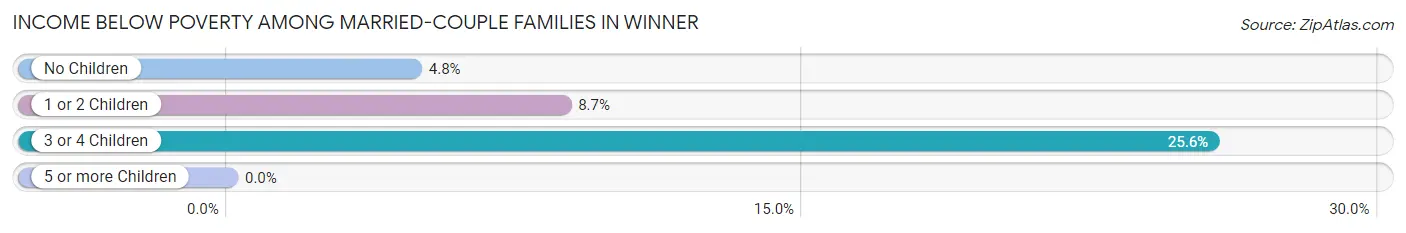
| Children | Above Poverty | Below Poverty |
| No Children | 357 (95.2%) | 18 (4.8%) |
| 1 or 2 Children | 84 (91.3%) | 8 (8.7%) |
| 3 or 4 Children | 29 (74.4%) | 10 (25.6%) |
| 5 or more Children | 0 (0.0%) | 0 (0.0%) |
| Total | 470 (92.9%) | 36 (7.1%) |
Income Below Poverty Among Single-Parent Households in Winner
According to the poverty data in Winner, 42.6% or 29 single-father households and 63.2% or 91 single-mother households are living below the poverty line. Among single-father households, those with 1 or 2 children have the highest poverty rate, with 29 households (90.6%) experiencing poverty. Likewise, among single-mother households, those with 1 or 2 children have the highest poverty rate, with 48 households (75.0%) falling below the poverty line.
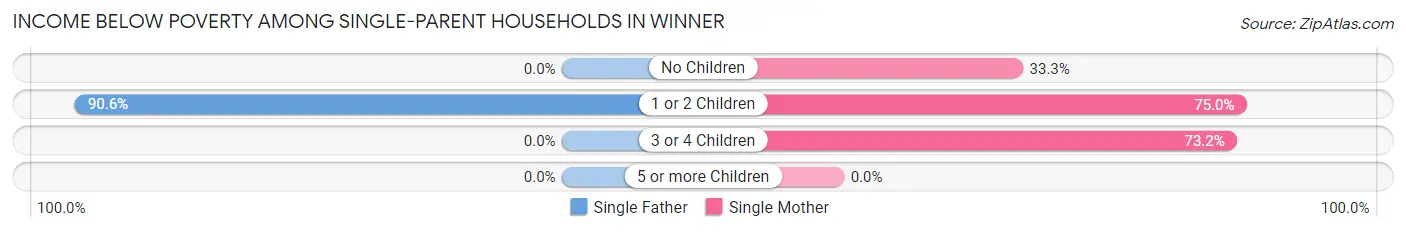
| Children | Single Father | Single Mother |
| No Children | 0 (0.0%) | 13 (33.3%) |
| 1 or 2 Children | 29 (90.6%) | 48 (75.0%) |
| 3 or 4 Children | 0 (0.0%) | 30 (73.2%) |
| 5 or more Children | 0 (0.0%) | 0 (0.0%) |
| Total | 29 (42.6%) | 91 (63.2%) |
Income Below Poverty Among Married-Couple vs Single-Parent Households in Winner
The poverty data for Winner shows that 36 of the married-couple family households (7.1%) and 120 of the single-parent households (56.6%) are living below the poverty level. Within the married-couple family households, those with 3 or 4 children have the highest poverty rate, with 10 households (25.6%) falling below the poverty line. Among the single-parent households, those with 1 or 2 children have the highest poverty rate, with 77 household (80.2%) living below poverty.
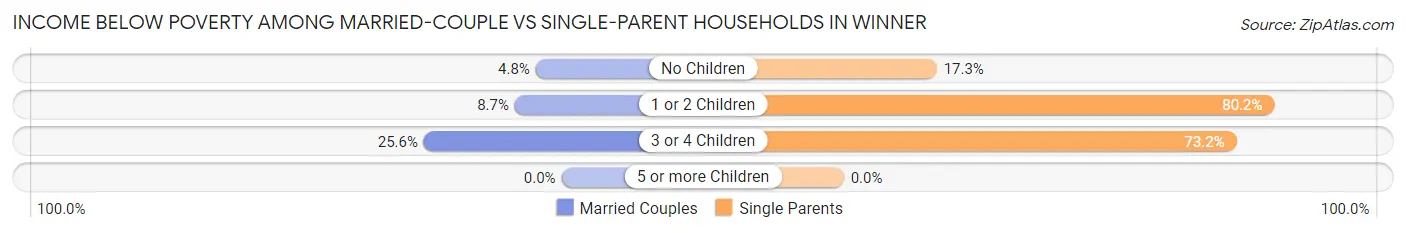
| Children | Married-Couple Families | Single-Parent Households |
| No Children | 18 (4.8%) | 13 (17.3%) |
| 1 or 2 Children | 8 (8.7%) | 77 (80.2%) |
| 3 or 4 Children | 10 (25.6%) | 30 (73.2%) |
| 5 or more Children | 0 (0.0%) | 0 (0.0%) |
| Total | 36 (7.1%) | 120 (56.6%) |
Race in Winner
The most populous races in Winner are White / Caucasian (2,145 | 73.8%), Native / Alaskan (574 | 19.8%), and Two or more Races (122 | 4.2%).
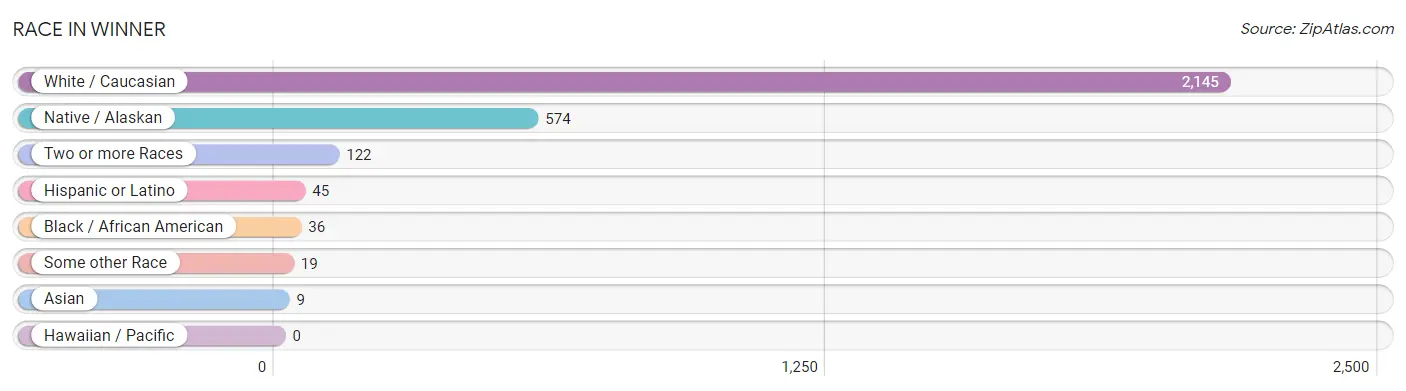
| Race | # Population | % Population |
| Asian | 9 | 0.3% |
| Black / African American | 36 | 1.2% |
| Hawaiian / Pacific | 0 | 0.0% |
| Hispanic or Latino | 45 | 1.5% |
| Native / Alaskan | 574 | 19.8% |
| White / Caucasian | 2,145 | 73.8% |
| Two or more Races | 122 | 4.2% |
| Some other Race | 19 | 0.6% |
| Total | 2,905 | 100.0% |
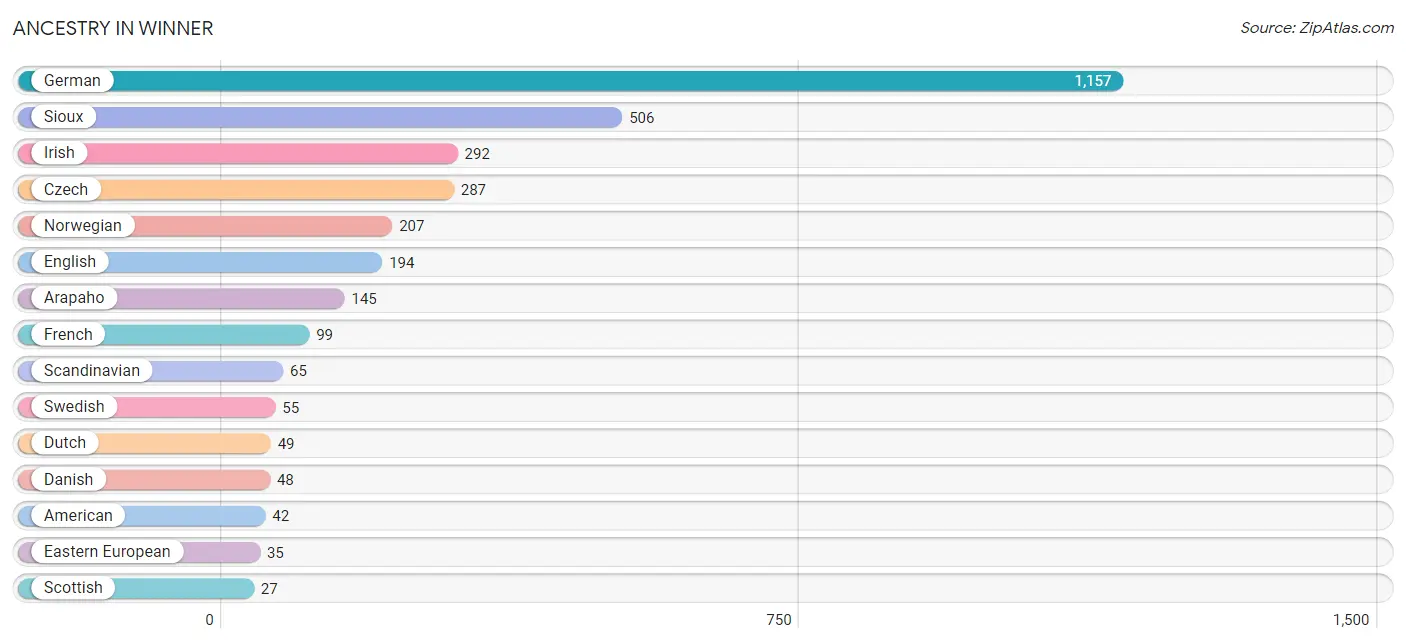
Ancestry in Winner
The most populous ancestries reported in Winner are German (1,157 | 39.8%), Sioux (506 | 17.4%), Irish (292 | 10.1%), Czech (287 | 9.9%), and Norwegian (207 | 7.1%), together accounting for 84.3% of all Winner residents.
| Ancestry | # Population | % Population |
| American | 42 | 1.5% |
| Arapaho | 145 | 5.0% |
| Burmese | 5 | 0.2% |
| Central American | 26 | 0.9% |
| Cherokee | 6 | 0.2% |
| Czech | 287 | 9.9% |
| Czechoslovakian | 7 | 0.2% |
| Danish | 48 | 1.7% |
| Dutch | 49 | 1.7% |
| Eastern European | 35 | 1.2% |
| English | 194 | 6.7% |
| European | 14 | 0.5% |
| Finnish | 22 | 0.8% |
| French | 99 | 3.4% |
| French Canadian | 26 | 0.9% |
| German | 1,157 | 39.8% |
| Irish | 292 | 10.1% |
| Italian | 25 | 0.9% |
| Korean | 4 | 0.1% |
| Mexican | 19 | 0.6% |
| Norwegian | 207 | 7.1% |
| Polish | 13 | 0.4% |
| Russian | 10 | 0.3% |
| Salvadoran | 26 | 0.9% |
| Scandinavian | 65 | 2.2% |
| Scotch-Irish | 8 | 0.3% |
| Scottish | 27 | 0.9% |
| Sioux | 506 | 17.4% |
| Swedish | 55 | 1.9% |
| Welsh | 6 | 0.2% | View All 30 Rows |
Immigrants in Winner
The most numerous immigrant groups reported in Winner came from Central America (26 | 0.9%), El Salvador (26 | 0.9%), Latin America (26 | 0.9%), Asia (9 | 0.3%), and Eastern Asia (5 | 0.2%), together accounting for 3.2% of all Winner residents.
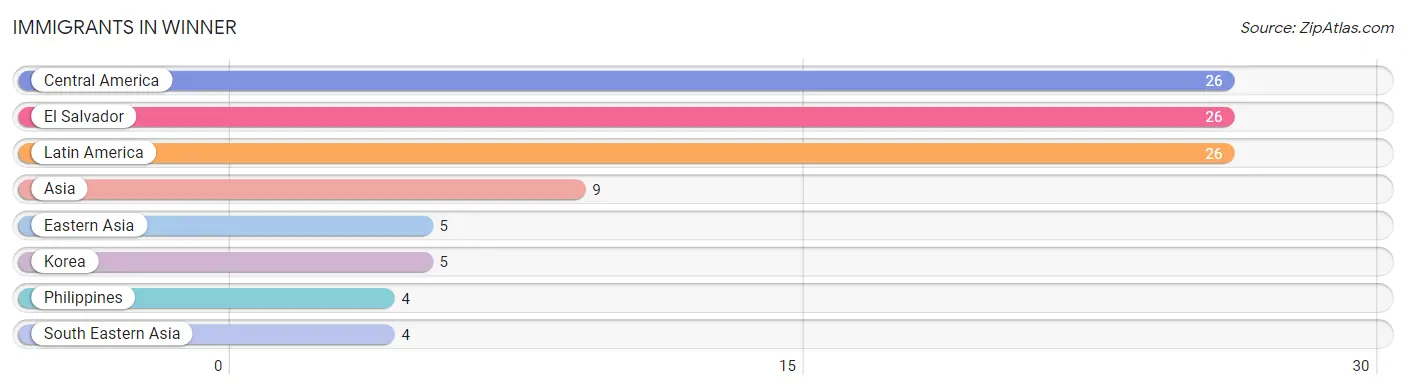
| Immigration Origin | # Population | % Population |
| Asia | 9 | 0.3% |
| Central America | 26 | 0.9% |
| Eastern Asia | 5 | 0.2% |
| El Salvador | 26 | 0.9% |
| Korea | 5 | 0.2% |
| Latin America | 26 | 0.9% |
| Philippines | 4 | 0.1% |
| South Eastern Asia | 4 | 0.1% | View All 8 Rows |
Sex and Age in Winner
Sex and Age in Winner
The most populous age groups in Winner are 55 to 59 Years (169 | 11.1%) for men and 25 to 29 Years (145 | 10.5%) for women.
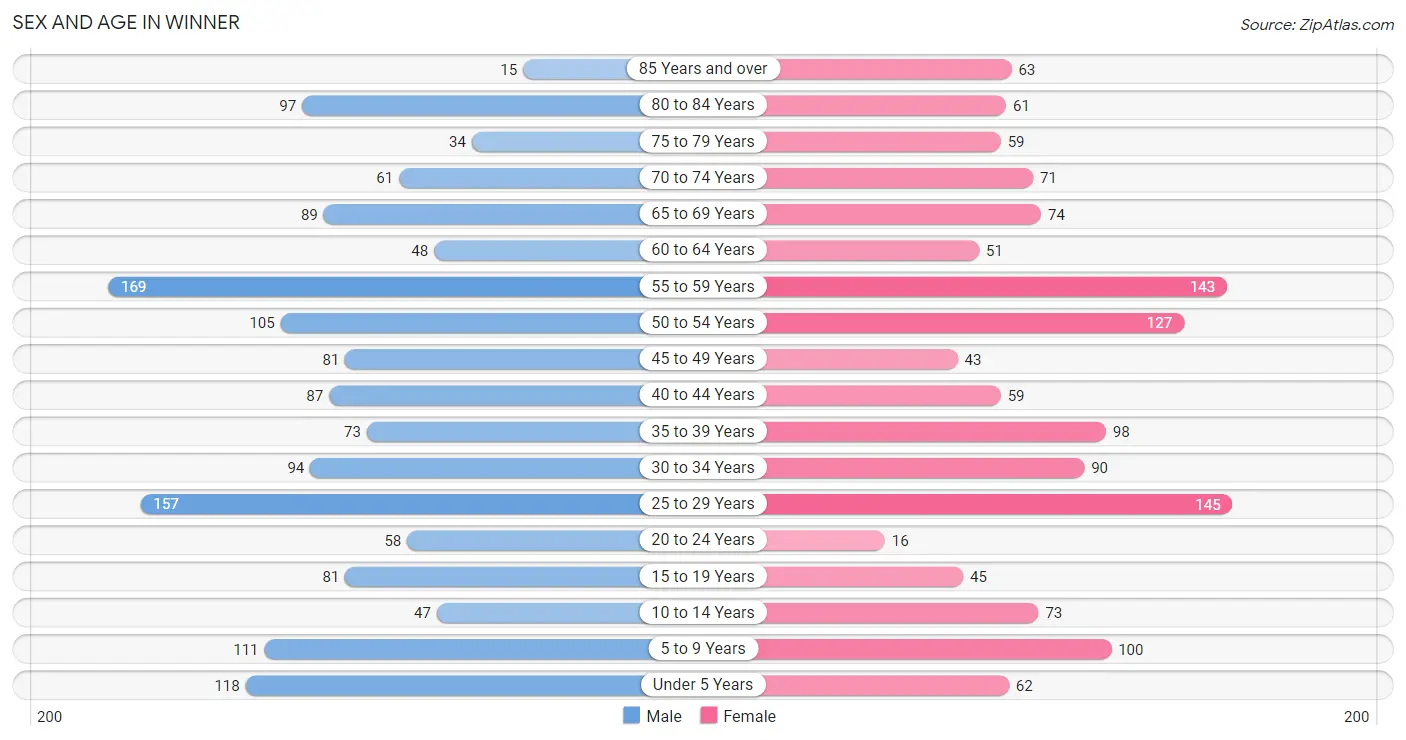
| Age Bracket | Male | Female |
| Under 5 Years | 118 (7.7%) | 62 (4.5%) |
| 5 to 9 Years | 111 (7.3%) | 100 (7.2%) |
| 10 to 14 Years | 47 (3.1%) | 73 (5.3%) |
| 15 to 19 Years | 81 (5.3%) | 45 (3.3%) |
| 20 to 24 Years | 58 (3.8%) | 16 (1.2%) |
| 25 to 29 Years | 157 (10.3%) | 145 (10.5%) |
| 30 to 34 Years | 94 (6.2%) | 90 (6.5%) |
| 35 to 39 Years | 73 (4.8%) | 98 (7.1%) |
| 40 to 44 Years | 87 (5.7%) | 59 (4.3%) |
| 45 to 49 Years | 81 (5.3%) | 43 (3.1%) |
| 50 to 54 Years | 105 (6.9%) | 127 (9.2%) |
| 55 to 59 Years | 169 (11.1%) | 143 (10.4%) |
| 60 to 64 Years | 48 (3.2%) | 51 (3.7%) |
| 65 to 69 Years | 89 (5.8%) | 74 (5.4%) |
| 70 to 74 Years | 61 (4.0%) | 71 (5.1%) |
| 75 to 79 Years | 34 (2.2%) | 59 (4.3%) |
| 80 to 84 Years | 97 (6.4%) | 61 (4.4%) |
| 85 Years and over | 15 (1.0%) | 63 (4.6%) |
| Total | 1,525 (100.0%) | 1,380 (100.0%) |
Families and Households in Winner
Median Family Size in Winner
The median family size in Winner is 3.06 persons per family, with single female/mother families (144 | 20.1%) accounting for the largest median family size of 4.25 persons per family. On the other hand, single male/father families (68 | 9.5%) represent the smallest median family size with 2.51 persons per family.
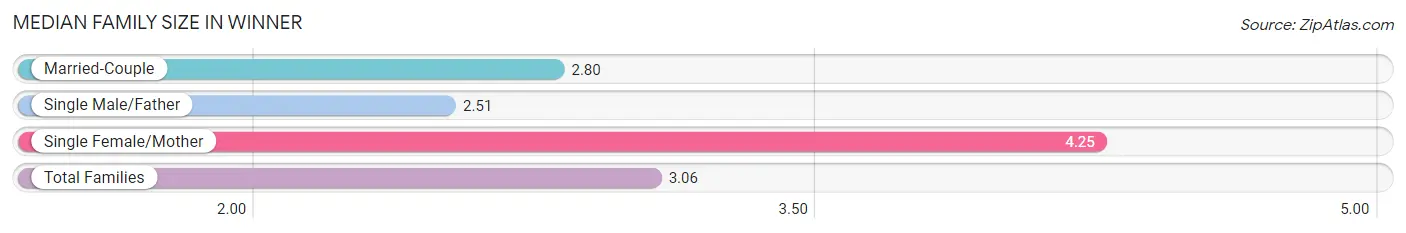
| Family Type | # Families | Family Size |
| Married-Couple | 506 (70.5%) | 2.80 |
| Single Male/Father | 68 (9.5%) | 2.51 |
| Single Female/Mother | 144 (20.1%) | 4.25 |
| Total Families | 718 (100.0%) | 3.06 |
Median Household Size in Winner
The median household size in Winner is 2.55 persons per household, with single female/mother households (144 | 13.4%) accounting for the largest median household size of 4.74 persons per household. non-family households (360 | 33.4%) represent the smallest median household size with 1.06 persons per household.
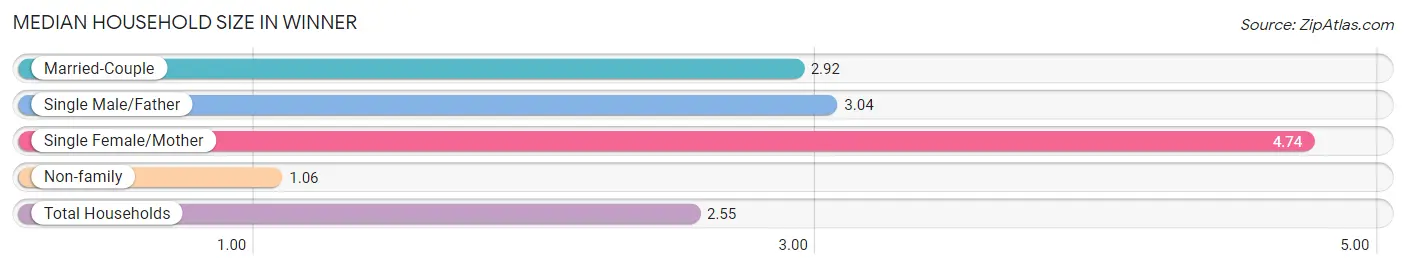
| Household Type | # Households | Household Size |
| Married-Couple | 506 (46.9%) | 2.92 |
| Single Male/Father | 68 (6.3%) | 3.04 |
| Single Female/Mother | 144 (13.4%) | 4.74 |
| Non-family | 360 (33.4%) | 1.06 |
| Total Households | 1,078 (100.0%) | 2.55 |
Household Size by Marriage Status in Winner
Out of a total of 1,078 households in Winner, 718 (66.6%) are family households, while 360 (33.4%) are nonfamily households. The most numerous type of family households are 2-person households, comprising 371, and the most common type of nonfamily households are 1-person households, comprising 339.
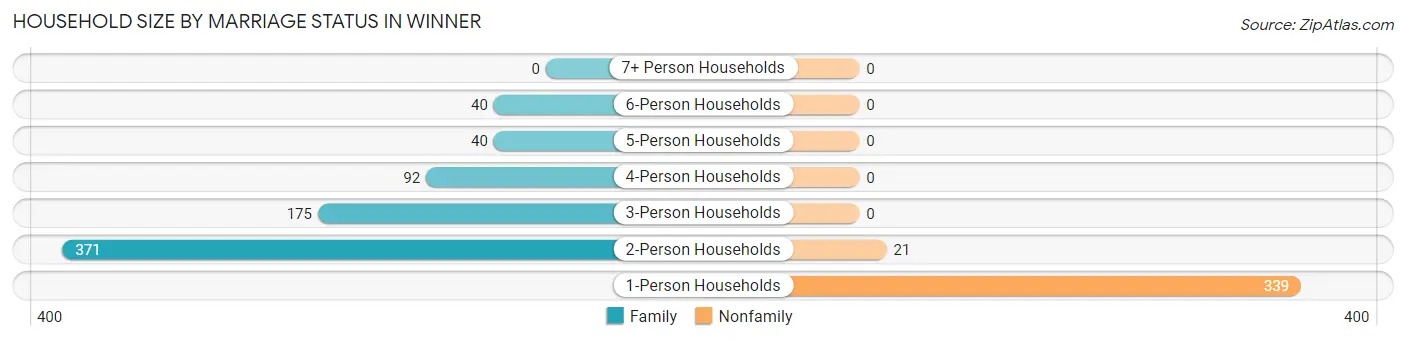
| Household Size | Family Households | Nonfamily Households |
| 1-Person Households | - | 339 (31.5%) |
| 2-Person Households | 371 (34.4%) | 21 (1.9%) |
| 3-Person Households | 175 (16.2%) | 0 (0.0%) |
| 4-Person Households | 92 (8.5%) | 0 (0.0%) |
| 5-Person Households | 40 (3.7%) | 0 (0.0%) |
| 6-Person Households | 40 (3.7%) | 0 (0.0%) |
| 7+ Person Households | 0 (0.0%) | 0 (0.0%) |
| Total | 718 (66.6%) | 360 (33.4%) |
Female Fertility in Winner
Fertility by Age in Winner
Average fertility rate in Winner is 27.0 births per 1,000 women. Women in the age bracket of 20 to 34 years have the highest fertility rate with 56.0 births per 1,000 women. Women in the age bracket of 20 to 34 years acount for 100.0% of all women with births.
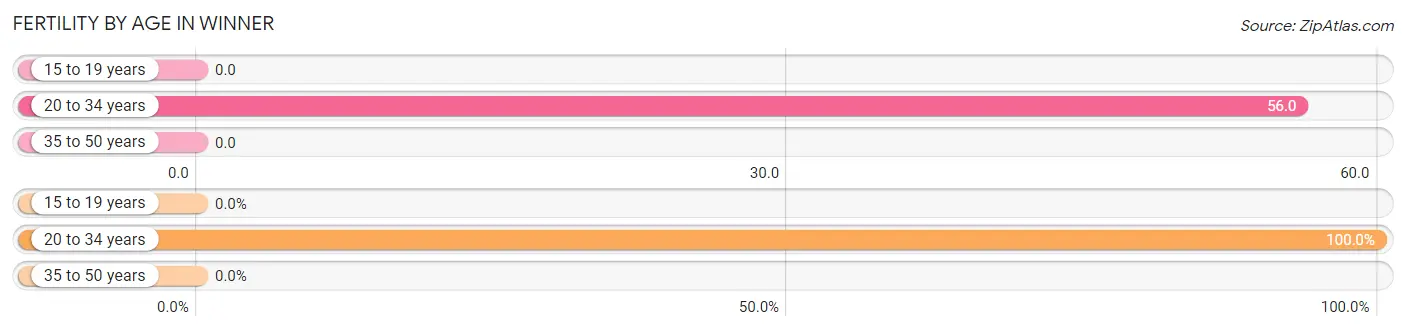
| Age Bracket | Women with Births | Births / 1,000 Women |
| 15 to 19 years | 0 (0.0%) | 0.0 |
| 20 to 34 years | 14 (100.0%) | 56.0 |
| 35 to 50 years | 0 (0.0%) | 0.0 |
| Total | 14 (100.0%) | 27.0 |
Fertility by Age by Marriage Status in Winner
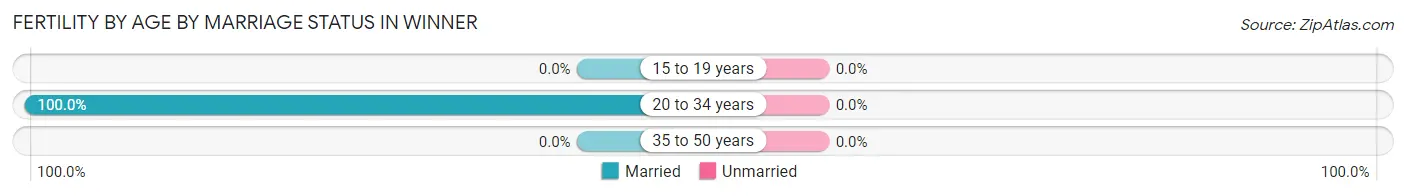
| Age Bracket | Married | Unmarried |
| 15 to 19 years | 0 (0.0%) | 0 (0.0%) |
| 20 to 34 years | 14 (100.0%) | 0 (0.0%) |
| 35 to 50 years | 0 (0.0%) | 0 (0.0%) |
| Total | 14 (100.0%) | 0 (0.0%) |
Fertility by Education in Winner
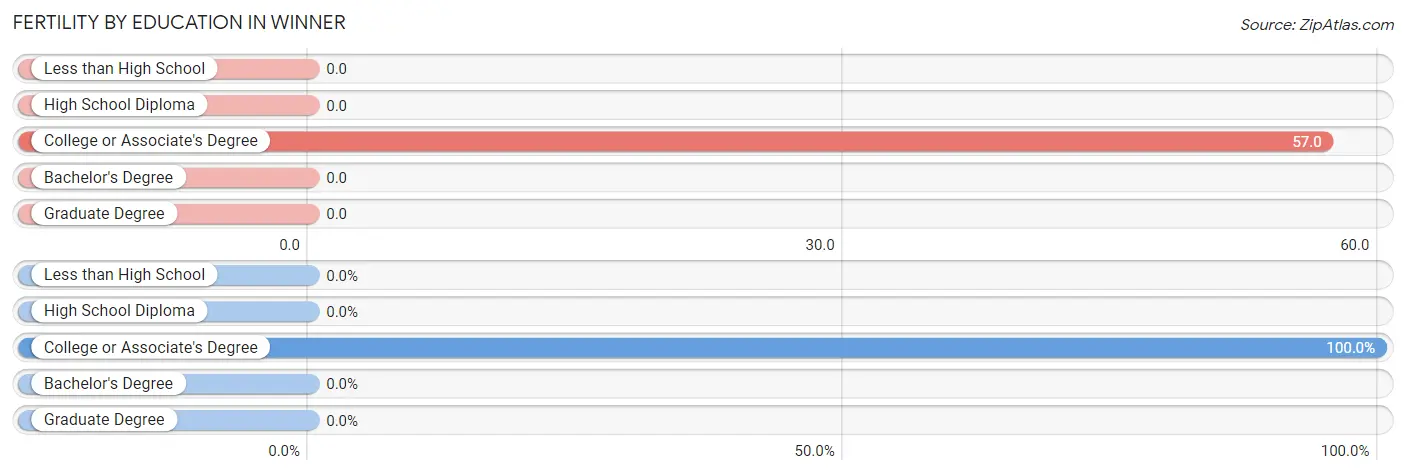
| Educational Attainment | Women with Births | Births / 1,000 Women |
| Less than High School | 0 (0.0%) | 0.0 |
| High School Diploma | 0 (0.0%) | 0.0 |
| College or Associate's Degree | 14 (100.0%) | 57.0 |
| Bachelor's Degree | 0 (0.0%) | 0.0 |
| Graduate Degree | 0 (0.0%) | 0.0 |
| Total | 14 (100.0%) | 27.0 |
Fertility by Education by Marriage Status in Winner
| Educational Attainment | Married | Unmarried |
| Less than High School | 0 (0.0%) | 0 (0.0%) |
| High School Diploma | 0 (0.0%) | 0 (0.0%) |
| College or Associate's Degree | 14 (100.0%) | 0 (0.0%) |
| Bachelor's Degree | 0 (0.0%) | 0 (0.0%) |
| Graduate Degree | 0 (0.0%) | 0 (0.0%) |
| Total | 14 (100.0%) | 0 (0.0%) |
Employment Characteristics in Winner
Employment by Class of Employer in Winner
Among the 1,266 employed individuals in Winner, private company employees (662 | 52.3%), not-for-profit organizations (195 | 15.4%), and local government employees (178 | 14.1%) make up the most common classes of employment.
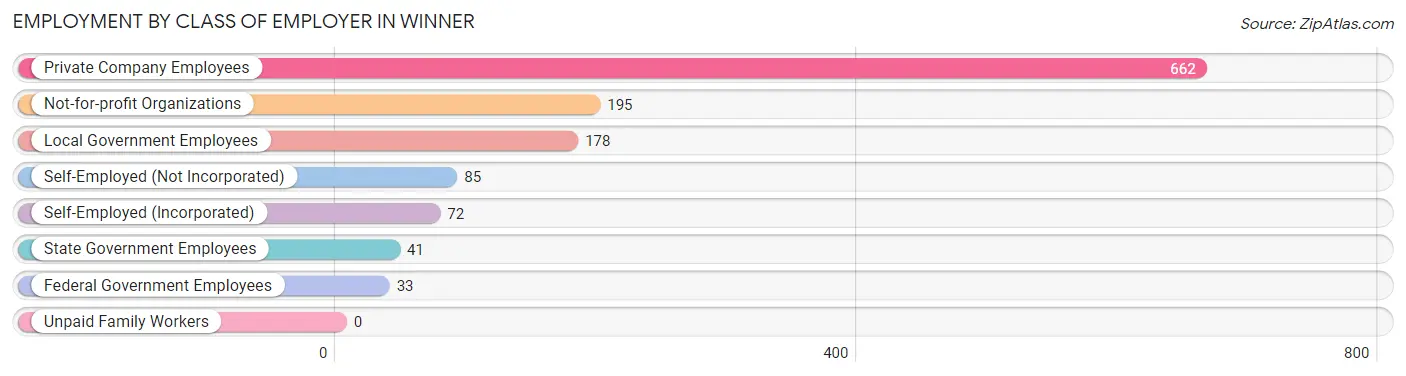
| Employer Class | # Employees | % Employees |
| Private Company Employees | 662 | 52.3% |
| Self-Employed (Incorporated) | 72 | 5.7% |
| Self-Employed (Not Incorporated) | 85 | 6.7% |
| Not-for-profit Organizations | 195 | 15.4% |
| Local Government Employees | 178 | 14.1% |
| State Government Employees | 41 | 3.2% |
| Federal Government Employees | 33 | 2.6% |
| Unpaid Family Workers | 0 | 0.0% |
| Total | 1,266 | 100.0% |
Employment Status by Age in Winner
According to the labor force statistics for Winner, out of the total population over 16 years of age (2,340), 60.7% or 1,420 individuals are in the labor force, with 8.7% or 124 of them unemployed. The age group with the highest labor force participation rate is 25 to 29 years, with 87.1% or 263 individuals in the labor force. Within the labor force, the 25 to 29 years age range has the highest percentage of unemployed individuals, with 25.9% or 68 of them being unemployed.
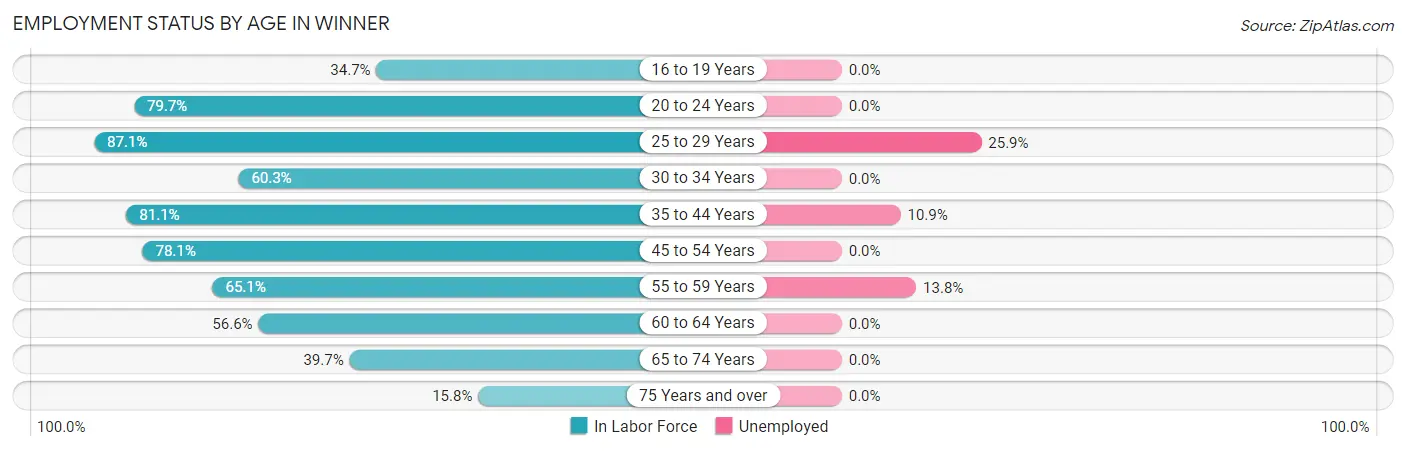
| Age Bracket | In Labor Force | Unemployed |
| 16 to 19 Years | 25 (34.7%) | 0 (0.0%) |
| 20 to 24 Years | 59 (79.7%) | 0 (0.0%) |
| 25 to 29 Years | 263 (87.1%) | 68 (25.9%) |
| 30 to 34 Years | 111 (60.3%) | 0 (0.0%) |
| 35 to 44 Years | 257 (81.1%) | 28 (10.9%) |
| 45 to 54 Years | 278 (78.1%) | 0 (0.0%) |
| 55 to 59 Years | 203 (65.1%) | 28 (13.8%) |
| 60 to 64 Years | 56 (56.6%) | 0 (0.0%) |
| 65 to 74 Years | 117 (39.7%) | 0 (0.0%) |
| 75 Years and over | 52 (15.8%) | 0 (0.0%) |
| Total | 1,420 (60.7%) | 124 (8.7%) |
Employment Status by Educational Attainment in Winner
According to labor force statistics for Winner, 74.4% of individuals (1,168) out of the total population between 25 and 64 years of age (1,570) are in the labor force, with 10.6% or 124 of them being unemployed. The group with the highest labor force participation rate are those with the educational attainment of bachelor's degree or higher, with 92.1% or 175 individuals in the labor force. Within the labor force, individuals with less than high school education have the highest percentage of unemployment, with 22.5% or 20 of them being unemployed.
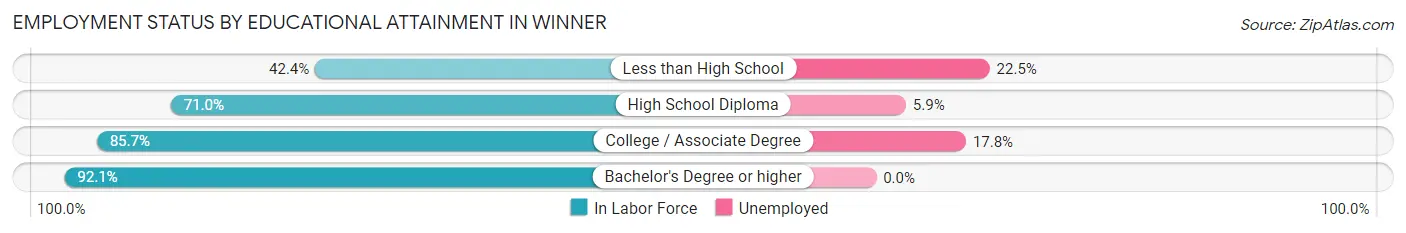
| Educational Attainment | In Labor Force | Unemployed |
| Less than High School | 89 (42.4%) | 47 (22.5%) |
| High School Diploma | 478 (71.0%) | 40 (5.9%) |
| College / Associate Degree | 426 (85.7%) | 88 (17.8%) |
| Bachelor's Degree or higher | 175 (92.1%) | 0 (0.0%) |
| Total | 1,168 (74.4%) | 166 (10.6%) |
Employment Occupations by Sex in Winner
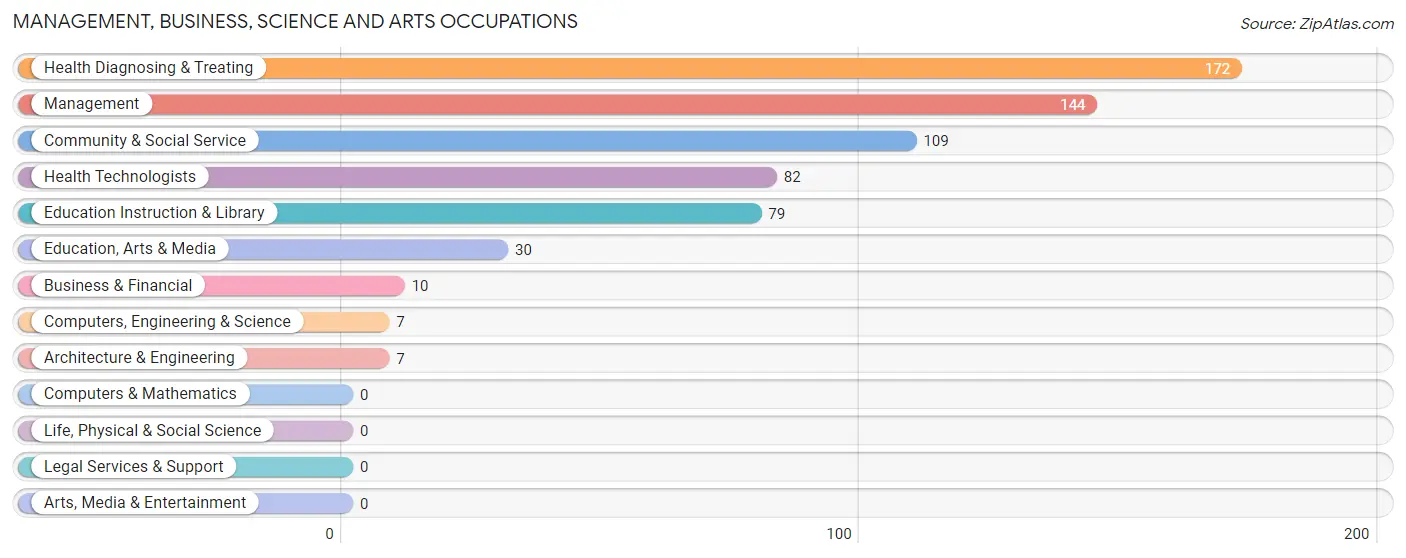
Management, Business, Science and Arts Occupations
The most common Management, Business, Science and Arts occupations in Winner are Health Diagnosing & Treating (172 | 13.3%), Management (144 | 11.1%), Community & Social Service (109 | 8.4%), Health Technologists (82 | 6.3%), and Education Instruction & Library (79 | 6.1%).
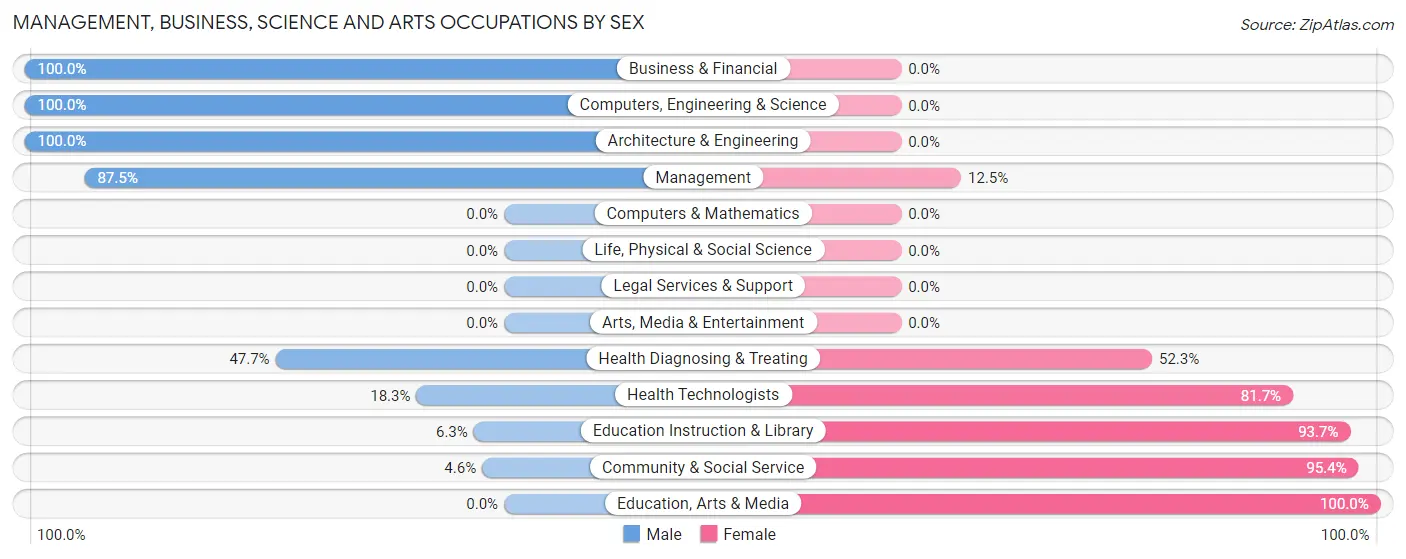
Management, Business, Science and Arts Occupations by Sex
Within the Management, Business, Science and Arts occupations in Winner, the most male-oriented occupations are Business & Financial (100.0%), Computers, Engineering & Science (100.0%), and Architecture & Engineering (100.0%), while the most female-oriented occupations are Education, Arts & Media (100.0%), Community & Social Service (95.4%), and Education Instruction & Library (93.7%).
| Occupation | Male | Female |
| Management | 126 (87.5%) | 18 (12.5%) |
| Business & Financial | 10 (100.0%) | 0 (0.0%) |
| Computers, Engineering & Science | 7 (100.0%) | 0 (0.0%) |
| Computers & Mathematics | 0 (0.0%) | 0 (0.0%) |
| Architecture & Engineering | 7 (100.0%) | 0 (0.0%) |
| Life, Physical & Social Science | 0 (0.0%) | 0 (0.0%) |
| Community & Social Service | 5 (4.6%) | 104 (95.4%) |
| Education, Arts & Media | 0 (0.0%) | 30 (100.0%) |
| Legal Services & Support | 0 (0.0%) | 0 (0.0%) |
| Education Instruction & Library | 5 (6.3%) | 74 (93.7%) |
| Arts, Media & Entertainment | 0 (0.0%) | 0 (0.0%) |
| Health Diagnosing & Treating | 82 (47.7%) | 90 (52.3%) |
| Health Technologists | 15 (18.3%) | 67 (81.7%) |
| Total (Category) | 230 (52.0%) | 212 (48.0%) |
| Total (Overall) | 786 (60.6%) | 511 (39.4%) |
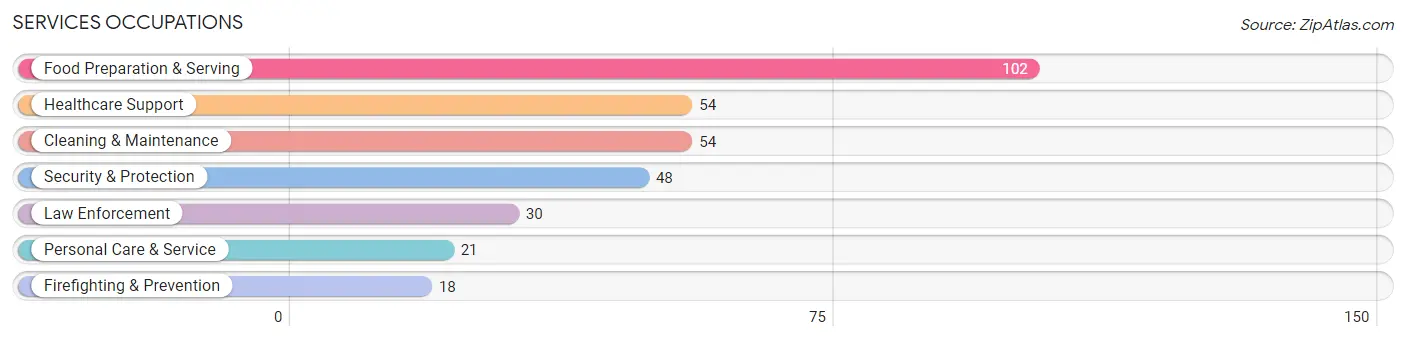
Services Occupations
The most common Services occupations in Winner are Food Preparation & Serving (102 | 7.9%), Healthcare Support (54 | 4.2%), Cleaning & Maintenance (54 | 4.2%), Security & Protection (48 | 3.7%), and Law Enforcement (30 | 2.3%).
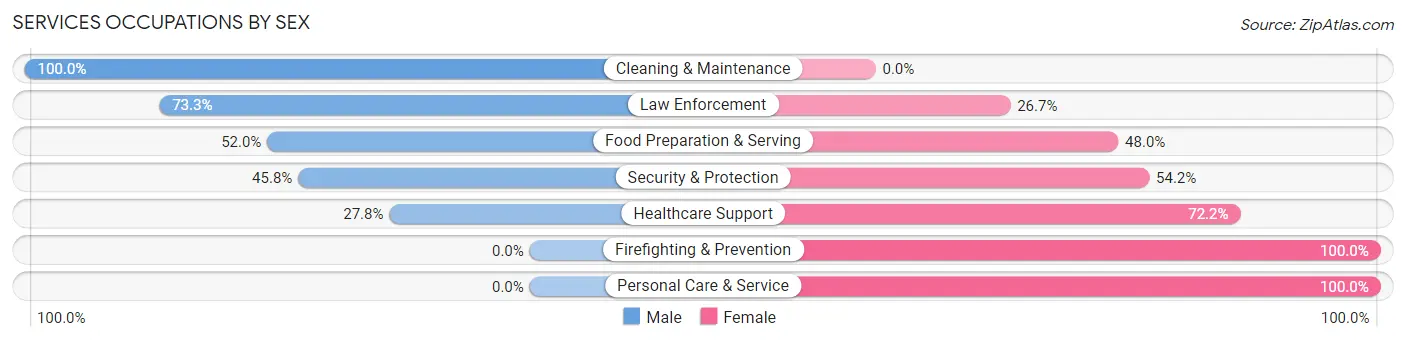
Services Occupations by Sex
Within the Services occupations in Winner, the most male-oriented occupations are Cleaning & Maintenance (100.0%), Law Enforcement (73.3%), and Food Preparation & Serving (52.0%), while the most female-oriented occupations are Firefighting & Prevention (100.0%), Personal Care & Service (100.0%), and Healthcare Support (72.2%).
| Occupation | Male | Female |
| Healthcare Support | 15 (27.8%) | 39 (72.2%) |
| Security & Protection | 22 (45.8%) | 26 (54.2%) |
| Firefighting & Prevention | 0 (0.0%) | 18 (100.0%) |
| Law Enforcement | 22 (73.3%) | 8 (26.7%) |
| Food Preparation & Serving | 53 (52.0%) | 49 (48.0%) |
| Cleaning & Maintenance | 54 (100.0%) | 0 (0.0%) |
| Personal Care & Service | 0 (0.0%) | 21 (100.0%) |
| Total (Category) | 144 (51.6%) | 135 (48.4%) |
| Total (Overall) | 786 (60.6%) | 511 (39.4%) |
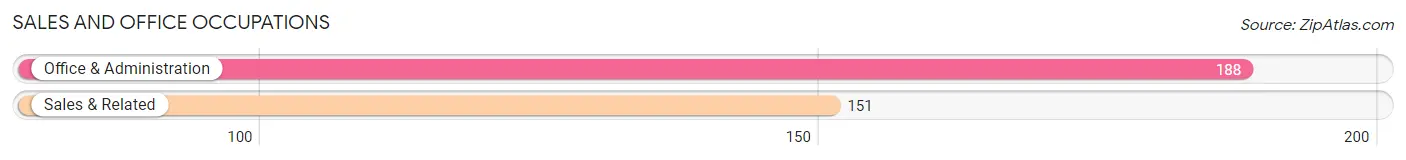
Sales and Office Occupations
The most common Sales and Office occupations in Winner are Office & Administration (188 | 14.5%), and Sales & Related (151 | 11.6%).
Sales and Office Occupations by Sex
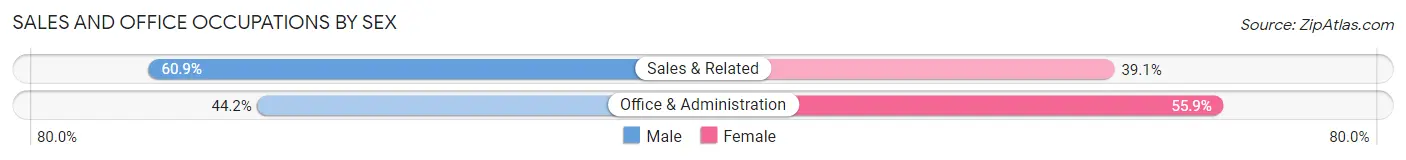
| Occupation | Male | Female |
| Sales & Related | 92 (60.9%) | 59 (39.1%) |
| Office & Administration | 83 (44.2%) | 105 (55.8%) |
| Total (Category) | 175 (51.6%) | 164 (48.4%) |
| Total (Overall) | 786 (60.6%) | 511 (39.4%) |
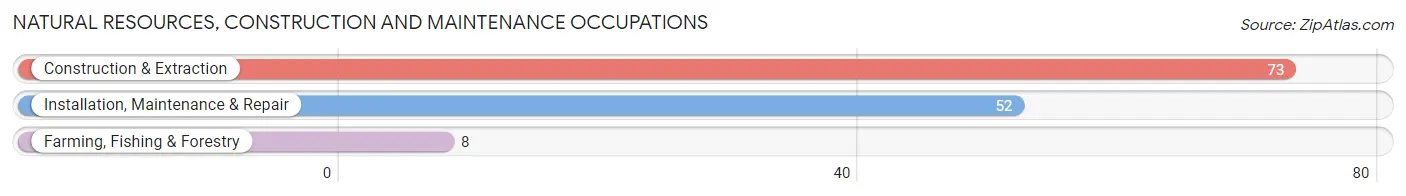
Natural Resources, Construction and Maintenance Occupations
The most common Natural Resources, Construction and Maintenance occupations in Winner are Construction & Extraction (73 | 5.6%), Installation, Maintenance & Repair (52 | 4.0%), and Farming, Fishing & Forestry (8 | 0.6%).
Natural Resources, Construction and Maintenance Occupations by Sex
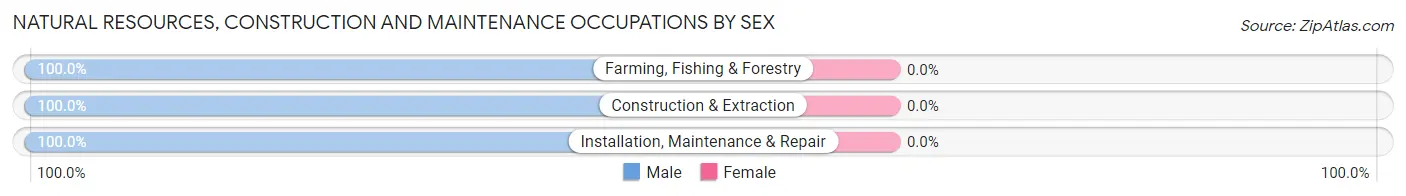
| Occupation | Male | Female |
| Farming, Fishing & Forestry | 8 (100.0%) | 0 (0.0%) |
| Construction & Extraction | 73 (100.0%) | 0 (0.0%) |
| Installation, Maintenance & Repair | 52 (100.0%) | 0 (0.0%) |
| Total (Category) | 133 (100.0%) | 0 (0.0%) |
| Total (Overall) | 786 (60.6%) | 511 (39.4%) |
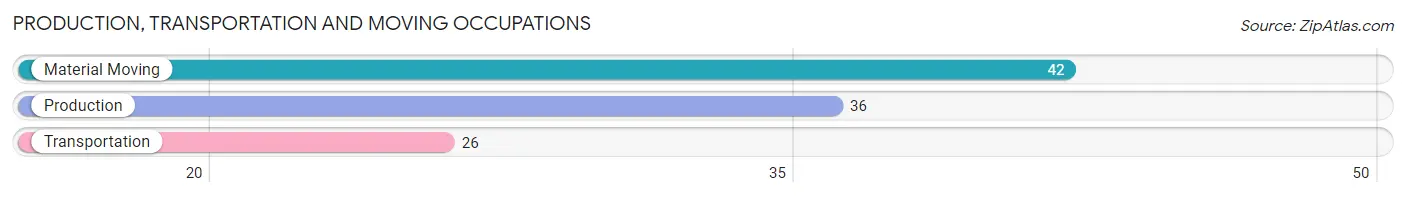
Production, Transportation and Moving Occupations
The most common Production, Transportation and Moving occupations in Winner are Material Moving (42 | 3.2%), Production (36 | 2.8%), and Transportation (26 | 2.0%).
Production, Transportation and Moving Occupations by Sex
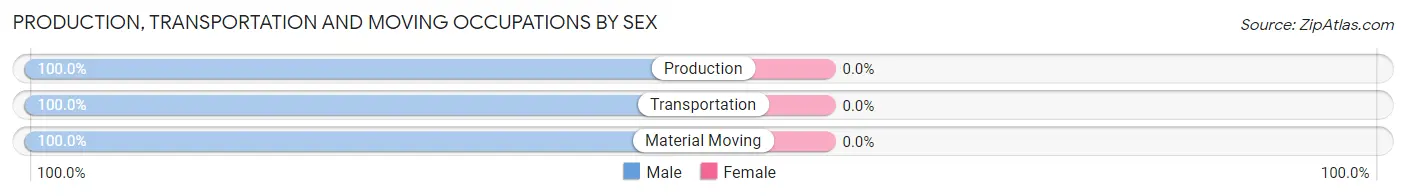
| Occupation | Male | Female |
| Production | 36 (100.0%) | 0 (0.0%) |
| Transportation | 26 (100.0%) | 0 (0.0%) |
| Material Moving | 42 (100.0%) | 0 (0.0%) |
| Total (Category) | 104 (100.0%) | 0 (0.0%) |
| Total (Overall) | 786 (60.6%) | 511 (39.4%) |
Employment Industries by Sex in Winner
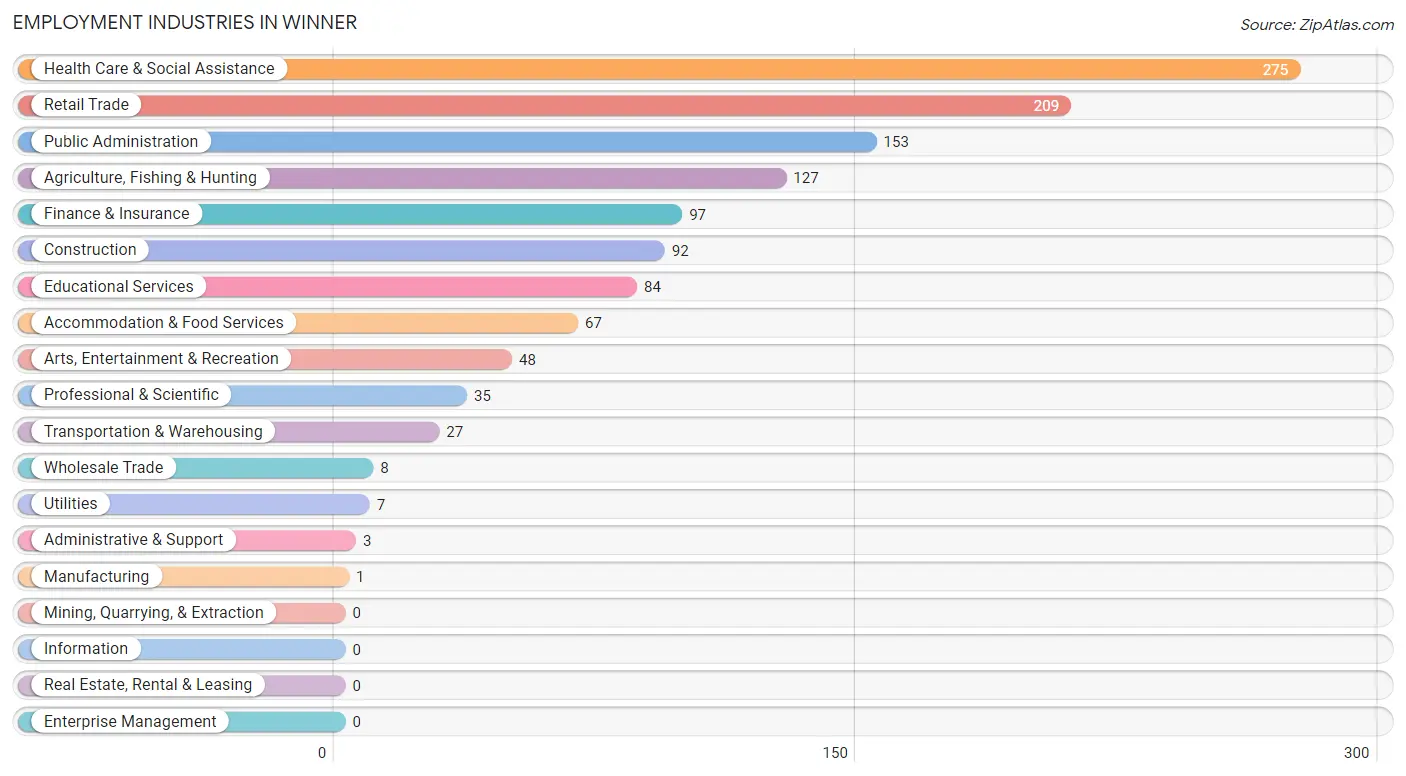
Employment Industries in Winner
The major employment industries in Winner include Health Care & Social Assistance (275 | 21.2%), Retail Trade (209 | 16.1%), Public Administration (153 | 11.8%), Agriculture, Fishing & Hunting (127 | 9.8%), and Finance & Insurance (97 | 7.5%).
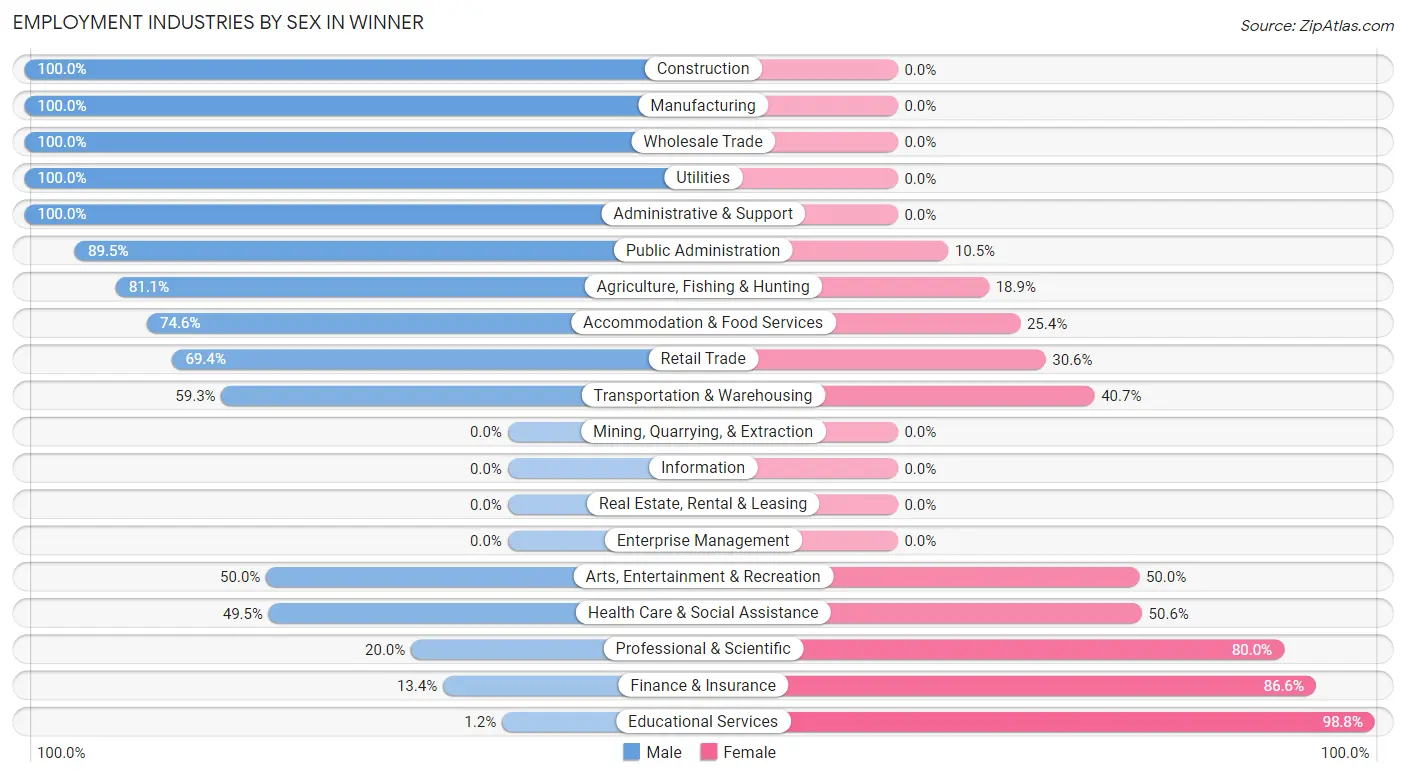
Employment Industries by Sex in Winner
The Winner industries that see more men than women are Construction (100.0%), Manufacturing (100.0%), and Wholesale Trade (100.0%), whereas the industries that tend to have a higher number of women are Educational Services (98.8%), Finance & Insurance (86.6%), and Professional & Scientific (80.0%).
| Industry | Male | Female |
| Agriculture, Fishing & Hunting | 103 (81.1%) | 24 (18.9%) |
| Mining, Quarrying, & Extraction | 0 (0.0%) | 0 (0.0%) |
| Construction | 92 (100.0%) | 0 (0.0%) |
| Manufacturing | 1 (100.0%) | 0 (0.0%) |
| Wholesale Trade | 8 (100.0%) | 0 (0.0%) |
| Retail Trade | 145 (69.4%) | 64 (30.6%) |
| Transportation & Warehousing | 16 (59.3%) | 11 (40.7%) |
| Utilities | 7 (100.0%) | 0 (0.0%) |
| Information | 0 (0.0%) | 0 (0.0%) |
| Finance & Insurance | 13 (13.4%) | 84 (86.6%) |
| Real Estate, Rental & Leasing | 0 (0.0%) | 0 (0.0%) |
| Professional & Scientific | 7 (20.0%) | 28 (80.0%) |
| Enterprise Management | 0 (0.0%) | 0 (0.0%) |
| Administrative & Support | 3 (100.0%) | 0 (0.0%) |
| Educational Services | 1 (1.2%) | 83 (98.8%) |
| Health Care & Social Assistance | 136 (49.4%) | 139 (50.5%) |
| Arts, Entertainment & Recreation | 24 (50.0%) | 24 (50.0%) |
| Accommodation & Food Services | 50 (74.6%) | 17 (25.4%) |
| Public Administration | 137 (89.5%) | 16 (10.5%) |
| Total | 786 (60.6%) | 511 (39.4%) |
Education in Winner
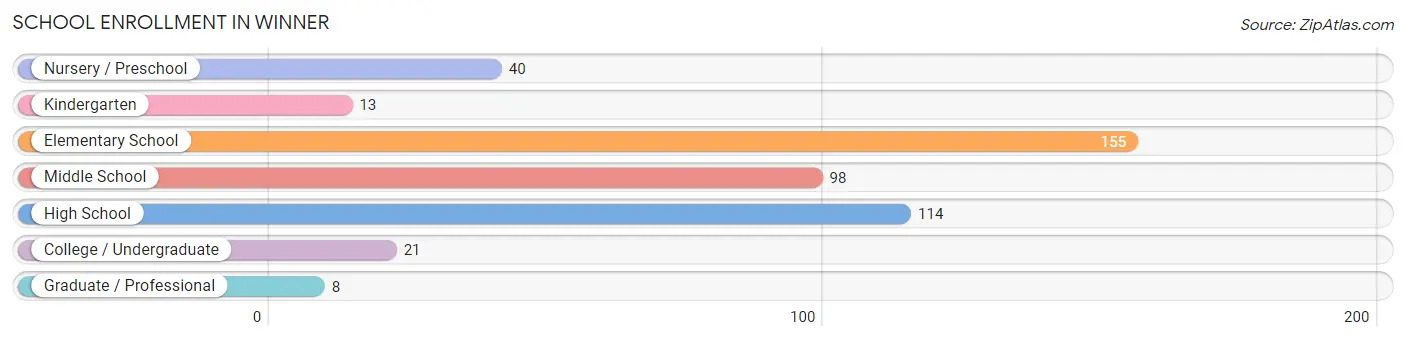
School Enrollment in Winner
The most common levels of schooling among the 449 students in Winner are elementary school (155 | 34.5%), high school (114 | 25.4%), and middle school (98 | 21.8%).
| School Level | # Students | % Students |
| Nursery / Preschool | 40 | 8.9% |
| Kindergarten | 13 | 2.9% |
| Elementary School | 155 | 34.5% |
| Middle School | 98 | 21.8% |
| High School | 114 | 25.4% |
| College / Undergraduate | 21 | 4.7% |
| Graduate / Professional | 8 | 1.8% |
| Total | 449 | 100.0% |
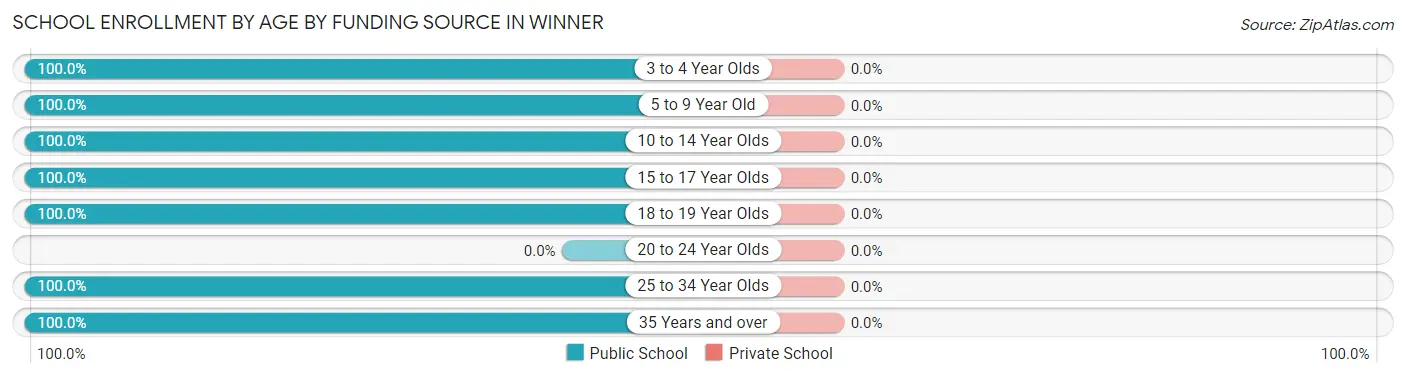
School Enrollment by Age by Funding Source in Winner
| Age Bracket | Public School | Private School |
| 3 to 4 Year Olds | 24 (100.0%) | 0 (0.0%) |
| 5 to 9 Year Old | 179 (100.0%) | 0 (0.0%) |
| 10 to 14 Year Olds | 120 (100.0%) | 0 (0.0%) |
| 15 to 17 Year Olds | 78 (100.0%) | 0 (0.0%) |
| 18 to 19 Year Olds | 19 (100.0%) | 0 (0.0%) |
| 20 to 24 Year Olds | 0 (0.0%) | 0 (0.0%) |
| 25 to 34 Year Olds | 21 (100.0%) | 0 (0.0%) |
| 35 Years and over | 8 (100.0%) | 0 (0.0%) |
| Total | 449 (100.0%) | 0 (0.0%) |
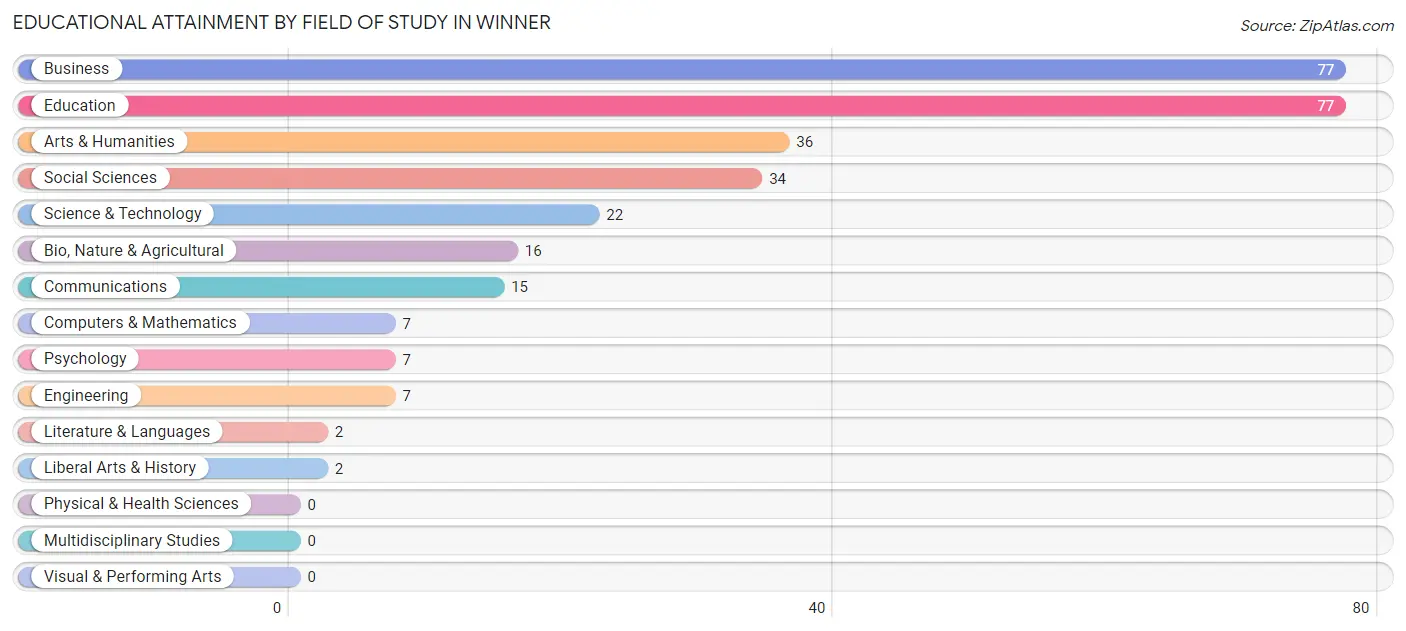
Educational Attainment by Field of Study in Winner
Business (77 | 25.5%), education (77 | 25.5%), arts & humanities (36 | 11.9%), social sciences (34 | 11.3%), and science & technology (22 | 7.3%) are the most common fields of study among 302 individuals in Winner who have obtained a bachelor's degree or higher.
| Field of Study | # Graduates | % Graduates |
| Computers & Mathematics | 7 | 2.3% |
| Bio, Nature & Agricultural | 16 | 5.3% |
| Physical & Health Sciences | 0 | 0.0% |
| Psychology | 7 | 2.3% |
| Social Sciences | 34 | 11.3% |
| Engineering | 7 | 2.3% |
| Multidisciplinary Studies | 0 | 0.0% |
| Science & Technology | 22 | 7.3% |
| Business | 77 | 25.5% |
| Education | 77 | 25.5% |
| Literature & Languages | 2 | 0.7% |
| Liberal Arts & History | 2 | 0.7% |
| Visual & Performing Arts | 0 | 0.0% |
| Communications | 15 | 5.0% |
| Arts & Humanities | 36 | 11.9% |
| Total | 302 | 100.0% |
Transportation & Commute in Winner
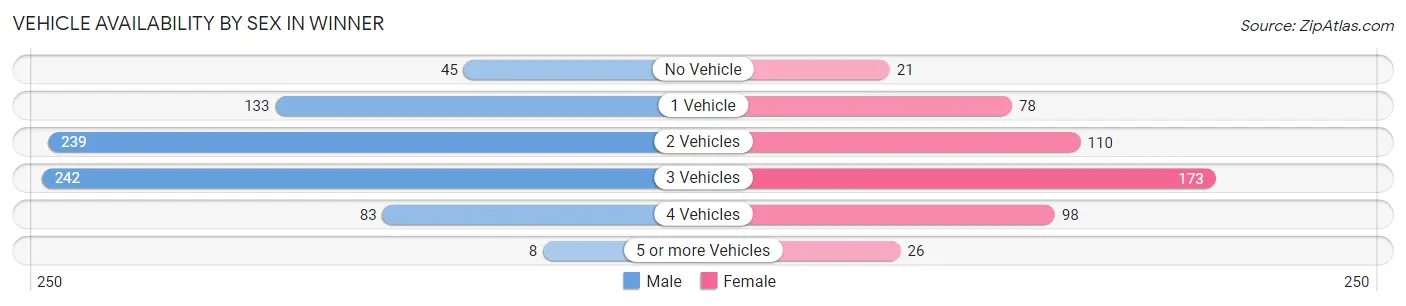
Vehicle Availability by Sex in Winner
The most prevalent vehicle ownership categories in Winner are males with 3 vehicles (242, accounting for 32.3%) and females with 3 vehicles (173, making up 47.8%).
| Vehicles Available | Male | Female |
| No Vehicle | 45 (6.0%) | 21 (4.2%) |
| 1 Vehicle | 133 (17.7%) | 78 (15.4%) |
| 2 Vehicles | 239 (31.9%) | 110 (21.7%) |
| 3 Vehicles | 242 (32.3%) | 173 (34.2%) |
| 4 Vehicles | 83 (11.1%) | 98 (19.4%) |
| 5 or more Vehicles | 8 (1.1%) | 26 (5.1%) |
| Total | 750 (100.0%) | 506 (100.0%) |
Commute Time in Winner
The most frequently occuring commute durations in Winner are 5 to 9 minutes (563 commuters, 45.6%), less than 5 minutes (310 commuters, 25.1%), and 10 to 14 minutes (152 commuters, 12.3%).
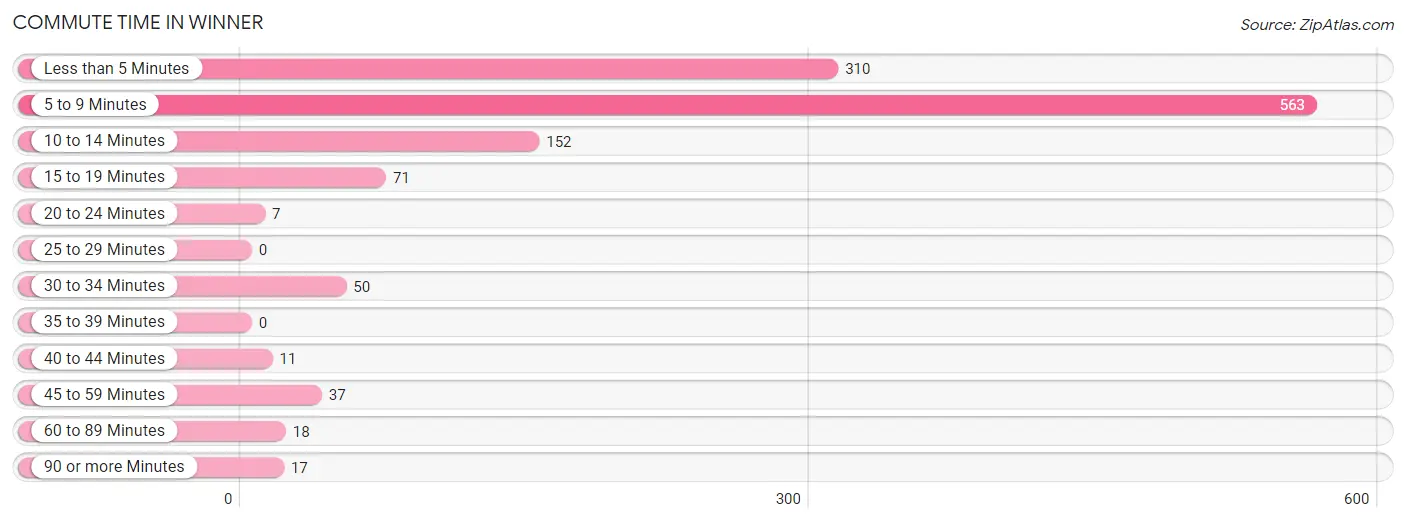
| Commute Time | # Commuters | % Commuters |
| Less than 5 Minutes | 310 | 25.1% |
| 5 to 9 Minutes | 563 | 45.6% |
| 10 to 14 Minutes | 152 | 12.3% |
| 15 to 19 Minutes | 71 | 5.7% |
| 20 to 24 Minutes | 7 | 0.6% |
| 25 to 29 Minutes | 0 | 0.0% |
| 30 to 34 Minutes | 50 | 4.1% |
| 35 to 39 Minutes | 0 | 0.0% |
| 40 to 44 Minutes | 11 | 0.9% |
| 45 to 59 Minutes | 37 | 3.0% |
| 60 to 89 Minutes | 18 | 1.5% |
| 90 or more Minutes | 17 | 1.4% |
Commute Time by Sex in Winner
The most common commute times in Winner are less than 5 minutes (256 commuters, 33.8%) for males and 5 to 9 minutes (317 commuters, 66.3%) for females.
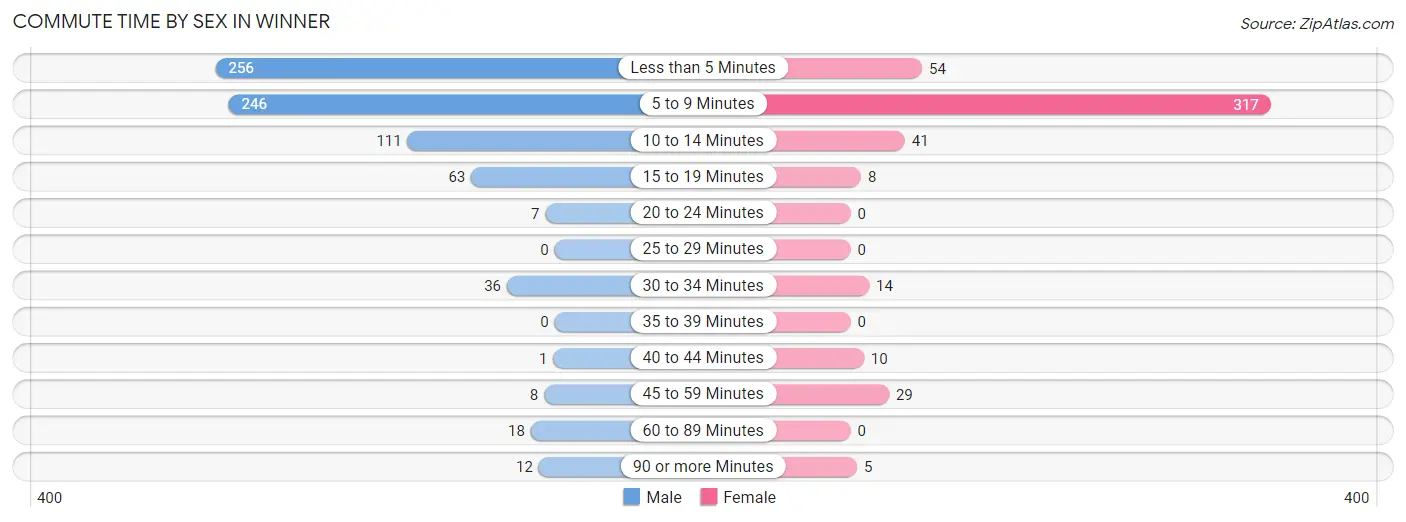
| Commute Time | Male | Female |
| Less than 5 Minutes | 256 (33.8%) | 54 (11.3%) |
| 5 to 9 Minutes | 246 (32.5%) | 317 (66.3%) |
| 10 to 14 Minutes | 111 (14.6%) | 41 (8.6%) |
| 15 to 19 Minutes | 63 (8.3%) | 8 (1.7%) |
| 20 to 24 Minutes | 7 (0.9%) | 0 (0.0%) |
| 25 to 29 Minutes | 0 (0.0%) | 0 (0.0%) |
| 30 to 34 Minutes | 36 (4.8%) | 14 (2.9%) |
| 35 to 39 Minutes | 0 (0.0%) | 0 (0.0%) |
| 40 to 44 Minutes | 1 (0.1%) | 10 (2.1%) |
| 45 to 59 Minutes | 8 (1.1%) | 29 (6.1%) |
| 60 to 89 Minutes | 18 (2.4%) | 0 (0.0%) |
| 90 or more Minutes | 12 (1.6%) | 5 (1.1%) |
Time of Departure to Work by Sex in Winner
The most frequent times of departure to work in Winner are 7:30 AM to 7:59 AM (207, 27.3%) for males and 7:30 AM to 7:59 AM (187, 39.1%) for females.
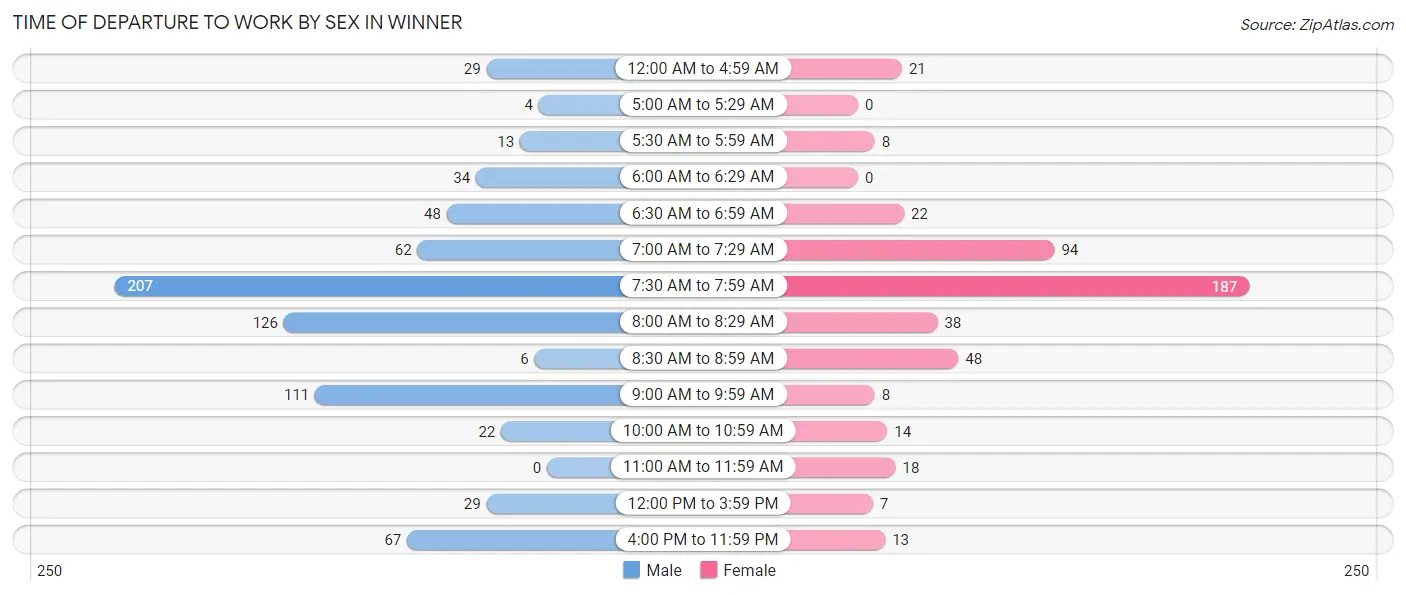
| Time of Departure | Male | Female |
| 12:00 AM to 4:59 AM | 29 (3.8%) | 21 (4.4%) |
| 5:00 AM to 5:29 AM | 4 (0.5%) | 0 (0.0%) |
| 5:30 AM to 5:59 AM | 13 (1.7%) | 8 (1.7%) |
| 6:00 AM to 6:29 AM | 34 (4.5%) | 0 (0.0%) |
| 6:30 AM to 6:59 AM | 48 (6.3%) | 22 (4.6%) |
| 7:00 AM to 7:29 AM | 62 (8.2%) | 94 (19.7%) |
| 7:30 AM to 7:59 AM | 207 (27.3%) | 187 (39.1%) |
| 8:00 AM to 8:29 AM | 126 (16.6%) | 38 (8.0%) |
| 8:30 AM to 8:59 AM | 6 (0.8%) | 48 (10.0%) |
| 9:00 AM to 9:59 AM | 111 (14.6%) | 8 (1.7%) |
| 10:00 AM to 10:59 AM | 22 (2.9%) | 14 (2.9%) |
| 11:00 AM to 11:59 AM | 0 (0.0%) | 18 (3.8%) |
| 12:00 PM to 3:59 PM | 29 (3.8%) | 7 (1.5%) |
| 4:00 PM to 11:59 PM | 67 (8.8%) | 13 (2.7%) |
| Total | 758 (100.0%) | 478 (100.0%) |
Housing Occupancy in Winner
Occupancy by Ownership in Winner
Of the total 1,078 dwellings in Winner, owner-occupied units account for 713 (66.1%), while renter-occupied units make up 365 (33.9%).
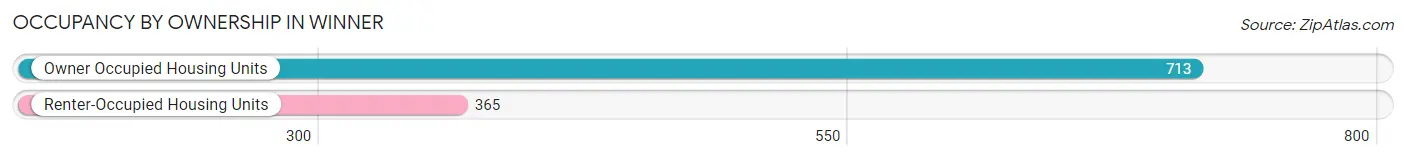
| Occupancy | # Housing Units | % Housing Units |
| Owner Occupied Housing Units | 713 | 66.1% |
| Renter-Occupied Housing Units | 365 | 33.9% |
| Total Occupied Housing Units | 1,078 | 100.0% |
Occupancy by Household Size in Winner
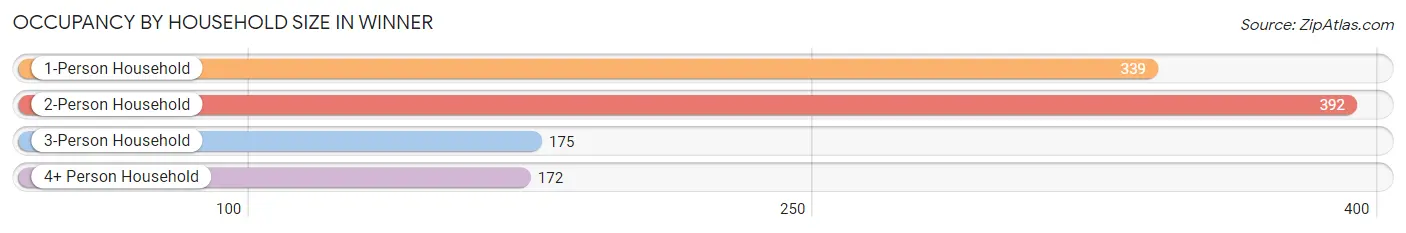
| Household Size | # Housing Units | % Housing Units |
| 1-Person Household | 339 | 31.5% |
| 2-Person Household | 392 | 36.4% |
| 3-Person Household | 175 | 16.2% |
| 4+ Person Household | 172 | 16.0% |
| Total Housing Units | 1,078 | 100.0% |
Occupancy by Ownership by Household Size in Winner
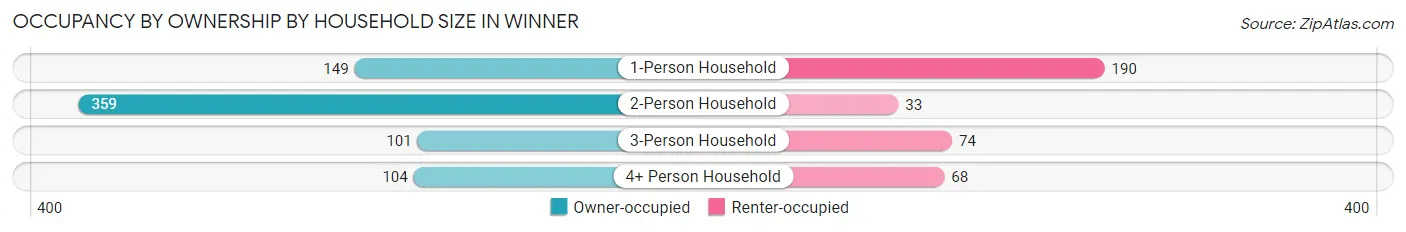
| Household Size | Owner-occupied | Renter-occupied |
| 1-Person Household | 149 (44.0%) | 190 (56.0%) |
| 2-Person Household | 359 (91.6%) | 33 (8.4%) |
| 3-Person Household | 101 (57.7%) | 74 (42.3%) |
| 4+ Person Household | 104 (60.5%) | 68 (39.5%) |
| Total Housing Units | 713 (66.1%) | 365 (33.9%) |
Occupancy by Educational Attainment in Winner
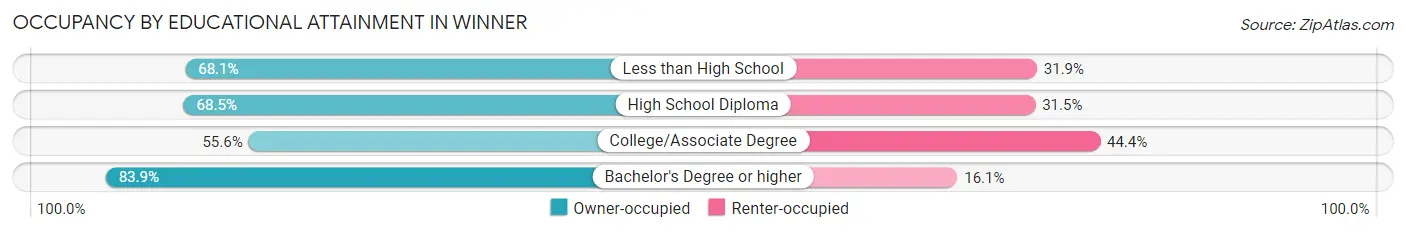
| Household Size | Owner-occupied | Renter-occupied |
| Less than High School | 77 (68.1%) | 36 (31.9%) |
| High School Diploma | 267 (68.5%) | 123 (31.5%) |
| College/Associate Degree | 223 (55.6%) | 178 (44.4%) |
| Bachelor's Degree or higher | 146 (83.9%) | 28 (16.1%) |
Occupancy by Age of Householder in Winner
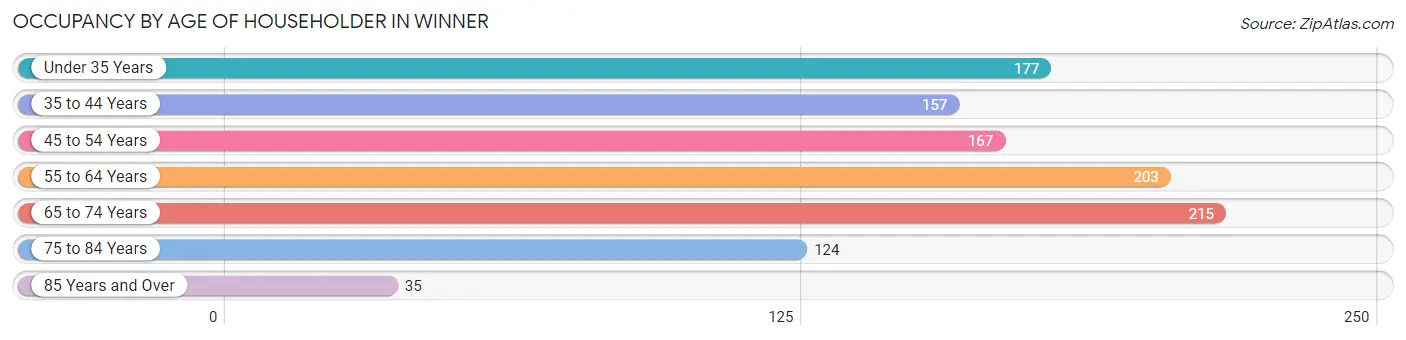
| Age Bracket | # Households | % Households |
| Under 35 Years | 177 | 16.4% |
| 35 to 44 Years | 157 | 14.6% |
| 45 to 54 Years | 167 | 15.5% |
| 55 to 64 Years | 203 | 18.8% |
| 65 to 74 Years | 215 | 19.9% |
| 75 to 84 Years | 124 | 11.5% |
| 85 Years and Over | 35 | 3.3% |
| Total | 1,078 | 100.0% |
Housing Finances in Winner
Median Income by Occupancy in Winner
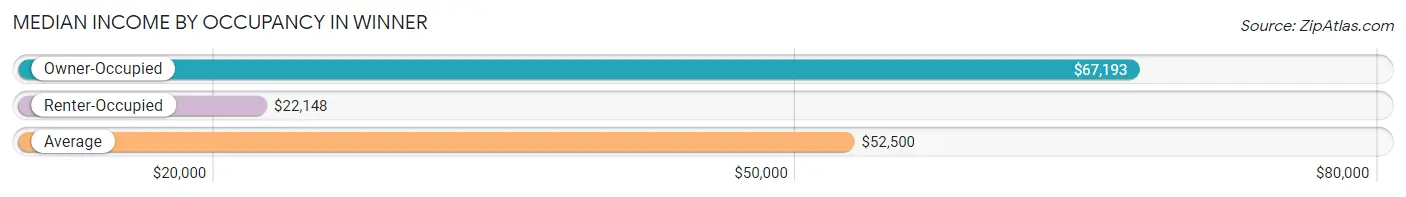
| Occupancy Type | # Households | Median Income |
| Owner-Occupied | 713 (66.1%) | $67,193 |
| Renter-Occupied | 365 (33.9%) | $22,148 |
| Average | 1,078 (100.0%) | $52,500 |
Occupancy by Householder Income Bracket in Winner
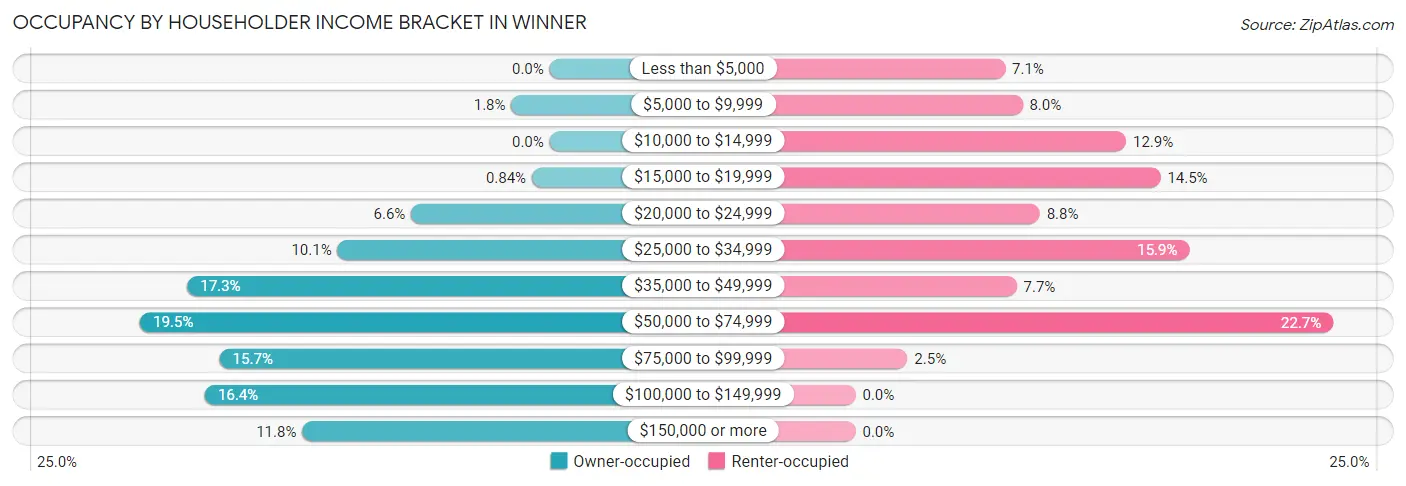
| Income Bracket | Owner-occupied | Renter-occupied |
| Less than $5,000 | 0 (0.0%) | 26 (7.1%) |
| $5,000 to $9,999 | 13 (1.8%) | 29 (8.0%) |
| $10,000 to $14,999 | 0 (0.0%) | 47 (12.9%) |
| $15,000 to $19,999 | 6 (0.8%) | 53 (14.5%) |
| $20,000 to $24,999 | 47 (6.6%) | 32 (8.8%) |
| $25,000 to $34,999 | 72 (10.1%) | 58 (15.9%) |
| $35,000 to $49,999 | 123 (17.2%) | 28 (7.7%) |
| $50,000 to $74,999 | 139 (19.5%) | 83 (22.7%) |
| $75,000 to $99,999 | 112 (15.7%) | 9 (2.5%) |
| $100,000 to $149,999 | 117 (16.4%) | 0 (0.0%) |
| $150,000 or more | 84 (11.8%) | 0 (0.0%) |
| Total | 713 (100.0%) | 365 (100.0%) |
Monthly Housing Cost Tiers in Winner
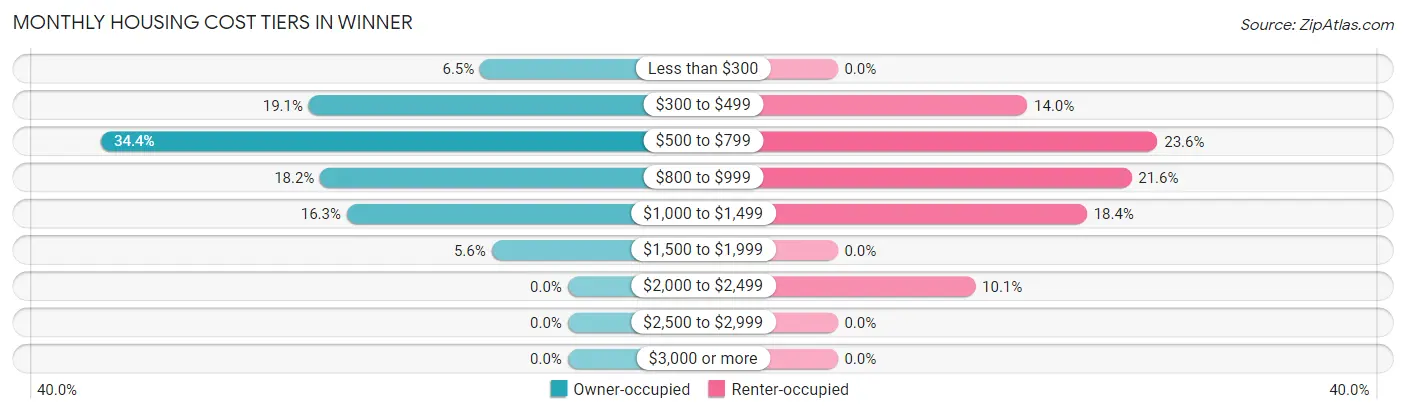
| Monthly Cost | Owner-occupied | Renter-occupied |
| Less than $300 | 46 (6.5%) | 0 (0.0%) |
| $300 to $499 | 136 (19.1%) | 51 (14.0%) |
| $500 to $799 | 245 (34.4%) | 86 (23.6%) |
| $800 to $999 | 130 (18.2%) | 79 (21.6%) |
| $1,000 to $1,499 | 116 (16.3%) | 67 (18.4%) |
| $1,500 to $1,999 | 40 (5.6%) | 0 (0.0%) |
| $2,000 to $2,499 | 0 (0.0%) | 37 (10.1%) |
| $2,500 to $2,999 | 0 (0.0%) | 0 (0.0%) |
| $3,000 or more | 0 (0.0%) | 0 (0.0%) |
| Total | 713 (100.0%) | 365 (100.0%) |
Physical Housing Characteristics in Winner
Housing Structures in Winner
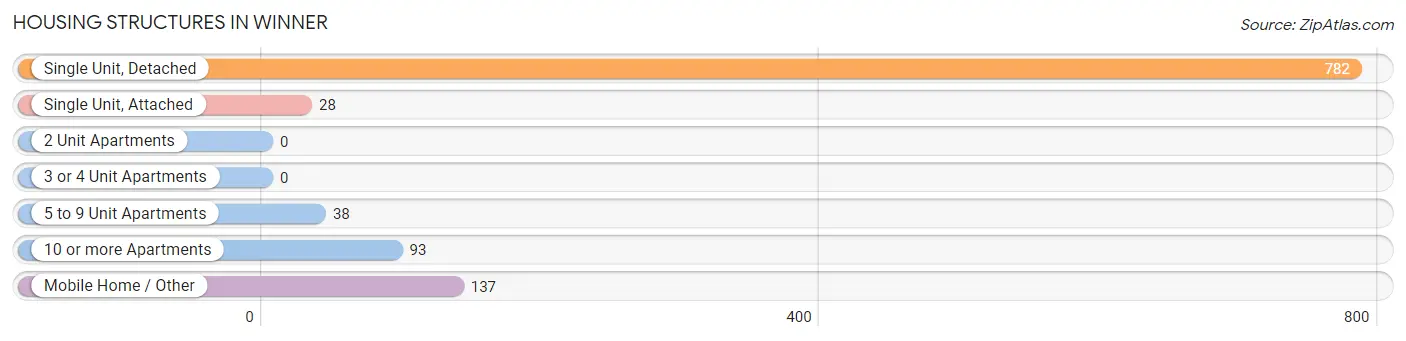
| Structure Type | # Housing Units | % Housing Units |
| Single Unit, Detached | 782 | 72.5% |
| Single Unit, Attached | 28 | 2.6% |
| 2 Unit Apartments | 0 | 0.0% |
| 3 or 4 Unit Apartments | 0 | 0.0% |
| 5 to 9 Unit Apartments | 38 | 3.5% |
| 10 or more Apartments | 93 | 8.6% |
| Mobile Home / Other | 137 | 12.7% |
| Total | 1,078 | 100.0% |
Housing Structures by Occupancy in Winner
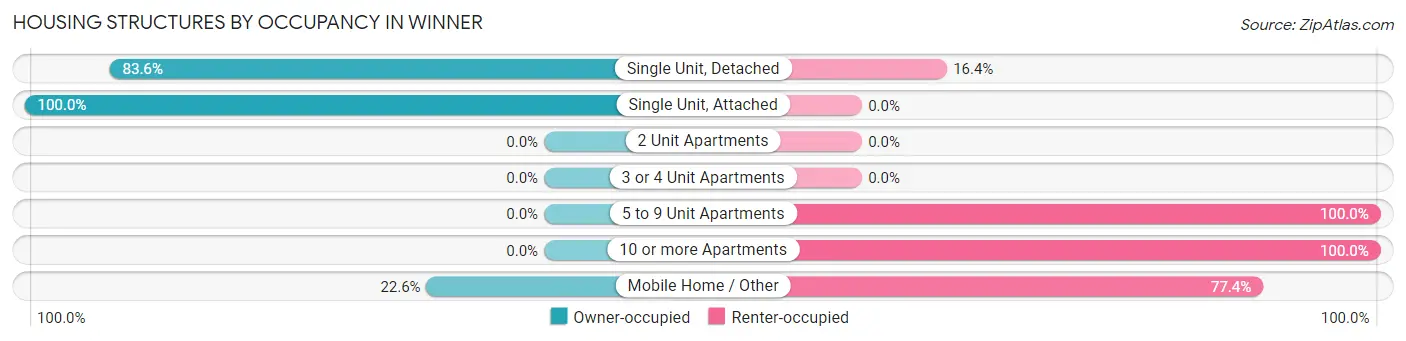
| Structure Type | Owner-occupied | Renter-occupied |
| Single Unit, Detached | 654 (83.6%) | 128 (16.4%) |
| Single Unit, Attached | 28 (100.0%) | 0 (0.0%) |
| 2 Unit Apartments | 0 (0.0%) | 0 (0.0%) |
| 3 or 4 Unit Apartments | 0 (0.0%) | 0 (0.0%) |
| 5 to 9 Unit Apartments | 0 (0.0%) | 38 (100.0%) |
| 10 or more Apartments | 0 (0.0%) | 93 (100.0%) |
| Mobile Home / Other | 31 (22.6%) | 106 (77.4%) |
| Total | 713 (66.1%) | 365 (33.9%) |
Housing Structures by Number of Rooms in Winner
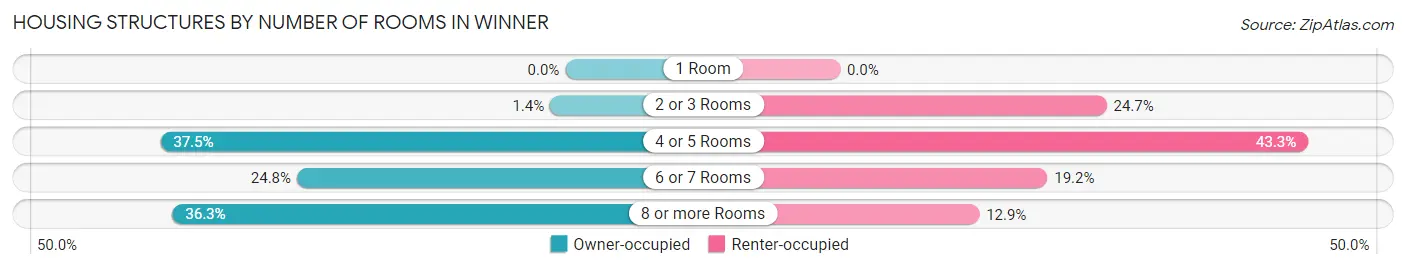
| Number of Rooms | Owner-occupied | Renter-occupied |
| 1 Room | 0 (0.0%) | 0 (0.0%) |
| 2 or 3 Rooms | 10 (1.4%) | 90 (24.7%) |
| 4 or 5 Rooms | 267 (37.4%) | 158 (43.3%) |
| 6 or 7 Rooms | 177 (24.8%) | 70 (19.2%) |
| 8 or more Rooms | 259 (36.3%) | 47 (12.9%) |
| Total | 713 (100.0%) | 365 (100.0%) |
Housing Structure by Heating Type in Winner
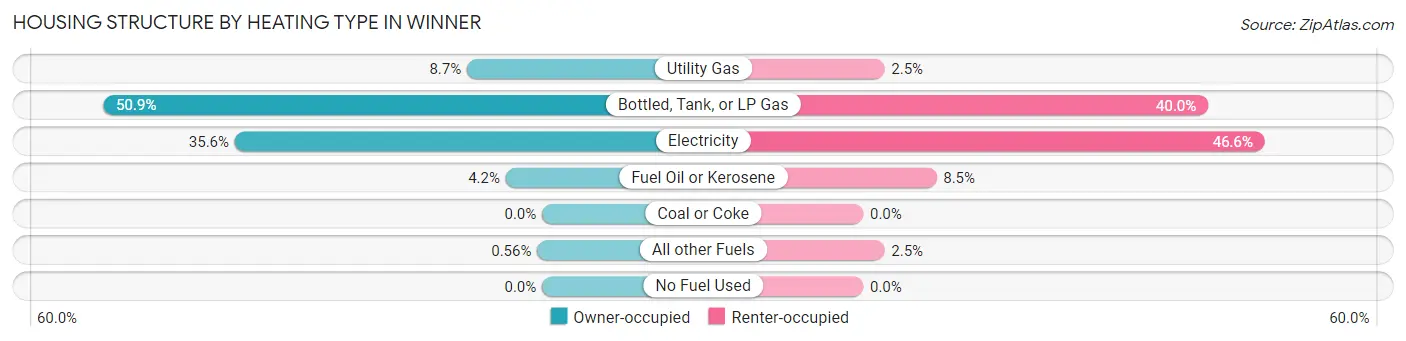
| Heating Type | Owner-occupied | Renter-occupied |
| Utility Gas | 62 (8.7%) | 9 (2.5%) |
| Bottled, Tank, or LP Gas | 363 (50.9%) | 146 (40.0%) |
| Electricity | 254 (35.6%) | 170 (46.6%) |
| Fuel Oil or Kerosene | 30 (4.2%) | 31 (8.5%) |
| Coal or Coke | 0 (0.0%) | 0 (0.0%) |
| All other Fuels | 4 (0.6%) | 9 (2.5%) |
| No Fuel Used | 0 (0.0%) | 0 (0.0%) |
| Total | 713 (100.0%) | 365 (100.0%) |
Household Vehicle Usage in Winner
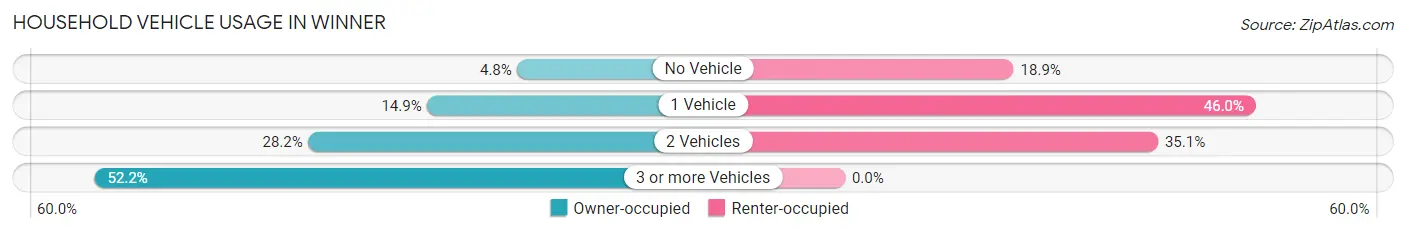
| Vehicles per Household | Owner-occupied | Renter-occupied |
| No Vehicle | 34 (4.8%) | 69 (18.9%) |
| 1 Vehicle | 106 (14.9%) | 168 (46.0%) |
| 2 Vehicles | 201 (28.2%) | 128 (35.1%) |
| 3 or more Vehicles | 372 (52.2%) | 0 (0.0%) |
| Total | 713 (100.0%) | 365 (100.0%) |
Real Estate & Mortgages in Winner
Real Estate and Mortgage Overview in Winner
| Characteristic | Without Mortgage | With Mortgage |
| Housing Units | 448 | 265 |
| Median Property Value | $134,400 | $128,000 |
| Median Household Income | $65,246 | $41 |
| Monthly Housing Costs | $544 | $0 |
| Real Estate Taxes | $1,252 | $29 |
Property Value by Mortgage Status in Winner
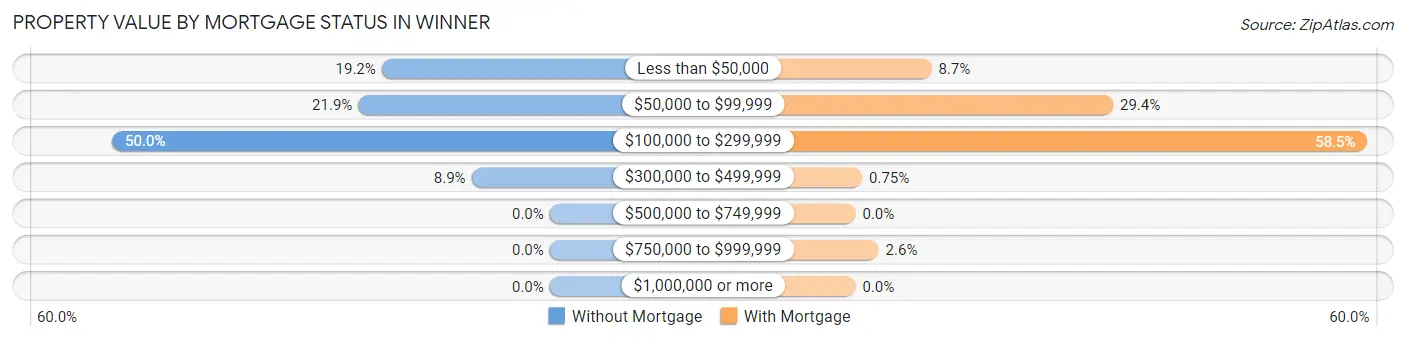
| Property Value | Without Mortgage | With Mortgage |
| Less than $50,000 | 86 (19.2%) | 23 (8.7%) |
| $50,000 to $99,999 | 98 (21.9%) | 78 (29.4%) |
| $100,000 to $299,999 | 224 (50.0%) | 155 (58.5%) |
| $300,000 to $499,999 | 40 (8.9%) | 2 (0.7%) |
| $500,000 to $749,999 | 0 (0.0%) | 0 (0.0%) |
| $750,000 to $999,999 | 0 (0.0%) | 7 (2.6%) |
| $1,000,000 or more | 0 (0.0%) | 0 (0.0%) |
| Total | 448 (100.0%) | 265 (100.0%) |
Household Income by Mortgage Status in Winner
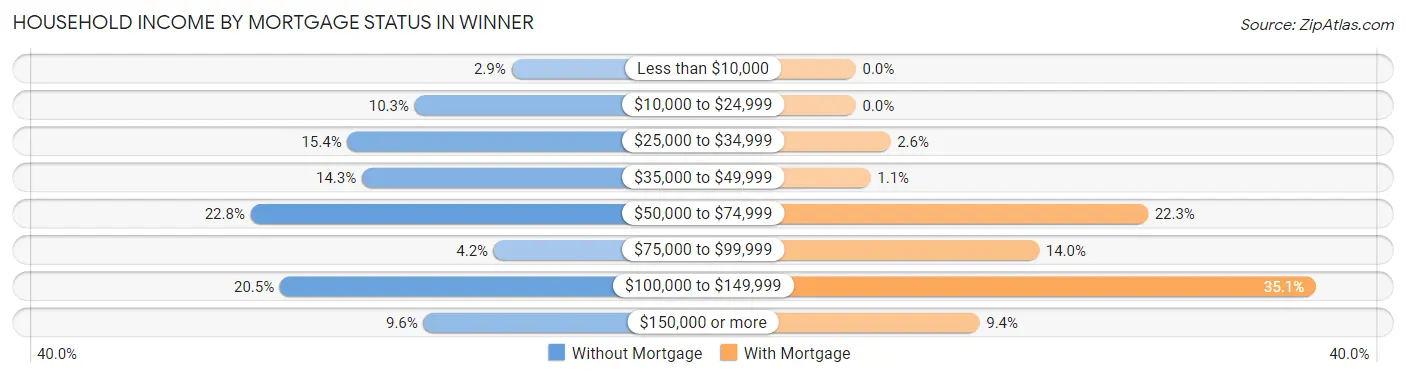
| Household Income | Without Mortgage | With Mortgage |
| Less than $10,000 | 13 (2.9%) | 0 (0.0%) |
| $10,000 to $24,999 | 46 (10.3%) | 0 (0.0%) |
| $25,000 to $34,999 | 69 (15.4%) | 7 (2.6%) |
| $35,000 to $49,999 | 64 (14.3%) | 3 (1.1%) |
| $50,000 to $74,999 | 102 (22.8%) | 59 (22.3%) |
| $75,000 to $99,999 | 19 (4.2%) | 37 (14.0%) |
| $100,000 to $149,999 | 92 (20.5%) | 93 (35.1%) |
| $150,000 or more | 43 (9.6%) | 25 (9.4%) |
| Total | 448 (100.0%) | 265 (100.0%) |
Property Value to Household Income Ratio in Winner
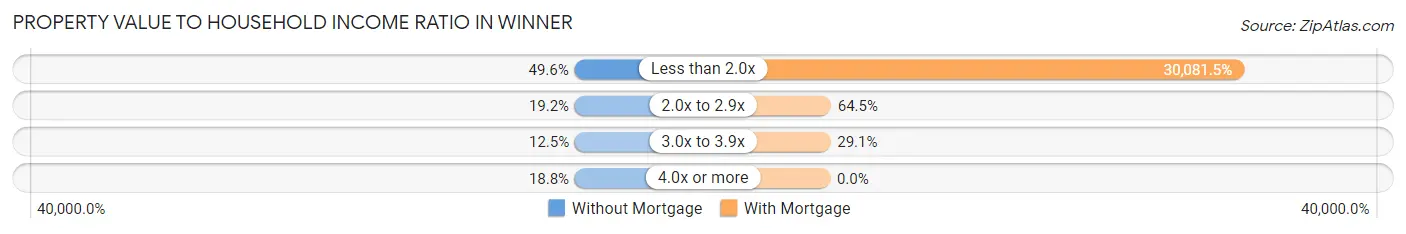
| Value-to-Income Ratio | Without Mortgage | With Mortgage |
| Less than 2.0x | 222 (49.5%) | 79,716 (30,081.5%) |
| 2.0x to 2.9x | 86 (19.2%) | 171 (64.5%) |
| 3.0x to 3.9x | 56 (12.5%) | 77 (29.1%) |
| 4.0x or more | 84 (18.8%) | 0 (0.0%) |
| Total | 448 (100.0%) | 265 (100.0%) |
Real Estate Taxes by Mortgage Status in Winner
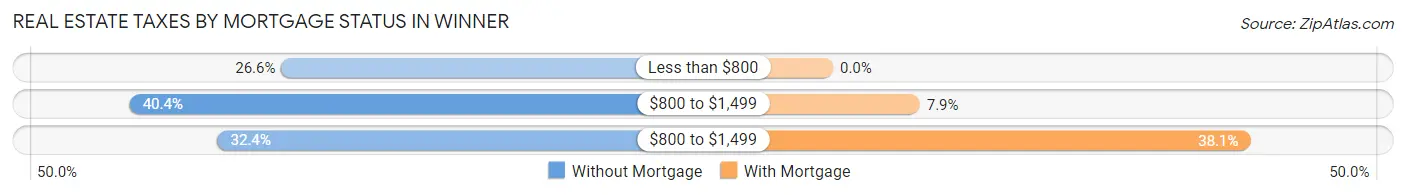
| Property Taxes | Without Mortgage | With Mortgage |
| Less than $800 | 119 (26.6%) | 0 (0.0%) |
| $800 to $1,499 | 181 (40.4%) | 21 (7.9%) |
| $800 to $1,499 | 145 (32.4%) | 101 (38.1%) |
| Total | 448 (100.0%) | 265 (100.0%) |
Health & Disability in Winner
Health Insurance Coverage by Age in Winner
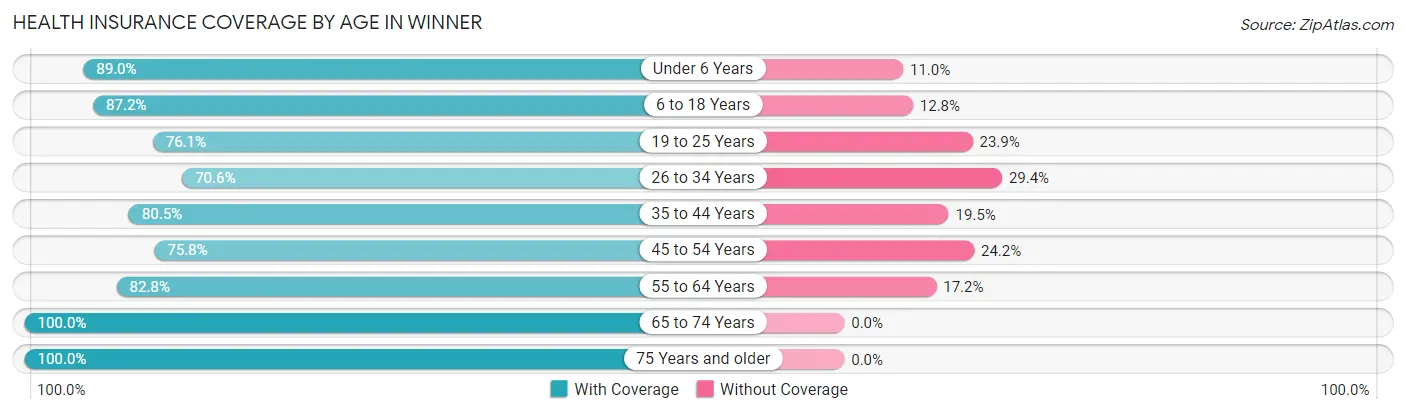
| Age Bracket | With Coverage | Without Coverage |
| Under 6 Years | 203 (89.0%) | 25 (11.0%) |
| 6 to 18 Years | 341 (87.2%) | 50 (12.8%) |
| 19 to 25 Years | 140 (76.1%) | 44 (23.9%) |
| 26 to 34 Years | 269 (70.6%) | 112 (29.4%) |
| 35 to 44 Years | 240 (80.5%) | 58 (19.5%) |
| 45 to 54 Years | 260 (75.8%) | 83 (24.2%) |
| 55 to 64 Years | 333 (82.8%) | 69 (17.2%) |
| 65 to 74 Years | 283 (100.0%) | 0 (0.0%) |
| 75 Years and older | 265 (100.0%) | 0 (0.0%) |
| Total | 2,334 (84.1%) | 441 (15.9%) |
Health Insurance Coverage by Citizenship Status in Winner
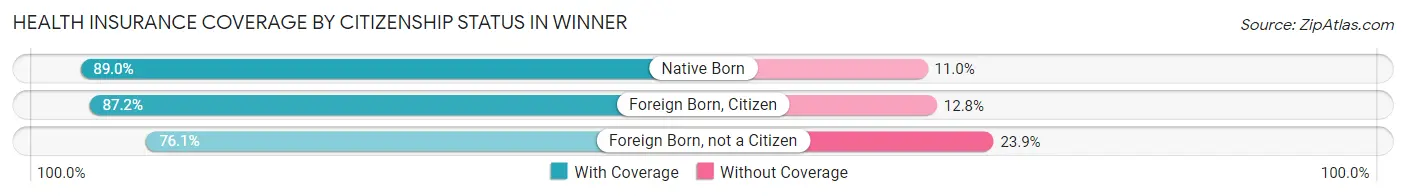
| Citizenship Status | With Coverage | Without Coverage |
| Native Born | 203 (89.0%) | 25 (11.0%) |
| Foreign Born, Citizen | 341 (87.2%) | 50 (12.8%) |
| Foreign Born, not a Citizen | 140 (76.1%) | 44 (23.9%) |
Health Insurance Coverage by Household Income in Winner
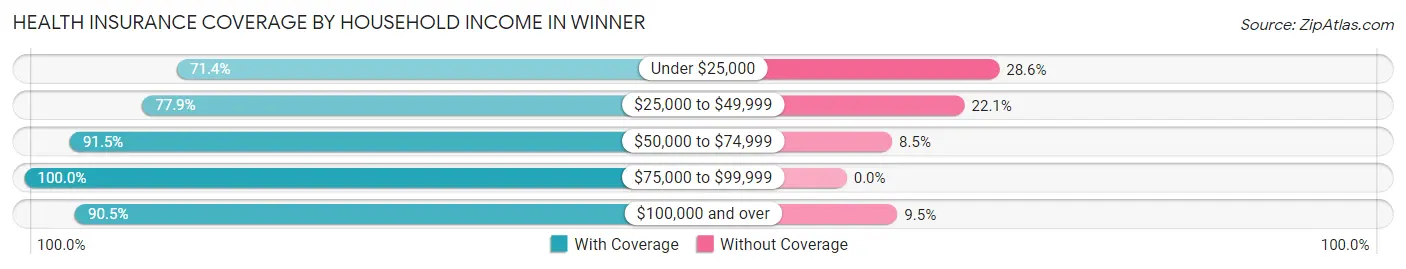
| Household Income | With Coverage | Without Coverage |
| Under $25,000 | 510 (71.4%) | 204 (28.6%) |
| $25,000 to $49,999 | 498 (77.9%) | 141 (22.1%) |
| $50,000 to $74,999 | 463 (91.5%) | 43 (8.5%) |
| $75,000 to $99,999 | 329 (100.0%) | 0 (0.0%) |
| $100,000 and over | 506 (90.5%) | 53 (9.5%) |
Public vs Private Health Insurance Coverage by Age in Winner
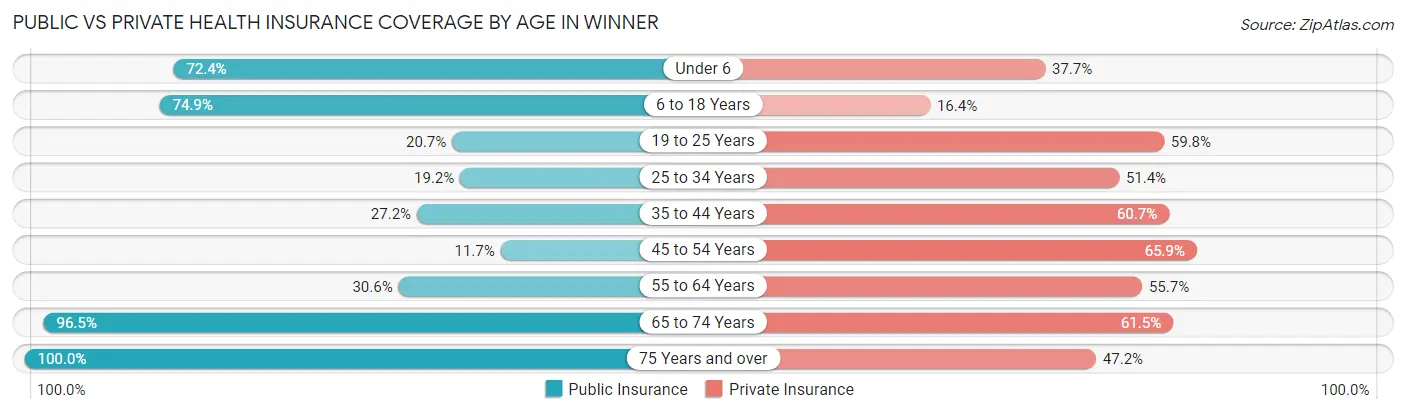
| Age Bracket | Public Insurance | Private Insurance |
| Under 6 | 165 (72.4%) | 86 (37.7%) |
| 6 to 18 Years | 293 (74.9%) | 64 (16.4%) |
| 19 to 25 Years | 38 (20.6%) | 110 (59.8%) |
| 25 to 34 Years | 73 (19.2%) | 196 (51.4%) |
| 35 to 44 Years | 81 (27.2%) | 181 (60.7%) |
| 45 to 54 Years | 40 (11.7%) | 226 (65.9%) |
| 55 to 64 Years | 123 (30.6%) | 224 (55.7%) |
| 65 to 74 Years | 273 (96.5%) | 174 (61.5%) |
| 75 Years and over | 265 (100.0%) | 125 (47.2%) |
| Total | 1,351 (48.7%) | 1,386 (49.9%) |
Disability Status by Sex by Age in Winner
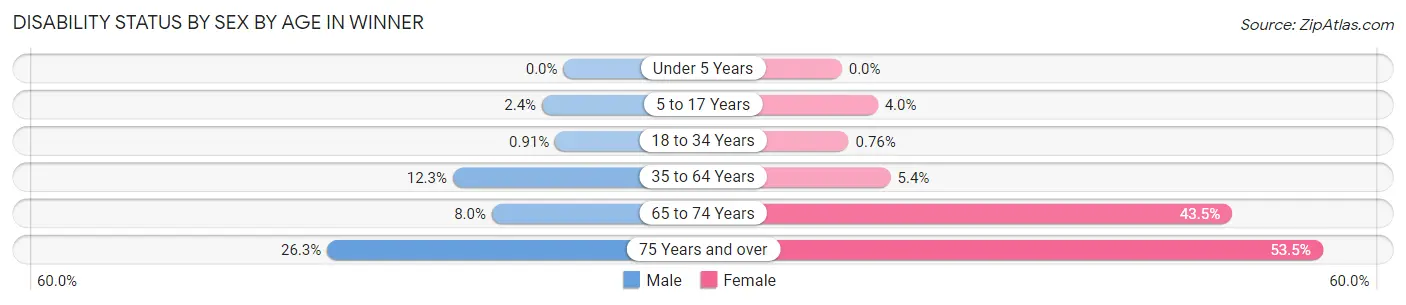
| Age Bracket | Male | Female |
| Under 5 Years | 0 (0.0%) | 0 (0.0%) |
| 5 to 17 Years | 5 (2.4%) | 8 (4.0%) |
| 18 to 34 Years | 3 (0.9%) | 2 (0.8%) |
| 35 to 64 Years | 65 (12.3%) | 28 (5.4%) |
| 65 to 74 Years | 11 (8.0%) | 63 (43.4%) |
| 75 Years and over | 25 (26.3%) | 91 (53.5%) |
Disability Class by Sex by Age in Winner
Disability Class: Hearing Difficulty
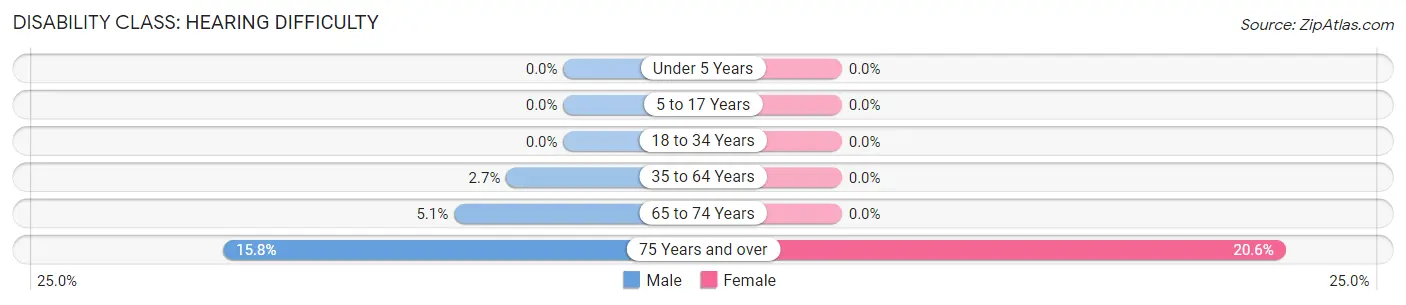
| Age Bracket | Male | Female |
| Under 5 Years | 0 (0.0%) | 0 (0.0%) |
| 5 to 17 Years | 0 (0.0%) | 0 (0.0%) |
| 18 to 34 Years | 0 (0.0%) | 0 (0.0%) |
| 35 to 64 Years | 14 (2.6%) | 0 (0.0%) |
| 65 to 74 Years | 7 (5.1%) | 0 (0.0%) |
| 75 Years and over | 15 (15.8%) | 35 (20.6%) |
Disability Class: Vision Difficulty
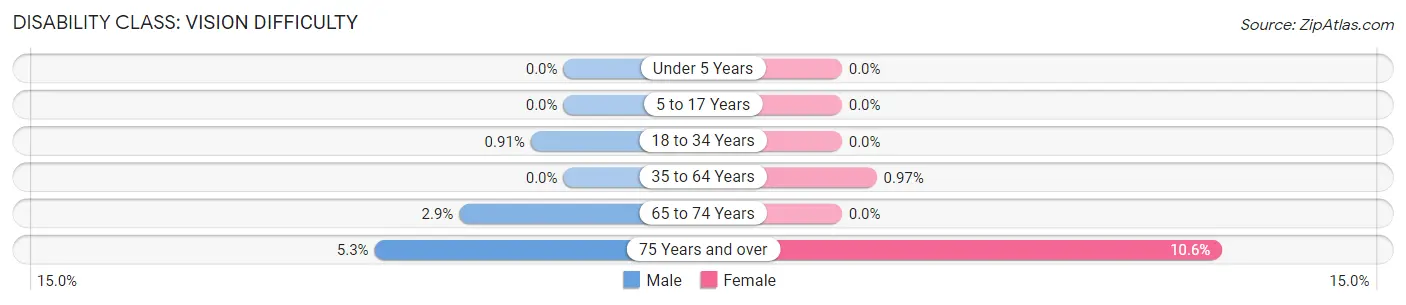
| Age Bracket | Male | Female |
| Under 5 Years | 0 (0.0%) | 0 (0.0%) |
| 5 to 17 Years | 0 (0.0%) | 0 (0.0%) |
| 18 to 34 Years | 3 (0.9%) | 0 (0.0%) |
| 35 to 64 Years | 0 (0.0%) | 5 (1.0%) |
| 65 to 74 Years | 4 (2.9%) | 0 (0.0%) |
| 75 Years and over | 5 (5.3%) | 18 (10.6%) |
Disability Class: Cognitive Difficulty
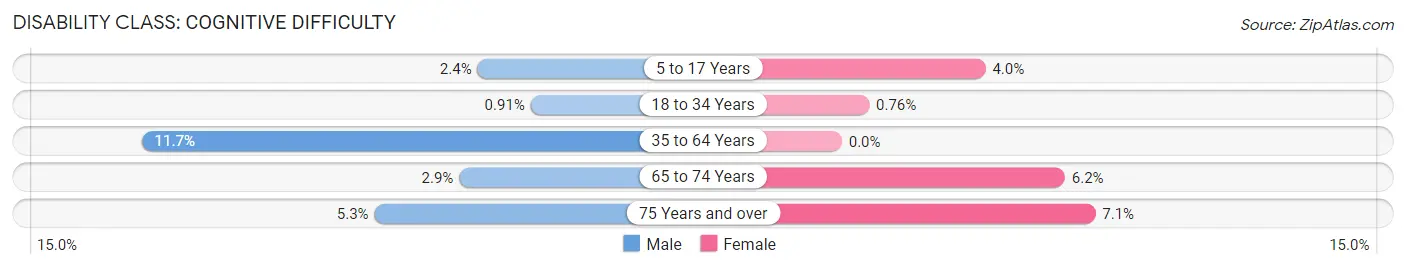
| Age Bracket | Male | Female |
| 5 to 17 Years | 5 (2.4%) | 8 (4.0%) |
| 18 to 34 Years | 3 (0.9%) | 2 (0.8%) |
| 35 to 64 Years | 62 (11.7%) | 0 (0.0%) |
| 65 to 74 Years | 4 (2.9%) | 9 (6.2%) |
| 75 Years and over | 5 (5.3%) | 12 (7.1%) |
Disability Class: Ambulatory Difficulty
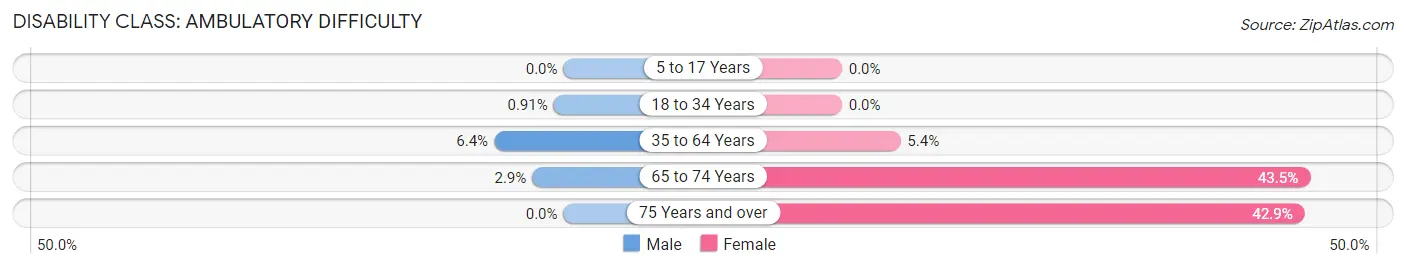
| Age Bracket | Male | Female |
| 5 to 17 Years | 0 (0.0%) | 0 (0.0%) |
| 18 to 34 Years | 3 (0.9%) | 0 (0.0%) |
| 35 to 64 Years | 34 (6.4%) | 28 (5.4%) |
| 65 to 74 Years | 4 (2.9%) | 63 (43.4%) |
| 75 Years and over | 0 (0.0%) | 73 (42.9%) |
Disability Class: Self-Care Difficulty
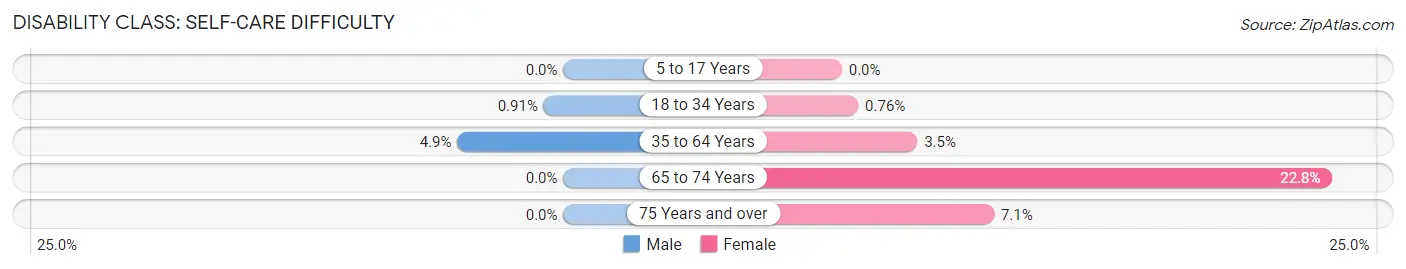
| Age Bracket | Male | Female |
| 5 to 17 Years | 0 (0.0%) | 0 (0.0%) |
| 18 to 34 Years | 3 (0.9%) | 2 (0.8%) |
| 35 to 64 Years | 26 (4.9%) | 18 (3.5%) |
| 65 to 74 Years | 0 (0.0%) | 33 (22.8%) |
| 75 Years and over | 0 (0.0%) | 12 (7.1%) |
Technology Access in Winner
Computing Device Access in Winner
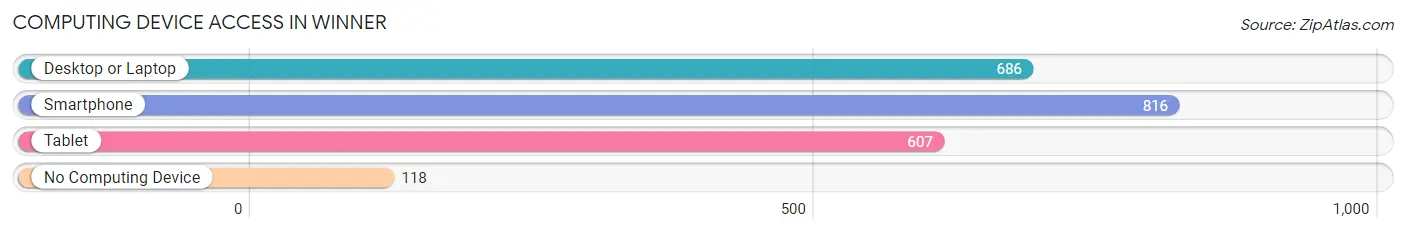
| Device Type | # Households | % Households |
| Desktop or Laptop | 686 | 63.6% |
| Smartphone | 816 | 75.7% |
| Tablet | 607 | 56.3% |
| No Computing Device | 118 | 11.0% |
| Total | 1,078 | 100.0% |
Internet Access in Winner
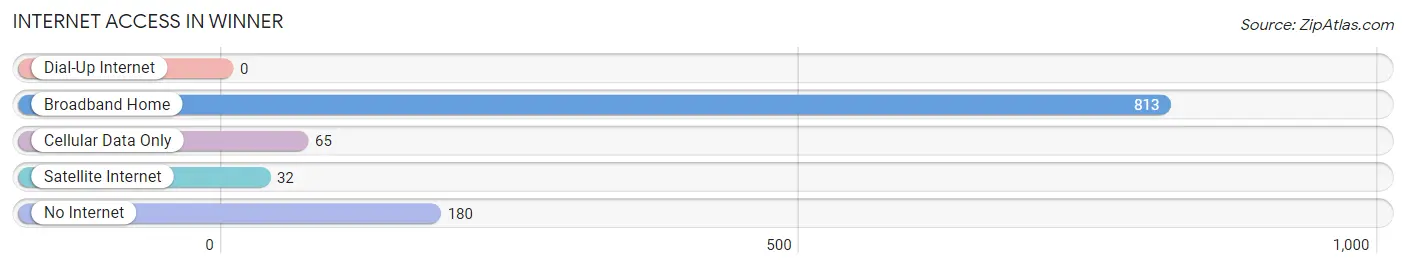
| Internet Type | # Households | % Households |
| Dial-Up Internet | 0 | 0.0% |
| Broadband Home | 813 | 75.4% |
| Cellular Data Only | 65 | 6.0% |
| Satellite Internet | 32 | 3.0% |
| No Internet | 180 | 16.7% |
| Total | 1,078 | 100.0% |
Winner Summary
South Dakota is a state located in the Midwestern region of the United States. It is bordered by North Dakota to the north, Minnesota to the east, Iowa to the southeast, Nebraska to the south, and Wyoming and Montana to the west. South Dakota is the seventeenth largest state in the United States, with an area of 77,116 square miles (199,730 km2). As of 2020, the population of South Dakota was estimated to be 884,659, making it the fifth least populous state in the country.
Geography
South Dakota is located in the Great Plains region of the United States. It is bordered by North Dakota to the north, Minnesota to the east, Iowa to the southeast, Nebraska to the south, and Wyoming and Montana to the west. The Missouri River forms the eastern border of the state. The Black Hills, a small mountain range located in the southwestern part of the state, is the highest point in South Dakota, with an elevation of 7,242 feet (2,207 m). The state also contains several large lakes, including Lake Oahe, Lake Sharpe, and Lake Francis Case.
Economy
South Dakota has a diversified economy, with agriculture, manufacturing, and tourism being the main industries. Agriculture is the largest sector of the state’s economy, accounting for about one-third of the state’s total economic output. The state’s main agricultural products include corn, soybeans, wheat, and hogs. Manufacturing is the second-largest sector of the state’s economy, accounting for about one-fifth of the state’s total economic output. The state’s main manufactured products include machinery, food products, and chemicals. Tourism is the third-largest sector of the state’s economy, accounting for about one-tenth of the state’s total economic output. The state’s main tourist attractions include the Black Hills, Mount Rushmore, and the Badlands National Park.
Demographics
As of 2020, the population of South Dakota was estimated to be 884,659, making it the fifth least populous state in the country. The state’s population is predominantly white, with about 85% of the population identifying as white. The state’s largest racial/ethnic group is Native American, with about 9% of the population identifying as Native American. The state’s second-largest racial/ethnic group is Hispanic or Latino, with about 4% of the population identifying as Hispanic or Latino. The state’s third-largest racial/ethnic group is African American, with about 2% of the population identifying as African American.
History
South Dakota was first inhabited by Native American tribes, including the Sioux, Cheyenne, and Arapaho. The area was explored by French fur traders in the late 1700s, and the first permanent settlement was established in 1817. The area was part of the Louisiana Purchase in 1803, and it became part of the Dakota Territory in 1861. South Dakota became a state in 1889, and it was the 40th state to join the Union.
South Dakota has a rich history of Native American culture, and it is home to several Native American reservations. The state is also home to several historical sites, including the Badlands National Park, the Black Hills, and Mount Rushmore. South Dakota is also home to several military installations, including Ellsworth Air Force Base and the South Dakota Army National Guard.
Common Questions
What is Per Capita Income in Winner?
Per Capita income in Winner is $26,135.
What is the Median Family Income in Winner?
Median Family Income in Winner is $65,956.
What is the Median Household income in Winner?
Median Household Income in Winner is $52,500.
What is Income or Wage Gap in Winner?
Income or Wage Gap in Winner is 0.7%.
Women in Winner earn 99.3 cents for every dollar earned by a man.
What is Inequality or Gini Index in Winner?
Inequality or Gini Index in Winner is 0.43.
What is the Total Population of Winner?
Total Population of Winner is 2,905.
What is the Total Male Population of Winner?
Total Male Population of Winner is 1,525.
What is the Total Female Population of Winner?
Total Female Population of Winner is 1,380.
What is the Ratio of Males per 100 Females in Winner?
There are 110.51 Males per 100 Females in Winner.
What is the Ratio of Females per 100 Males in Winner?
There are 90.49 Females per 100 Males in Winner.
What is the Median Population Age in Winner?
Median Population Age in Winner is 43.7 Years.
What is the Average Family Size in Winner
Average Family Size in Winner is 3.1 People.
What is the Average Household Size in Winner
Average Household Size in Winner is 2.5 People.
How Large is the Labor Force in Winner?
There are 1,420 People in the Labor Forcein in Winner.
What is the Percentage of People in the Labor Force in Winner?
60.7% of People are in the Labor Force in Winner.
What is the Unemployment Rate in Winner?
Unemployment Rate in Winner is 8.7%.