Big Stone City, SD Map & Demographics
Big Stone City Map
Big Stone City Overview
$36,723
PER CAPITA INCOME
$63,542
AVG FAMILY INCOME
$51,250
AVG HOUSEHOLD INCOME
27.9%
WAGE / INCOME GAP [ % ]
72.1¢/ $1
WAGE / INCOME GAP [ $ ]
0.46
INEQUALITY / GINI INDEX
769
TOTAL POPULATION
422
MALE POPULATION
347
FEMALE POPULATION
121.61
MALES / 100 FEMALES
82.23
FEMALES / 100 MALES
56.1
MEDIAN AGE
2.5
AVG FAMILY SIZE
2.1
AVG HOUSEHOLD SIZE
349
LABOR FORCE [ PEOPLE ]
52.2%
PERCENT IN LABOR FORCE
Big Stone City Zip Codes
Big Stone City Area Codes
Income in Big Stone City
Income Overview in Big Stone City
Per Capita Income in Big Stone City is $36,723, while median incomes of families and households are $63,542 and $51,250 respectively.
| Characteristic | Number | Measure |
| Per Capita Income | 769 | $36,723 |
| Median Family Income | 227 | $63,542 |
| Mean Family Income | 227 | $87,559 |
| Median Household Income | 366 | $51,250 |
| Mean Household Income | 366 | $73,747 |
| Income Deficit | 227 | $0 |
| Wage / Income Gap (%) | 769 | 27.92% |
| Wage / Income Gap ($) | 769 | 72.08¢ per $1 |
| Gini / Inequality Index | 769 | 0.46 |
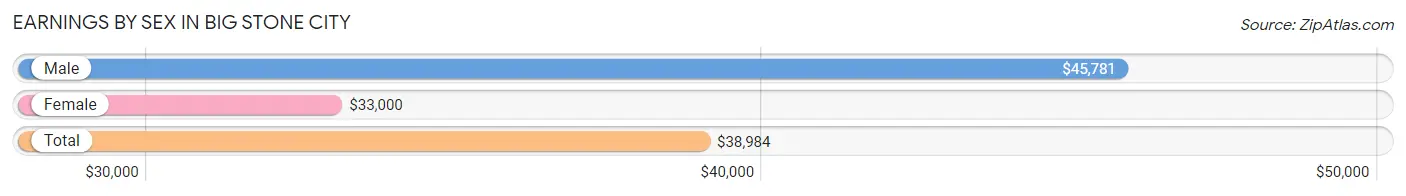
Earnings by Sex in Big Stone City
Average Earnings in Big Stone City are $38,984, $45,781 for men and $33,000 for women, a difference of 27.9%.
| Sex | Number | Average Earnings |
| Male | 236 (64.5%) | $45,781 |
| Female | 130 (35.5%) | $33,000 |
| Total | 366 (100.0%) | $38,984 |
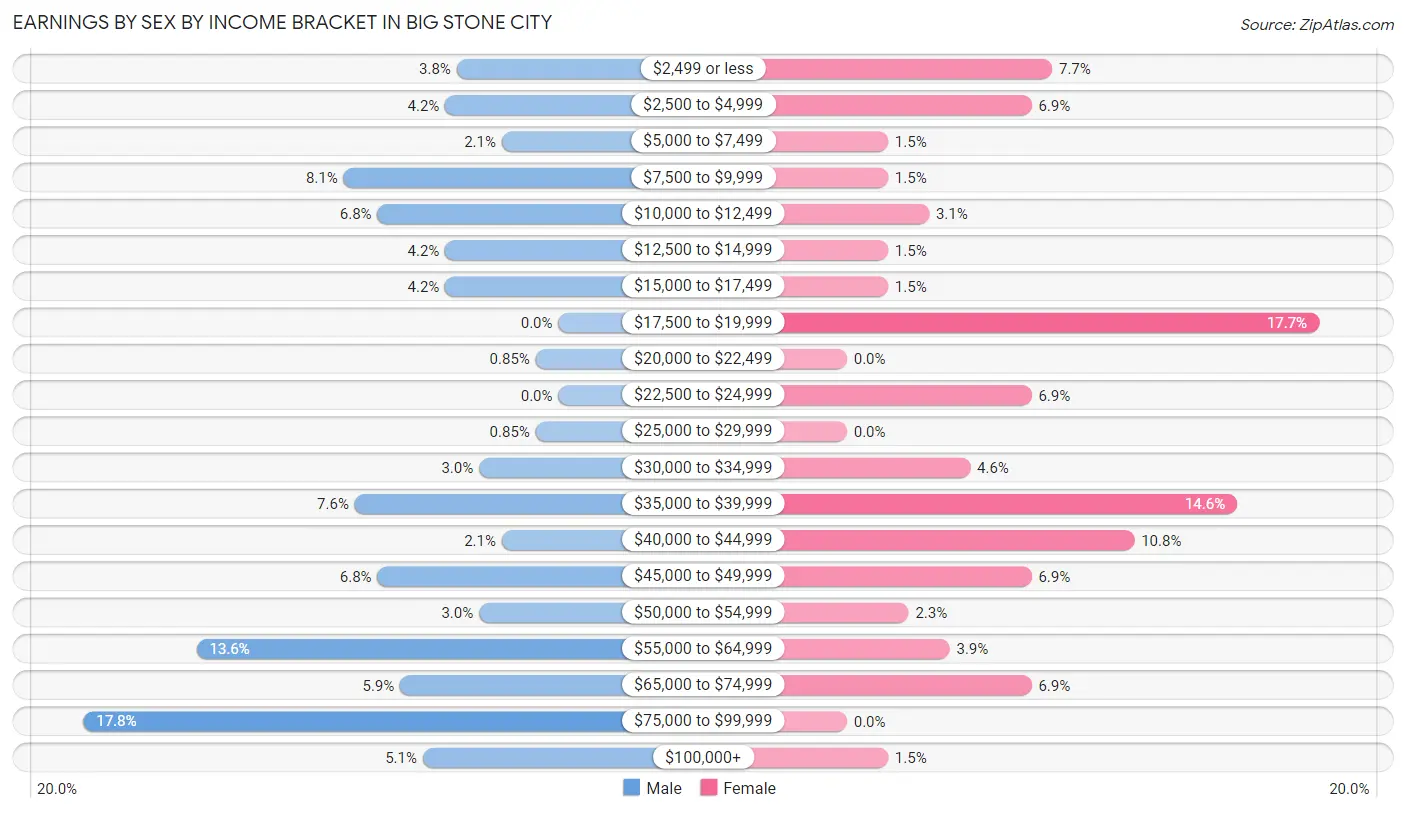
Earnings by Sex by Income Bracket in Big Stone City
The most common earnings brackets in Big Stone City are $75,000 to $99,999 for men (42 | 17.8%) and $17,500 to $19,999 for women (23 | 17.7%).
| Income | Male | Female |
| $2,499 or less | 9 (3.8%) | 10 (7.7%) |
| $2,500 to $4,999 | 10 (4.2%) | 9 (6.9%) |
| $5,000 to $7,499 | 5 (2.1%) | 2 (1.5%) |
| $7,500 to $9,999 | 19 (8.1%) | 2 (1.5%) |
| $10,000 to $12,499 | 16 (6.8%) | 4 (3.1%) |
| $12,500 to $14,999 | 10 (4.2%) | 2 (1.5%) |
| $15,000 to $17,499 | 10 (4.2%) | 2 (1.5%) |
| $17,500 to $19,999 | 0 (0.0%) | 23 (17.7%) |
| $20,000 to $22,499 | 2 (0.9%) | 0 (0.0%) |
| $22,500 to $24,999 | 0 (0.0%) | 9 (6.9%) |
| $25,000 to $29,999 | 2 (0.9%) | 0 (0.0%) |
| $30,000 to $34,999 | 7 (3.0%) | 6 (4.6%) |
| $35,000 to $39,999 | 18 (7.6%) | 19 (14.6%) |
| $40,000 to $44,999 | 5 (2.1%) | 14 (10.8%) |
| $45,000 to $49,999 | 16 (6.8%) | 9 (6.9%) |
| $50,000 to $54,999 | 7 (3.0%) | 3 (2.3%) |
| $55,000 to $64,999 | 32 (13.6%) | 5 (3.8%) |
| $65,000 to $74,999 | 14 (5.9%) | 9 (6.9%) |
| $75,000 to $99,999 | 42 (17.8%) | 0 (0.0%) |
| $100,000+ | 12 (5.1%) | 2 (1.5%) |
| Total | 236 (100.0%) | 130 (100.0%) |
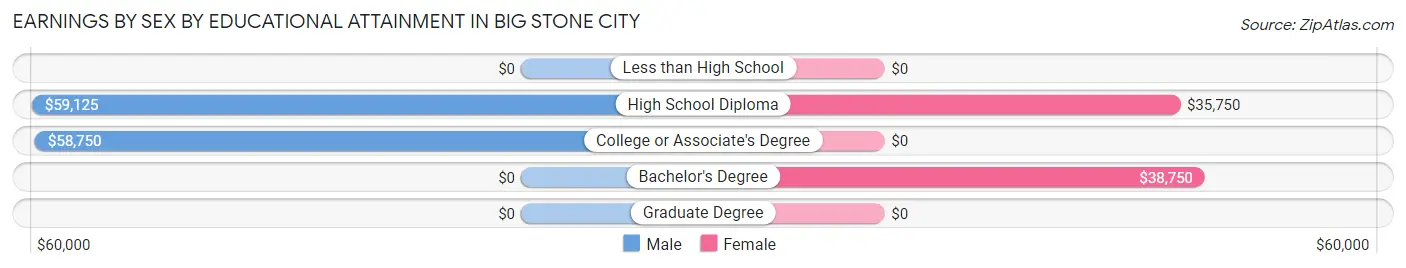
Earnings by Sex by Educational Attainment in Big Stone City
Average earnings in Big Stone City are $59,231 for men and $33,000 for women, a difference of 44.3%. Men with an educational attainment of high school diploma enjoy the highest average annual earnings of $59,125, while those with college or associate's degree education earn the least with $58,750. Women with an educational attainment of bachelor's degree earn the most with the average annual earnings of $38,750, while those with high school diploma education have the smallest earnings of $35,750.
| Educational Attainment | Male Income | Female Income |
| Less than High School | - | - |
| High School Diploma | $59,125 | $35,750 |
| College or Associate's Degree | $58,750 | $0 |
| Bachelor's Degree | - | - |
| Graduate Degree | - | - |
| Total | $59,231 | $33,000 |
Family Income in Big Stone City
Family Income Brackets in Big Stone City
According to the Big Stone City family income data, there are 66 families falling into the $25,000 to $34,999 income range, which is the most common income bracket and makes up 29.1% of all families.
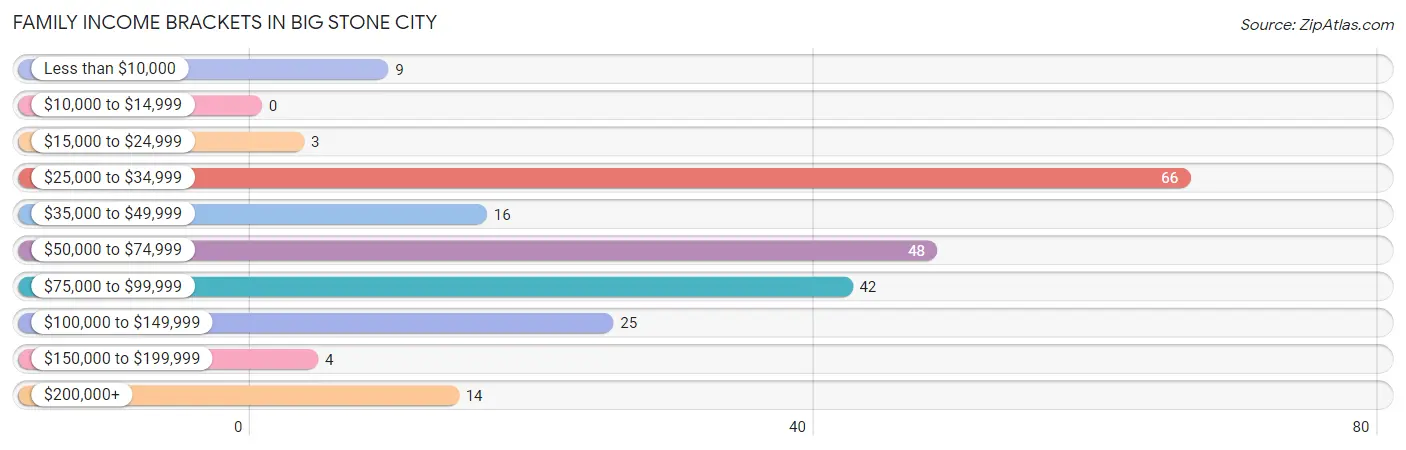
| Income Bracket | # Families | % Families |
| Less than $10,000 | 9 | 4.0% |
| $10,000 to $14,999 | 0 | 0.0% |
| $15,000 to $24,999 | 3 | 1.3% |
| $25,000 to $34,999 | 66 | 29.1% |
| $35,000 to $49,999 | 16 | 7.0% |
| $50,000 to $74,999 | 48 | 21.1% |
| $75,000 to $99,999 | 42 | 18.5% |
| $100,000 to $149,999 | 25 | 11.0% |
| $150,000 to $199,999 | 4 | 1.8% |
| $200,000+ | 14 | 6.2% |
Family Income by Famaliy Size in Big Stone City
3-person families (13 | 5.7%) account for the highest median family income in Big Stone City with $98,750 per family, while 3-person families (13 | 5.7%) have the highest median income of $32,917 per family member.
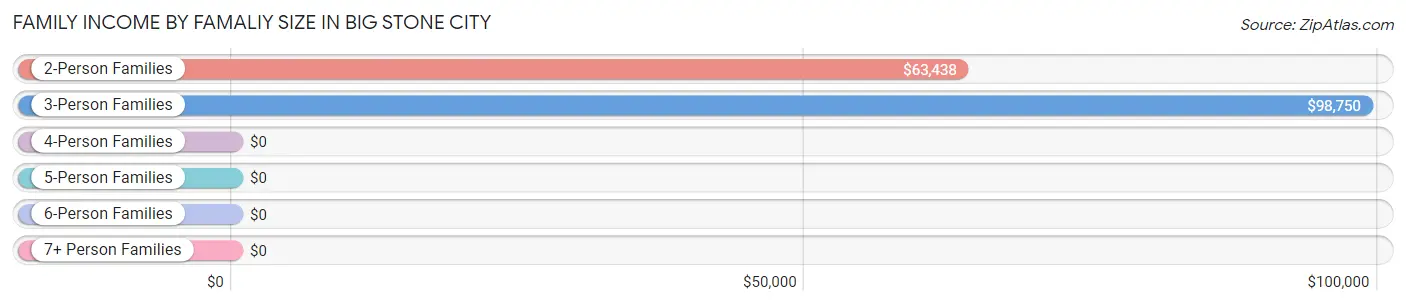
| Income Bracket | # Families | Median Income |
| 2-Person Families | 176 (77.5%) | $63,438 |
| 3-Person Families | 13 (5.7%) | $98,750 |
| 4-Person Families | 34 (15.0%) | $0 |
| 5-Person Families | 4 (1.8%) | $0 |
| 6-Person Families | 0 (0.0%) | $0 |
| 7+ Person Families | 0 (0.0%) | $0 |
| Total | 227 (100.0%) | $63,542 |
Family Income by Number of Earners in Big Stone City
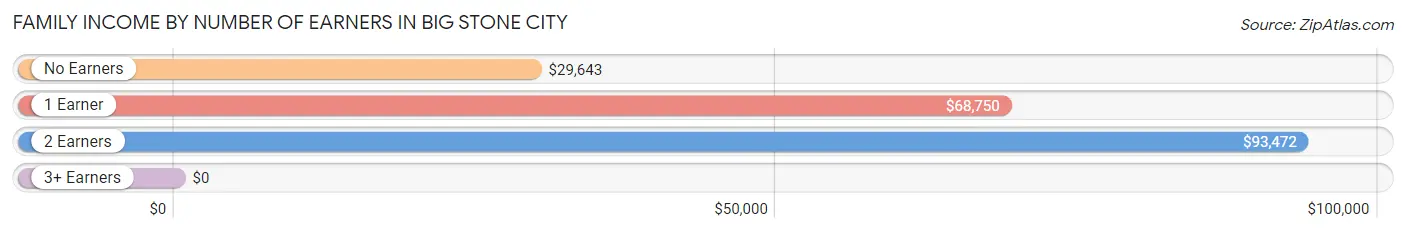
| Number of Earners | # Families | Median Income |
| No Earners | 92 (40.5%) | $29,643 |
| 1 Earner | 42 (18.5%) | $68,750 |
| 2 Earners | 65 (28.6%) | $93,472 |
| 3+ Earners | 28 (12.3%) | $0 |
| Total | 227 (100.0%) | $63,542 |
Household Income in Big Stone City
Household Income Brackets in Big Stone City
With 95 households falling in the category, the $25,000 to $34,999 income range is the most frequent in Big Stone City, accounting for 26.0% of all households. In contrast, only 4 households (1.1%) fall into the $150,000 to $199,999 income bracket, making it the least populous group.
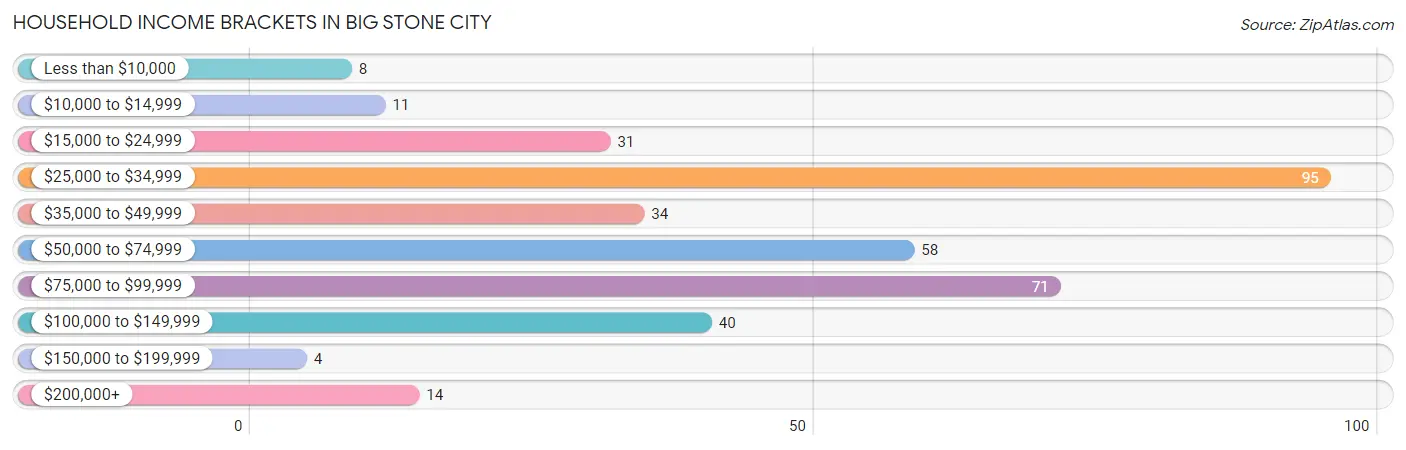
| Income Bracket | # Households | % Households |
| Less than $10,000 | 8 | 2.2% |
| $10,000 to $14,999 | 11 | 3.0% |
| $15,000 to $24,999 | 31 | 8.5% |
| $25,000 to $34,999 | 95 | 26.0% |
| $35,000 to $49,999 | 34 | 9.3% |
| $50,000 to $74,999 | 58 | 15.8% |
| $75,000 to $99,999 | 71 | 19.4% |
| $100,000 to $149,999 | 40 | 10.9% |
| $150,000 to $199,999 | 4 | 1.1% |
| $200,000+ | 14 | 3.8% |
Household Income by Householder Age in Big Stone City
The median household income in Big Stone City is $51,250, with the highest median household income of $81,429 found in the 45 to 64 years age bracket for the primary householder. A total of 104 households (28.4%) fall into this category. Meanwhile, the 15 to 24 years age bracket for the primary householder has the lowest median household income of $0, with 31 households (8.5%) in this group.
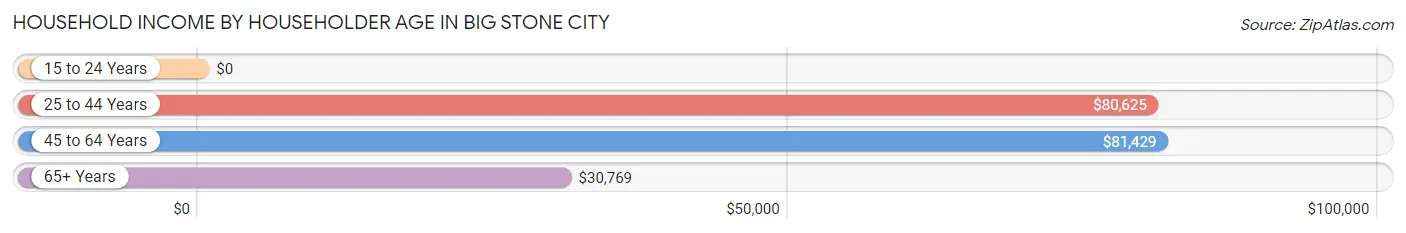
| Income Bracket | # Households | Median Income |
| 15 to 24 Years | 31 (8.5%) | $0 |
| 25 to 44 Years | 57 (15.6%) | $80,625 |
| 45 to 64 Years | 104 (28.4%) | $81,429 |
| 65+ Years | 174 (47.5%) | $30,769 |
| Total | 366 (100.0%) | $51,250 |
Poverty in Big Stone City
Income Below Poverty by Sex and Age in Big Stone City
With 22.0% poverty level for males and 9.8% for females among the residents of Big Stone City, 15 year old males and 35 to 44 year old females are the most vulnerable to poverty, with 11 males (100.0%) and 21 females (61.8%) in their respective age groups living below the poverty level.
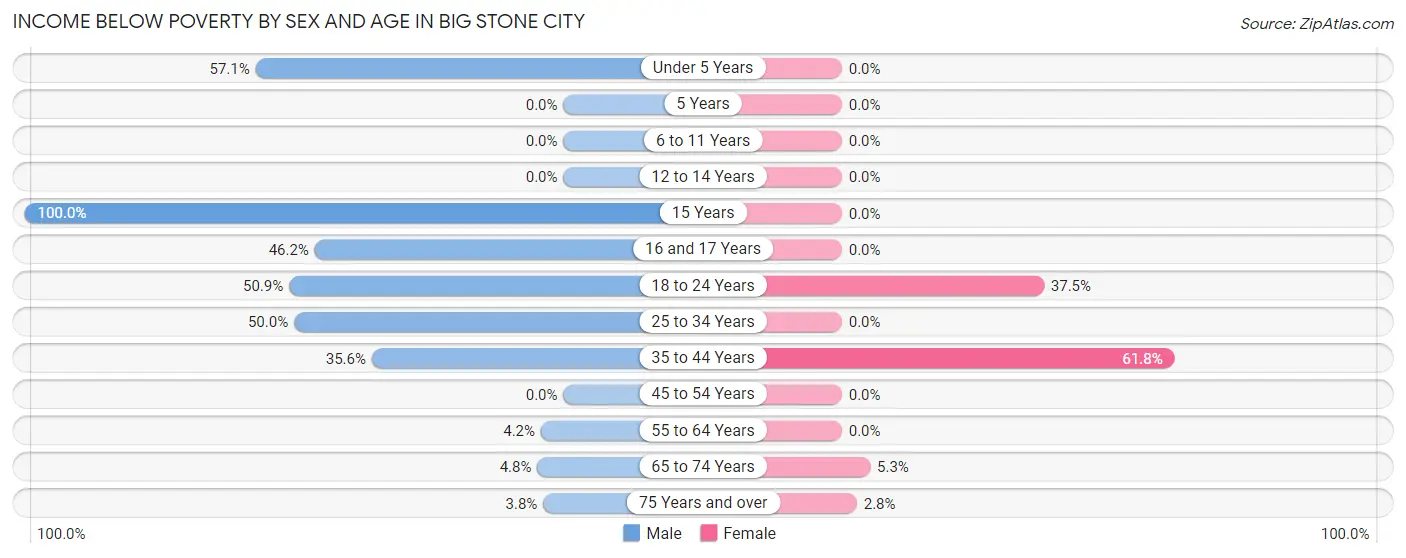
| Age Bracket | Male | Female |
| Under 5 Years | 16 (57.1%) | 0 (0.0%) |
| 5 Years | 0 (0.0%) | 0 (0.0%) |
| 6 to 11 Years | 0 (0.0%) | 0 (0.0%) |
| 12 to 14 Years | 0 (0.0%) | 0 (0.0%) |
| 15 Years | 11 (100.0%) | 0 (0.0%) |
| 16 and 17 Years | 6 (46.2%) | 0 (0.0%) |
| 18 to 24 Years | 28 (50.9%) | 6 (37.5%) |
| 25 to 34 Years | 8 (50.0%) | 0 (0.0%) |
| 35 to 44 Years | 16 (35.6%) | 21 (61.8%) |
| 45 to 54 Years | 0 (0.0%) | 0 (0.0%) |
| 55 to 64 Years | 2 (4.2%) | 0 (0.0%) |
| 65 to 74 Years | 3 (4.8%) | 3 (5.3%) |
| 75 Years and over | 3 (3.7%) | 3 (2.8%) |
| Total | 93 (22.0%) | 33 (9.8%) |
Income Above Poverty by Sex and Age in Big Stone City
According to the poverty statistics in Big Stone City, males aged 6 to 11 years and females aged under 5 years are the age groups that are most secure financially, with 100.0% of males and 100.0% of females in these age groups living above the poverty line.
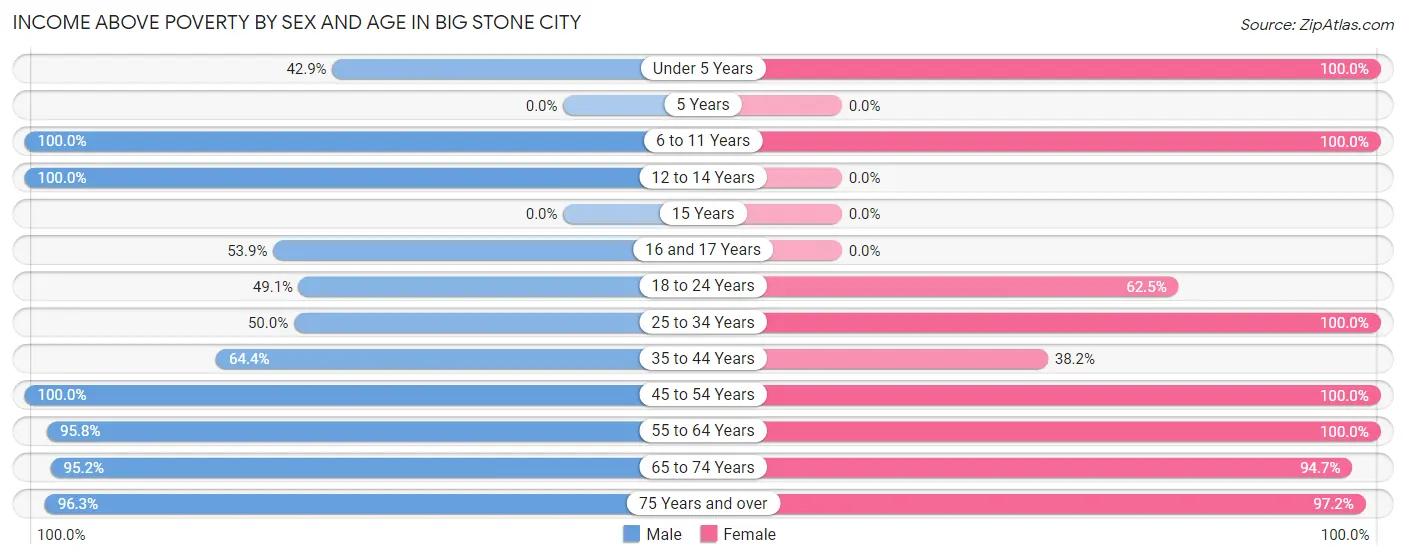
| Age Bracket | Male | Female |
| Under 5 Years | 12 (42.9%) | 3 (100.0%) |
| 5 Years | 0 (0.0%) | 0 (0.0%) |
| 6 to 11 Years | 3 (100.0%) | 35 (100.0%) |
| 12 to 14 Years | 10 (100.0%) | 0 (0.0%) |
| 15 Years | 0 (0.0%) | 0 (0.0%) |
| 16 and 17 Years | 7 (53.8%) | 0 (0.0%) |
| 18 to 24 Years | 27 (49.1%) | 10 (62.5%) |
| 25 to 34 Years | 8 (50.0%) | 17 (100.0%) |
| 35 to 44 Years | 29 (64.4%) | 13 (38.2%) |
| 45 to 54 Years | 51 (100.0%) | 35 (100.0%) |
| 55 to 64 Years | 46 (95.8%) | 32 (100.0%) |
| 65 to 74 Years | 59 (95.2%) | 54 (94.7%) |
| 75 Years and over | 77 (96.3%) | 105 (97.2%) |
| Total | 329 (78.0%) | 304 (90.2%) |
Income Below Poverty Among Married-Couple Families in Big Stone City
The poverty statistics for married-couple families in Big Stone City show that 11.0% or 22 of the total 201 families live below the poverty line. Families with 1 or 2 children have the highest poverty rate of 57.6%, comprising of 19 families. On the other hand, families with 3 or 4 children have the lowest poverty rate of 0.0%, which includes 0 families.
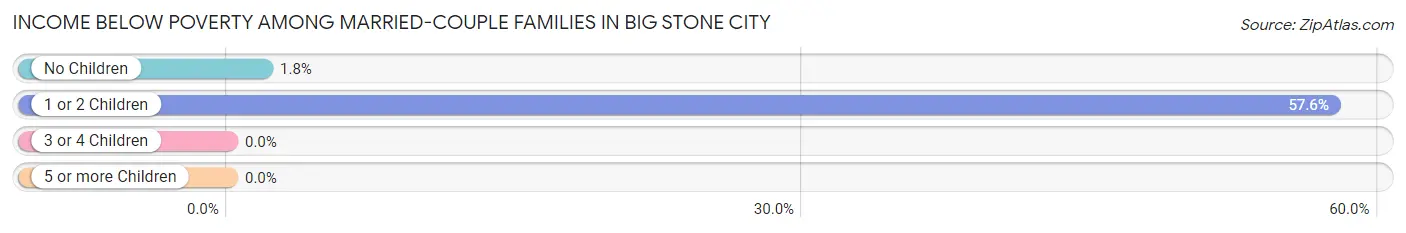
| Children | Above Poverty | Below Poverty |
| No Children | 161 (98.2%) | 3 (1.8%) |
| 1 or 2 Children | 14 (42.4%) | 19 (57.6%) |
| 3 or 4 Children | 4 (100.0%) | 0 (0.0%) |
| 5 or more Children | 0 (0.0%) | 0 (0.0%) |
| Total | 179 (89.0%) | 22 (11.0%) |
Income Below Poverty Among Single-Parent Households in Big Stone City
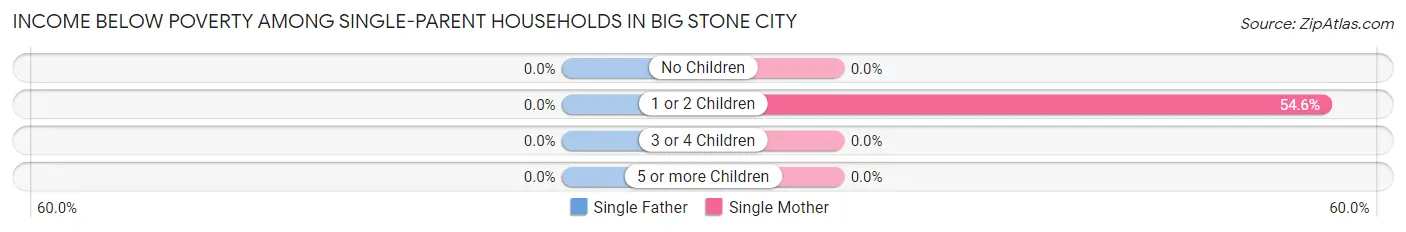
| Children | Single Father | Single Mother |
| No Children | 0 (0.0%) | 0 (0.0%) |
| 1 or 2 Children | 0 (0.0%) | 6 (54.5%) |
| 3 or 4 Children | 0 (0.0%) | 0 (0.0%) |
| 5 or more Children | 0 (0.0%) | 0 (0.0%) |
| Total | 0 (0.0%) | 6 (42.9%) |
Income Below Poverty Among Married-Couple vs Single-Parent Households in Big Stone City
The poverty data for Big Stone City shows that 22 of the married-couple family households (11.0%) and 6 of the single-parent households (23.1%) are living below the poverty level. Within the married-couple family households, those with 1 or 2 children have the highest poverty rate, with 19 households (57.6%) falling below the poverty line. Among the single-parent households, those with 1 or 2 children have the highest poverty rate, with 6 household (30.0%) living below poverty.
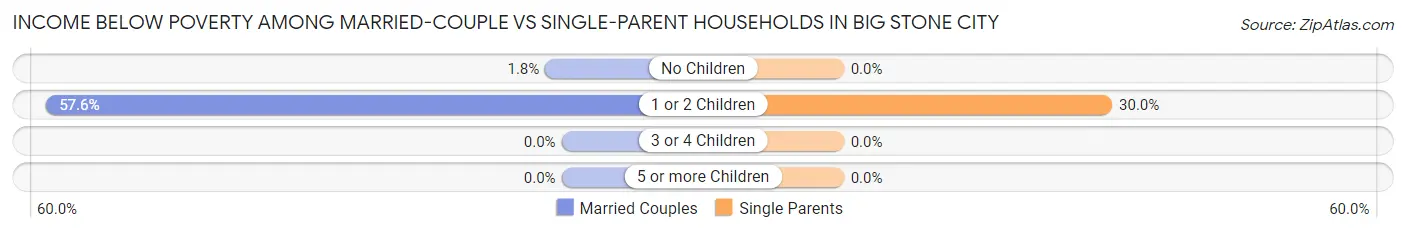
| Children | Married-Couple Families | Single-Parent Households |
| No Children | 3 (1.8%) | 0 (0.0%) |
| 1 or 2 Children | 19 (57.6%) | 6 (30.0%) |
| 3 or 4 Children | 0 (0.0%) | 0 (0.0%) |
| 5 or more Children | 0 (0.0%) | 0 (0.0%) |
| Total | 22 (11.0%) | 6 (23.1%) |
Race in Big Stone City
The most populous races in Big Stone City are White / Caucasian (728 | 94.7%), Hispanic or Latino (47 | 6.1%), and Two or more Races (35 | 4.5%).
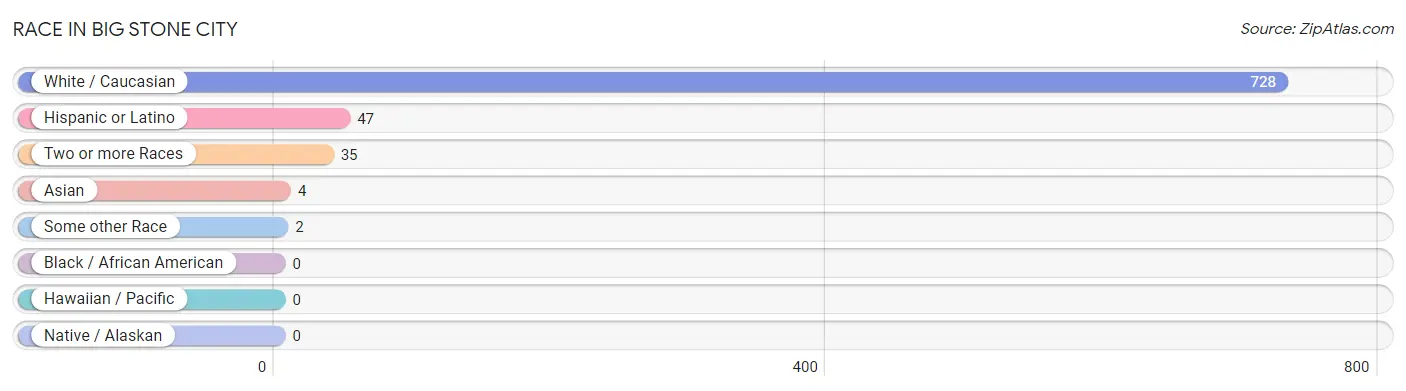
| Race | # Population | % Population |
| Asian | 4 | 0.5% |
| Black / African American | 0 | 0.0% |
| Hawaiian / Pacific | 0 | 0.0% |
| Hispanic or Latino | 47 | 6.1% |
| Native / Alaskan | 0 | 0.0% |
| White / Caucasian | 728 | 94.7% |
| Two or more Races | 35 | 4.5% |
| Some other Race | 2 | 0.3% |
| Total | 769 | 100.0% |
Ancestry in Big Stone City
The most populous ancestries reported in Big Stone City are German (470 | 61.1%), Irish (145 | 18.9%), Norwegian (103 | 13.4%), Mexican (46 | 6.0%), and Polish (22 | 2.9%), together accounting for 102.2% of all Big Stone City residents.
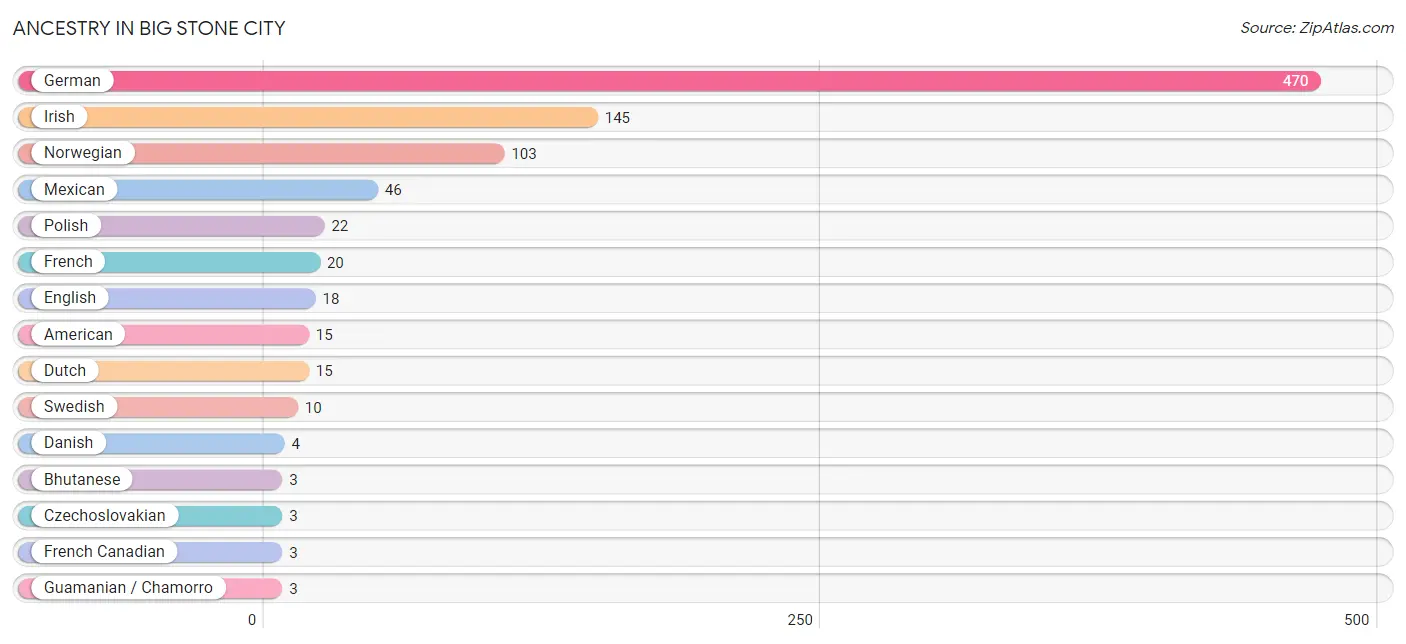
| Ancestry | # Population | % Population |
| American | 15 | 1.9% |
| Bhutanese | 3 | 0.4% |
| Czech | 2 | 0.3% |
| Czechoslovakian | 3 | 0.4% |
| Danish | 4 | 0.5% |
| Dutch | 15 | 1.9% |
| English | 18 | 2.3% |
| French | 20 | 2.6% |
| French Canadian | 3 | 0.4% |
| German | 470 | 61.1% |
| Guamanian / Chamorro | 3 | 0.4% |
| Indian (Asian) | 1 | 0.1% |
| Irish | 145 | 18.9% |
| Korean | 2 | 0.3% |
| Mexican | 46 | 6.0% |
| Norwegian | 103 | 13.4% |
| Polish | 22 | 2.9% |
| Russian | 3 | 0.4% |
| Scotch-Irish | 2 | 0.3% |
| Scottish | 3 | 0.4% |
| Slavic | 2 | 0.3% |
| Swedish | 10 | 1.3% | View All 22 Rows |
Immigrants in Big Stone City
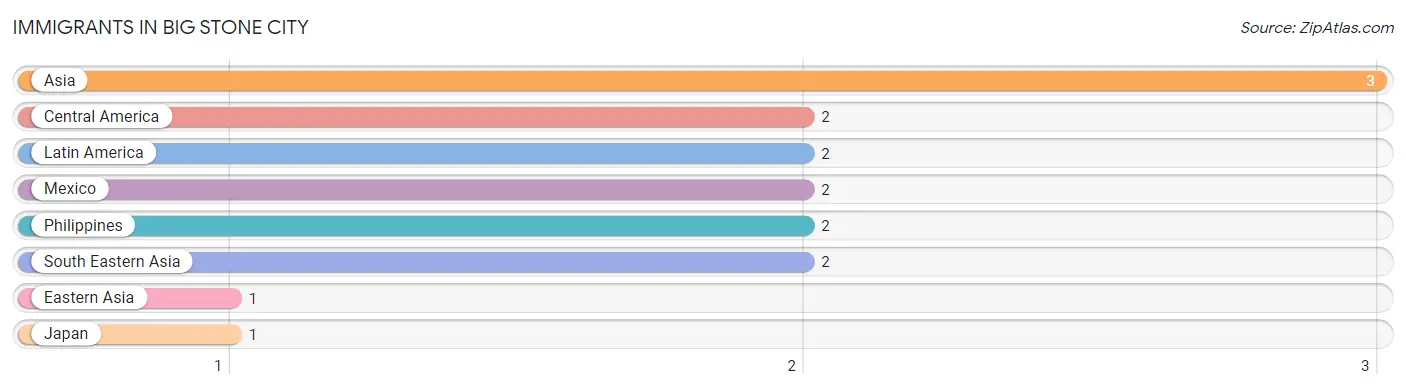
The most numerous immigrant groups reported in Big Stone City came from Asia (3 | 0.4%), Central America (2 | 0.3%), Latin America (2 | 0.3%), Mexico (2 | 0.3%), and Philippines (2 | 0.3%), together accounting for 1.4% of all Big Stone City residents.
| Immigration Origin | # Population | % Population |
| Asia | 3 | 0.4% |
| Central America | 2 | 0.3% |
| Eastern Asia | 1 | 0.1% |
| Japan | 1 | 0.1% |
| Latin America | 2 | 0.3% |
| Mexico | 2 | 0.3% |
| Philippines | 2 | 0.3% |
| South Eastern Asia | 2 | 0.3% | View All 8 Rows |
Sex and Age in Big Stone City
Sex and Age in Big Stone City
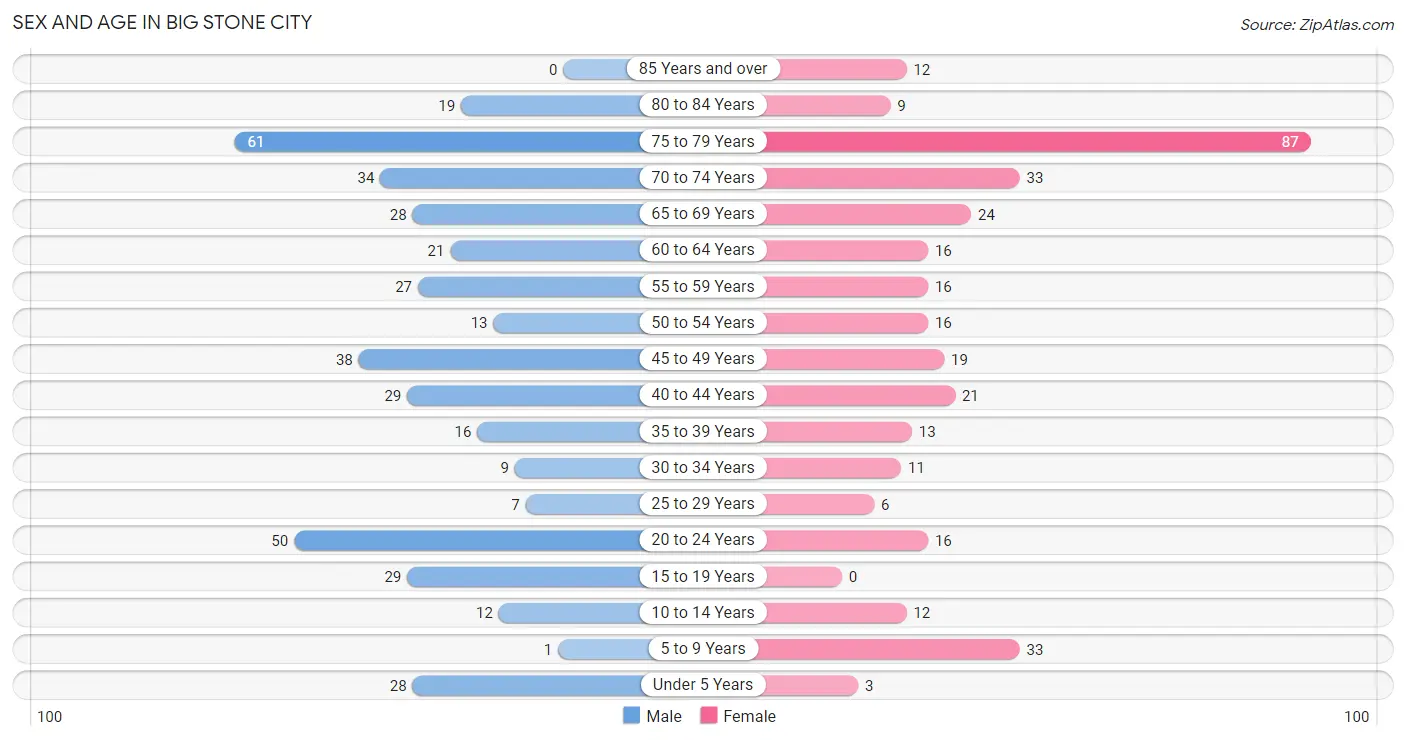
The most populous age groups in Big Stone City are 75 to 79 Years (61 | 14.4%) for men and 75 to 79 Years (87 | 25.1%) for women.
| Age Bracket | Male | Female |
| Under 5 Years | 28 (6.6%) | 3 (0.9%) |
| 5 to 9 Years | 1 (0.2%) | 33 (9.5%) |
| 10 to 14 Years | 12 (2.8%) | 12 (3.5%) |
| 15 to 19 Years | 29 (6.9%) | 0 (0.0%) |
| 20 to 24 Years | 50 (11.8%) | 16 (4.6%) |
| 25 to 29 Years | 7 (1.7%) | 6 (1.7%) |
| 30 to 34 Years | 9 (2.1%) | 11 (3.2%) |
| 35 to 39 Years | 16 (3.8%) | 13 (3.7%) |
| 40 to 44 Years | 29 (6.9%) | 21 (6.0%) |
| 45 to 49 Years | 38 (9.0%) | 19 (5.5%) |
| 50 to 54 Years | 13 (3.1%) | 16 (4.6%) |
| 55 to 59 Years | 27 (6.4%) | 16 (4.6%) |
| 60 to 64 Years | 21 (5.0%) | 16 (4.6%) |
| 65 to 69 Years | 28 (6.6%) | 24 (6.9%) |
| 70 to 74 Years | 34 (8.1%) | 33 (9.5%) |
| 75 to 79 Years | 61 (14.4%) | 87 (25.1%) |
| 80 to 84 Years | 19 (4.5%) | 9 (2.6%) |
| 85 Years and over | 0 (0.0%) | 12 (3.5%) |
| Total | 422 (100.0%) | 347 (100.0%) |
Families and Households in Big Stone City
Median Family Size in Big Stone City
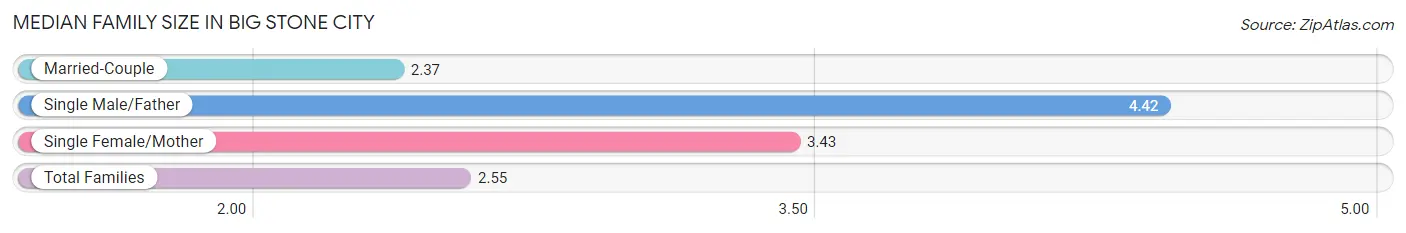
The median family size in Big Stone City is 2.55 persons per family, with single male/father families (12 | 5.3%) accounting for the largest median family size of 4.42 persons per family. On the other hand, married-couple families (201 | 88.5%) represent the smallest median family size with 2.37 persons per family.
| Family Type | # Families | Family Size |
| Married-Couple | 201 (88.5%) | 2.37 |
| Single Male/Father | 12 (5.3%) | 4.42 |
| Single Female/Mother | 14 (6.2%) | 3.43 |
| Total Families | 227 (100.0%) | 2.55 |
Median Household Size in Big Stone City
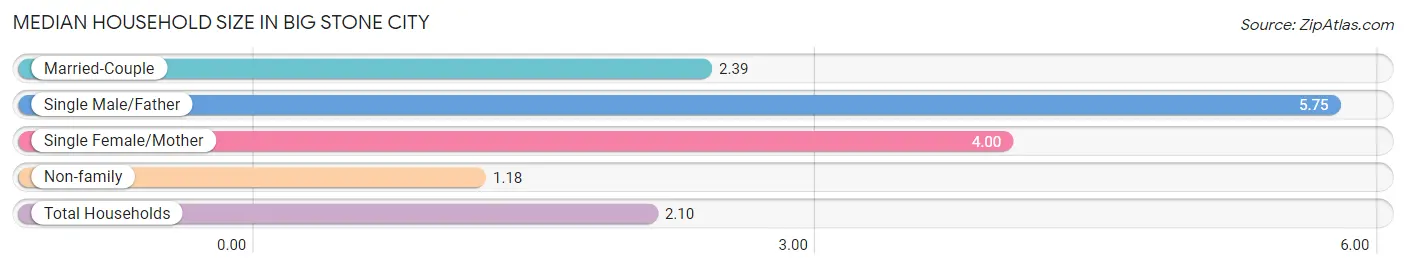
The median household size in Big Stone City is 2.10 persons per household, with single male/father households (12 | 3.3%) accounting for the largest median household size of 5.75 persons per household. non-family households (139 | 38.0%) represent the smallest median household size with 1.18 persons per household.
| Household Type | # Households | Household Size |
| Married-Couple | 201 (54.9%) | 2.39 |
| Single Male/Father | 12 (3.3%) | 5.75 |
| Single Female/Mother | 14 (3.8%) | 4.00 |
| Non-family | 139 (38.0%) | 1.18 |
| Total Households | 366 (100.0%) | 2.10 |
Household Size by Marriage Status in Big Stone City
Out of a total of 366 households in Big Stone City, 227 (62.0%) are family households, while 139 (38.0%) are nonfamily households. The most numerous type of family households are 2-person households, comprising 164, and the most common type of nonfamily households are 1-person households, comprising 114.
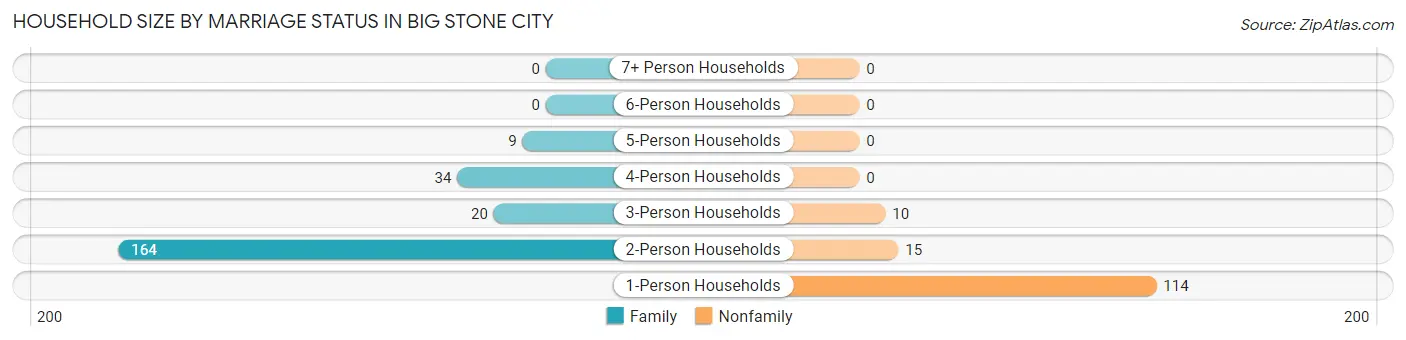
| Household Size | Family Households | Nonfamily Households |
| 1-Person Households | - | 114 (31.1%) |
| 2-Person Households | 164 (44.8%) | 15 (4.1%) |
| 3-Person Households | 20 (5.5%) | 10 (2.7%) |
| 4-Person Households | 34 (9.3%) | 0 (0.0%) |
| 5-Person Households | 9 (2.5%) | 0 (0.0%) |
| 6-Person Households | 0 (0.0%) | 0 (0.0%) |
| 7+ Person Households | 0 (0.0%) | 0 (0.0%) |
| Total | 227 (62.0%) | 139 (38.0%) |
Female Fertility in Big Stone City
Fertility by Age in Big Stone City
Average fertility rate in Big Stone City is 105.0 births per 1,000 women. Women in the age bracket of 20 to 34 years have the highest fertility rate with 273.0 births per 1,000 women. Women in the age bracket of 20 to 34 years acount for 100.0% of all women with births.
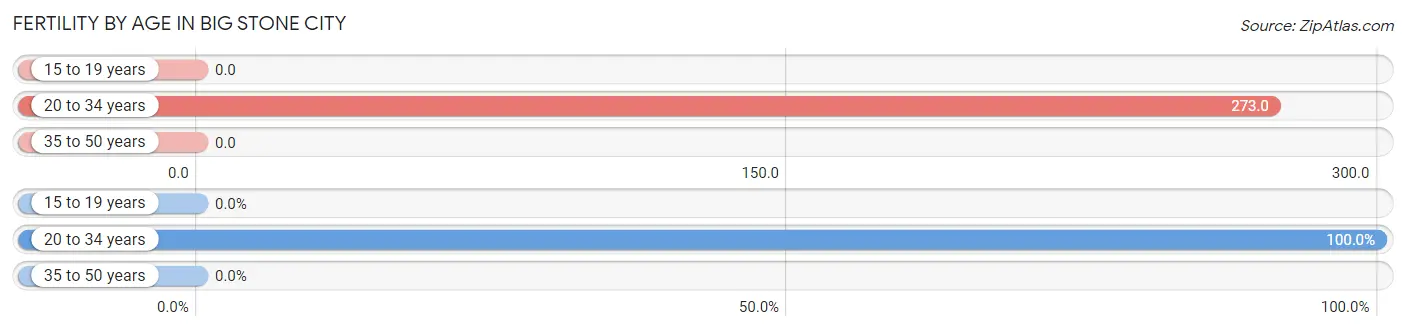
| Age Bracket | Women with Births | Births / 1,000 Women |
| 15 to 19 years | 0 (0.0%) | 0.0 |
| 20 to 34 years | 9 (100.0%) | 273.0 |
| 35 to 50 years | 0 (0.0%) | 0.0 |
| Total | 9 (100.0%) | 105.0 |
Fertility by Age by Marriage Status in Big Stone City
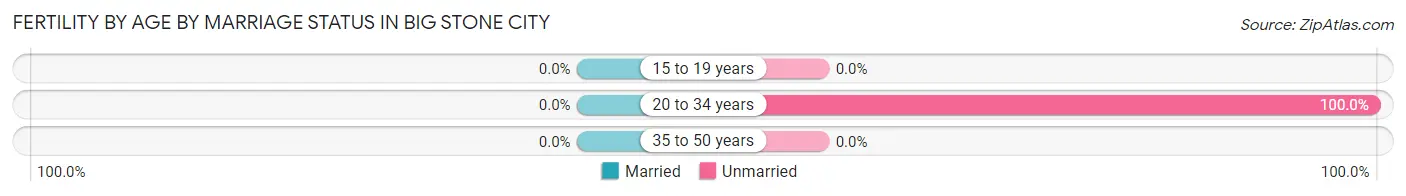
| Age Bracket | Married | Unmarried |
| 15 to 19 years | 0 (0.0%) | 0 (0.0%) |
| 20 to 34 years | 0 (0.0%) | 9 (100.0%) |
| 35 to 50 years | 0 (0.0%) | 0 (0.0%) |
| Total | 0 (0.0%) | 9 (100.0%) |
Fertility by Education in Big Stone City
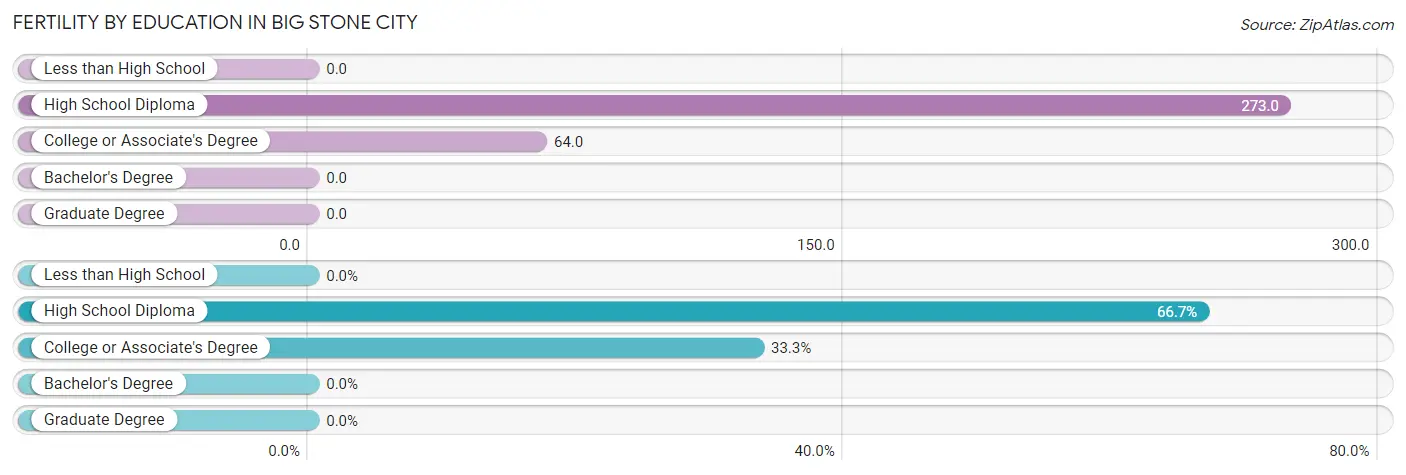
| Educational Attainment | Women with Births | Births / 1,000 Women |
| Less than High School | 0 (0.0%) | 0.0 |
| High School Diploma | 6 (66.7%) | 273.0 |
| College or Associate's Degree | 3 (33.3%) | 64.0 |
| Bachelor's Degree | 0 (0.0%) | 0.0 |
| Graduate Degree | 0 (0.0%) | 0.0 |
| Total | 9 (100.0%) | 105.0 |
Fertility by Education by Marriage Status in Big Stone City
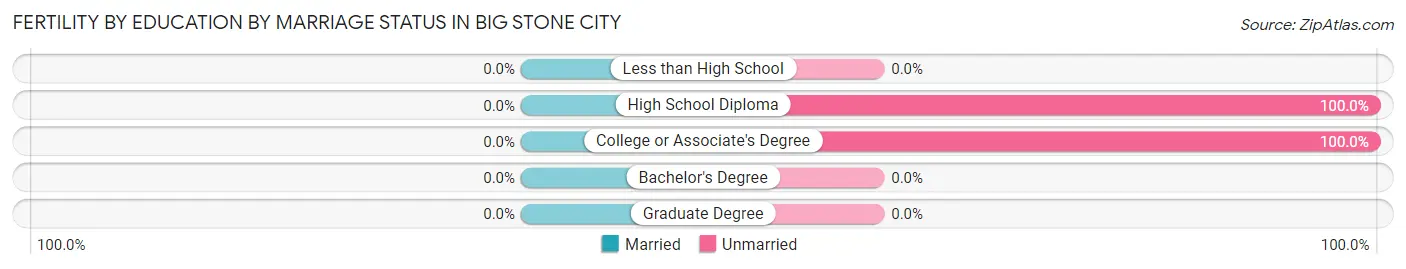
| Educational Attainment | Married | Unmarried |
| Less than High School | 0 (0.0%) | 0 (0.0%) |
| High School Diploma | 0 (0.0%) | 6 (100.0%) |
| College or Associate's Degree | 0 (0.0%) | 3 (100.0%) |
| Bachelor's Degree | 0 (0.0%) | 0 (0.0%) |
| Graduate Degree | 0 (0.0%) | 0 (0.0%) |
| Total | 0 (0.0%) | 9 (100.0%) |
Employment Characteristics in Big Stone City
Employment by Class of Employer in Big Stone City
Among the 345 employed individuals in Big Stone City, private company employees (284 | 82.3%), local government employees (33 | 9.6%), and self-employed (incorporated) (12 | 3.5%) make up the most common classes of employment.
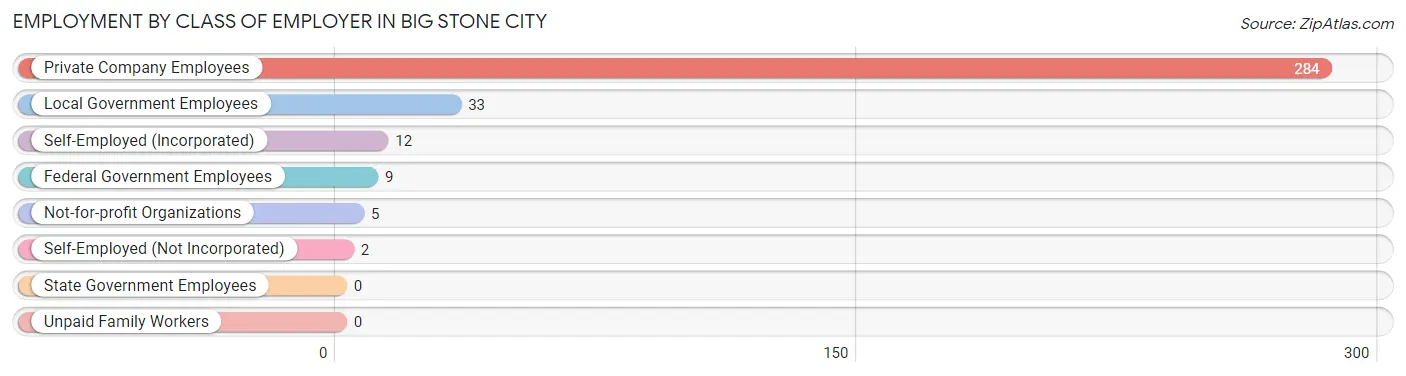
| Employer Class | # Employees | % Employees |
| Private Company Employees | 284 | 82.3% |
| Self-Employed (Incorporated) | 12 | 3.5% |
| Self-Employed (Not Incorporated) | 2 | 0.6% |
| Not-for-profit Organizations | 5 | 1.5% |
| Local Government Employees | 33 | 9.6% |
| State Government Employees | 0 | 0.0% |
| Federal Government Employees | 9 | 2.6% |
| Unpaid Family Workers | 0 | 0.0% |
| Total | 345 | 100.0% |
Employment Status by Age in Big Stone City
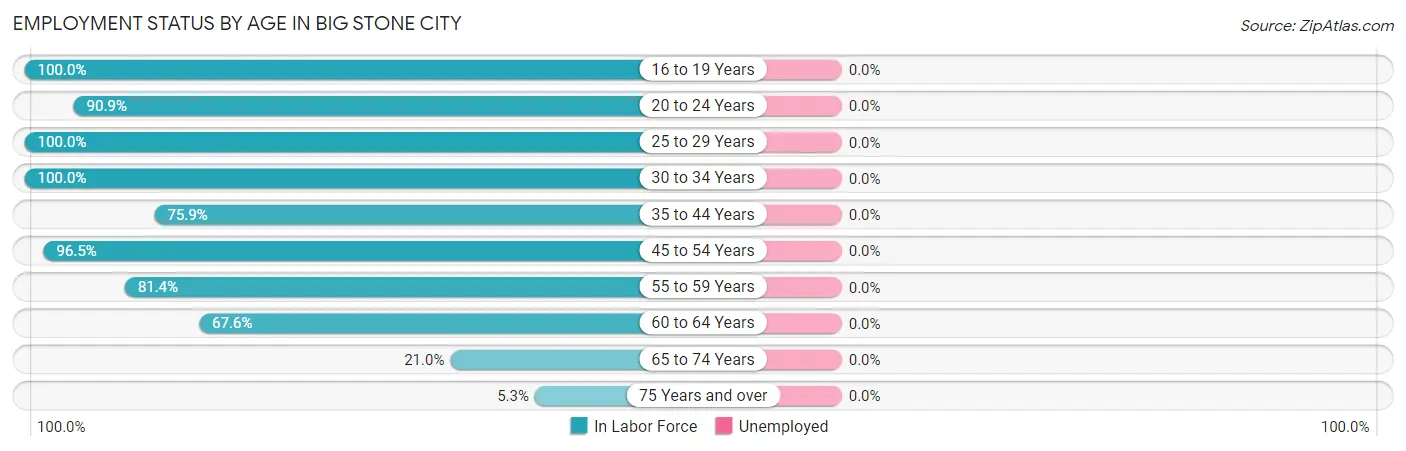
| Age Bracket | In Labor Force | Unemployed |
| 16 to 19 Years | 18 (100.0%) | 0 (0.0%) |
| 20 to 24 Years | 60 (90.9%) | 0 (0.0%) |
| 25 to 29 Years | 13 (100.0%) | 0 (0.0%) |
| 30 to 34 Years | 20 (100.0%) | 0 (0.0%) |
| 35 to 44 Years | 60 (75.9%) | 0 (0.0%) |
| 45 to 54 Years | 83 (96.5%) | 0 (0.0%) |
| 55 to 59 Years | 35 (81.4%) | 0 (0.0%) |
| 60 to 64 Years | 25 (67.6%) | 0 (0.0%) |
| 65 to 74 Years | 25 (21.0%) | 0 (0.0%) |
| 75 Years and over | 10 (5.3%) | 0 (0.0%) |
| Total | 349 (52.2%) | 0 (0.0%) |
Employment Status by Educational Attainment in Big Stone City
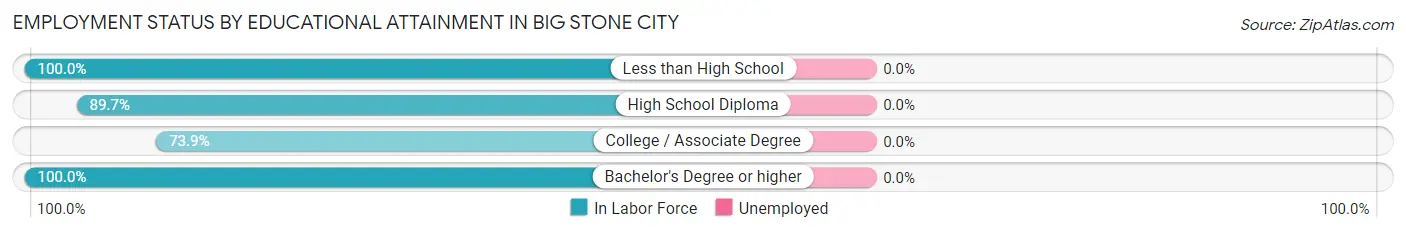
| Educational Attainment | In Labor Force | Unemployed |
| Less than High School | 21 (100.0%) | 0 (0.0%) |
| High School Diploma | 105 (89.7%) | 0 (0.0%) |
| College / Associate Degree | 85 (73.9%) | 0 (0.0%) |
| Bachelor's Degree or higher | 25 (100.0%) | 0 (0.0%) |
| Total | 236 (84.9%) | 0 (0.0%) |
Employment Occupations by Sex in Big Stone City
Management, Business, Science and Arts Occupations
The most common Management, Business, Science and Arts occupations in Big Stone City are Management (18 | 5.2%), Computers, Engineering & Science (9 | 2.6%), Health Diagnosing & Treating (9 | 2.6%), Architecture & Engineering (6 | 1.7%), and Business & Financial (4 | 1.1%).

Management, Business, Science and Arts Occupations by Sex
Within the Management, Business, Science and Arts occupations in Big Stone City, the most male-oriented occupations are Computers, Engineering & Science (100.0%), Computers & Mathematics (100.0%), and Architecture & Engineering (100.0%), while the most female-oriented occupations are Business & Financial (100.0%), Education Instruction & Library (100.0%), and Management (94.4%).
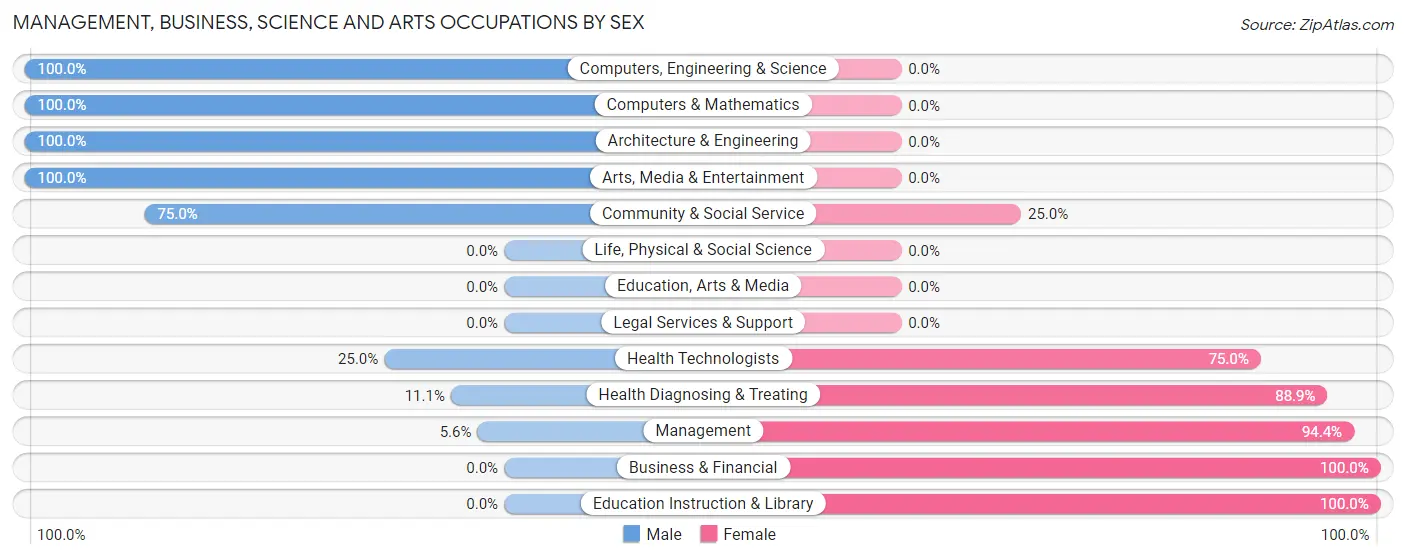
| Occupation | Male | Female |
| Management | 1 (5.6%) | 17 (94.4%) |
| Business & Financial | 0 (0.0%) | 4 (100.0%) |
| Computers, Engineering & Science | 9 (100.0%) | 0 (0.0%) |
| Computers & Mathematics | 3 (100.0%) | 0 (0.0%) |
| Architecture & Engineering | 6 (100.0%) | 0 (0.0%) |
| Life, Physical & Social Science | 0 (0.0%) | 0 (0.0%) |
| Community & Social Service | 3 (75.0%) | 1 (25.0%) |
| Education, Arts & Media | 0 (0.0%) | 0 (0.0%) |
| Legal Services & Support | 0 (0.0%) | 0 (0.0%) |
| Education Instruction & Library | 0 (0.0%) | 1 (100.0%) |
| Arts, Media & Entertainment | 3 (100.0%) | 0 (0.0%) |
| Health Diagnosing & Treating | 1 (11.1%) | 8 (88.9%) |
| Health Technologists | 1 (25.0%) | 3 (75.0%) |
| Total (Category) | 14 (31.8%) | 30 (68.2%) |
| Total (Overall) | 229 (65.6%) | 120 (34.4%) |
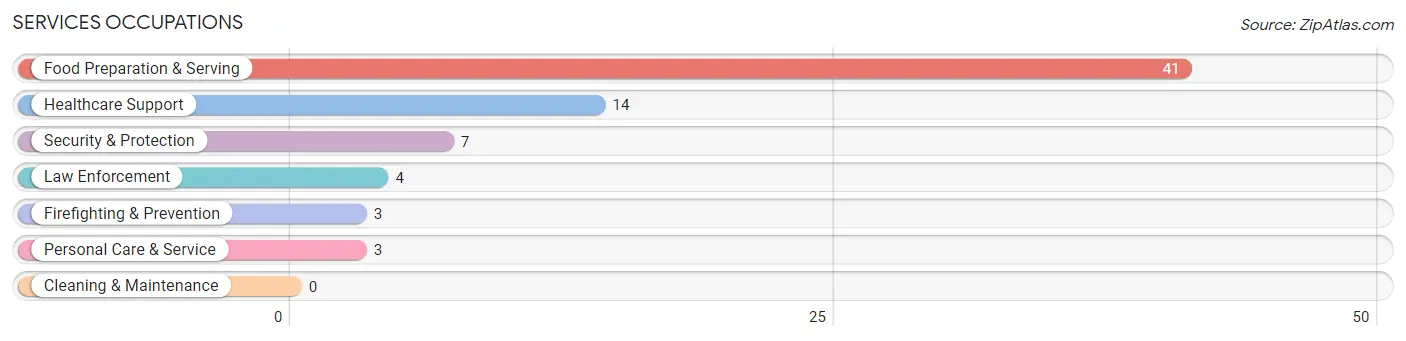
Services Occupations
The most common Services occupations in Big Stone City are Food Preparation & Serving (41 | 11.7%), Healthcare Support (14 | 4.0%), Security & Protection (7 | 2.0%), Law Enforcement (4 | 1.1%), and Firefighting & Prevention (3 | 0.9%).
Services Occupations by Sex
Within the Services occupations in Big Stone City, the most male-oriented occupations are Security & Protection (100.0%), Firefighting & Prevention (100.0%), and Law Enforcement (100.0%), while the most female-oriented occupations are Personal Care & Service (100.0%), Healthcare Support (85.7%), and Food Preparation & Serving (7.3%).
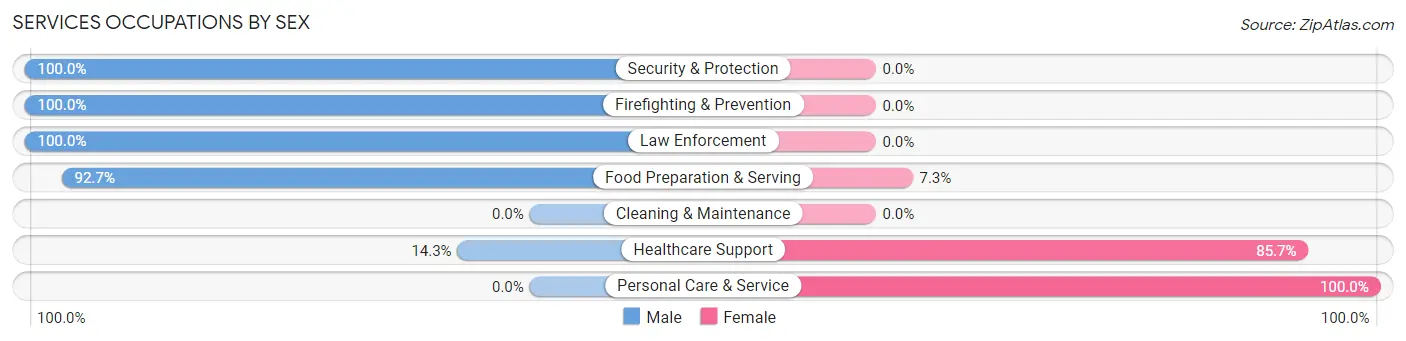
| Occupation | Male | Female |
| Healthcare Support | 2 (14.3%) | 12 (85.7%) |
| Security & Protection | 7 (100.0%) | 0 (0.0%) |
| Firefighting & Prevention | 3 (100.0%) | 0 (0.0%) |
| Law Enforcement | 4 (100.0%) | 0 (0.0%) |
| Food Preparation & Serving | 38 (92.7%) | 3 (7.3%) |
| Cleaning & Maintenance | 0 (0.0%) | 0 (0.0%) |
| Personal Care & Service | 0 (0.0%) | 3 (100.0%) |
| Total (Category) | 47 (72.3%) | 18 (27.7%) |
| Total (Overall) | 229 (65.6%) | 120 (34.4%) |
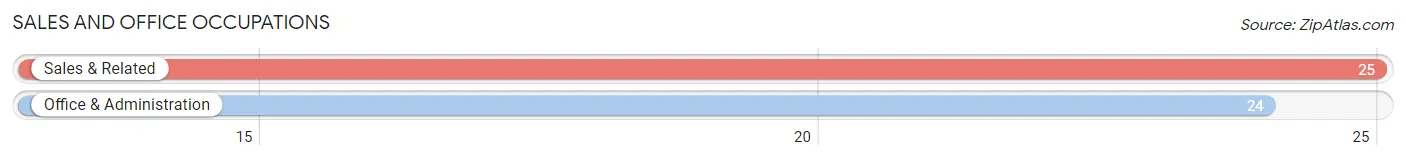
Sales and Office Occupations
The most common Sales and Office occupations in Big Stone City are Sales & Related (25 | 7.2%), and Office & Administration (24 | 6.9%).
Sales and Office Occupations by Sex
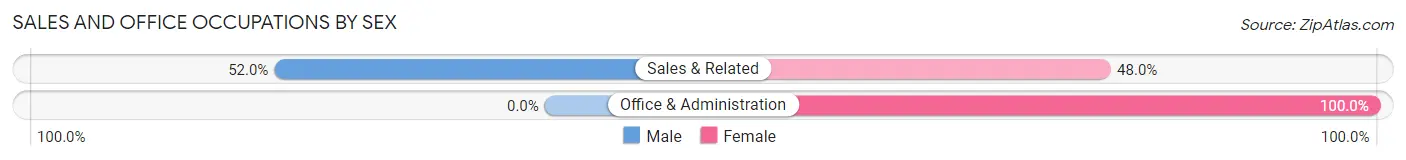
| Occupation | Male | Female |
| Sales & Related | 13 (52.0%) | 12 (48.0%) |
| Office & Administration | 0 (0.0%) | 24 (100.0%) |
| Total (Category) | 13 (26.5%) | 36 (73.5%) |
| Total (Overall) | 229 (65.6%) | 120 (34.4%) |
Natural Resources, Construction and Maintenance Occupations
The most common Natural Resources, Construction and Maintenance occupations in Big Stone City are Installation, Maintenance & Repair (41 | 11.7%), and Construction & Extraction (34 | 9.7%).
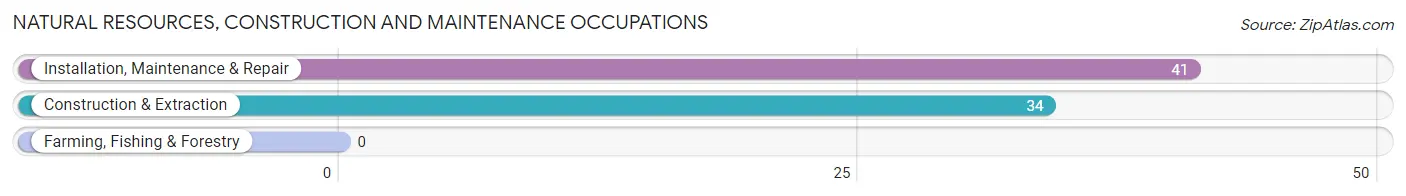
Natural Resources, Construction and Maintenance Occupations by Sex
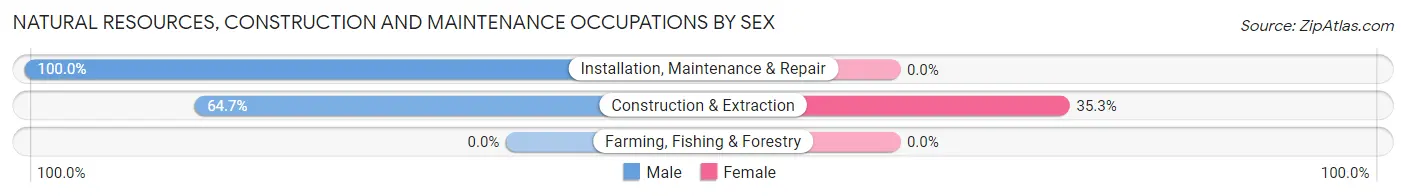
| Occupation | Male | Female |
| Farming, Fishing & Forestry | 0 (0.0%) | 0 (0.0%) |
| Construction & Extraction | 22 (64.7%) | 12 (35.3%) |
| Installation, Maintenance & Repair | 41 (100.0%) | 0 (0.0%) |
| Total (Category) | 63 (84.0%) | 12 (16.0%) |
| Total (Overall) | 229 (65.6%) | 120 (34.4%) |
Production, Transportation and Moving Occupations
The most common Production, Transportation and Moving occupations in Big Stone City are Material Moving (48 | 13.8%), Production (38 | 10.9%), and Transportation (30 | 8.6%).
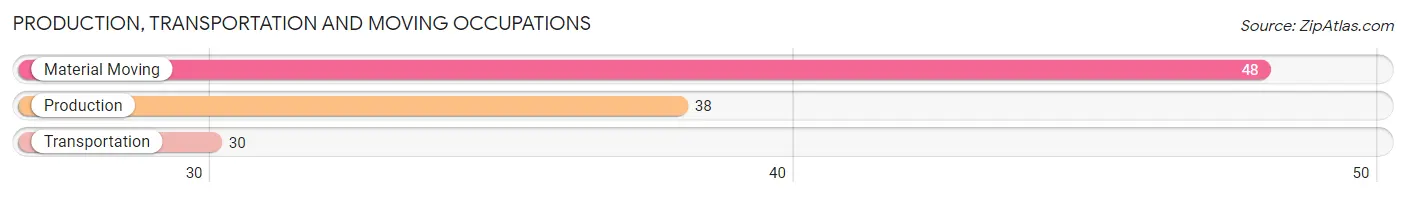
Production, Transportation and Moving Occupations by Sex
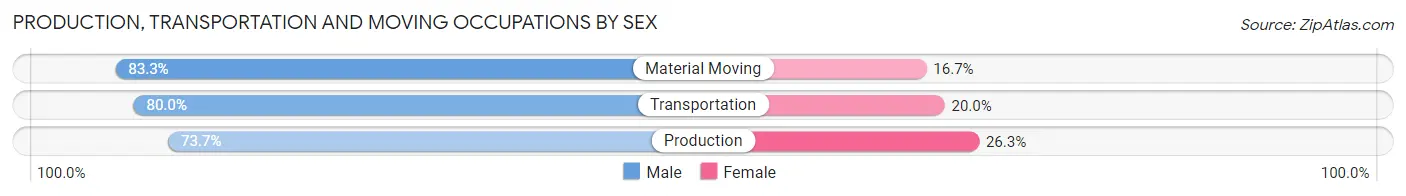
| Occupation | Male | Female |
| Production | 28 (73.7%) | 10 (26.3%) |
| Transportation | 24 (80.0%) | 6 (20.0%) |
| Material Moving | 40 (83.3%) | 8 (16.7%) |
| Total (Category) | 92 (79.3%) | 24 (20.7%) |
| Total (Overall) | 229 (65.6%) | 120 (34.4%) |
Employment Industries by Sex in Big Stone City
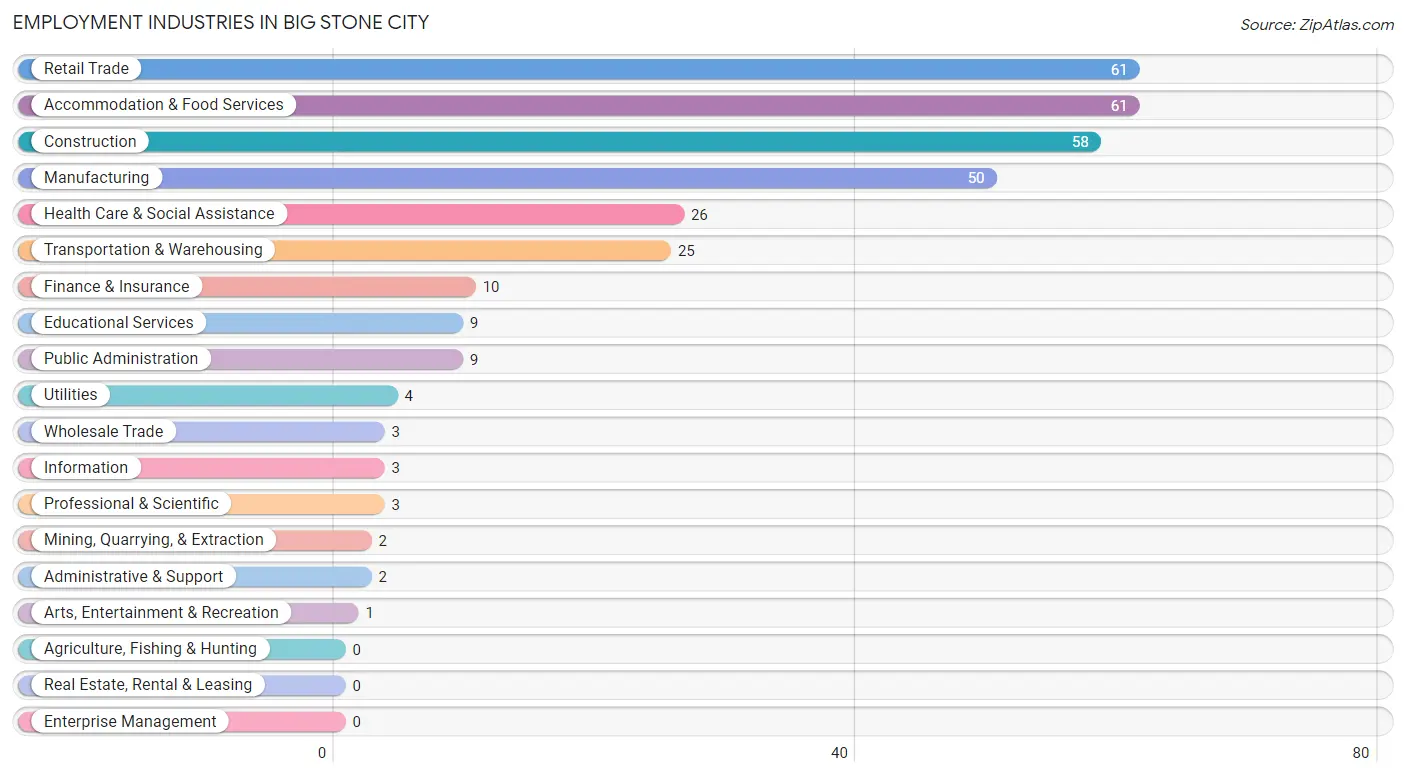
Employment Industries in Big Stone City
The major employment industries in Big Stone City include Retail Trade (61 | 17.5%), Accommodation & Food Services (61 | 17.5%), Construction (58 | 16.6%), Manufacturing (50 | 14.3%), and Health Care & Social Assistance (26 | 7.4%).
Employment Industries by Sex in Big Stone City
The Big Stone City industries that see more men than women are Wholesale Trade (100.0%), Utilities (100.0%), and Information (100.0%), whereas the industries that tend to have a higher number of women are Mining, Quarrying, & Extraction (100.0%), Administrative & Support (100.0%), and Arts, Entertainment & Recreation (100.0%).
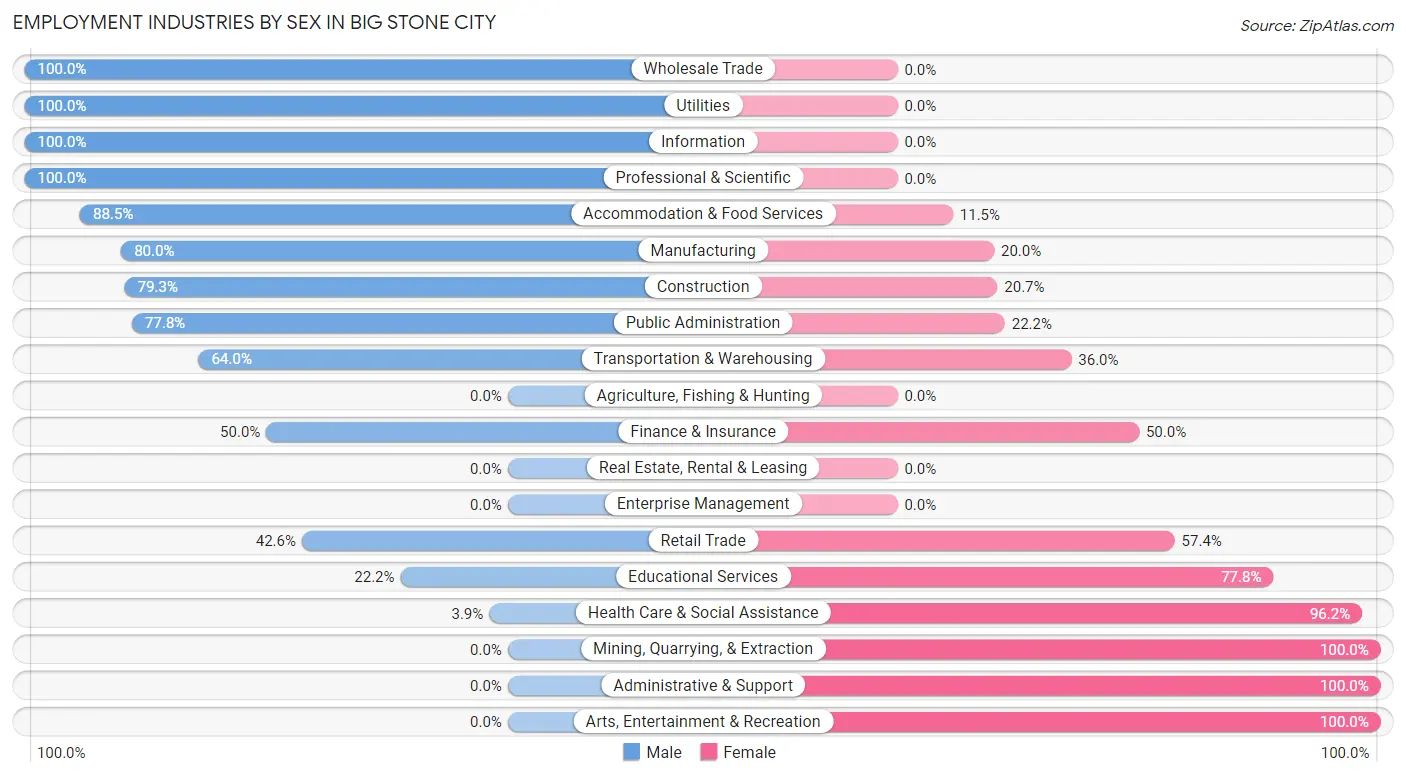
| Industry | Male | Female |
| Agriculture, Fishing & Hunting | 0 (0.0%) | 0 (0.0%) |
| Mining, Quarrying, & Extraction | 0 (0.0%) | 2 (100.0%) |
| Construction | 46 (79.3%) | 12 (20.7%) |
| Manufacturing | 40 (80.0%) | 10 (20.0%) |
| Wholesale Trade | 3 (100.0%) | 0 (0.0%) |
| Retail Trade | 26 (42.6%) | 35 (57.4%) |
| Transportation & Warehousing | 16 (64.0%) | 9 (36.0%) |
| Utilities | 4 (100.0%) | 0 (0.0%) |
| Information | 3 (100.0%) | 0 (0.0%) |
| Finance & Insurance | 5 (50.0%) | 5 (50.0%) |
| Real Estate, Rental & Leasing | 0 (0.0%) | 0 (0.0%) |
| Professional & Scientific | 3 (100.0%) | 0 (0.0%) |
| Enterprise Management | 0 (0.0%) | 0 (0.0%) |
| Administrative & Support | 0 (0.0%) | 2 (100.0%) |
| Educational Services | 2 (22.2%) | 7 (77.8%) |
| Health Care & Social Assistance | 1 (3.8%) | 25 (96.2%) |
| Arts, Entertainment & Recreation | 0 (0.0%) | 1 (100.0%) |
| Accommodation & Food Services | 54 (88.5%) | 7 (11.5%) |
| Public Administration | 7 (77.8%) | 2 (22.2%) |
| Total | 229 (65.6%) | 120 (34.4%) |
Education in Big Stone City
School Enrollment in Big Stone City
The most common levels of schooling among the 73 students in Big Stone City are elementary school (33 | 45.2%), high school (18 | 24.7%), and middle school (10 | 13.7%).
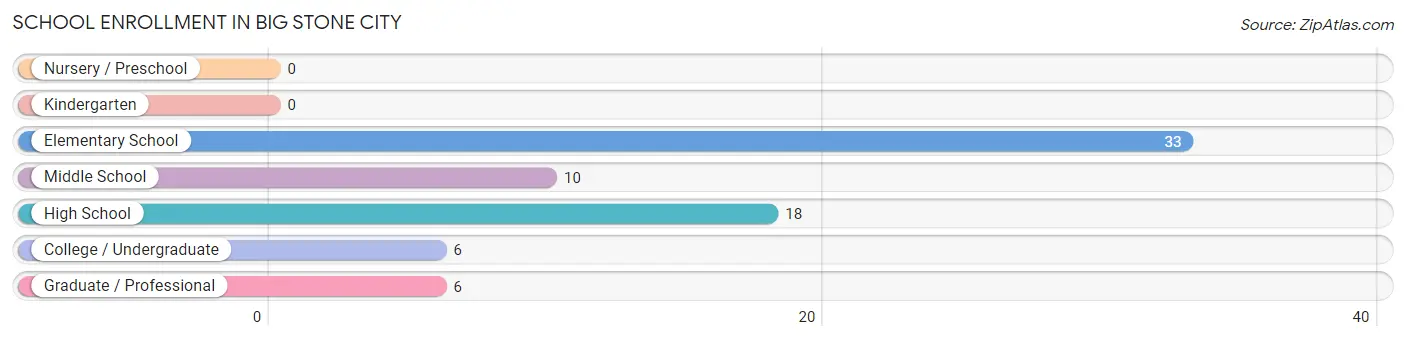
| School Level | # Students | % Students |
| Nursery / Preschool | 0 | 0.0% |
| Kindergarten | 0 | 0.0% |
| Elementary School | 33 | 45.2% |
| Middle School | 10 | 13.7% |
| High School | 18 | 24.7% |
| College / Undergraduate | 6 | 8.2% |
| Graduate / Professional | 6 | 8.2% |
| Total | 73 | 100.0% |
School Enrollment by Age by Funding Source in Big Stone City
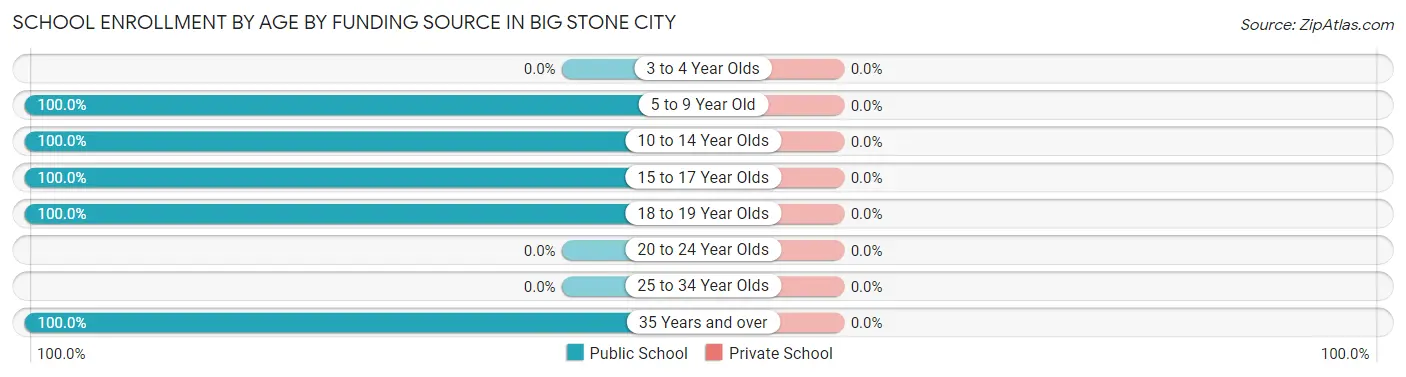
| Age Bracket | Public School | Private School |
| 3 to 4 Year Olds | 0 (0.0%) | 0 (0.0%) |
| 5 to 9 Year Old | 19 (100.0%) | 0 (0.0%) |
| 10 to 14 Year Olds | 24 (100.0%) | 0 (0.0%) |
| 15 to 17 Year Olds | 13 (100.0%) | 0 (0.0%) |
| 18 to 19 Year Olds | 5 (100.0%) | 0 (0.0%) |
| 20 to 24 Year Olds | 0 (0.0%) | 0 (0.0%) |
| 25 to 34 Year Olds | 0 (0.0%) | 0 (0.0%) |
| 35 Years and over | 12 (100.0%) | 0 (0.0%) |
| Total | 73 (100.0%) | 0 (0.0%) |
Educational Attainment by Field of Study in Big Stone City
Education (20 | 36.4%), social sciences (10 | 18.2%), business (8 | 14.5%), bio, nature & agricultural (4 | 7.3%), and physical & health sciences (4 | 7.3%) are the most common fields of study among 55 individuals in Big Stone City who have obtained a bachelor's degree or higher.
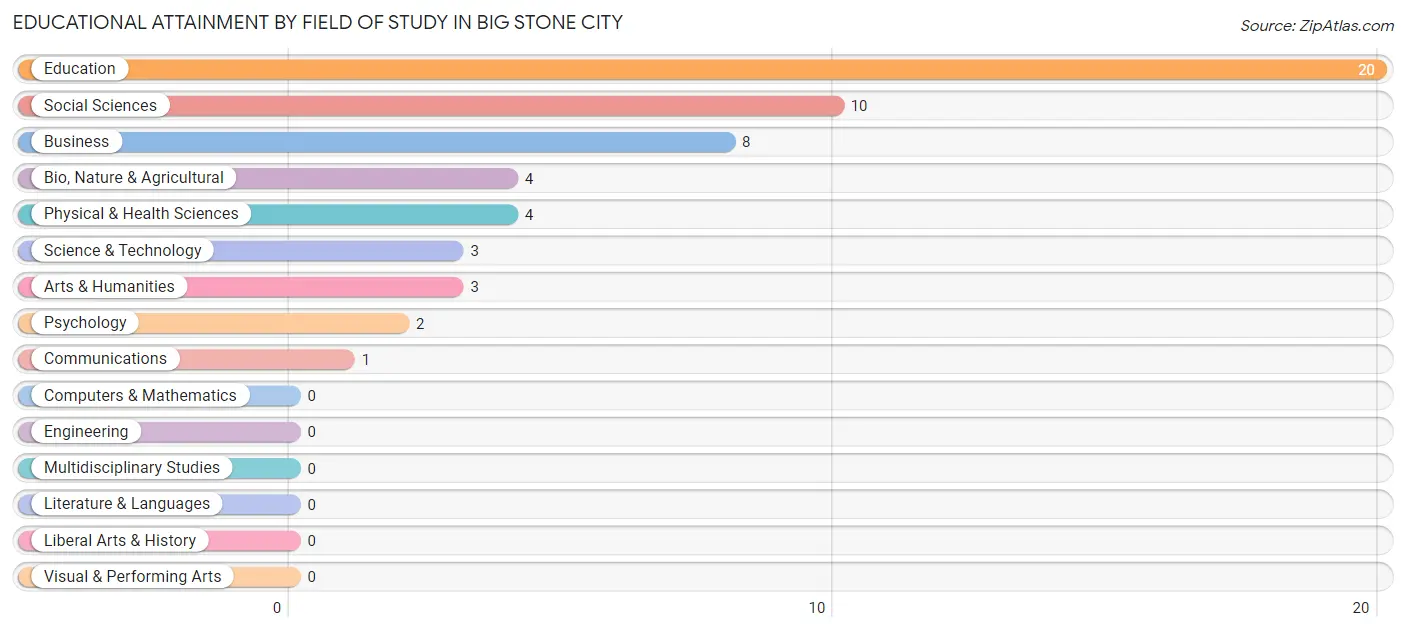
| Field of Study | # Graduates | % Graduates |
| Computers & Mathematics | 0 | 0.0% |
| Bio, Nature & Agricultural | 4 | 7.3% |
| Physical & Health Sciences | 4 | 7.3% |
| Psychology | 2 | 3.6% |
| Social Sciences | 10 | 18.2% |
| Engineering | 0 | 0.0% |
| Multidisciplinary Studies | 0 | 0.0% |
| Science & Technology | 3 | 5.4% |
| Business | 8 | 14.5% |
| Education | 20 | 36.4% |
| Literature & Languages | 0 | 0.0% |
| Liberal Arts & History | 0 | 0.0% |
| Visual & Performing Arts | 0 | 0.0% |
| Communications | 1 | 1.8% |
| Arts & Humanities | 3 | 5.4% |
| Total | 55 | 100.0% |
Transportation & Commute in Big Stone City
Vehicle Availability by Sex in Big Stone City
The most prevalent vehicle ownership categories in Big Stone City are males with 2 vehicles (77, accounting for 34.2%) and females with 2 vehicles (48, making up 64.2%).
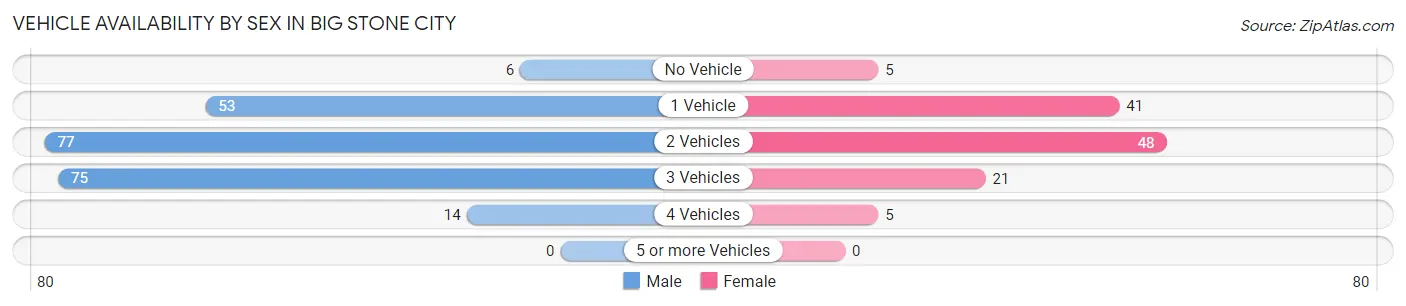
| Vehicles Available | Male | Female |
| No Vehicle | 6 (2.7%) | 5 (4.2%) |
| 1 Vehicle | 53 (23.6%) | 41 (34.2%) |
| 2 Vehicles | 77 (34.2%) | 48 (40.0%) |
| 3 Vehicles | 75 (33.3%) | 21 (17.5%) |
| 4 Vehicles | 14 (6.2%) | 5 (4.2%) |
| 5 or more Vehicles | 0 (0.0%) | 0 (0.0%) |
| Total | 225 (100.0%) | 120 (100.0%) |
Commute Time in Big Stone City
The most frequently occuring commute durations in Big Stone City are 5 to 9 minutes (118 commuters, 34.3%), 15 to 19 minutes (68 commuters, 19.8%), and 10 to 14 minutes (56 commuters, 16.3%).
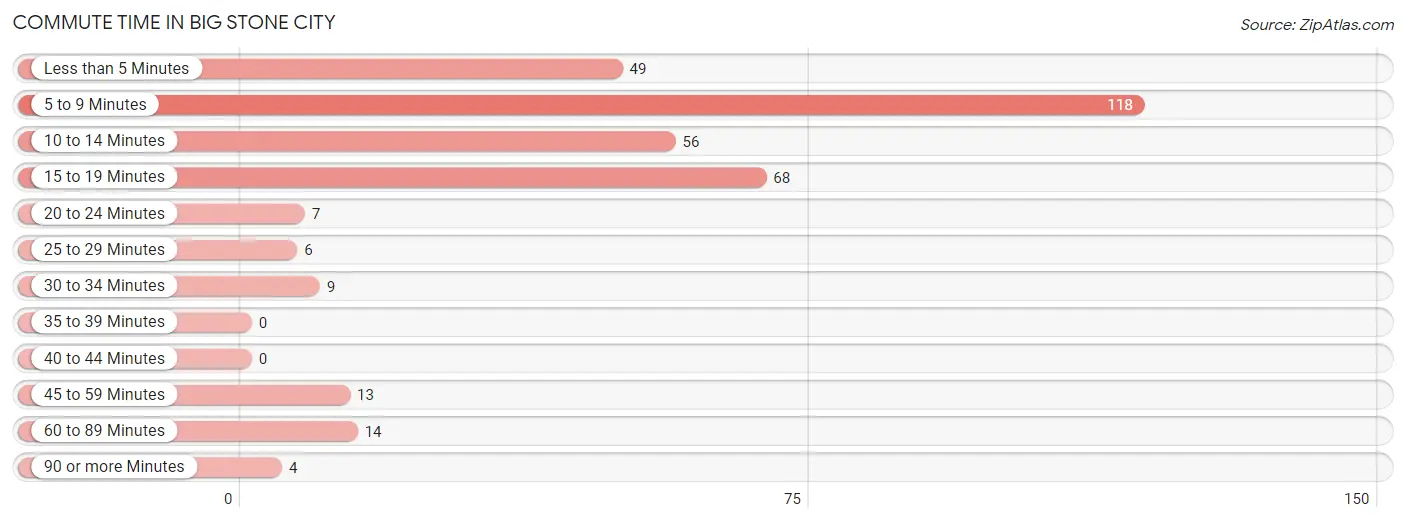
| Commute Time | # Commuters | % Commuters |
| Less than 5 Minutes | 49 | 14.2% |
| 5 to 9 Minutes | 118 | 34.3% |
| 10 to 14 Minutes | 56 | 16.3% |
| 15 to 19 Minutes | 68 | 19.8% |
| 20 to 24 Minutes | 7 | 2.0% |
| 25 to 29 Minutes | 6 | 1.7% |
| 30 to 34 Minutes | 9 | 2.6% |
| 35 to 39 Minutes | 0 | 0.0% |
| 40 to 44 Minutes | 0 | 0.0% |
| 45 to 59 Minutes | 13 | 3.8% |
| 60 to 89 Minutes | 14 | 4.1% |
| 90 or more Minutes | 4 | 1.2% |
Commute Time by Sex in Big Stone City
The most common commute times in Big Stone City are 5 to 9 minutes (77 commuters, 34.2%) for males and 5 to 9 minutes (41 commuters, 34.4%) for females.
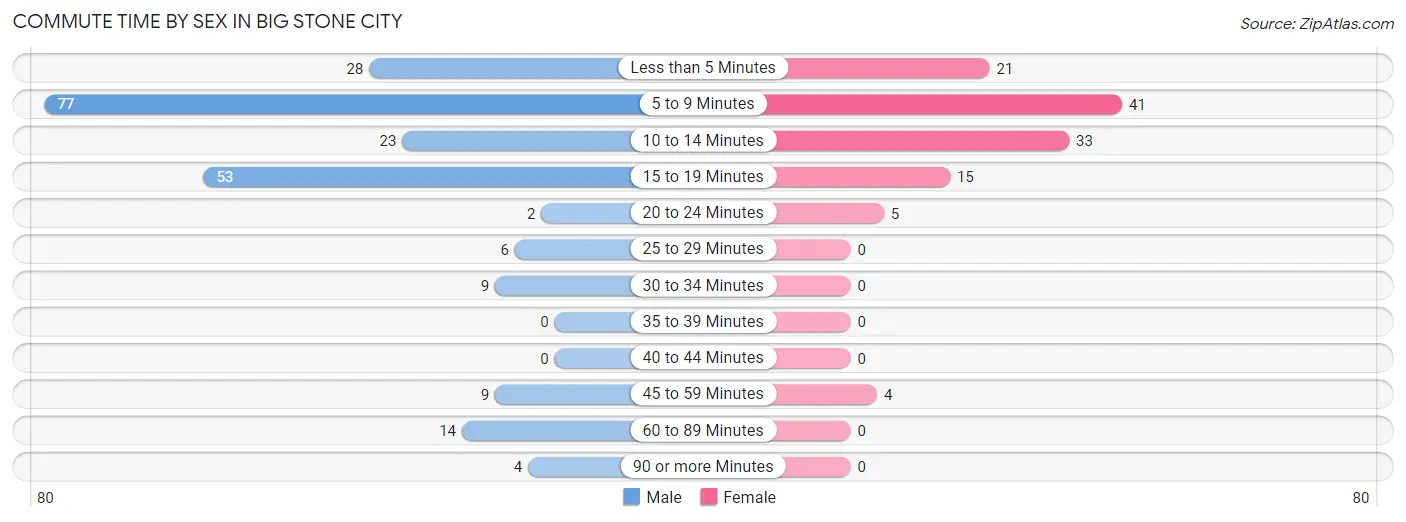
| Commute Time | Male | Female |
| Less than 5 Minutes | 28 (12.4%) | 21 (17.6%) |
| 5 to 9 Minutes | 77 (34.2%) | 41 (34.4%) |
| 10 to 14 Minutes | 23 (10.2%) | 33 (27.7%) |
| 15 to 19 Minutes | 53 (23.6%) | 15 (12.6%) |
| 20 to 24 Minutes | 2 (0.9%) | 5 (4.2%) |
| 25 to 29 Minutes | 6 (2.7%) | 0 (0.0%) |
| 30 to 34 Minutes | 9 (4.0%) | 0 (0.0%) |
| 35 to 39 Minutes | 0 (0.0%) | 0 (0.0%) |
| 40 to 44 Minutes | 0 (0.0%) | 0 (0.0%) |
| 45 to 59 Minutes | 9 (4.0%) | 4 (3.4%) |
| 60 to 89 Minutes | 14 (6.2%) | 0 (0.0%) |
| 90 or more Minutes | 4 (1.8%) | 0 (0.0%) |
Time of Departure to Work by Sex in Big Stone City
The most frequent times of departure to work in Big Stone City are 10:00 AM to 10:59 AM (35, 15.6%) for males and 4:00 PM to 11:59 PM (17, 14.3%) for females.
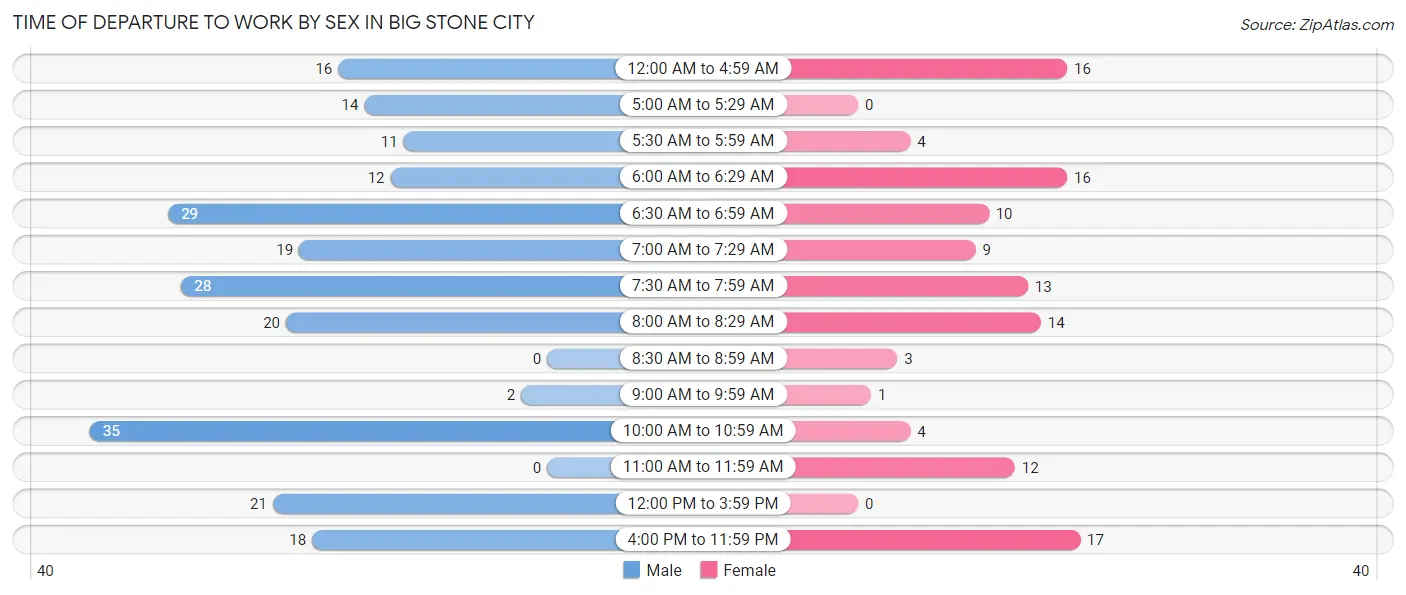
| Time of Departure | Male | Female |
| 12:00 AM to 4:59 AM | 16 (7.1%) | 16 (13.5%) |
| 5:00 AM to 5:29 AM | 14 (6.2%) | 0 (0.0%) |
| 5:30 AM to 5:59 AM | 11 (4.9%) | 4 (3.4%) |
| 6:00 AM to 6:29 AM | 12 (5.3%) | 16 (13.5%) |
| 6:30 AM to 6:59 AM | 29 (12.9%) | 10 (8.4%) |
| 7:00 AM to 7:29 AM | 19 (8.4%) | 9 (7.6%) |
| 7:30 AM to 7:59 AM | 28 (12.4%) | 13 (10.9%) |
| 8:00 AM to 8:29 AM | 20 (8.9%) | 14 (11.8%) |
| 8:30 AM to 8:59 AM | 0 (0.0%) | 3 (2.5%) |
| 9:00 AM to 9:59 AM | 2 (0.9%) | 1 (0.8%) |
| 10:00 AM to 10:59 AM | 35 (15.6%) | 4 (3.4%) |
| 11:00 AM to 11:59 AM | 0 (0.0%) | 12 (10.1%) |
| 12:00 PM to 3:59 PM | 21 (9.3%) | 0 (0.0%) |
| 4:00 PM to 11:59 PM | 18 (8.0%) | 17 (14.3%) |
| Total | 225 (100.0%) | 119 (100.0%) |
Housing Occupancy in Big Stone City
Occupancy by Ownership in Big Stone City
Of the total 366 dwellings in Big Stone City, owner-occupied units account for 271 (74.0%), while renter-occupied units make up 95 (26.0%).
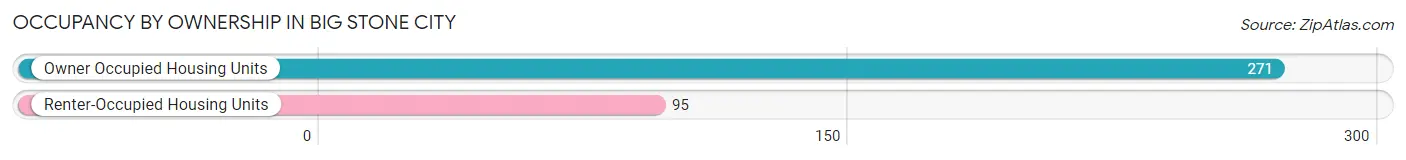
| Occupancy | # Housing Units | % Housing Units |
| Owner Occupied Housing Units | 271 | 74.0% |
| Renter-Occupied Housing Units | 95 | 26.0% |
| Total Occupied Housing Units | 366 | 100.0% |
Occupancy by Household Size in Big Stone City
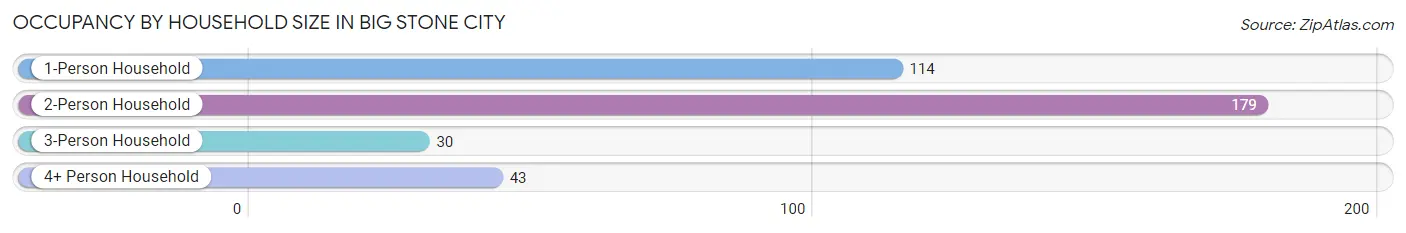
| Household Size | # Housing Units | % Housing Units |
| 1-Person Household | 114 | 31.1% |
| 2-Person Household | 179 | 48.9% |
| 3-Person Household | 30 | 8.2% |
| 4+ Person Household | 43 | 11.7% |
| Total Housing Units | 366 | 100.0% |
Occupancy by Ownership by Household Size in Big Stone City
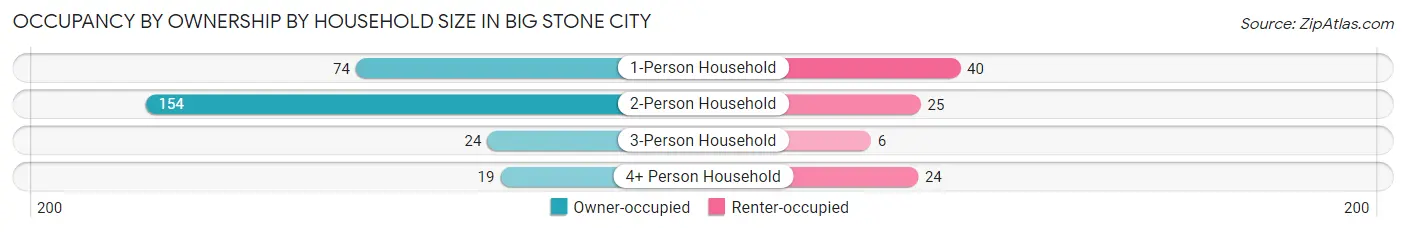
| Household Size | Owner-occupied | Renter-occupied |
| 1-Person Household | 74 (64.9%) | 40 (35.1%) |
| 2-Person Household | 154 (86.0%) | 25 (14.0%) |
| 3-Person Household | 24 (80.0%) | 6 (20.0%) |
| 4+ Person Household | 19 (44.2%) | 24 (55.8%) |
| Total Housing Units | 271 (74.0%) | 95 (26.0%) |
Occupancy by Educational Attainment in Big Stone City
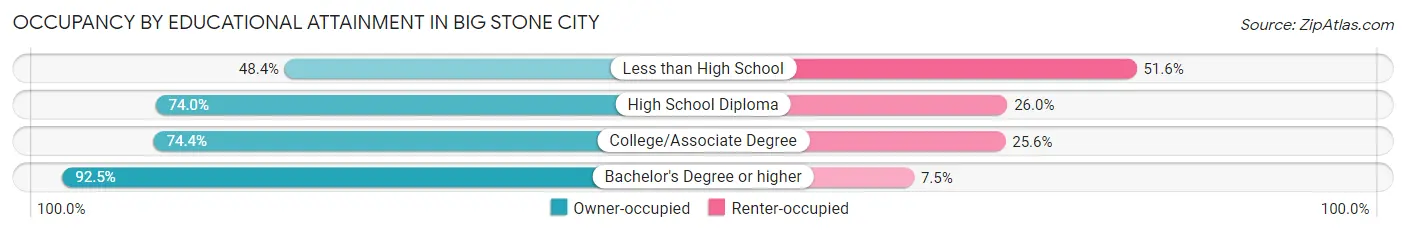
| Household Size | Owner-occupied | Renter-occupied |
| Less than High School | 15 (48.4%) | 16 (51.6%) |
| High School Diploma | 94 (74.0%) | 33 (26.0%) |
| College/Associate Degree | 125 (74.4%) | 43 (25.6%) |
| Bachelor's Degree or higher | 37 (92.5%) | 3 (7.5%) |
Occupancy by Age of Householder in Big Stone City
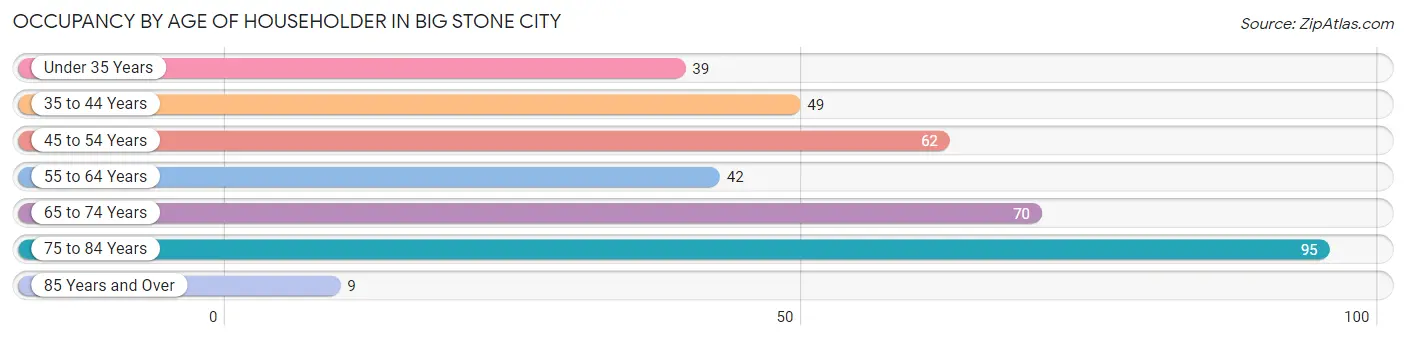
| Age Bracket | # Households | % Households |
| Under 35 Years | 39 | 10.7% |
| 35 to 44 Years | 49 | 13.4% |
| 45 to 54 Years | 62 | 16.9% |
| 55 to 64 Years | 42 | 11.5% |
| 65 to 74 Years | 70 | 19.1% |
| 75 to 84 Years | 95 | 26.0% |
| 85 Years and Over | 9 | 2.5% |
| Total | 366 | 100.0% |
Housing Finances in Big Stone City
Median Income by Occupancy in Big Stone City
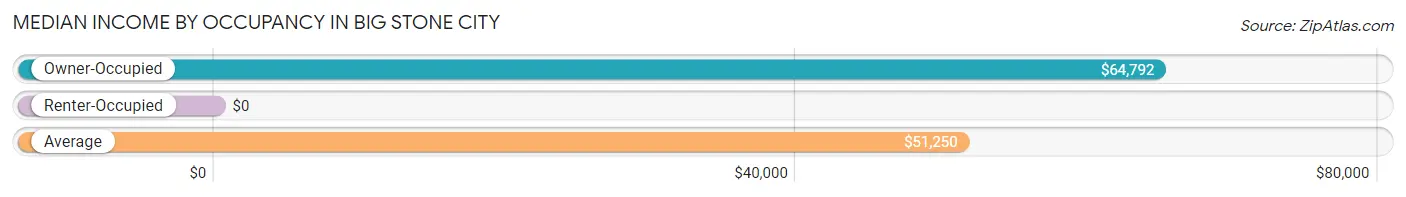
| Occupancy Type | # Households | Median Income |
| Owner-Occupied | 271 (74.0%) | $64,792 |
| Renter-Occupied | 95 (26.0%) | $0 |
| Average | 366 (100.0%) | $51,250 |
Occupancy by Householder Income Bracket in Big Stone City
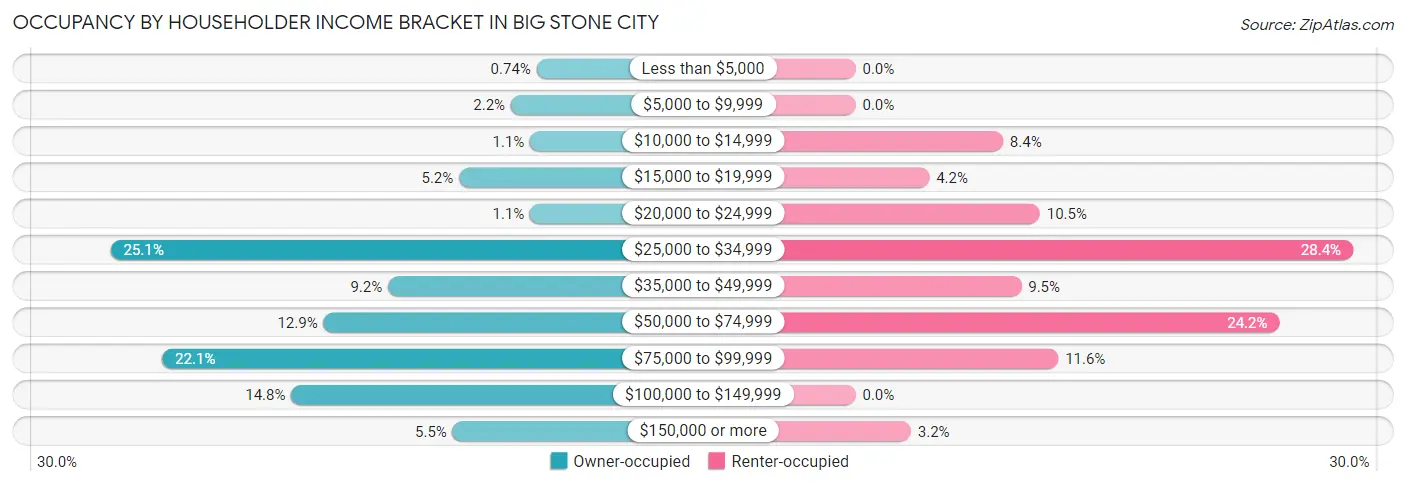
| Income Bracket | Owner-occupied | Renter-occupied |
| Less than $5,000 | 2 (0.7%) | 0 (0.0%) |
| $5,000 to $9,999 | 6 (2.2%) | 0 (0.0%) |
| $10,000 to $14,999 | 3 (1.1%) | 8 (8.4%) |
| $15,000 to $19,999 | 14 (5.2%) | 4 (4.2%) |
| $20,000 to $24,999 | 3 (1.1%) | 10 (10.5%) |
| $25,000 to $34,999 | 68 (25.1%) | 27 (28.4%) |
| $35,000 to $49,999 | 25 (9.2%) | 9 (9.5%) |
| $50,000 to $74,999 | 35 (12.9%) | 23 (24.2%) |
| $75,000 to $99,999 | 60 (22.1%) | 11 (11.6%) |
| $100,000 to $149,999 | 40 (14.8%) | 0 (0.0%) |
| $150,000 or more | 15 (5.5%) | 3 (3.2%) |
| Total | 271 (100.0%) | 95 (100.0%) |
Monthly Housing Cost Tiers in Big Stone City
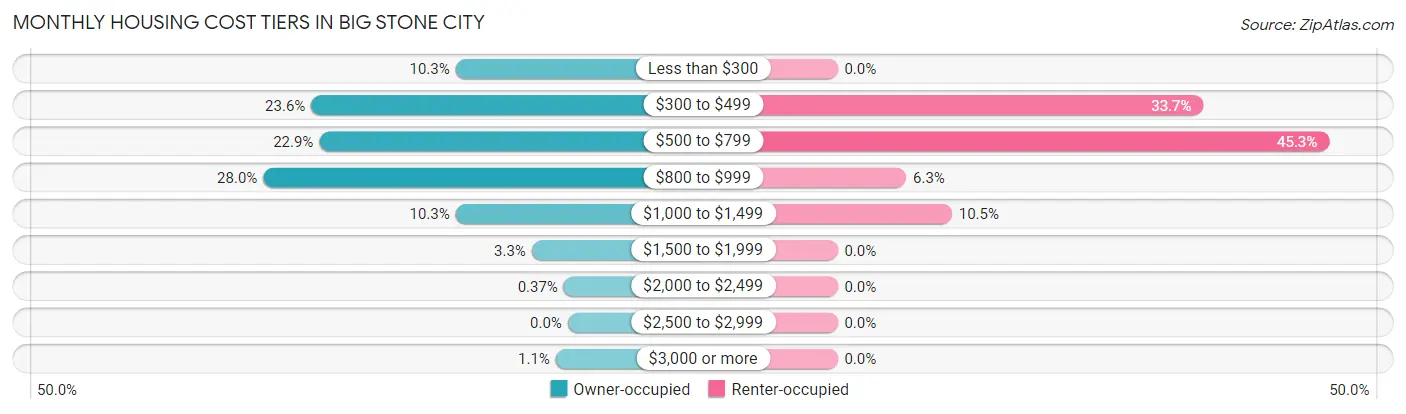
| Monthly Cost | Owner-occupied | Renter-occupied |
| Less than $300 | 28 (10.3%) | 0 (0.0%) |
| $300 to $499 | 64 (23.6%) | 32 (33.7%) |
| $500 to $799 | 62 (22.9%) | 43 (45.3%) |
| $800 to $999 | 76 (28.0%) | 6 (6.3%) |
| $1,000 to $1,499 | 28 (10.3%) | 10 (10.5%) |
| $1,500 to $1,999 | 9 (3.3%) | 0 (0.0%) |
| $2,000 to $2,499 | 1 (0.4%) | 0 (0.0%) |
| $2,500 to $2,999 | 0 (0.0%) | 0 (0.0%) |
| $3,000 or more | 3 (1.1%) | 0 (0.0%) |
| Total | 271 (100.0%) | 95 (100.0%) |
Physical Housing Characteristics in Big Stone City
Housing Structures in Big Stone City
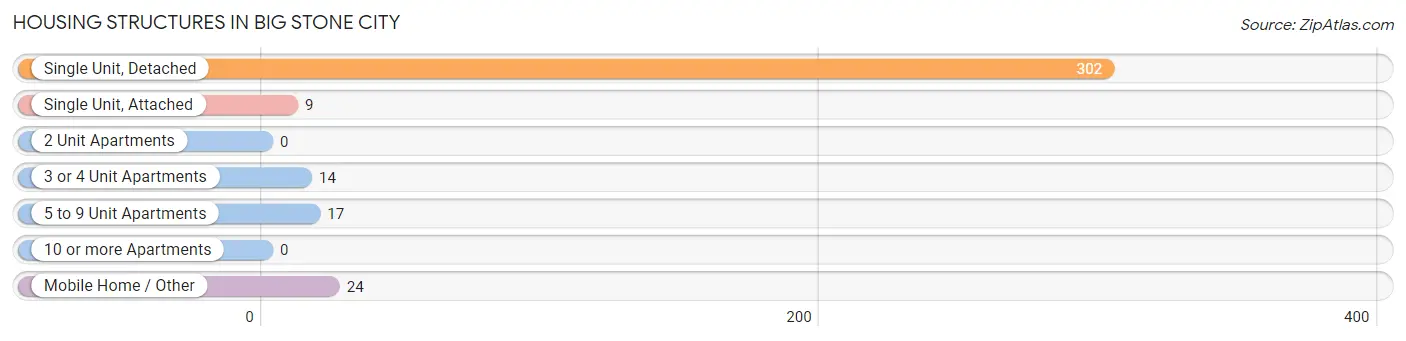
| Structure Type | # Housing Units | % Housing Units |
| Single Unit, Detached | 302 | 82.5% |
| Single Unit, Attached | 9 | 2.5% |
| 2 Unit Apartments | 0 | 0.0% |
| 3 or 4 Unit Apartments | 14 | 3.8% |
| 5 to 9 Unit Apartments | 17 | 4.6% |
| 10 or more Apartments | 0 | 0.0% |
| Mobile Home / Other | 24 | 6.6% |
| Total | 366 | 100.0% |
Housing Structures by Occupancy in Big Stone City
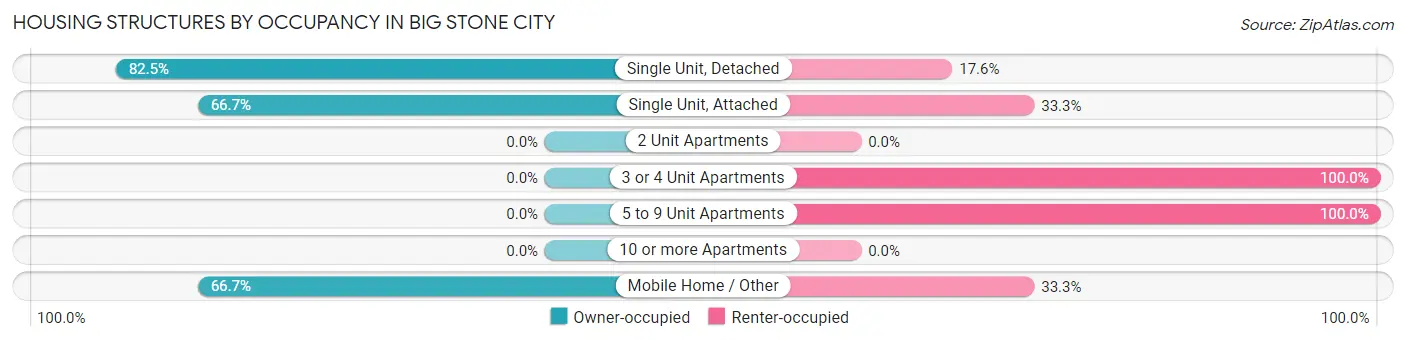
| Structure Type | Owner-occupied | Renter-occupied |
| Single Unit, Detached | 249 (82.5%) | 53 (17.5%) |
| Single Unit, Attached | 6 (66.7%) | 3 (33.3%) |
| 2 Unit Apartments | 0 (0.0%) | 0 (0.0%) |
| 3 or 4 Unit Apartments | 0 (0.0%) | 14 (100.0%) |
| 5 to 9 Unit Apartments | 0 (0.0%) | 17 (100.0%) |
| 10 or more Apartments | 0 (0.0%) | 0 (0.0%) |
| Mobile Home / Other | 16 (66.7%) | 8 (33.3%) |
| Total | 271 (74.0%) | 95 (26.0%) |
Housing Structures by Number of Rooms in Big Stone City
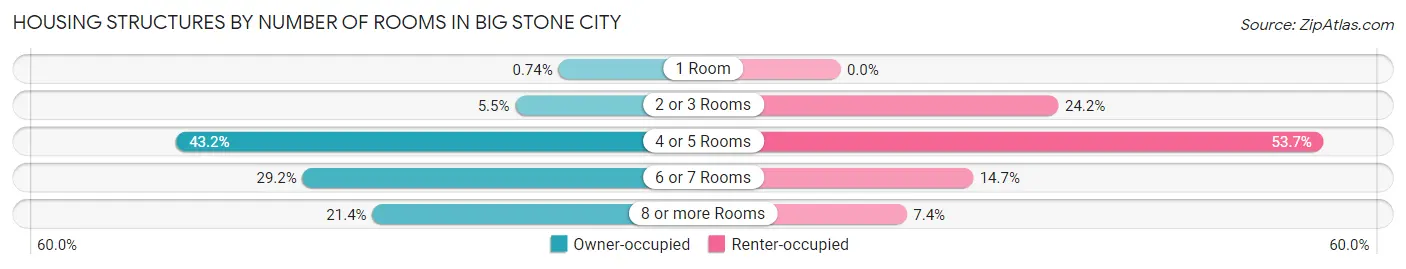
| Number of Rooms | Owner-occupied | Renter-occupied |
| 1 Room | 2 (0.7%) | 0 (0.0%) |
| 2 or 3 Rooms | 15 (5.5%) | 23 (24.2%) |
| 4 or 5 Rooms | 117 (43.2%) | 51 (53.7%) |
| 6 or 7 Rooms | 79 (29.1%) | 14 (14.7%) |
| 8 or more Rooms | 58 (21.4%) | 7 (7.4%) |
| Total | 271 (100.0%) | 95 (100.0%) |
Housing Structure by Heating Type in Big Stone City
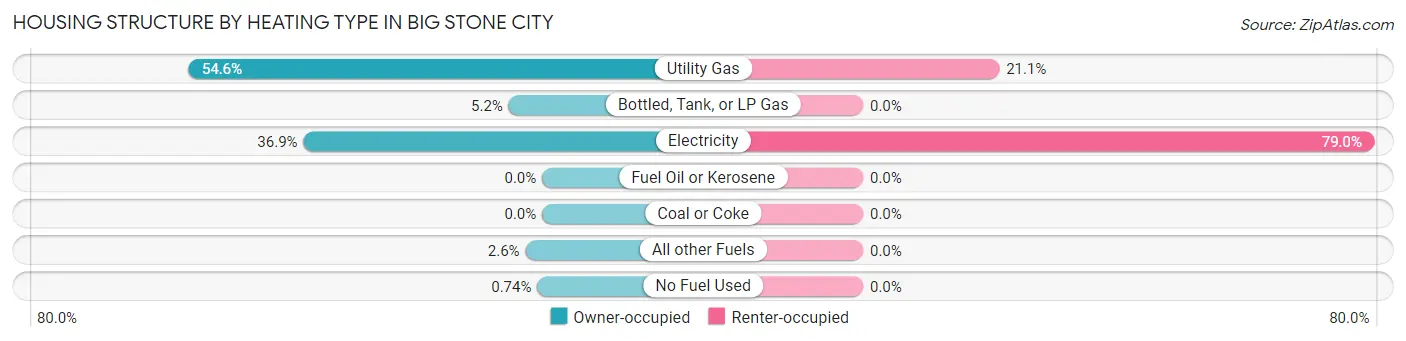
| Heating Type | Owner-occupied | Renter-occupied |
| Utility Gas | 148 (54.6%) | 20 (21.0%) |
| Bottled, Tank, or LP Gas | 14 (5.2%) | 0 (0.0%) |
| Electricity | 100 (36.9%) | 75 (78.9%) |
| Fuel Oil or Kerosene | 0 (0.0%) | 0 (0.0%) |
| Coal or Coke | 0 (0.0%) | 0 (0.0%) |
| All other Fuels | 7 (2.6%) | 0 (0.0%) |
| No Fuel Used | 2 (0.7%) | 0 (0.0%) |
| Total | 271 (100.0%) | 95 (100.0%) |
Household Vehicle Usage in Big Stone City
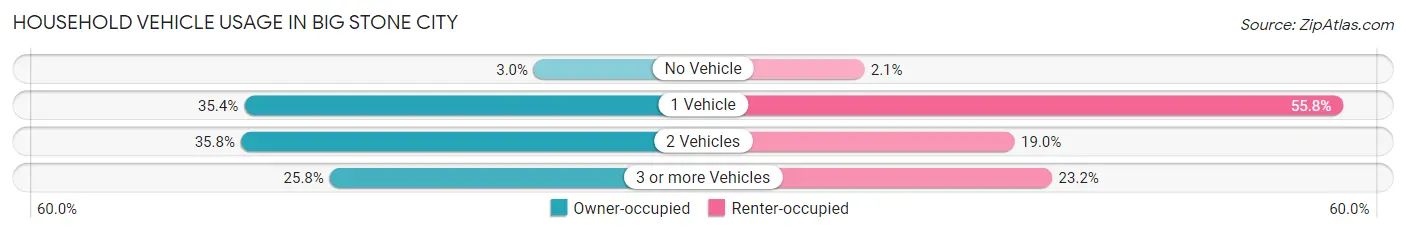
| Vehicles per Household | Owner-occupied | Renter-occupied |
| No Vehicle | 8 (2.9%) | 2 (2.1%) |
| 1 Vehicle | 96 (35.4%) | 53 (55.8%) |
| 2 Vehicles | 97 (35.8%) | 18 (19.0%) |
| 3 or more Vehicles | 70 (25.8%) | 22 (23.2%) |
| Total | 271 (100.0%) | 95 (100.0%) |
Real Estate & Mortgages in Big Stone City
Real Estate and Mortgage Overview in Big Stone City
| Characteristic | Without Mortgage | With Mortgage |
| Housing Units | 173 | 98 |
| Median Property Value | $121,300 | $85,000 |
| Median Household Income | $39,219 | $3 |
| Monthly Housing Costs | $488 | $3 |
| Real Estate Taxes | $1,417 | $0 |
Property Value by Mortgage Status in Big Stone City
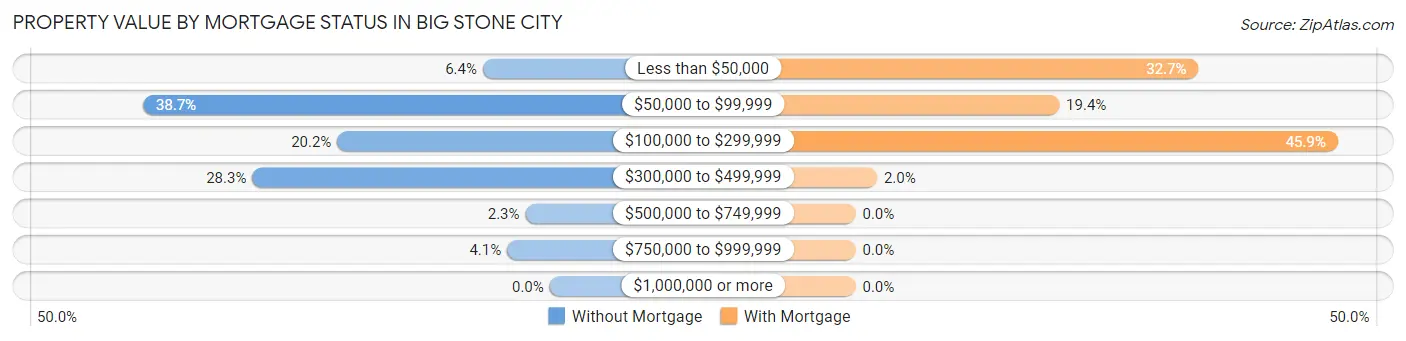
| Property Value | Without Mortgage | With Mortgage |
| Less than $50,000 | 11 (6.4%) | 32 (32.7%) |
| $50,000 to $99,999 | 67 (38.7%) | 19 (19.4%) |
| $100,000 to $299,999 | 35 (20.2%) | 45 (45.9%) |
| $300,000 to $499,999 | 49 (28.3%) | 2 (2.0%) |
| $500,000 to $749,999 | 4 (2.3%) | 0 (0.0%) |
| $750,000 to $999,999 | 7 (4.1%) | 0 (0.0%) |
| $1,000,000 or more | 0 (0.0%) | 0 (0.0%) |
| Total | 173 (100.0%) | 98 (100.0%) |
Household Income by Mortgage Status in Big Stone City
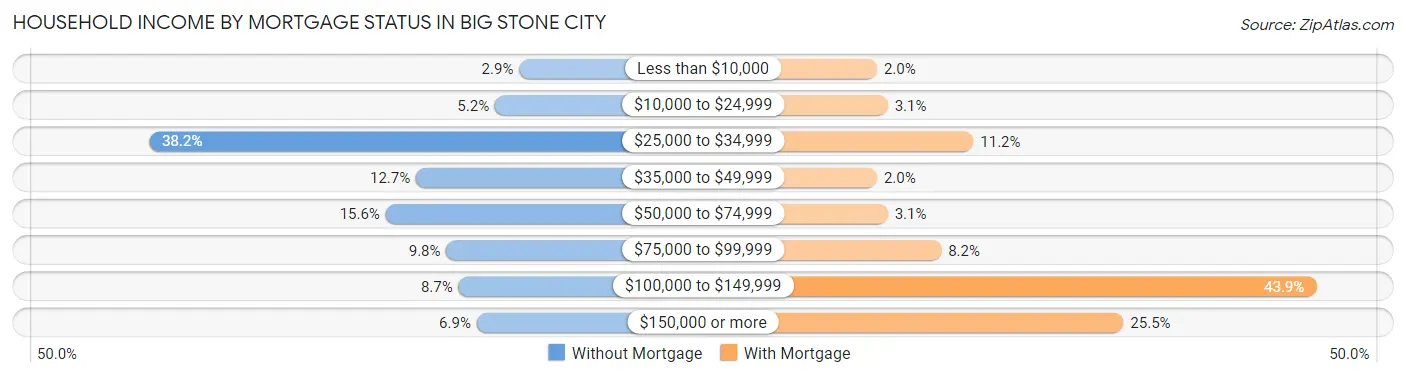
| Household Income | Without Mortgage | With Mortgage |
| Less than $10,000 | 5 (2.9%) | 2 (2.0%) |
| $10,000 to $24,999 | 9 (5.2%) | 3 (3.1%) |
| $25,000 to $34,999 | 66 (38.2%) | 11 (11.2%) |
| $35,000 to $49,999 | 22 (12.7%) | 2 (2.0%) |
| $50,000 to $74,999 | 27 (15.6%) | 3 (3.1%) |
| $75,000 to $99,999 | 17 (9.8%) | 8 (8.2%) |
| $100,000 to $149,999 | 15 (8.7%) | 43 (43.9%) |
| $150,000 or more | 12 (6.9%) | 25 (25.5%) |
| Total | 173 (100.0%) | 98 (100.0%) |
Property Value to Household Income Ratio in Big Stone City
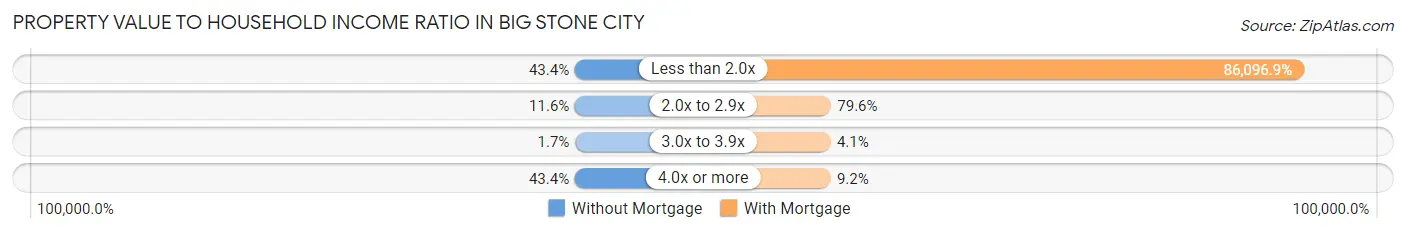
| Value-to-Income Ratio | Without Mortgage | With Mortgage |
| Less than 2.0x | 75 (43.3%) | 84,375 (86,096.9%) |
| 2.0x to 2.9x | 20 (11.6%) | 78 (79.6%) |
| 3.0x to 3.9x | 3 (1.7%) | 4 (4.1%) |
| 4.0x or more | 75 (43.3%) | 9 (9.2%) |
| Total | 173 (100.0%) | 98 (100.0%) |
Real Estate Taxes by Mortgage Status in Big Stone City
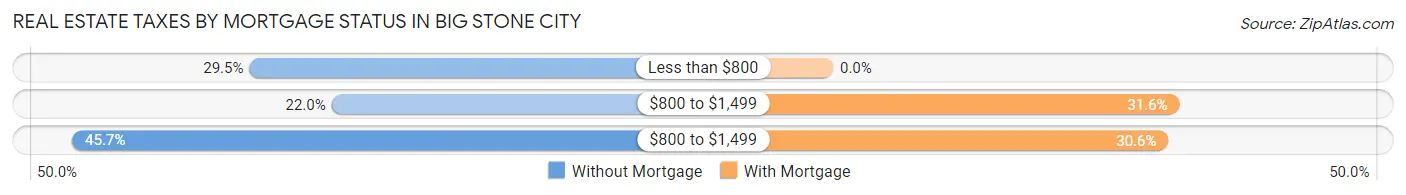
| Property Taxes | Without Mortgage | With Mortgage |
| Less than $800 | 51 (29.5%) | 0 (0.0%) |
| $800 to $1,499 | 38 (22.0%) | 31 (31.6%) |
| $800 to $1,499 | 79 (45.7%) | 30 (30.6%) |
| Total | 173 (100.0%) | 98 (100.0%) |
Health & Disability in Big Stone City
Health Insurance Coverage by Age in Big Stone City
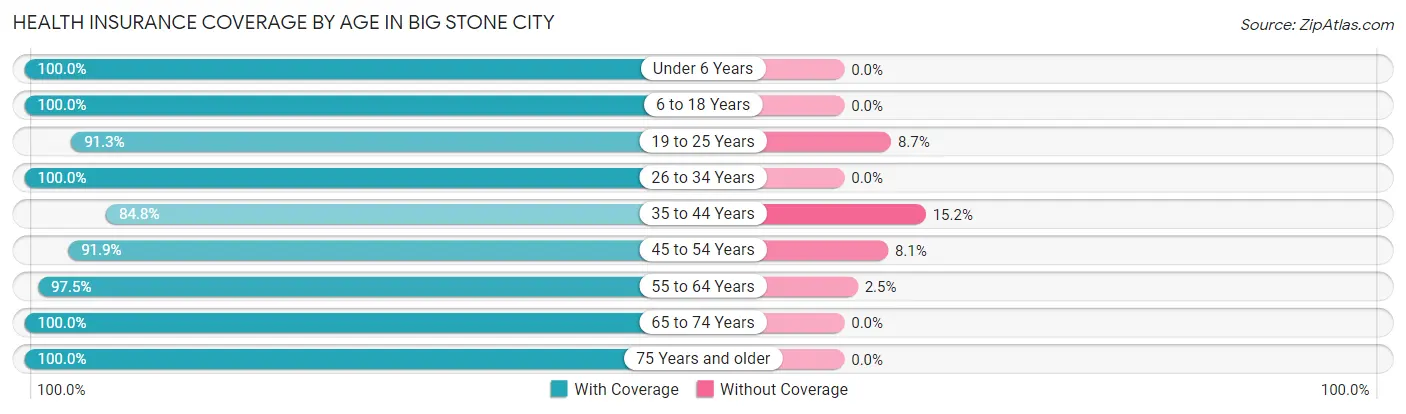
| Age Bracket | With Coverage | Without Coverage |
| Under 6 Years | 31 (100.0%) | 0 (0.0%) |
| 6 to 18 Years | 87 (100.0%) | 0 (0.0%) |
| 19 to 25 Years | 63 (91.3%) | 6 (8.7%) |
| 26 to 34 Years | 30 (100.0%) | 0 (0.0%) |
| 35 to 44 Years | 67 (84.8%) | 12 (15.2%) |
| 45 to 54 Years | 79 (91.9%) | 7 (8.1%) |
| 55 to 64 Years | 78 (97.5%) | 2 (2.5%) |
| 65 to 74 Years | 119 (100.0%) | 0 (0.0%) |
| 75 Years and older | 188 (100.0%) | 0 (0.0%) |
| Total | 742 (96.5%) | 27 (3.5%) |
Health Insurance Coverage by Citizenship Status in Big Stone City
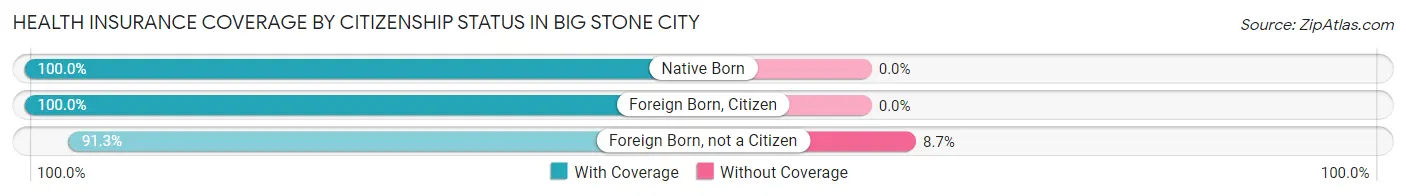
| Citizenship Status | With Coverage | Without Coverage |
| Native Born | 31 (100.0%) | 0 (0.0%) |
| Foreign Born, Citizen | 87 (100.0%) | 0 (0.0%) |
| Foreign Born, not a Citizen | 63 (91.3%) | 6 (8.7%) |
Health Insurance Coverage by Household Income in Big Stone City
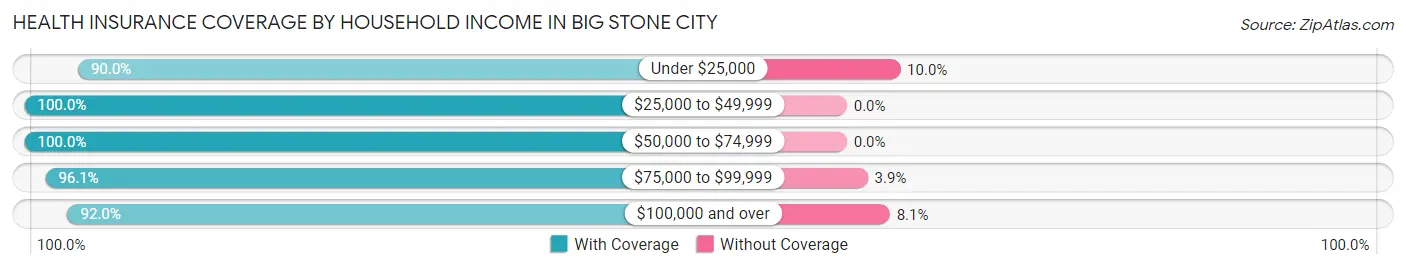
| Household Income | With Coverage | Without Coverage |
| Under $25,000 | 72 (90.0%) | 8 (10.0%) |
| $25,000 to $49,999 | 259 (100.0%) | 0 (0.0%) |
| $50,000 to $74,999 | 102 (100.0%) | 0 (0.0%) |
| $75,000 to $99,999 | 172 (96.1%) | 7 (3.9%) |
| $100,000 and over | 137 (91.9%) | 12 (8.1%) |
Public vs Private Health Insurance Coverage by Age in Big Stone City
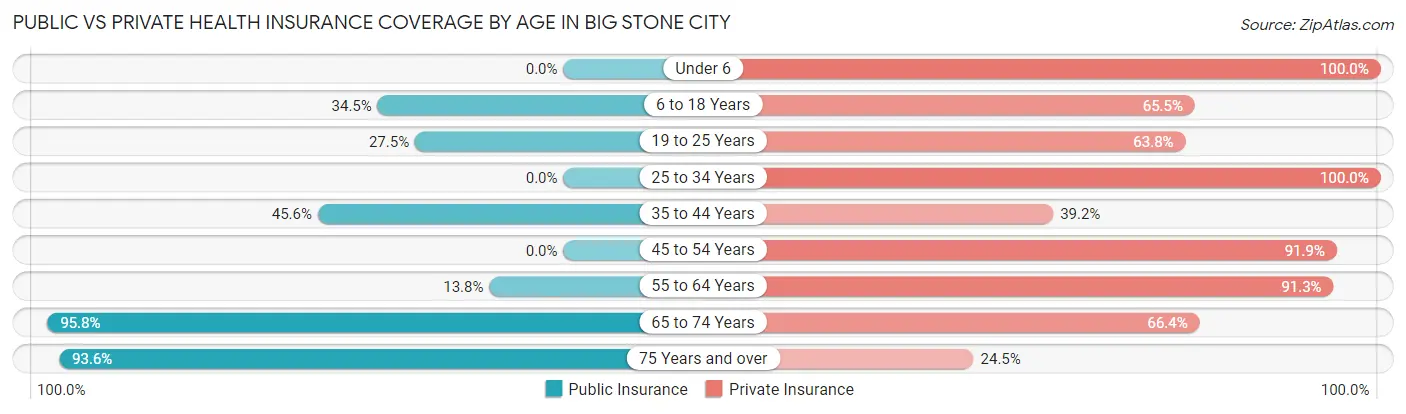
| Age Bracket | Public Insurance | Private Insurance |
| Under 6 | 0 (0.0%) | 31 (100.0%) |
| 6 to 18 Years | 30 (34.5%) | 57 (65.5%) |
| 19 to 25 Years | 19 (27.5%) | 44 (63.8%) |
| 25 to 34 Years | 0 (0.0%) | 30 (100.0%) |
| 35 to 44 Years | 36 (45.6%) | 31 (39.2%) |
| 45 to 54 Years | 0 (0.0%) | 79 (91.9%) |
| 55 to 64 Years | 11 (13.8%) | 73 (91.2%) |
| 65 to 74 Years | 114 (95.8%) | 79 (66.4%) |
| 75 Years and over | 176 (93.6%) | 46 (24.5%) |
| Total | 386 (50.2%) | 470 (61.1%) |
Disability Status by Sex by Age in Big Stone City
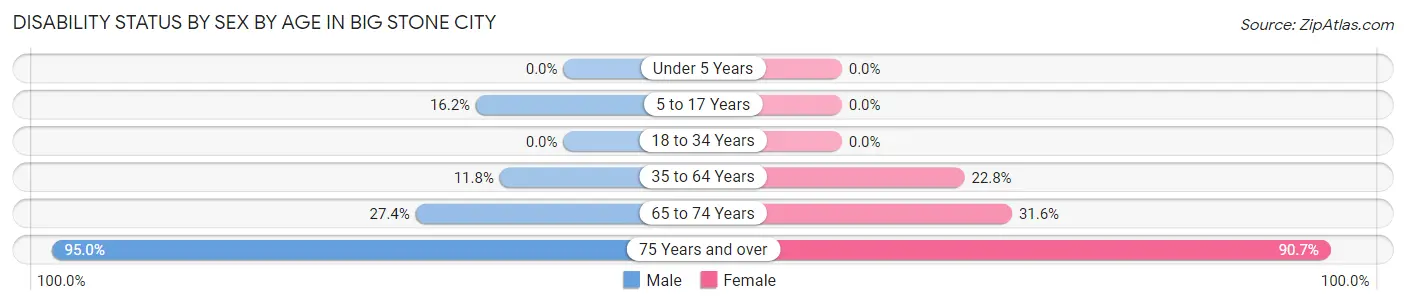
| Age Bracket | Male | Female |
| Under 5 Years | 0 (0.0%) | 0 (0.0%) |
| 5 to 17 Years | 6 (16.2%) | 0 (0.0%) |
| 18 to 34 Years | 0 (0.0%) | 0 (0.0%) |
| 35 to 64 Years | 17 (11.8%) | 23 (22.8%) |
| 65 to 74 Years | 17 (27.4%) | 18 (31.6%) |
| 75 Years and over | 76 (95.0%) | 98 (90.7%) |
Disability Class by Sex by Age in Big Stone City
Disability Class: Hearing Difficulty
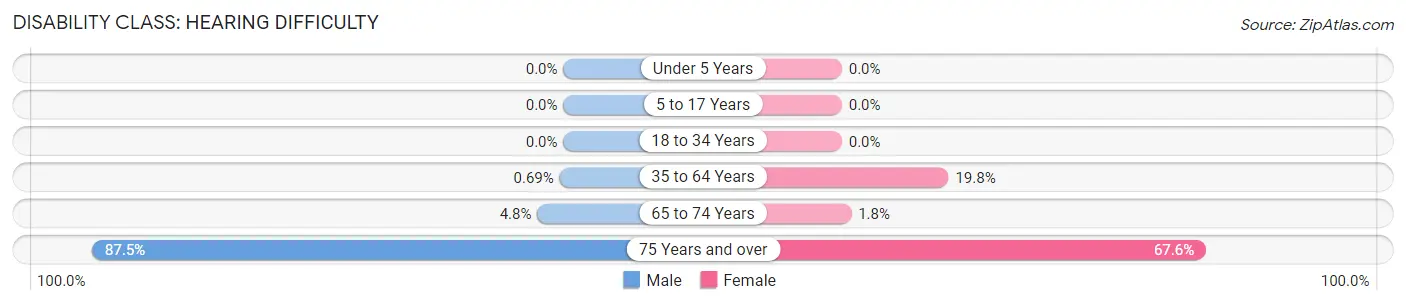
| Age Bracket | Male | Female |
| Under 5 Years | 0 (0.0%) | 0 (0.0%) |
| 5 to 17 Years | 0 (0.0%) | 0 (0.0%) |
| 18 to 34 Years | 0 (0.0%) | 0 (0.0%) |
| 35 to 64 Years | 1 (0.7%) | 20 (19.8%) |
| 65 to 74 Years | 3 (4.8%) | 1 (1.8%) |
| 75 Years and over | 70 (87.5%) | 73 (67.6%) |
Disability Class: Vision Difficulty
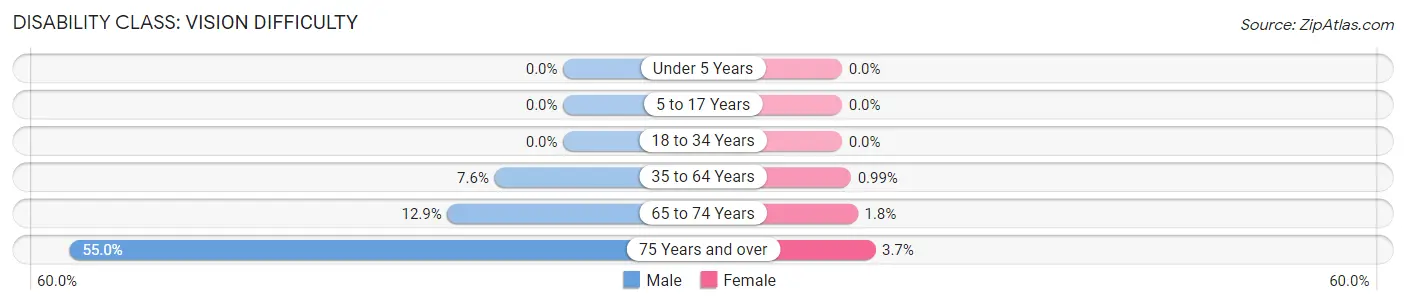
| Age Bracket | Male | Female |
| Under 5 Years | 0 (0.0%) | 0 (0.0%) |
| 5 to 17 Years | 0 (0.0%) | 0 (0.0%) |
| 18 to 34 Years | 0 (0.0%) | 0 (0.0%) |
| 35 to 64 Years | 11 (7.6%) | 1 (1.0%) |
| 65 to 74 Years | 8 (12.9%) | 1 (1.8%) |
| 75 Years and over | 44 (55.0%) | 4 (3.7%) |
Disability Class: Cognitive Difficulty
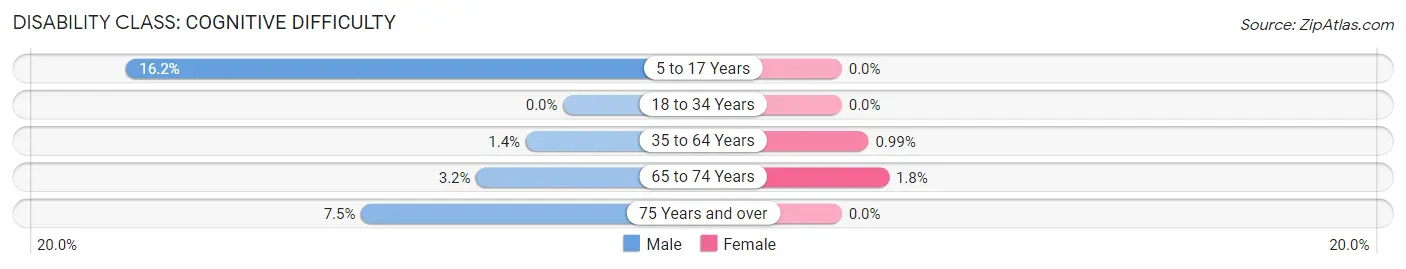
| Age Bracket | Male | Female |
| 5 to 17 Years | 6 (16.2%) | 0 (0.0%) |
| 18 to 34 Years | 0 (0.0%) | 0 (0.0%) |
| 35 to 64 Years | 2 (1.4%) | 1 (1.0%) |
| 65 to 74 Years | 2 (3.2%) | 1 (1.8%) |
| 75 Years and over | 6 (7.5%) | 0 (0.0%) |
Disability Class: Ambulatory Difficulty
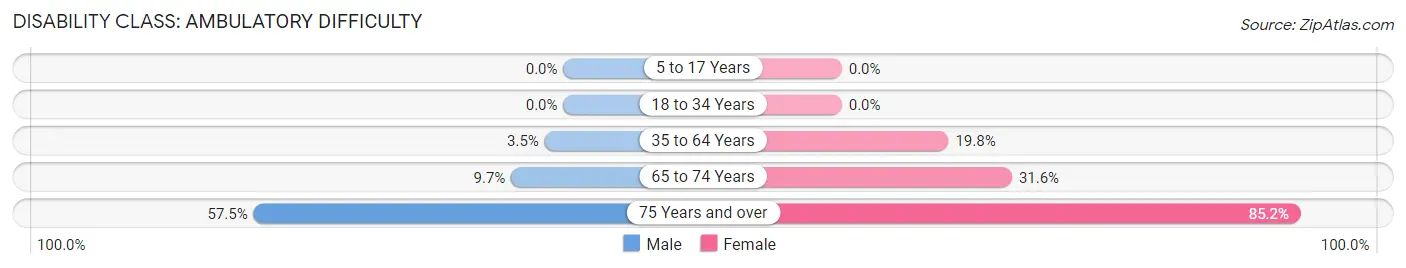
| Age Bracket | Male | Female |
| 5 to 17 Years | 0 (0.0%) | 0 (0.0%) |
| 18 to 34 Years | 0 (0.0%) | 0 (0.0%) |
| 35 to 64 Years | 5 (3.5%) | 20 (19.8%) |
| 65 to 74 Years | 6 (9.7%) | 18 (31.6%) |
| 75 Years and over | 46 (57.5%) | 92 (85.2%) |
Disability Class: Self-Care Difficulty
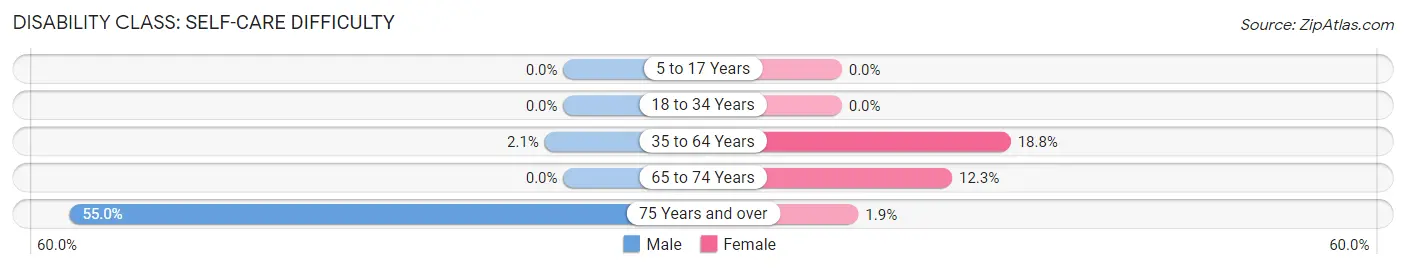
| Age Bracket | Male | Female |
| 5 to 17 Years | 0 (0.0%) | 0 (0.0%) |
| 18 to 34 Years | 0 (0.0%) | 0 (0.0%) |
| 35 to 64 Years | 3 (2.1%) | 19 (18.8%) |
| 65 to 74 Years | 0 (0.0%) | 7 (12.3%) |
| 75 Years and over | 44 (55.0%) | 2 (1.8%) |
Technology Access in Big Stone City
Computing Device Access in Big Stone City
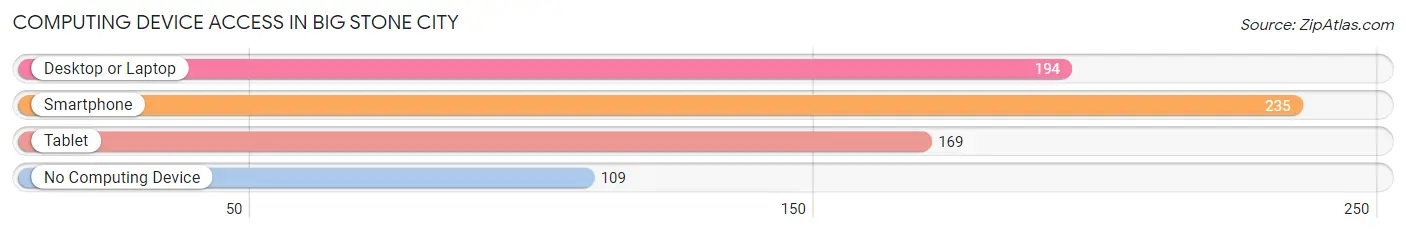
| Device Type | # Households | % Households |
| Desktop or Laptop | 194 | 53.0% |
| Smartphone | 235 | 64.2% |
| Tablet | 169 | 46.2% |
| No Computing Device | 109 | 29.8% |
| Total | 366 | 100.0% |
Internet Access in Big Stone City
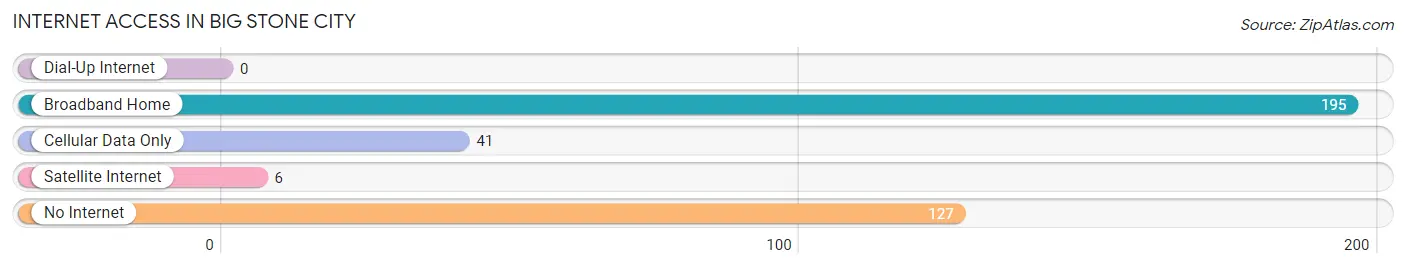
| Internet Type | # Households | % Households |
| Dial-Up Internet | 0 | 0.0% |
| Broadband Home | 195 | 53.3% |
| Cellular Data Only | 41 | 11.2% |
| Satellite Internet | 6 | 1.6% |
| No Internet | 127 | 34.7% |
| Total | 366 | 100.0% |
Big Stone City Summary
Stone City, South Dakota is a small town located in Grant County, South Dakota. It is situated on the eastern shore of Big Stone Lake, which is the source of the Big Stone River. The town was founded in 1881 and is the county seat of Grant County. The population of Stone City was 545 at the 2010 census.
History
The area around Big Stone Lake was first settled by Native Americans, who used the lake for fishing and hunting. The first white settlers arrived in the area in the late 1870s, and the town of Big Stone City was founded in 1881. The town was named after the nearby lake, which was named for its large stones.
The town was originally a farming community, but it soon became a center for the lumber industry. The lumber industry was the main source of income for the town until the early 1900s, when the railroad arrived. The railroad brought new businesses and industries to the area, and the town began to grow.
In the early 1900s, the town was also a popular tourist destination. The lake was a popular spot for fishing and swimming, and the town was known for its beautiful scenery.
Geography
Big Stone City is located in Grant County, South Dakota, on the eastern shore of Big Stone Lake. The lake is the source of the Big Stone River, which flows through the town. The town is situated on the western edge of the Coteau des Prairies, a plateau that stretches across the northern part of the state.
The town is located about 25 miles south of the Minnesota border, and about 50 miles west of the city of Sioux Falls. The nearest major cities are Fargo, North Dakota, and Minneapolis, Minnesota.
Economy
The economy of Big Stone City is largely based on agriculture and tourism. The town is home to several farms, which produce a variety of crops, including corn, soybeans, and wheat. The town is also a popular tourist destination, with visitors coming to enjoy the lake and the surrounding scenery.
The town is also home to several businesses, including a grocery store, a hardware store, and a restaurant. There are also several small manufacturing businesses in the area, which produce a variety of products, including furniture and clothing.
Demographics
As of the 2010 census, the population of Big Stone City was 545. The racial makeup of the town was 97.3% White, 0.2% African American, 0.2% Native American, 0.4% Asian, 0.2% from other races, and 1.9% from two or more races. Hispanic or Latino of any race were 0.7% of the population.
The median income for a household in the town was $37,500, and the median income for a family was $45,000. The per capita income for the town was $18,945. About 11.2% of families and 14.2% of the population were below the poverty line, including 18.2% of those under age 18 and 8.3% of those age 65 or over.
Common Questions
What is Per Capita Income in Big Stone City?
Per Capita income in Big Stone City is $36,723.
What is the Median Family Income in Big Stone City?
Median Family Income in Big Stone City is $63,542.
What is the Median Household income in Big Stone City?
Median Household Income in Big Stone City is $51,250.
What is Income or Wage Gap in Big Stone City?
Income or Wage Gap in Big Stone City is 27.9%.
Women in Big Stone City earn 72.1 cents for every dollar earned by a man.
What is Inequality or Gini Index in Big Stone City?
Inequality or Gini Index in Big Stone City is 0.46.
What is the Total Population of Big Stone City?
Total Population of Big Stone City is 769.
What is the Total Male Population of Big Stone City?
Total Male Population of Big Stone City is 422.
What is the Total Female Population of Big Stone City?
Total Female Population of Big Stone City is 347.
What is the Ratio of Males per 100 Females in Big Stone City?
There are 121.61 Males per 100 Females in Big Stone City.
What is the Ratio of Females per 100 Males in Big Stone City?
There are 82.23 Females per 100 Males in Big Stone City.
What is the Median Population Age in Big Stone City?
Median Population Age in Big Stone City is 56.1 Years.
What is the Average Family Size in Big Stone City
Average Family Size in Big Stone City is 2.5 People.
What is the Average Household Size in Big Stone City
Average Household Size in Big Stone City is 2.1 People.
How Large is the Labor Force in Big Stone City?
There are 349 People in the Labor Forcein in Big Stone City.
What is the Percentage of People in the Labor Force in Big Stone City?
52.2% of People are in the Labor Force in Big Stone City.