Wanblee, SD Map & Demographics
Wanblee Map
Wanblee Overview
$7,366
PER CAPITA INCOME
$24,167
AVG HOUSEHOLD INCOME
78.0%
WAGE / INCOME GAP [ % ]
22.0¢/ $1
WAGE / INCOME GAP [ $ ]
0.47
INEQUALITY / GINI INDEX
661
TOTAL POPULATION
314
MALE POPULATION
347
FEMALE POPULATION
90.49
MALES / 100 FEMALES
110.51
FEMALES / 100 MALES
18.0
MEDIAN AGE
6.9
AVG FAMILY SIZE
6.0
AVG HOUSEHOLD SIZE
129
LABOR FORCE [ PEOPLE ]
34.3%
PERCENT IN LABOR FORCE
22.5%
UNEMPLOYMENT RATE
Wanblee Zip Codes
Wanblee Area Codes
Income in Wanblee
Income Overview in Wanblee
| Characteristic | Number | Measure |
| Per Capita Income | 661 | $7,366 |
| Median Family Income | 90 | $0 |
| Mean Family Income | 90 | $32,064 |
| Median Household Income | 108 | $24,167 |
| Mean Household Income | 108 | $32,731 |
| Income Deficit | 90 | $0 |
| Wage / Income Gap (%) | 661 | 77.98% |
| Wage / Income Gap ($) | 661 | 22.02¢ per $1 |
| Gini / Inequality Index | 661 | 0.47 |
Earnings by Sex in Wanblee
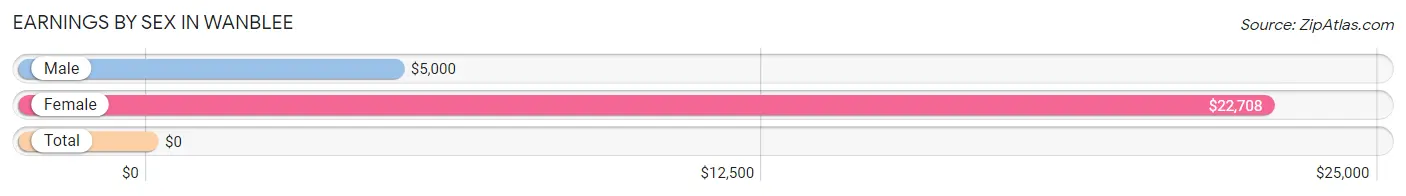
| Sex | Number | Average Earnings |
| Male | 64 (41.3%) | $5,000 |
| Female | 91 (58.7%) | $22,708 |
| Total | 155 (100.0%) | $0 |
Earnings by Sex by Income Bracket in Wanblee
The most common earnings brackets in Wanblee are $2,499 or less for men (24 | 37.5%) and $2,499 or less for women (30 | 33.0%).
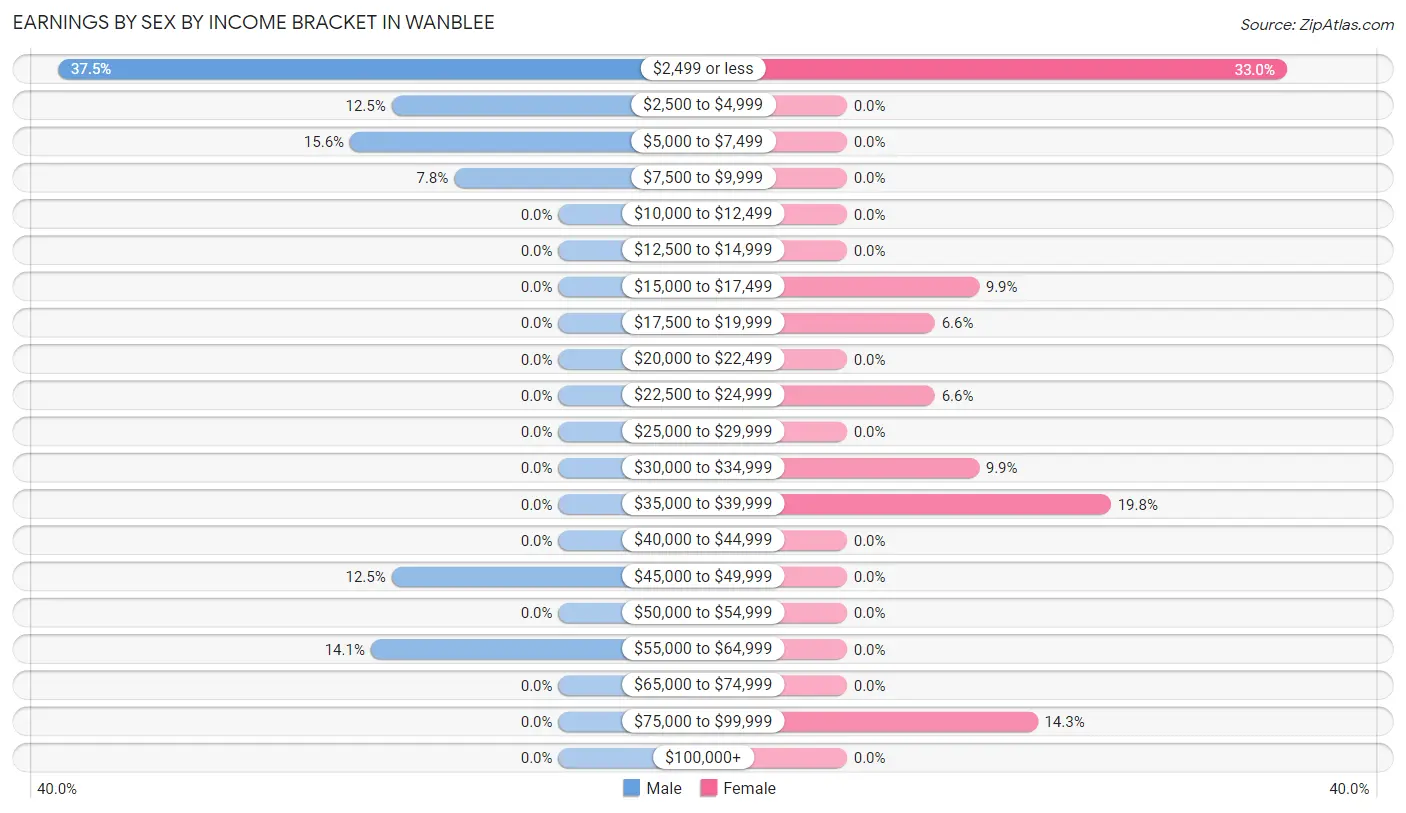
| Income | Male | Female |
| $2,499 or less | 24 (37.5%) | 30 (33.0%) |
| $2,500 to $4,999 | 8 (12.5%) | 0 (0.0%) |
| $5,000 to $7,499 | 10 (15.6%) | 0 (0.0%) |
| $7,500 to $9,999 | 5 (7.8%) | 0 (0.0%) |
| $10,000 to $12,499 | 0 (0.0%) | 0 (0.0%) |
| $12,500 to $14,999 | 0 (0.0%) | 0 (0.0%) |
| $15,000 to $17,499 | 0 (0.0%) | 9 (9.9%) |
| $17,500 to $19,999 | 0 (0.0%) | 6 (6.6%) |
| $20,000 to $22,499 | 0 (0.0%) | 0 (0.0%) |
| $22,500 to $24,999 | 0 (0.0%) | 6 (6.6%) |
| $25,000 to $29,999 | 0 (0.0%) | 0 (0.0%) |
| $30,000 to $34,999 | 0 (0.0%) | 9 (9.9%) |
| $35,000 to $39,999 | 0 (0.0%) | 18 (19.8%) |
| $40,000 to $44,999 | 0 (0.0%) | 0 (0.0%) |
| $45,000 to $49,999 | 8 (12.5%) | 0 (0.0%) |
| $50,000 to $54,999 | 0 (0.0%) | 0 (0.0%) |
| $55,000 to $64,999 | 9 (14.1%) | 0 (0.0%) |
| $65,000 to $74,999 | 0 (0.0%) | 0 (0.0%) |
| $75,000 to $99,999 | 0 (0.0%) | 13 (14.3%) |
| $100,000+ | 0 (0.0%) | 0 (0.0%) |
| Total | 64 (100.0%) | 91 (100.0%) |
Earnings by Sex by Educational Attainment in Wanblee
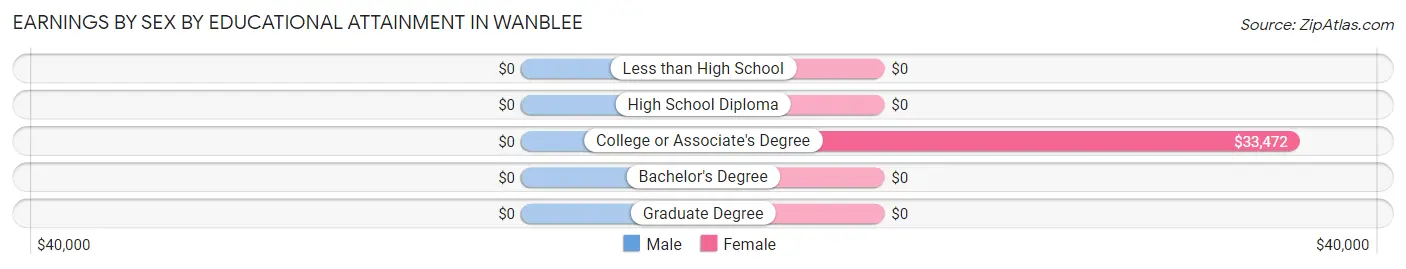
| Educational Attainment | Male Income | Female Income |
| Less than High School | - | - |
| High School Diploma | - | - |
| College or Associate's Degree | - | - |
| Bachelor's Degree | - | - |
| Graduate Degree | - | - |
| Total | - | - |
Family Income in Wanblee
Family Income Brackets in Wanblee
According to the Wanblee family income data, there are 29 families falling into the less than $10,000 income range, which is the most common income bracket and makes up 32.2% of all families.
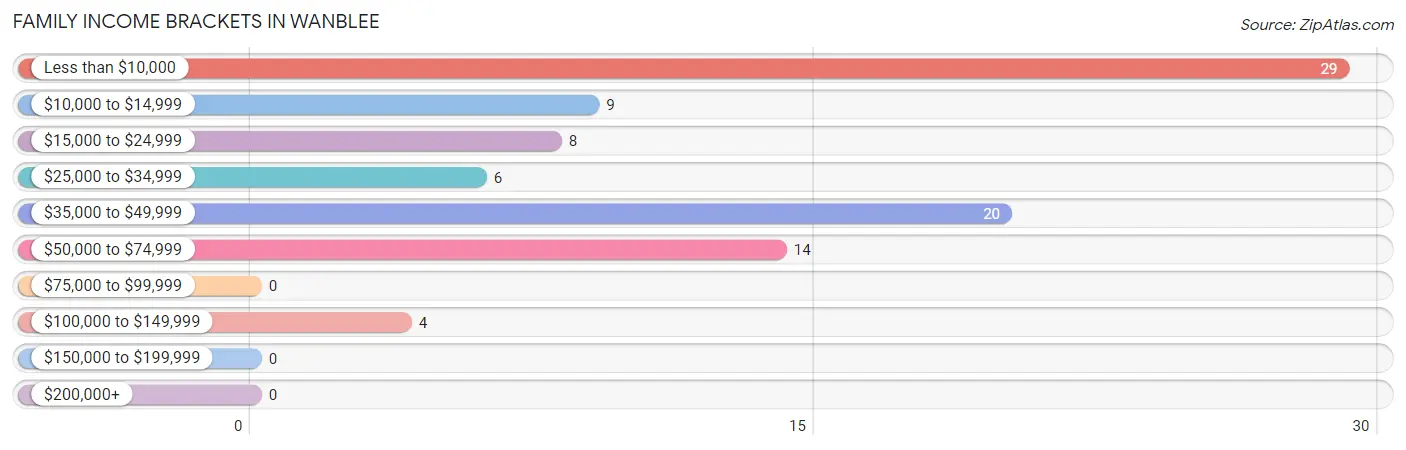
| Income Bracket | # Families | % Families |
| Less than $10,000 | 29 | 32.2% |
| $10,000 to $14,999 | 9 | 10.0% |
| $15,000 to $24,999 | 8 | 8.9% |
| $25,000 to $34,999 | 6 | 6.7% |
| $35,000 to $49,999 | 20 | 22.2% |
| $50,000 to $74,999 | 14 | 15.6% |
| $75,000 to $99,999 | 0 | 0.0% |
| $100,000 to $149,999 | 4 | 4.4% |
| $150,000 to $199,999 | 0 | 0.0% |
| $200,000+ | 0 | 0.0% |
Family Income by Famaliy Size in Wanblee
3-person families (25 | 27.8%) account for the highest median family income in Wanblee with $47,596 per family, while 3-person families (25 | 27.8%) have the highest median income of $15,865 per family member.
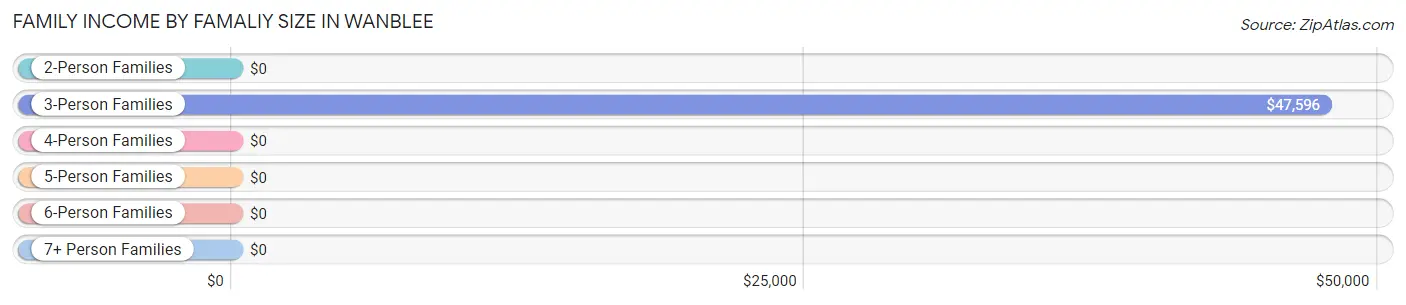
| Income Bracket | # Families | Median Income |
| 2-Person Families | 17 (18.9%) | $0 |
| 3-Person Families | 25 (27.8%) | $47,596 |
| 4-Person Families | 6 (6.7%) | $0 |
| 5-Person Families | 7 (7.8%) | $0 |
| 6-Person Families | 8 (8.9%) | $0 |
| 7+ Person Families | 27 (30.0%) | $0 |
| Total | 90 (100.0%) | $0 |
Family Income by Number of Earners in Wanblee
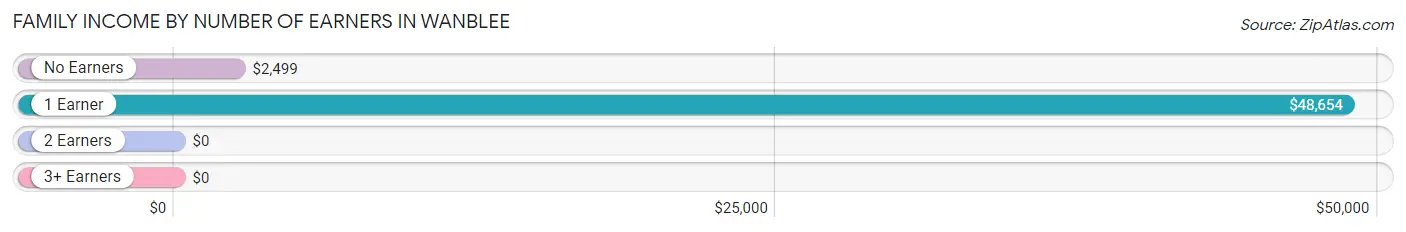
| Number of Earners | # Families | Median Income |
| No Earners | 38 (42.2%) | $2,499 |
| 1 Earner | 32 (35.6%) | $48,654 |
| 2 Earners | 11 (12.2%) | $0 |
| 3+ Earners | 9 (10.0%) | $0 |
| Total | 90 (100.0%) | $0 |
Household Income in Wanblee
Household Income Brackets in Wanblee
With 29 households falling in the category, the less than $10,000 income range is the most frequent in Wanblee, accounting for 26.9% of all households.
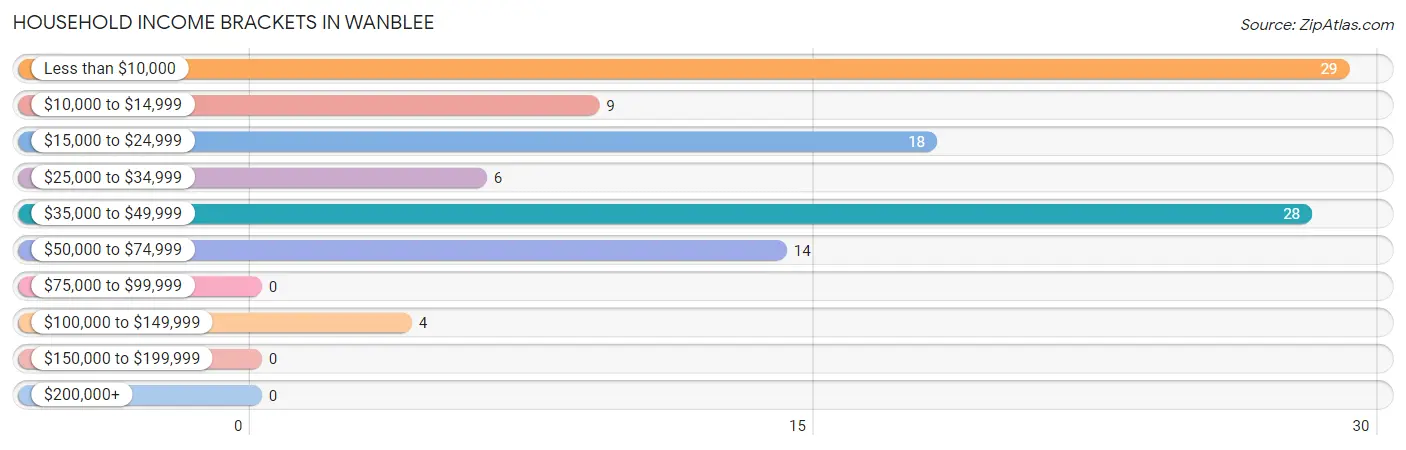
| Income Bracket | # Households | % Households |
| Less than $10,000 | 29 | 26.9% |
| $10,000 to $14,999 | 9 | 8.3% |
| $15,000 to $24,999 | 18 | 16.7% |
| $25,000 to $34,999 | 6 | 5.6% |
| $35,000 to $49,999 | 28 | 25.9% |
| $50,000 to $74,999 | 14 | 13.0% |
| $75,000 to $99,999 | 0 | 0.0% |
| $100,000 to $149,999 | 4 | 3.7% |
| $150,000 to $199,999 | 0 | 0.0% |
| $200,000+ | 0 | 0.0% |
Household Income by Householder Age in Wanblee
| Income Bracket | # Households | Median Income |
| 15 to 24 Years | 0 (0.0%) | $0 |
| 25 to 44 Years | 43 (39.8%) | $0 |
| 45 to 64 Years | 50 (46.3%) | $0 |
| 65+ Years | 15 (13.9%) | $0 |
| Total | 108 (100.0%) | $24,167 |
Poverty in Wanblee
Income Below Poverty by Sex and Age in Wanblee
With 50.6% poverty level for males and 55.9% for females among the residents of Wanblee, 5 year old males and 15 year old females are the most vulnerable to poverty, with 7 males (100.0%) and 14 females (100.0%) in their respective age groups living below the poverty level.
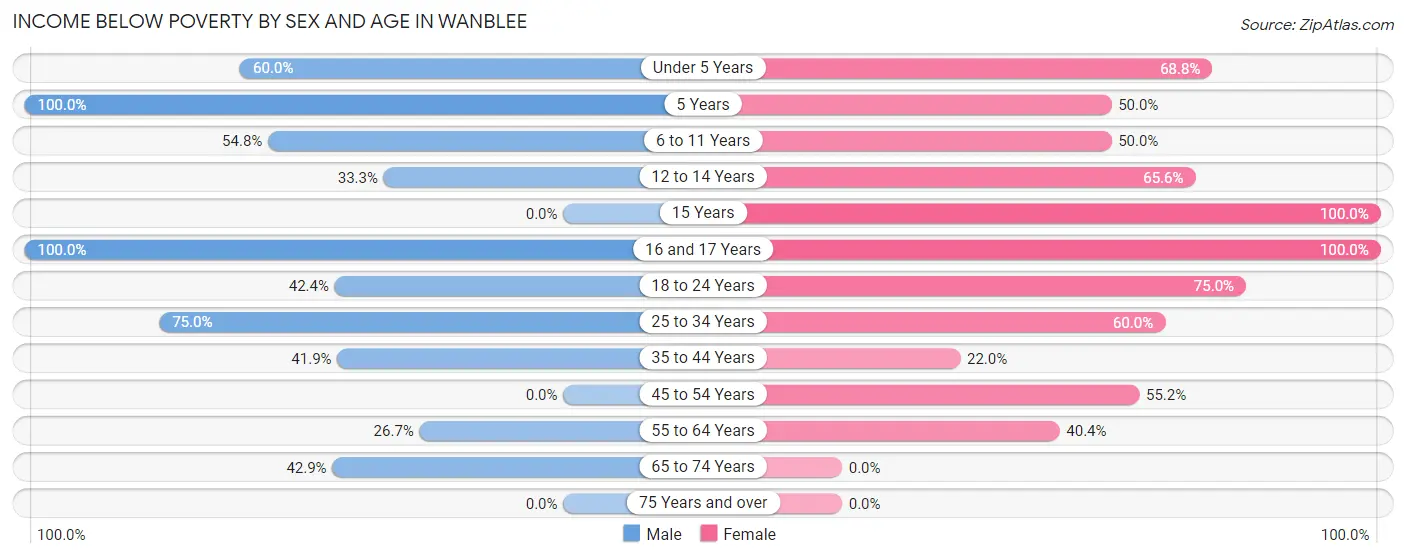
| Age Bracket | Male | Female |
| Under 5 Years | 21 (60.0%) | 22 (68.8%) |
| 5 Years | 7 (100.0%) | 8 (50.0%) |
| 6 to 11 Years | 40 (54.8%) | 21 (50.0%) |
| 12 to 14 Years | 7 (33.3%) | 21 (65.6%) |
| 15 Years | 0 (0.0%) | 14 (100.0%) |
| 16 and 17 Years | 22 (100.0%) | 23 (100.0%) |
| 18 to 24 Years | 14 (42.4%) | 21 (75.0%) |
| 25 to 34 Years | 24 (75.0%) | 18 (60.0%) |
| 35 to 44 Years | 13 (41.9%) | 9 (22.0%) |
| 45 to 54 Years | 0 (0.0%) | 16 (55.2%) |
| 55 to 64 Years | 8 (26.7%) | 21 (40.4%) |
| 65 to 74 Years | 3 (42.9%) | 0 (0.0%) |
| 75 Years and over | 0 (0.0%) | 0 (0.0%) |
| Total | 159 (50.6%) | 194 (55.9%) |
Income Above Poverty by Sex and Age in Wanblee
According to the poverty statistics in Wanblee, males aged 15 years and females aged 75 years and over are the age groups that are most secure financially, with 100.0% of males and 100.0% of females in these age groups living above the poverty line.
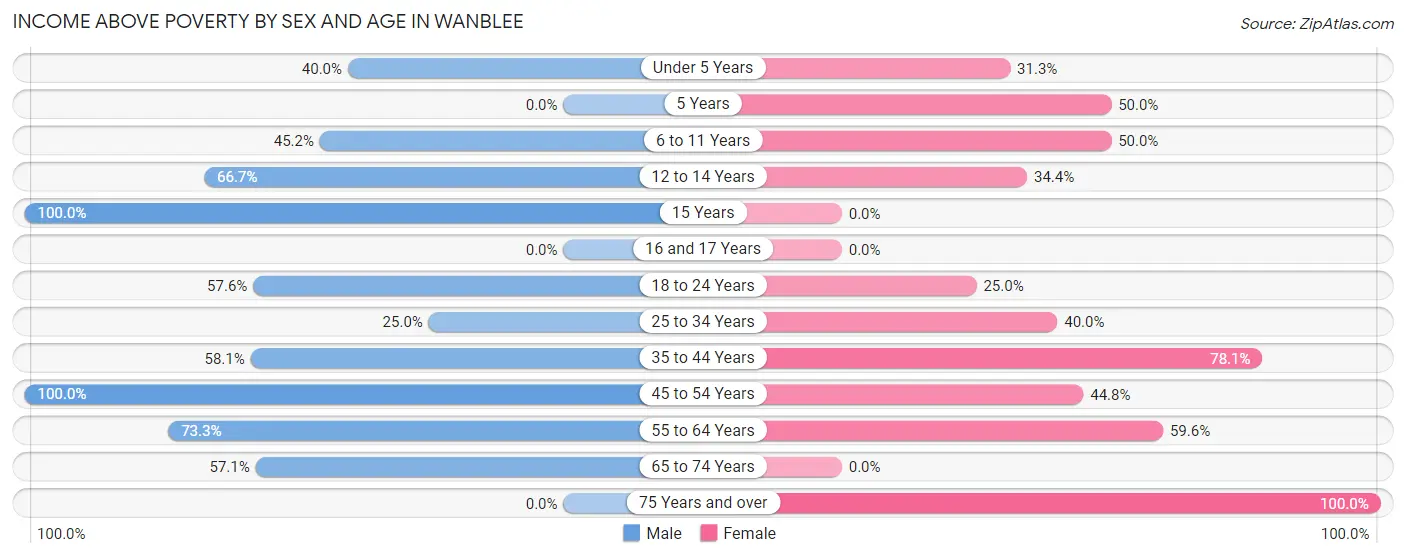
| Age Bracket | Male | Female |
| Under 5 Years | 14 (40.0%) | 10 (31.2%) |
| 5 Years | 0 (0.0%) | 8 (50.0%) |
| 6 to 11 Years | 33 (45.2%) | 21 (50.0%) |
| 12 to 14 Years | 14 (66.7%) | 11 (34.4%) |
| 15 Years | 13 (100.0%) | 0 (0.0%) |
| 16 and 17 Years | 0 (0.0%) | 0 (0.0%) |
| 18 to 24 Years | 19 (57.6%) | 7 (25.0%) |
| 25 to 34 Years | 8 (25.0%) | 12 (40.0%) |
| 35 to 44 Years | 18 (58.1%) | 32 (78.0%) |
| 45 to 54 Years | 10 (100.0%) | 13 (44.8%) |
| 55 to 64 Years | 22 (73.3%) | 31 (59.6%) |
| 65 to 74 Years | 4 (57.1%) | 0 (0.0%) |
| 75 Years and over | 0 (0.0%) | 8 (100.0%) |
| Total | 155 (49.4%) | 153 (44.1%) |
Income Below Poverty Among Married-Couple Families in Wanblee
The poverty statistics for married-couple families in Wanblee show that 44.0% or 11 of the total 25 families live below the poverty line. Families with no children have the highest poverty rate of 47.1%, comprising of 8 families. On the other hand, families with 5 or more children have the lowest poverty rate of 37.5%, which includes 3 families.
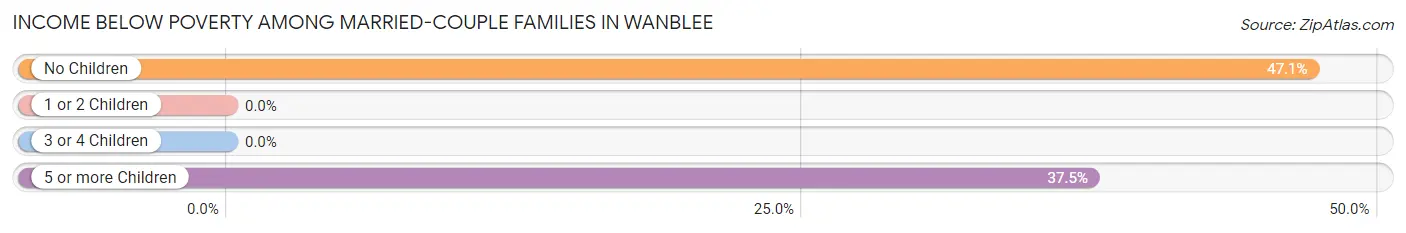
| Children | Above Poverty | Below Poverty |
| No Children | 9 (52.9%) | 8 (47.1%) |
| 1 or 2 Children | 0 (0.0%) | 0 (0.0%) |
| 3 or 4 Children | 0 (0.0%) | 0 (0.0%) |
| 5 or more Children | 5 (62.5%) | 3 (37.5%) |
| Total | 14 (56.0%) | 11 (44.0%) |
Income Below Poverty Among Single-Parent Households in Wanblee
According to the poverty data in Wanblee, 100.0% or 13 single-father households and 59.6% or 31 single-mother households are living below the poverty line. Among single-father households, those with 1 or 2 children have the highest poverty rate, with 6 households (100.0%) experiencing poverty. Likewise, among single-mother households, those with 3 or 4 children have the highest poverty rate, with 8 households (100.0%) falling below the poverty line.
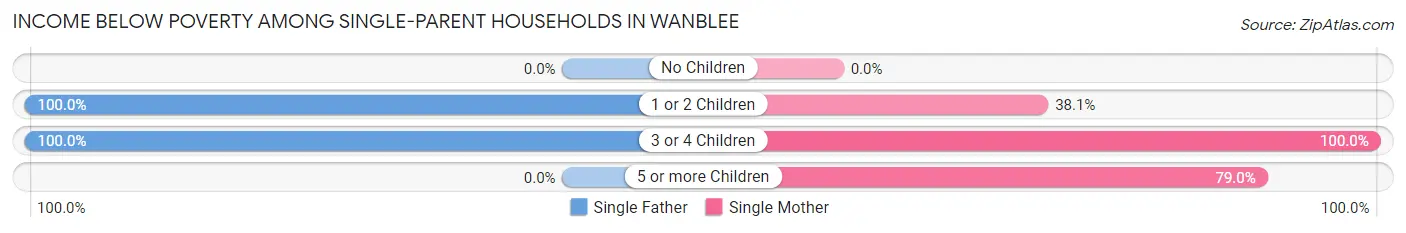
| Children | Single Father | Single Mother |
| No Children | 0 (0.0%) | 0 (0.0%) |
| 1 or 2 Children | 6 (100.0%) | 8 (38.1%) |
| 3 or 4 Children | 7 (100.0%) | 8 (100.0%) |
| 5 or more Children | 0 (0.0%) | 15 (78.9%) |
| Total | 13 (100.0%) | 31 (59.6%) |
Income Below Poverty Among Married-Couple vs Single-Parent Households in Wanblee
The poverty data for Wanblee shows that 11 of the married-couple family households (44.0%) and 44 of the single-parent households (67.7%) are living below the poverty level. Within the married-couple family households, those with no children have the highest poverty rate, with 8 households (47.1%) falling below the poverty line. Among the single-parent households, those with 3 or 4 children have the highest poverty rate, with 15 household (100.0%) living below poverty.
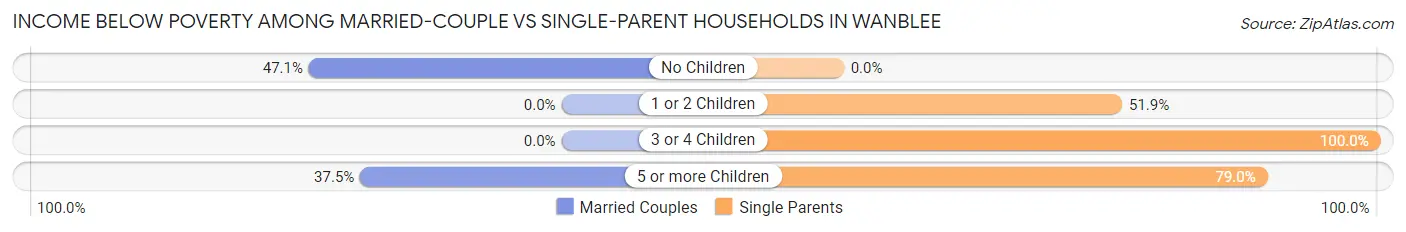
| Children | Married-Couple Families | Single-Parent Households |
| No Children | 8 (47.1%) | 0 (0.0%) |
| 1 or 2 Children | 0 (0.0%) | 14 (51.8%) |
| 3 or 4 Children | 0 (0.0%) | 15 (100.0%) |
| 5 or more Children | 3 (37.5%) | 15 (78.9%) |
| Total | 11 (44.0%) | 44 (67.7%) |
Race in Wanblee
The most populous races in Wanblee are Native / Alaskan (638 | 96.5%), White / Caucasian (12 | 1.8%), and Black / African American (8 | 1.2%).
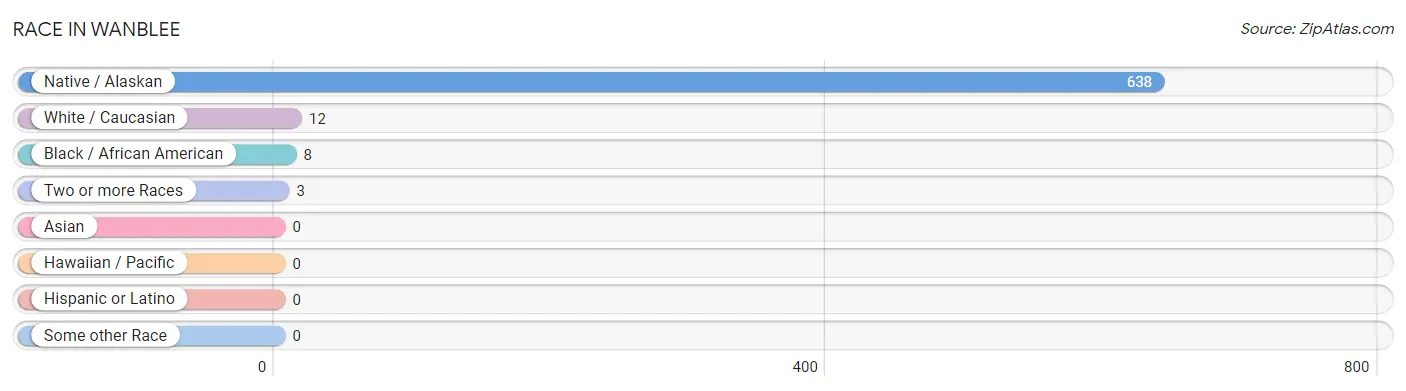
| Race | # Population | % Population |
| Asian | 0 | 0.0% |
| Black / African American | 8 | 1.2% |
| Hawaiian / Pacific | 0 | 0.0% |
| Hispanic or Latino | 0 | 0.0% |
| Native / Alaskan | 638 | 96.5% |
| White / Caucasian | 12 | 1.8% |
| Two or more Races | 3 | 0.4% |
| Some other Race | 0 | 0.0% |
| Total | 661 | 100.0% |
Ancestry in Wanblee
The most populous ancestries reported in Wanblee are Sioux (610 | 92.3%), Ethiopian (8 | 1.2%), Subsaharan African (8 | 1.2%), and Barbadian (3 | 0.4%), together accounting for 95.1% of all Wanblee residents.
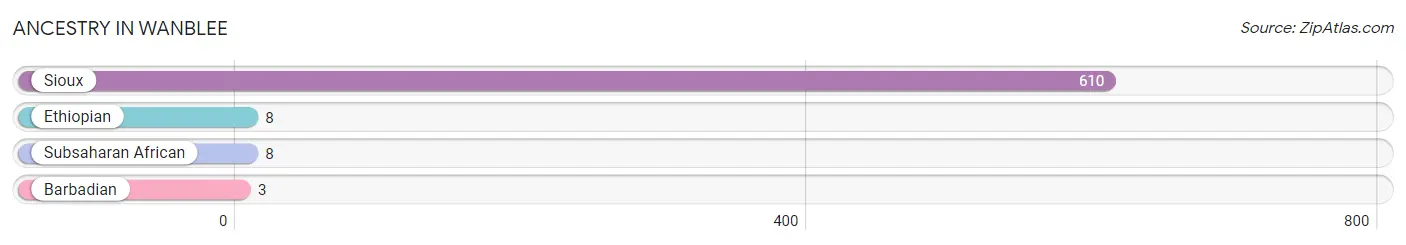
| Ancestry | # Population | % Population |
| Barbadian | 3 | 0.4% |
| Ethiopian | 8 | 1.2% |
| Sioux | 610 | 92.3% |
| Subsaharan African | 8 | 1.2% | View All 4 Rows |
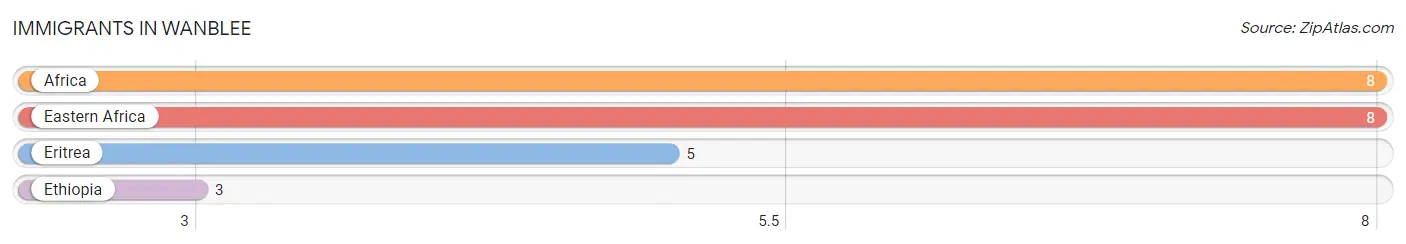
Immigrants in Wanblee
The most numerous immigrant groups reported in Wanblee came from Africa (8 | 1.2%), Eastern Africa (8 | 1.2%), Eritrea (5 | 0.8%), and Ethiopia (3 | 0.4%), together accounting for 3.6% of all Wanblee residents.
| Immigration Origin | # Population | % Population |
| Africa | 8 | 1.2% |
| Eastern Africa | 8 | 1.2% |
| Eritrea | 5 | 0.8% |
| Ethiopia | 3 | 0.4% | View All 4 Rows |
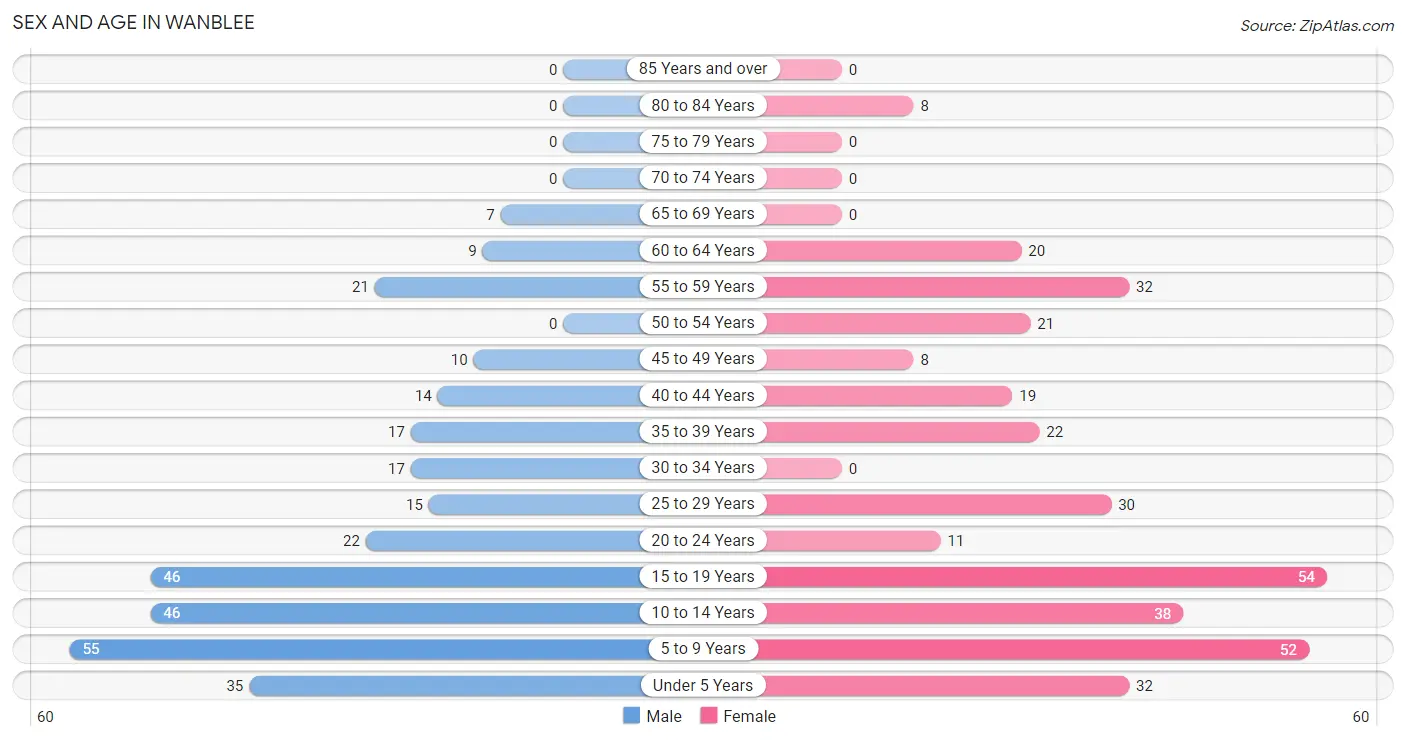
Sex and Age in Wanblee
Sex and Age in Wanblee
The most populous age groups in Wanblee are 5 to 9 Years (55 | 17.5%) for men and 15 to 19 Years (54 | 15.6%) for women.
| Age Bracket | Male | Female |
| Under 5 Years | 35 (11.2%) | 32 (9.2%) |
| 5 to 9 Years | 55 (17.5%) | 52 (15.0%) |
| 10 to 14 Years | 46 (14.6%) | 38 (11.0%) |
| 15 to 19 Years | 46 (14.6%) | 54 (15.6%) |
| 20 to 24 Years | 22 (7.0%) | 11 (3.2%) |
| 25 to 29 Years | 15 (4.8%) | 30 (8.6%) |
| 30 to 34 Years | 17 (5.4%) | 0 (0.0%) |
| 35 to 39 Years | 17 (5.4%) | 22 (6.3%) |
| 40 to 44 Years | 14 (4.5%) | 19 (5.5%) |
| 45 to 49 Years | 10 (3.2%) | 8 (2.3%) |
| 50 to 54 Years | 0 (0.0%) | 21 (6.0%) |
| 55 to 59 Years | 21 (6.7%) | 32 (9.2%) |
| 60 to 64 Years | 9 (2.9%) | 20 (5.8%) |
| 65 to 69 Years | 7 (2.2%) | 0 (0.0%) |
| 70 to 74 Years | 0 (0.0%) | 0 (0.0%) |
| 75 to 79 Years | 0 (0.0%) | 0 (0.0%) |
| 80 to 84 Years | 0 (0.0%) | 8 (2.3%) |
| 85 Years and over | 0 (0.0%) | 0 (0.0%) |
| Total | 314 (100.0%) | 347 (100.0%) |
Families and Households in Wanblee
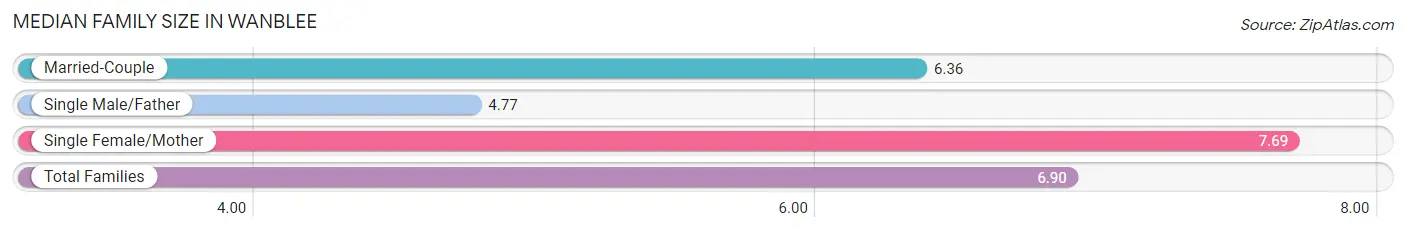
Median Family Size in Wanblee
The median family size in Wanblee is 6.90 persons per family, with single female/mother families (52 | 57.8%) accounting for the largest median family size of 7.69 persons per family. On the other hand, single male/father families (13 | 14.4%) represent the smallest median family size with 4.77 persons per family.
| Family Type | # Families | Family Size |
| Married-Couple | 25 (27.8%) | 6.36 |
| Single Male/Father | 13 (14.4%) | 4.77 |
| Single Female/Mother | 52 (57.8%) | 7.69 |
| Total Families | 90 (100.0%) | 6.90 |
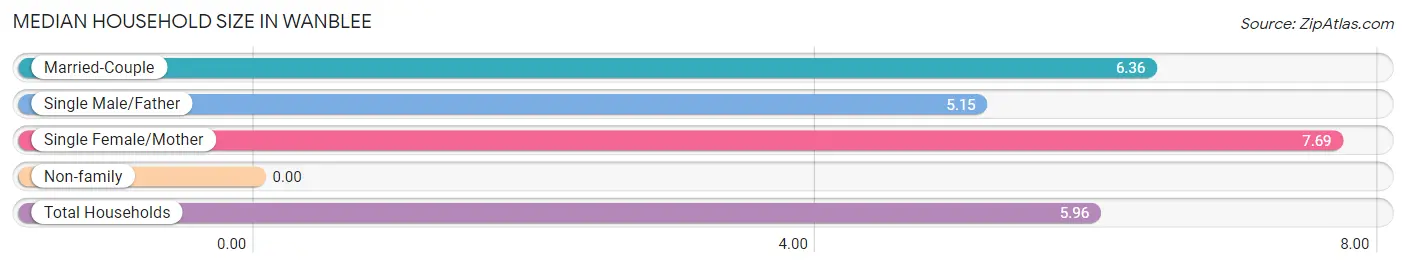
Median Household Size in Wanblee
| Household Type | # Households | Household Size |
| Married-Couple | 25 (23.2%) | 6.36 |
| Single Male/Father | 13 (12.0%) | 5.15 |
| Single Female/Mother | 52 (48.1%) | 7.69 |
| Non-family | 18 (16.7%) | - |
| Total Households | 108 (100.0%) | 5.96 |
Household Size by Marriage Status in Wanblee
Out of a total of 108 households in Wanblee, 90 (83.3%) are family households, while 18 (16.7%) are nonfamily households. The most numerous type of family households are 7+ person households, comprising 27, and the most common type of nonfamily households are 1-person households, comprising 18.
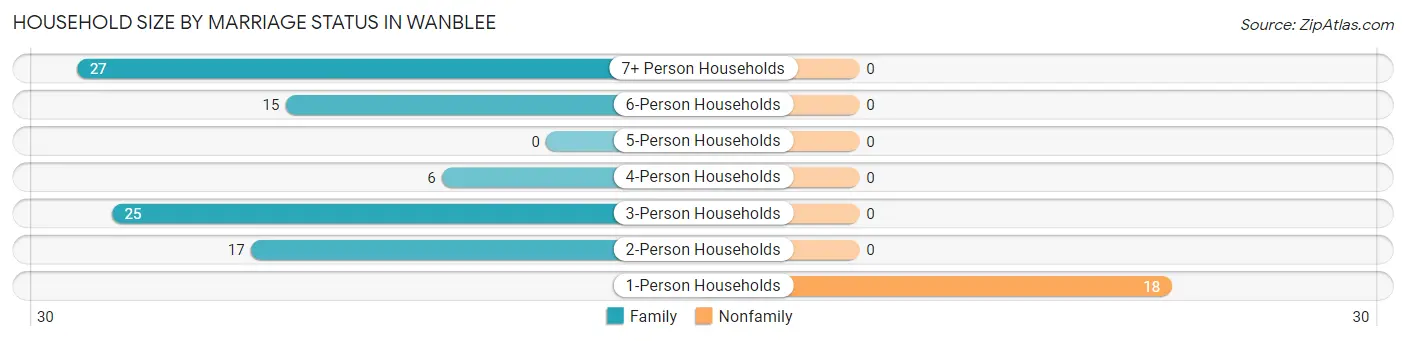
| Household Size | Family Households | Nonfamily Households |
| 1-Person Households | - | 18 (16.7%) |
| 2-Person Households | 17 (15.7%) | 0 (0.0%) |
| 3-Person Households | 25 (23.2%) | 0 (0.0%) |
| 4-Person Households | 6 (5.6%) | 0 (0.0%) |
| 5-Person Households | 0 (0.0%) | 0 (0.0%) |
| 6-Person Households | 15 (13.9%) | 0 (0.0%) |
| 7+ Person Households | 27 (25.0%) | 0 (0.0%) |
| Total | 90 (83.3%) | 18 (16.7%) |
Female Fertility in Wanblee
Fertility by Age in Wanblee
Average fertility rate in Wanblee is 115.0 births per 1,000 women. Women in the age bracket of 20 to 34 years have the highest fertility rate with 439.0 births per 1,000 women. Women in the age bracket of 20 to 34 years acount for 100.0% of all women with births.
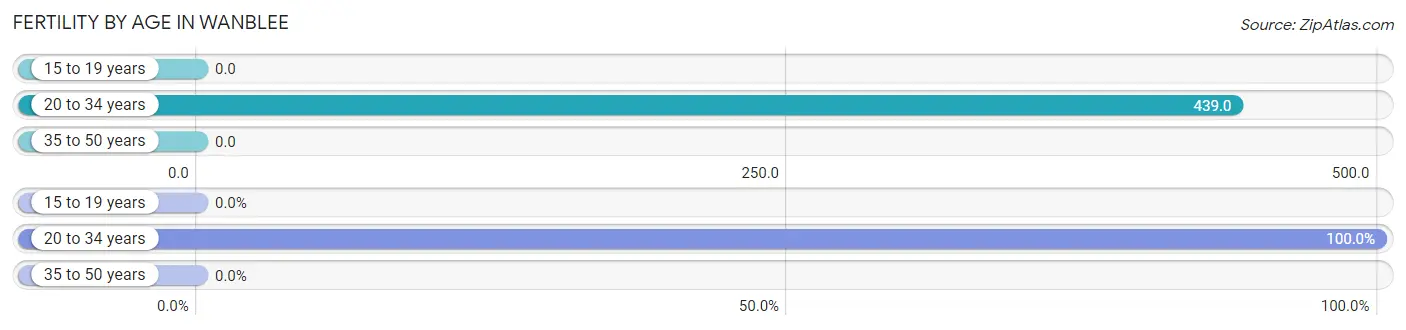
| Age Bracket | Women with Births | Births / 1,000 Women |
| 15 to 19 years | 0 (0.0%) | 0.0 |
| 20 to 34 years | 18 (100.0%) | 439.0 |
| 35 to 50 years | 0 (0.0%) | 0.0 |
| Total | 18 (100.0%) | 115.0 |
Fertility by Age by Marriage Status in Wanblee
33.3% of women with births (18) in Wanblee are married. The highest percentage of unmarried women with births falls into 20 to 34 years age bracket with 66.7% of them unmarried at the time of birth, while the lowest percentage of unmarried women with births belong to 20 to 34 years age bracket with 66.7% of them unmarried.
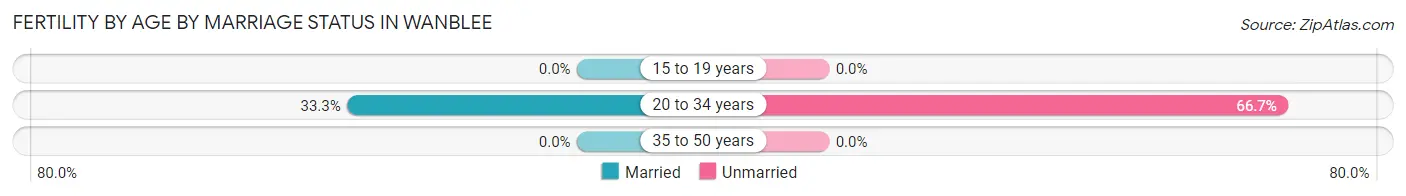
| Age Bracket | Married | Unmarried |
| 15 to 19 years | 0 (0.0%) | 0 (0.0%) |
| 20 to 34 years | 6 (33.3%) | 12 (66.7%) |
| 35 to 50 years | 0 (0.0%) | 0 (0.0%) |
| Total | 6 (33.3%) | 12 (66.7%) |
Fertility by Education in Wanblee
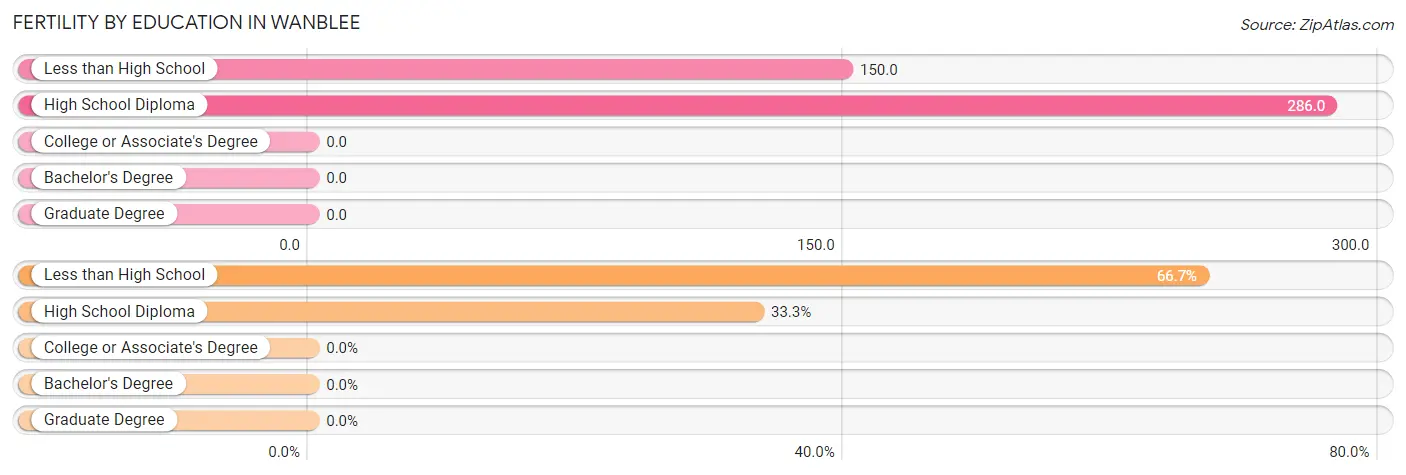
| Educational Attainment | Women with Births | Births / 1,000 Women |
| Less than High School | 12 (66.7%) | 150.0 |
| High School Diploma | 6 (33.3%) | 286.0 |
| College or Associate's Degree | 0 (0.0%) | 0.0 |
| Bachelor's Degree | 0 (0.0%) | 0.0 |
| Graduate Degree | 0 (0.0%) | 0.0 |
| Total | 18 (100.0%) | 115.0 |
Fertility by Education by Marriage Status in Wanblee
66.7% of women with births in Wanblee are unmarried. Women with the educational attainment of high school diploma are most likely to be married with 100.0% of them married at childbirth, while women with the educational attainment of less than high school are least likely to be married with 100.0% of them unmarried at childbirth.
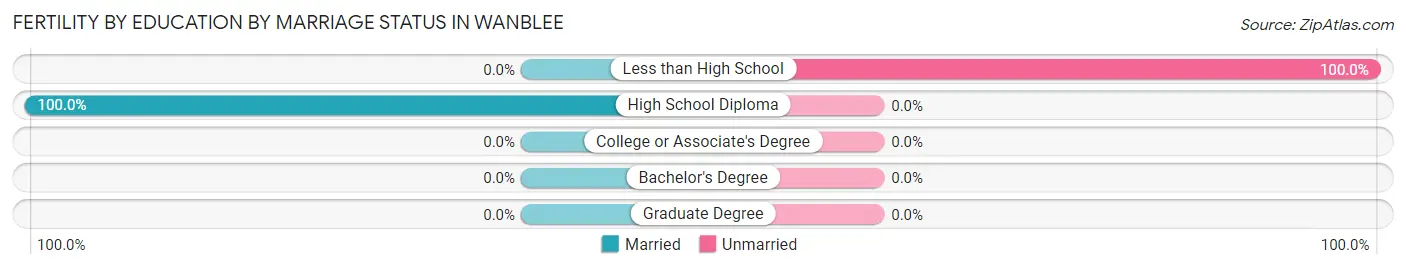
| Educational Attainment | Married | Unmarried |
| Less than High School | 0 (0.0%) | 12 (100.0%) |
| High School Diploma | 6 (100.0%) | 0 (0.0%) |
| College or Associate's Degree | 0 (0.0%) | 0 (0.0%) |
| Bachelor's Degree | 0 (0.0%) | 0 (0.0%) |
| Graduate Degree | 0 (0.0%) | 0 (0.0%) |
| Total | 6 (33.3%) | 12 (66.7%) |
Employment Characteristics in Wanblee
Employment by Class of Employer in Wanblee
Among the 100 employed individuals in Wanblee, local government employees (61 | 61.0%), private company employees (20 | 20.0%), and federal government employees (16 | 16.0%) make up the most common classes of employment.
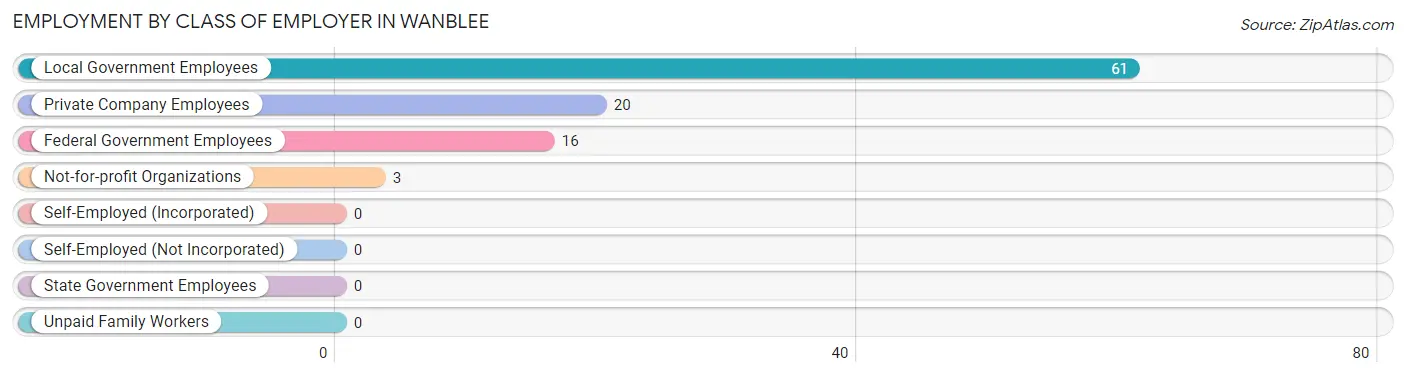
| Employer Class | # Employees | % Employees |
| Private Company Employees | 20 | 20.0% |
| Self-Employed (Incorporated) | 0 | 0.0% |
| Self-Employed (Not Incorporated) | 0 | 0.0% |
| Not-for-profit Organizations | 3 | 3.0% |
| Local Government Employees | 61 | 61.0% |
| State Government Employees | 0 | 0.0% |
| Federal Government Employees | 16 | 16.0% |
| Unpaid Family Workers | 0 | 0.0% |
| Total | 100 | 100.0% |
Employment Status by Age in Wanblee
According to the labor force statistics for Wanblee, out of the total population over 16 years of age (376), 34.3% or 129 individuals are in the labor force, with 22.5% or 29 of them unemployed. The age group with the highest labor force participation rate is 60 to 64 years, with 62.1% or 18 individuals in the labor force. Within the labor force, the 35 to 44 years age range has the highest percentage of unemployed individuals, with 47.5% or 19 of them being unemployed.
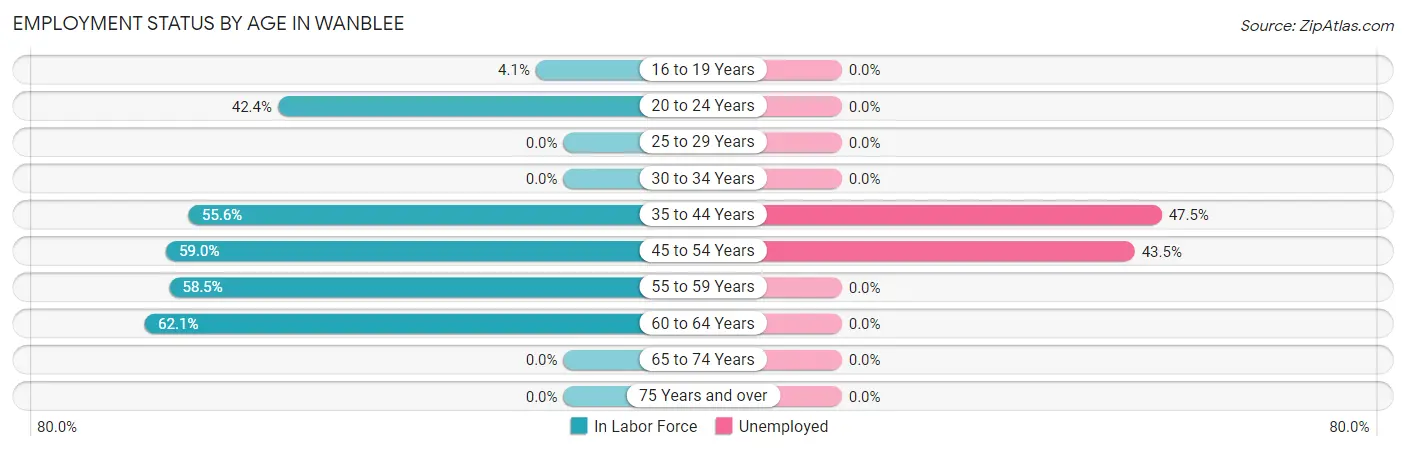
| Age Bracket | In Labor Force | Unemployed |
| 16 to 19 Years | 3 (4.1%) | 0 (0.0%) |
| 20 to 24 Years | 14 (42.4%) | 0 (0.0%) |
| 25 to 29 Years | 0 (0.0%) | 0 (0.0%) |
| 30 to 34 Years | 0 (0.0%) | 0 (0.0%) |
| 35 to 44 Years | 40 (55.6%) | 19 (47.5%) |
| 45 to 54 Years | 23 (59.0%) | 10 (43.5%) |
| 55 to 59 Years | 31 (58.5%) | 0 (0.0%) |
| 60 to 64 Years | 18 (62.1%) | 0 (0.0%) |
| 65 to 74 Years | 0 (0.0%) | 0 (0.0%) |
| 75 Years and over | 0 (0.0%) | 0 (0.0%) |
| Total | 129 (34.3%) | 29 (22.5%) |
Employment Status by Educational Attainment in Wanblee
According to labor force statistics for Wanblee, 43.9% of individuals (112) out of the total population between 25 and 64 years of age (255) are in the labor force, with 25.9% or 29 of them being unemployed. The group with the highest labor force participation rate are those with the educational attainment of bachelor's degree or higher, with 77.1% or 27 individuals in the labor force. Within the labor force, individuals with less than high school education have the highest percentage of unemployment, with 63.3% or 19 of them being unemployed.
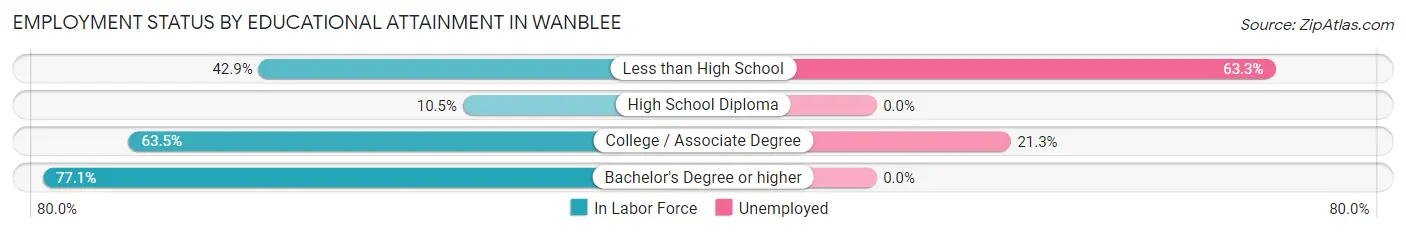
| Educational Attainment | In Labor Force | Unemployed |
| Less than High School | 30 (42.9%) | 44 (63.3%) |
| High School Diploma | 8 (10.5%) | 0 (0.0%) |
| College / Associate Degree | 47 (63.5%) | 16 (21.3%) |
| Bachelor's Degree or higher | 27 (77.1%) | 0 (0.0%) |
| Total | 112 (43.9%) | 66 (25.9%) |
Employment Occupations by Sex in Wanblee
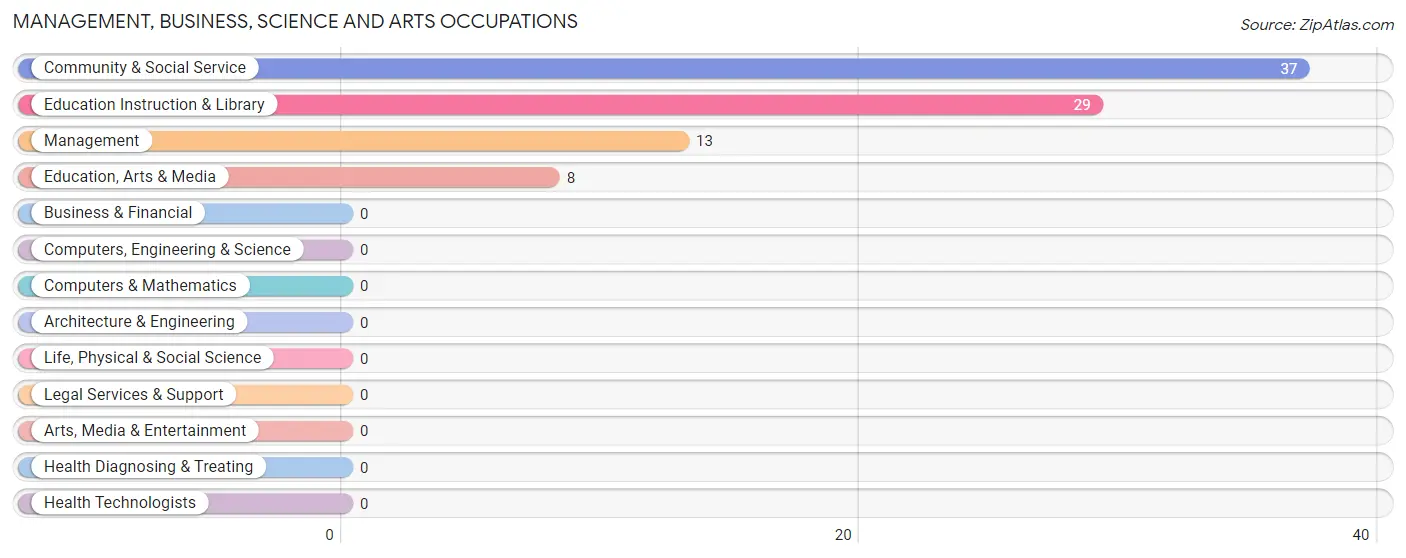
Management, Business, Science and Arts Occupations
The most common Management, Business, Science and Arts occupations in Wanblee are Community & Social Service (37 | 37.0%), Education Instruction & Library (29 | 29.0%), Management (13 | 13.0%), and Education, Arts & Media (8 | 8.0%).
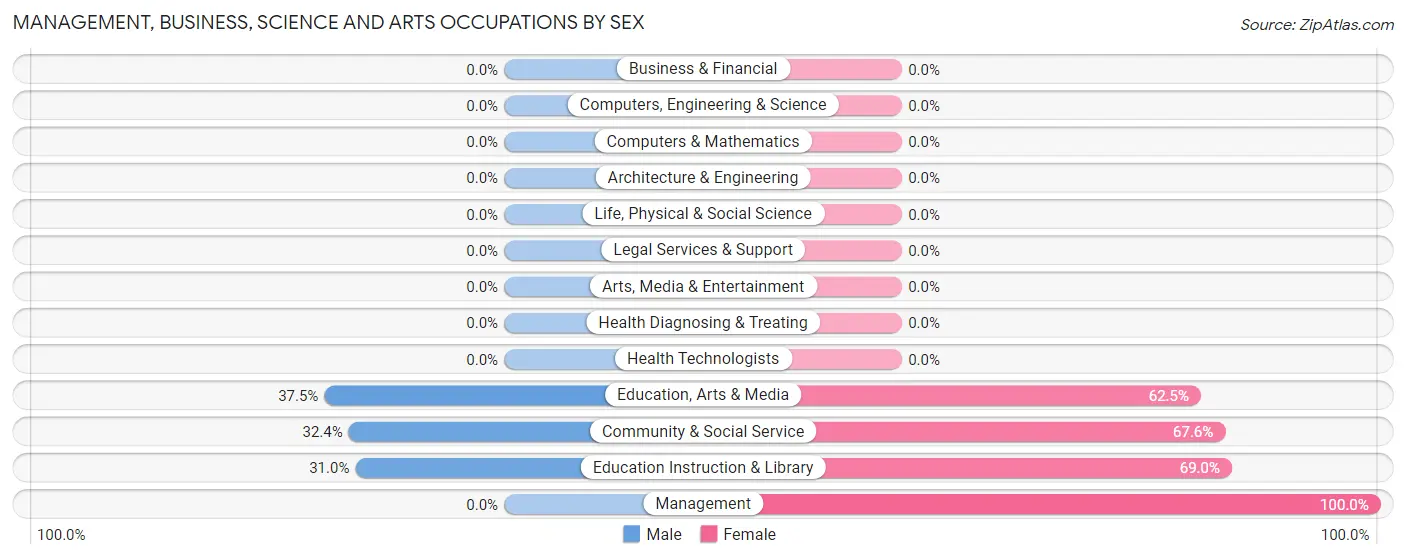
Management, Business, Science and Arts Occupations by Sex
Within the Management, Business, Science and Arts occupations in Wanblee, the most male-oriented occupations are Education, Arts & Media (37.5%), Community & Social Service (32.4%), and Education Instruction & Library (31.0%), while the most female-oriented occupations are Management (100.0%), Education Instruction & Library (69.0%), and Community & Social Service (67.6%).
| Occupation | Male | Female |
| Management | 0 (0.0%) | 13 (100.0%) |
| Business & Financial | 0 (0.0%) | 0 (0.0%) |
| Computers, Engineering & Science | 0 (0.0%) | 0 (0.0%) |
| Computers & Mathematics | 0 (0.0%) | 0 (0.0%) |
| Architecture & Engineering | 0 (0.0%) | 0 (0.0%) |
| Life, Physical & Social Science | 0 (0.0%) | 0 (0.0%) |
| Community & Social Service | 12 (32.4%) | 25 (67.6%) |
| Education, Arts & Media | 3 (37.5%) | 5 (62.5%) |
| Legal Services & Support | 0 (0.0%) | 0 (0.0%) |
| Education Instruction & Library | 9 (31.0%) | 20 (69.0%) |
| Arts, Media & Entertainment | 0 (0.0%) | 0 (0.0%) |
| Health Diagnosing & Treating | 0 (0.0%) | 0 (0.0%) |
| Health Technologists | 0 (0.0%) | 0 (0.0%) |
| Total (Category) | 12 (24.0%) | 38 (76.0%) |
| Total (Overall) | 28 (28.0%) | 72 (72.0%) |
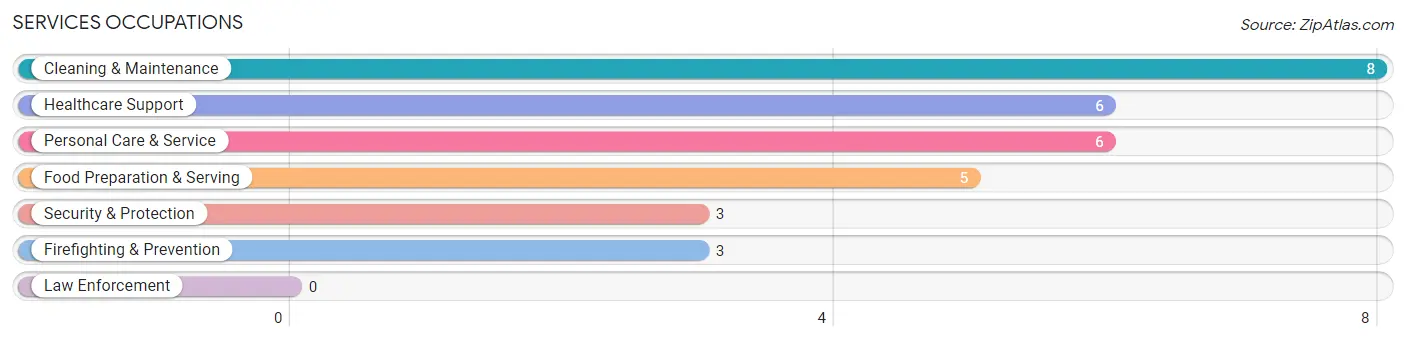
Services Occupations
The most common Services occupations in Wanblee are Cleaning & Maintenance (8 | 8.0%), Healthcare Support (6 | 6.0%), Personal Care & Service (6 | 6.0%), Food Preparation & Serving (5 | 5.0%), and Security & Protection (3 | 3.0%).
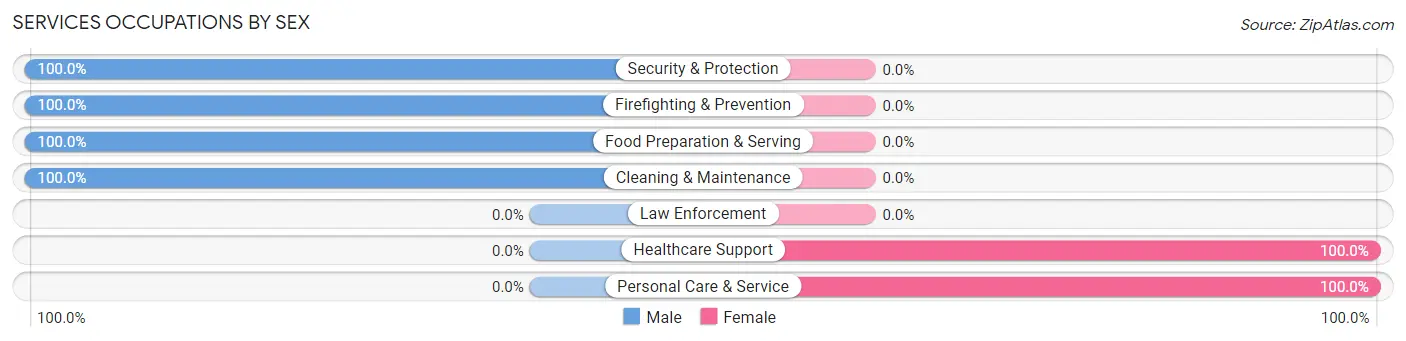
Services Occupations by Sex
Within the Services occupations in Wanblee, the most male-oriented occupations are Security & Protection (100.0%), Firefighting & Prevention (100.0%), and Food Preparation & Serving (100.0%), while the most female-oriented occupations are Healthcare Support (100.0%), and Personal Care & Service (100.0%).
| Occupation | Male | Female |
| Healthcare Support | 0 (0.0%) | 6 (100.0%) |
| Security & Protection | 3 (100.0%) | 0 (0.0%) |
| Firefighting & Prevention | 3 (100.0%) | 0 (0.0%) |
| Law Enforcement | 0 (0.0%) | 0 (0.0%) |
| Food Preparation & Serving | 5 (100.0%) | 0 (0.0%) |
| Cleaning & Maintenance | 8 (100.0%) | 0 (0.0%) |
| Personal Care & Service | 0 (0.0%) | 6 (100.0%) |
| Total (Category) | 16 (57.1%) | 12 (42.9%) |
| Total (Overall) | 28 (28.0%) | 72 (72.0%) |
Sales and Office Occupations
The most common Sales and Office occupations in Wanblee are , and Office & Administration (22 | 22.0%).
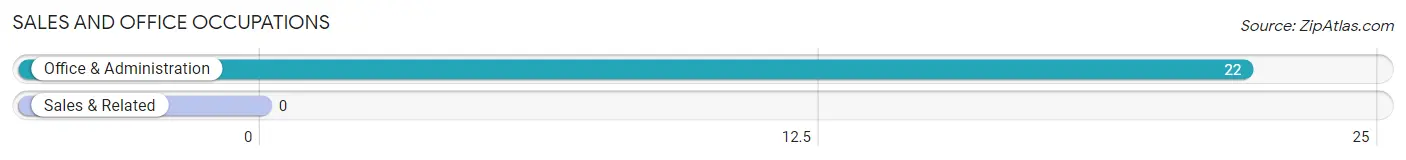
Sales and Office Occupations by Sex
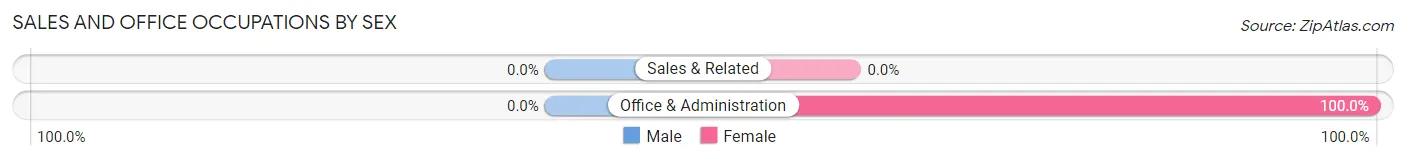
| Occupation | Male | Female |
| Sales & Related | 0 (0.0%) | 0 (0.0%) |
| Office & Administration | 0 (0.0%) | 22 (100.0%) |
| Total (Category) | 0 (0.0%) | 22 (100.0%) |
| Total (Overall) | 28 (28.0%) | 72 (72.0%) |
Natural Resources, Construction and Maintenance Occupations
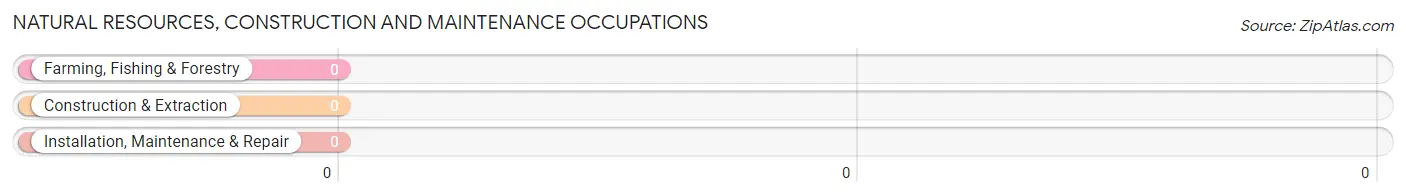
Natural Resources, Construction and Maintenance Occupations by Sex
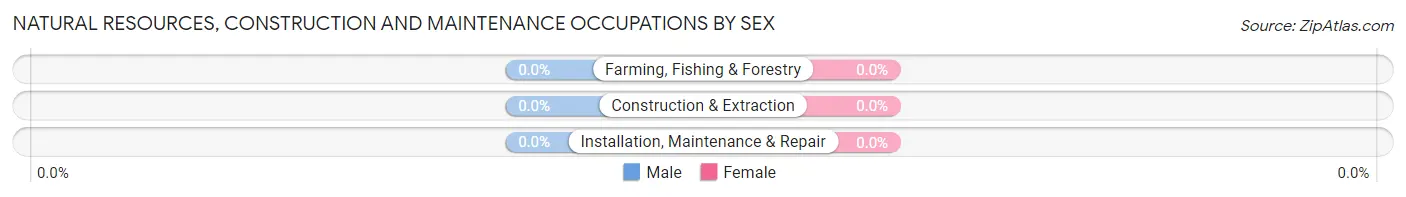
| Occupation | Male | Female |
| Farming, Fishing & Forestry | 0 (0.0%) | 0 (0.0%) |
| Construction & Extraction | 0 (0.0%) | 0 (0.0%) |
| Installation, Maintenance & Repair | 0 (0.0%) | 0 (0.0%) |
| Total (Category) | 0 (0.0%) | 0 (0.0%) |
| Total (Overall) | 28 (28.0%) | 72 (72.0%) |
Production, Transportation and Moving Occupations
Production, Transportation and Moving Occupations by Sex
| Occupation | Male | Female |
| Production | 0 (0.0%) | 0 (0.0%) |
| Transportation | 0 (0.0%) | 0 (0.0%) |
| Material Moving | 0 (0.0%) | 0 (0.0%) |
| Total (Category) | 0 (0.0%) | 0 (0.0%) |
| Total (Overall) | 28 (28.0%) | 72 (72.0%) |
Employment Industries by Sex in Wanblee
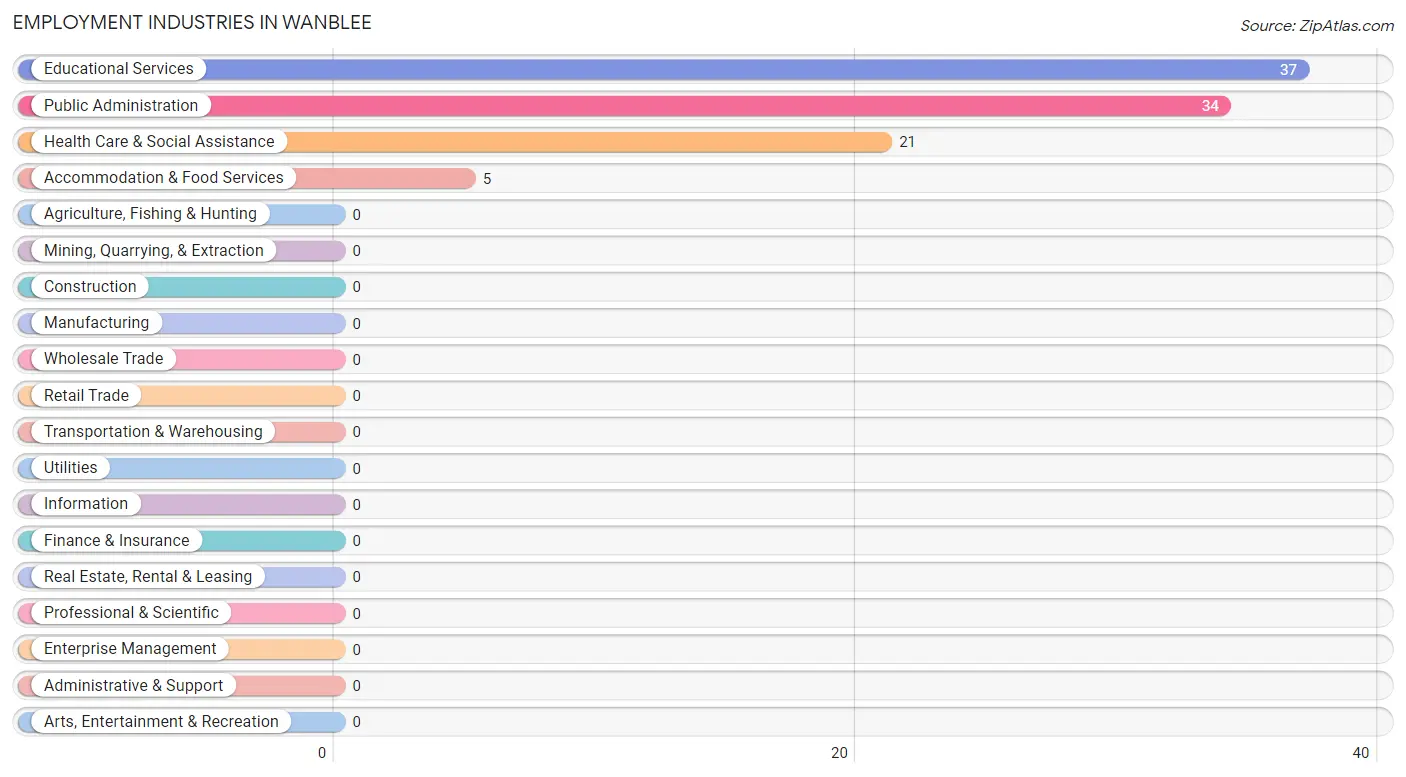
Employment Industries in Wanblee
The major employment industries in Wanblee include Educational Services (37 | 37.0%), Public Administration (34 | 34.0%), Health Care & Social Assistance (21 | 21.0%), and Accommodation & Food Services (5 | 5.0%).
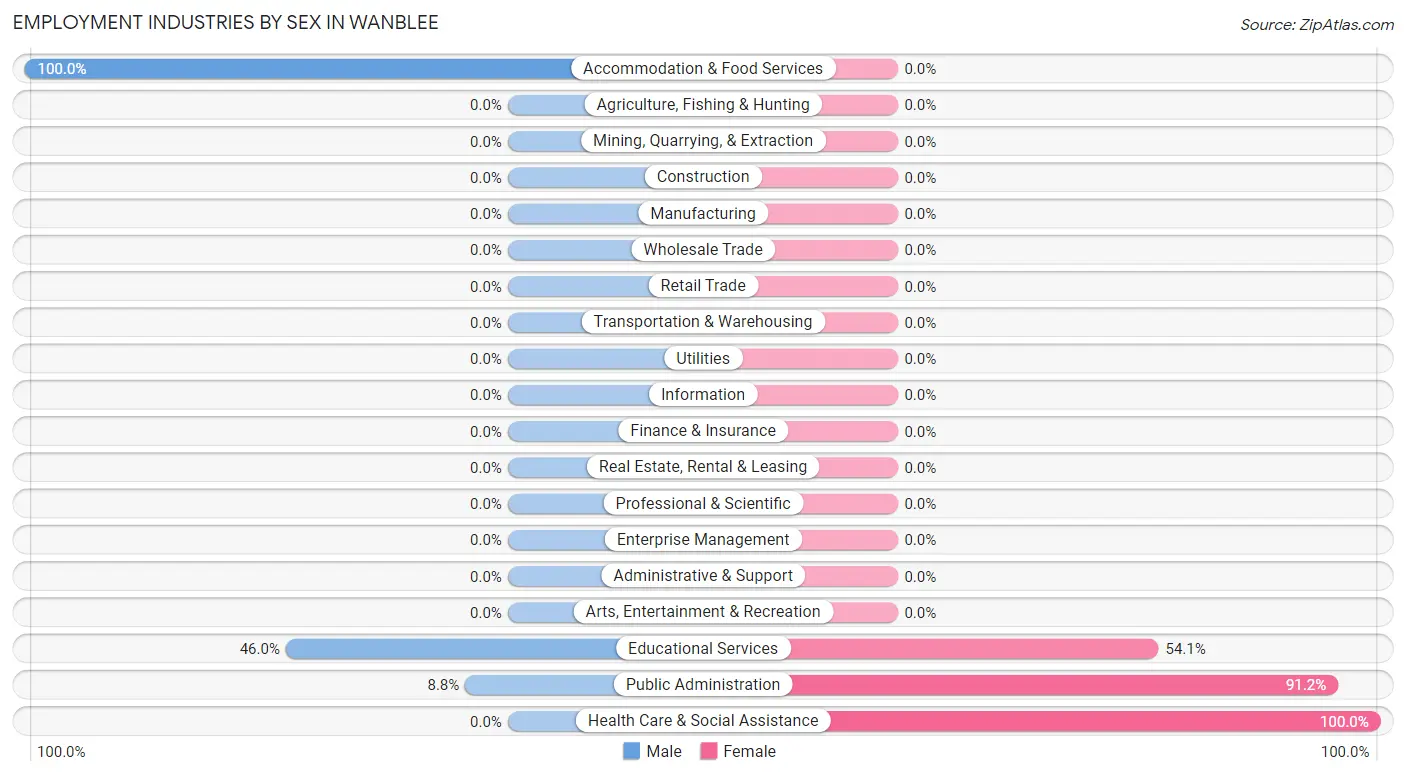
Employment Industries by Sex in Wanblee
The Wanblee industries that see more men than women are Accommodation & Food Services (100.0%), Educational Services (46.0%), and Public Administration (8.8%), whereas the industries that tend to have a higher number of women are Health Care & Social Assistance (100.0%), Public Administration (91.2%), and Educational Services (54.0%).
| Industry | Male | Female |
| Agriculture, Fishing & Hunting | 0 (0.0%) | 0 (0.0%) |
| Mining, Quarrying, & Extraction | 0 (0.0%) | 0 (0.0%) |
| Construction | 0 (0.0%) | 0 (0.0%) |
| Manufacturing | 0 (0.0%) | 0 (0.0%) |
| Wholesale Trade | 0 (0.0%) | 0 (0.0%) |
| Retail Trade | 0 (0.0%) | 0 (0.0%) |
| Transportation & Warehousing | 0 (0.0%) | 0 (0.0%) |
| Utilities | 0 (0.0%) | 0 (0.0%) |
| Information | 0 (0.0%) | 0 (0.0%) |
| Finance & Insurance | 0 (0.0%) | 0 (0.0%) |
| Real Estate, Rental & Leasing | 0 (0.0%) | 0 (0.0%) |
| Professional & Scientific | 0 (0.0%) | 0 (0.0%) |
| Enterprise Management | 0 (0.0%) | 0 (0.0%) |
| Administrative & Support | 0 (0.0%) | 0 (0.0%) |
| Educational Services | 17 (46.0%) | 20 (54.0%) |
| Health Care & Social Assistance | 0 (0.0%) | 21 (100.0%) |
| Arts, Entertainment & Recreation | 0 (0.0%) | 0 (0.0%) |
| Accommodation & Food Services | 5 (100.0%) | 0 (0.0%) |
| Public Administration | 3 (8.8%) | 31 (91.2%) |
| Total | 28 (28.0%) | 72 (72.0%) |
Education in Wanblee
School Enrollment in Wanblee
The most common levels of schooling among the 254 students in Wanblee are elementary school (97 | 38.2%), middle school (60 | 23.6%), and high school (50 | 19.7%).
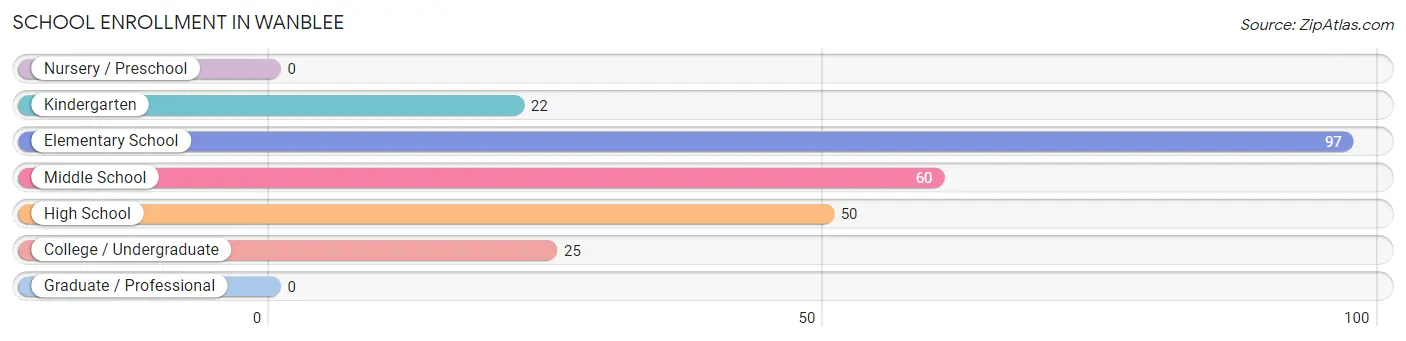
| School Level | # Students | % Students |
| Nursery / Preschool | 0 | 0.0% |
| Kindergarten | 22 | 8.7% |
| Elementary School | 97 | 38.2% |
| Middle School | 60 | 23.6% |
| High School | 50 | 19.7% |
| College / Undergraduate | 25 | 9.8% |
| Graduate / Professional | 0 | 0.0% |
| Total | 254 | 100.0% |
School Enrollment by Age by Funding Source in Wanblee
Out of a total of 254 students who are enrolled in schools in Wanblee, 6 (2.4%) attend a private institution, while the remaining 248 (97.6%) are enrolled in public schools. The age group of 10 to 14 year olds has the highest likelihood of being enrolled in private schools, with 6 (7.1% in the age bracket) enrolled. Conversely, the age group of 3 to 4 year olds has the lowest likelihood of being enrolled in a private school, with 7 (100.0% in the age bracket) attending a public institution.
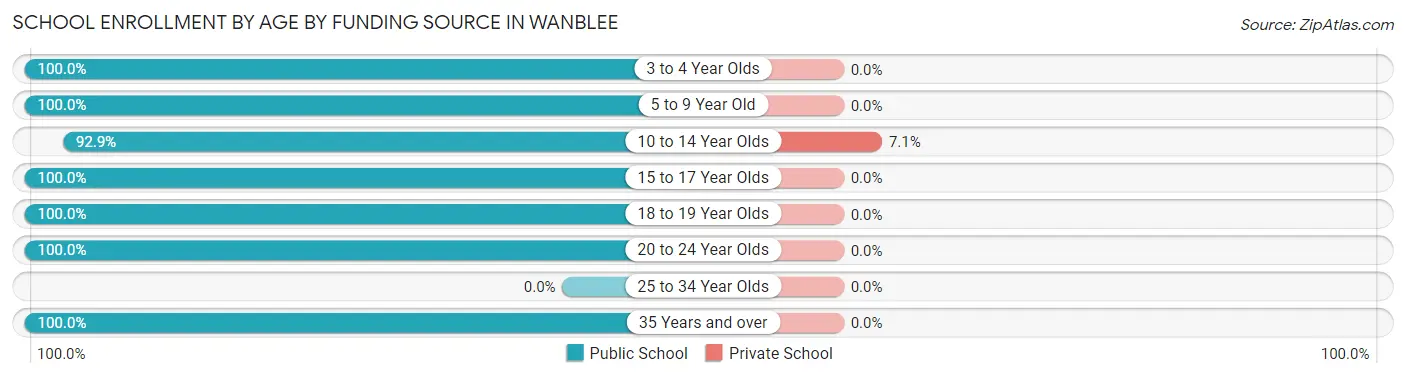
| Age Bracket | Public School | Private School |
| 3 to 4 Year Olds | 7 (100.0%) | 0 (0.0%) |
| 5 to 9 Year Old | 99 (100.0%) | 0 (0.0%) |
| 10 to 14 Year Olds | 78 (92.9%) | 6 (7.1%) |
| 15 to 17 Year Olds | 31 (100.0%) | 0 (0.0%) |
| 18 to 19 Year Olds | 5 (100.0%) | 0 (0.0%) |
| 20 to 24 Year Olds | 19 (100.0%) | 0 (0.0%) |
| 25 to 34 Year Olds | 0 (0.0%) | 0 (0.0%) |
| 35 Years and over | 9 (100.0%) | 0 (0.0%) |
| Total | 248 (97.6%) | 6 (2.4%) |
Educational Attainment by Field of Study in Wanblee
Social sciences (17 | 38.6%), arts & humanities (13 | 29.5%), liberal arts & history (9 | 20.4%), and engineering (5 | 11.4%) are the most common fields of study among 44 individuals in Wanblee who have obtained a bachelor's degree or higher.
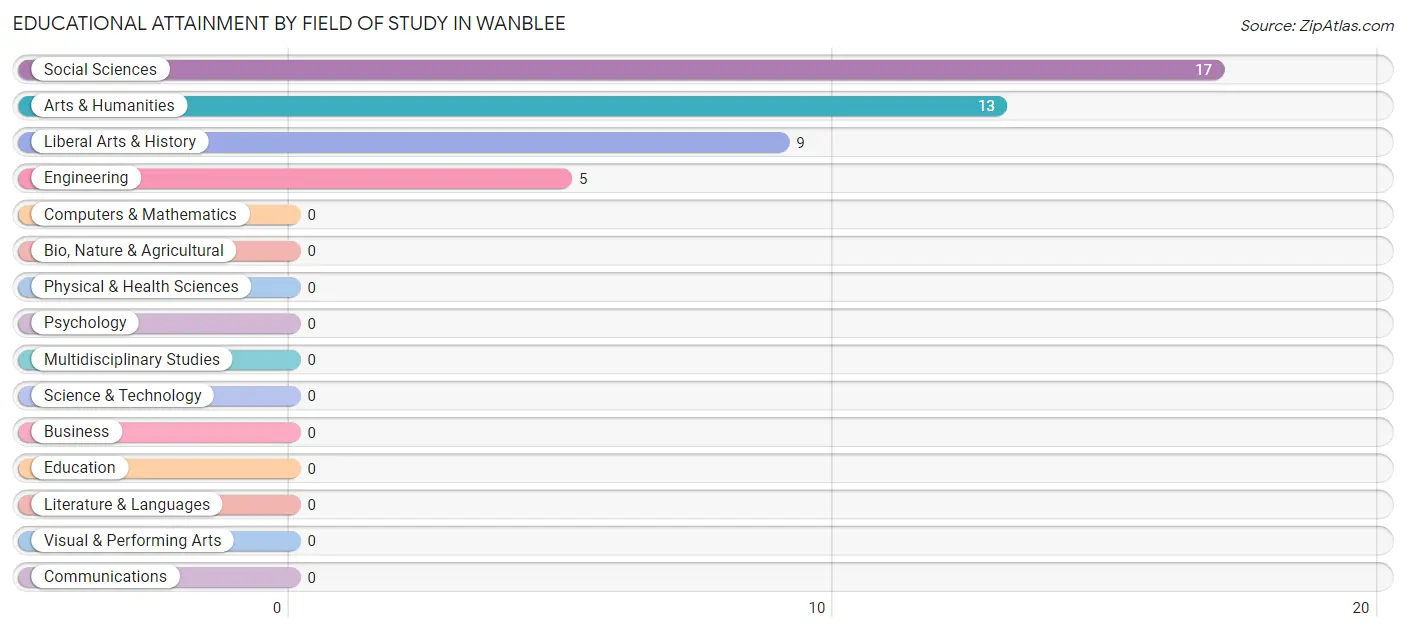
| Field of Study | # Graduates | % Graduates |
| Computers & Mathematics | 0 | 0.0% |
| Bio, Nature & Agricultural | 0 | 0.0% |
| Physical & Health Sciences | 0 | 0.0% |
| Psychology | 0 | 0.0% |
| Social Sciences | 17 | 38.6% |
| Engineering | 5 | 11.4% |
| Multidisciplinary Studies | 0 | 0.0% |
| Science & Technology | 0 | 0.0% |
| Business | 0 | 0.0% |
| Education | 0 | 0.0% |
| Literature & Languages | 0 | 0.0% |
| Liberal Arts & History | 9 | 20.4% |
| Visual & Performing Arts | 0 | 0.0% |
| Communications | 0 | 0.0% |
| Arts & Humanities | 13 | 29.5% |
| Total | 44 | 100.0% |
Transportation & Commute in Wanblee
Vehicle Availability by Sex in Wanblee
The most prevalent vehicle ownership categories in Wanblee are males with 2 vehicles (14, accounting for 63.6%) and females with 2 vehicles (25, making up 19.4%).
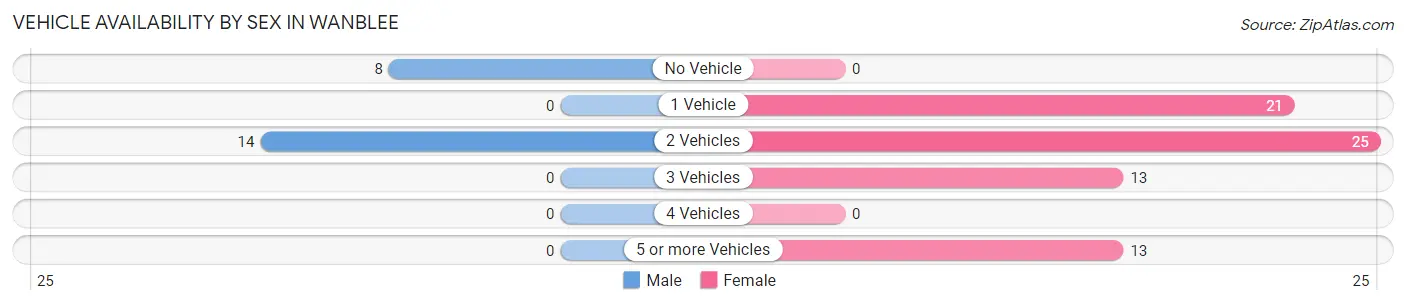
| Vehicles Available | Male | Female |
| No Vehicle | 8 (36.4%) | 0 (0.0%) |
| 1 Vehicle | 0 (0.0%) | 21 (29.2%) |
| 2 Vehicles | 14 (63.6%) | 25 (34.7%) |
| 3 Vehicles | 0 (0.0%) | 13 (18.1%) |
| 4 Vehicles | 0 (0.0%) | 0 (0.0%) |
| 5 or more Vehicles | 0 (0.0%) | 13 (18.1%) |
| Total | 22 (100.0%) | 72 (100.0%) |
Commute Time in Wanblee
The most frequently occuring commute durations in Wanblee are 5 to 9 minutes (53 commuters, 76.8%), 15 to 19 minutes (8 commuters, 11.6%), and less than 5 minutes (5 commuters, 7.2%).
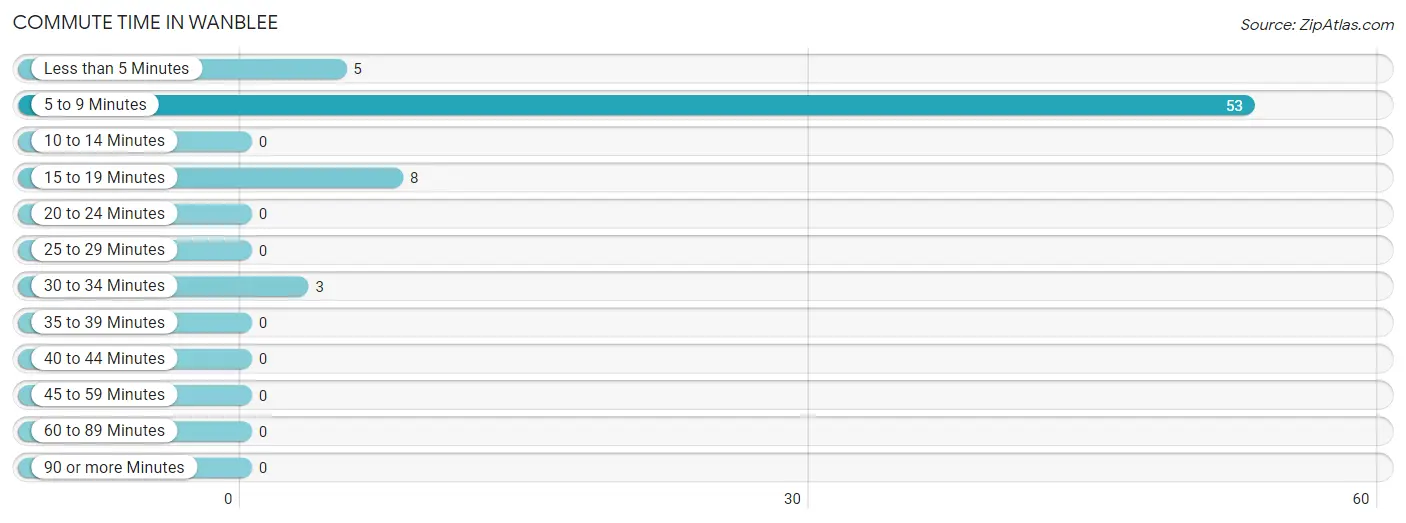
| Commute Time | # Commuters | % Commuters |
| Less than 5 Minutes | 5 | 7.2% |
| 5 to 9 Minutes | 53 | 76.8% |
| 10 to 14 Minutes | 0 | 0.0% |
| 15 to 19 Minutes | 8 | 11.6% |
| 20 to 24 Minutes | 0 | 0.0% |
| 25 to 29 Minutes | 0 | 0.0% |
| 30 to 34 Minutes | 3 | 4.3% |
| 35 to 39 Minutes | 0 | 0.0% |
| 40 to 44 Minutes | 0 | 0.0% |
| 45 to 59 Minutes | 0 | 0.0% |
| 60 to 89 Minutes | 0 | 0.0% |
| 90 or more Minutes | 0 | 0.0% |
Commute Time by Sex in Wanblee
The most common commute times in Wanblee are 15 to 19 minutes (8 commuters, 50.0%) for males and 5 to 9 minutes (53 commuters, 100.0%) for females.
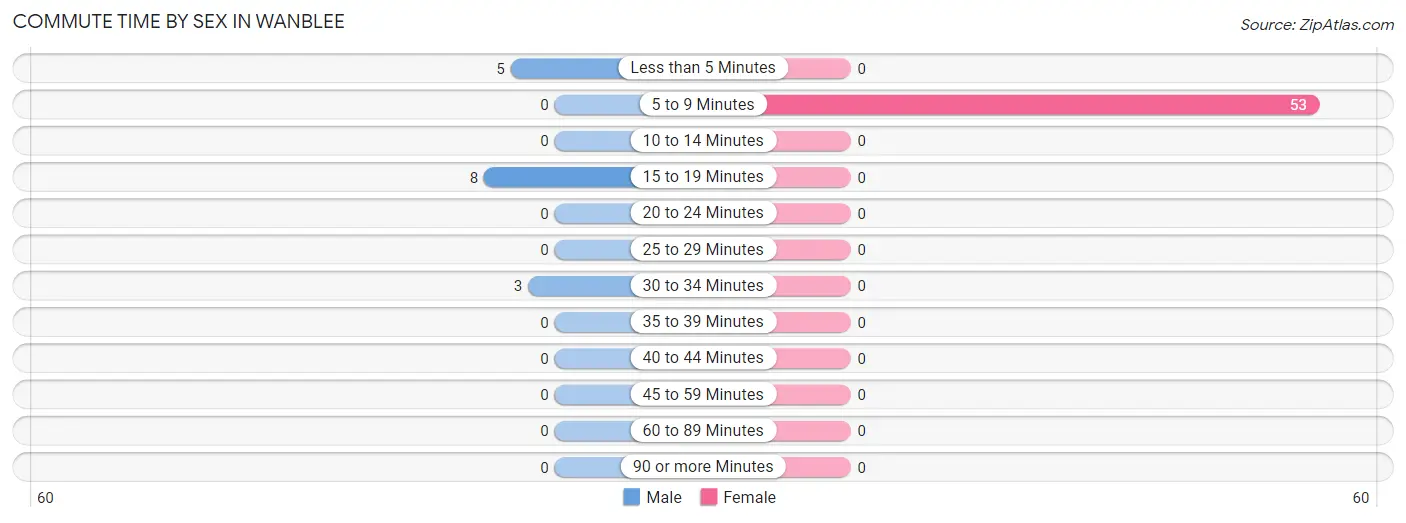
| Commute Time | Male | Female |
| Less than 5 Minutes | 5 (31.2%) | 0 (0.0%) |
| 5 to 9 Minutes | 0 (0.0%) | 53 (100.0%) |
| 10 to 14 Minutes | 0 (0.0%) | 0 (0.0%) |
| 15 to 19 Minutes | 8 (50.0%) | 0 (0.0%) |
| 20 to 24 Minutes | 0 (0.0%) | 0 (0.0%) |
| 25 to 29 Minutes | 0 (0.0%) | 0 (0.0%) |
| 30 to 34 Minutes | 3 (18.8%) | 0 (0.0%) |
| 35 to 39 Minutes | 0 (0.0%) | 0 (0.0%) |
| 40 to 44 Minutes | 0 (0.0%) | 0 (0.0%) |
| 45 to 59 Minutes | 0 (0.0%) | 0 (0.0%) |
| 60 to 89 Minutes | 0 (0.0%) | 0 (0.0%) |
| 90 or more Minutes | 0 (0.0%) | 0 (0.0%) |
Time of Departure to Work by Sex in Wanblee
The most frequent times of departure to work in Wanblee are 7:00 AM to 7:29 AM (8, 50.0%) for males and 7:30 AM to 7:59 AM (53, 100.0%) for females.
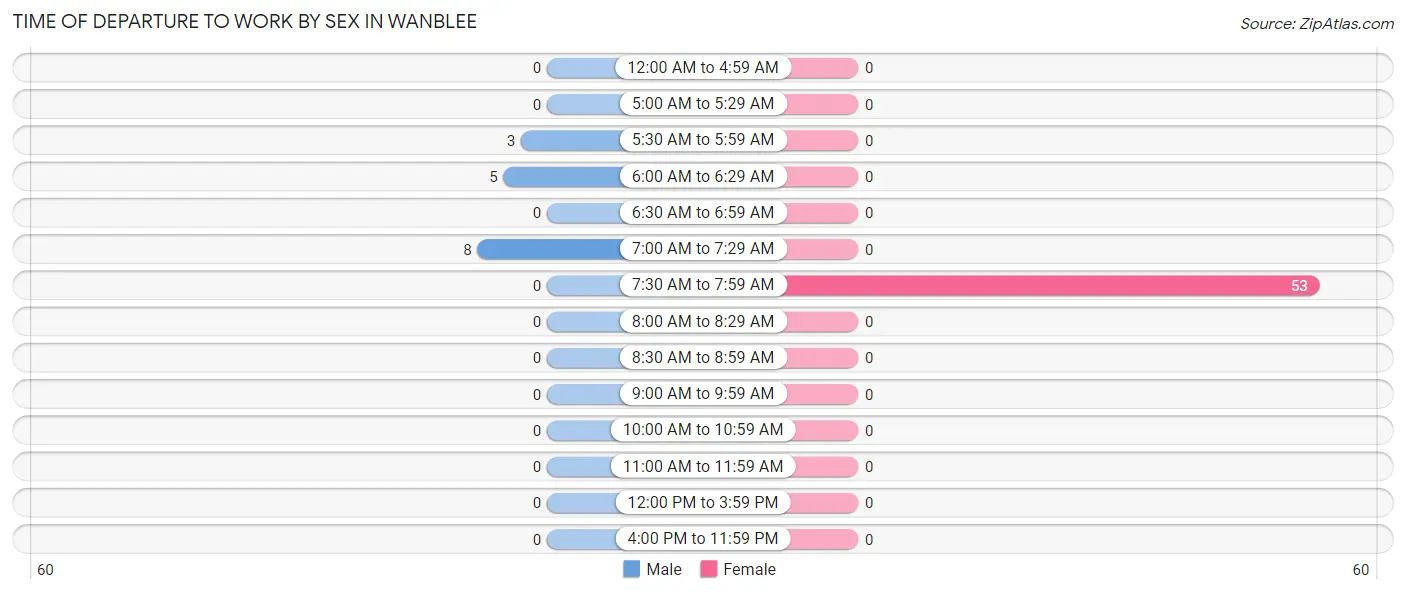
| Time of Departure | Male | Female |
| 12:00 AM to 4:59 AM | 0 (0.0%) | 0 (0.0%) |
| 5:00 AM to 5:29 AM | 0 (0.0%) | 0 (0.0%) |
| 5:30 AM to 5:59 AM | 3 (18.8%) | 0 (0.0%) |
| 6:00 AM to 6:29 AM | 5 (31.2%) | 0 (0.0%) |
| 6:30 AM to 6:59 AM | 0 (0.0%) | 0 (0.0%) |
| 7:00 AM to 7:29 AM | 8 (50.0%) | 0 (0.0%) |
| 7:30 AM to 7:59 AM | 0 (0.0%) | 53 (100.0%) |
| 8:00 AM to 8:29 AM | 0 (0.0%) | 0 (0.0%) |
| 8:30 AM to 8:59 AM | 0 (0.0%) | 0 (0.0%) |
| 9:00 AM to 9:59 AM | 0 (0.0%) | 0 (0.0%) |
| 10:00 AM to 10:59 AM | 0 (0.0%) | 0 (0.0%) |
| 11:00 AM to 11:59 AM | 0 (0.0%) | 0 (0.0%) |
| 12:00 PM to 3:59 PM | 0 (0.0%) | 0 (0.0%) |
| 4:00 PM to 11:59 PM | 0 (0.0%) | 0 (0.0%) |
| Total | 16 (100.0%) | 53 (100.0%) |
Housing Occupancy in Wanblee
Occupancy by Ownership in Wanblee
Of the total 108 dwellings in Wanblee, owner-occupied units account for 24 (22.2%), while renter-occupied units make up 84 (77.8%).
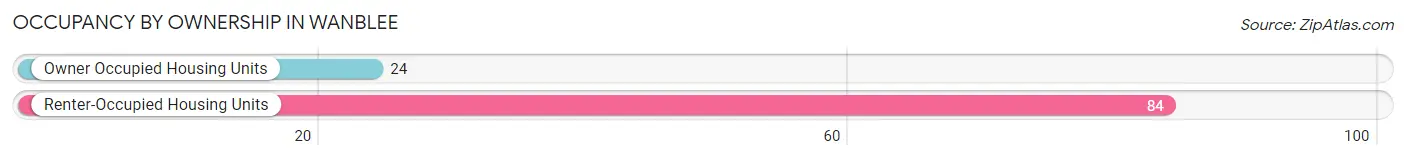
| Occupancy | # Housing Units | % Housing Units |
| Owner Occupied Housing Units | 24 | 22.2% |
| Renter-Occupied Housing Units | 84 | 77.8% |
| Total Occupied Housing Units | 108 | 100.0% |
Occupancy by Household Size in Wanblee
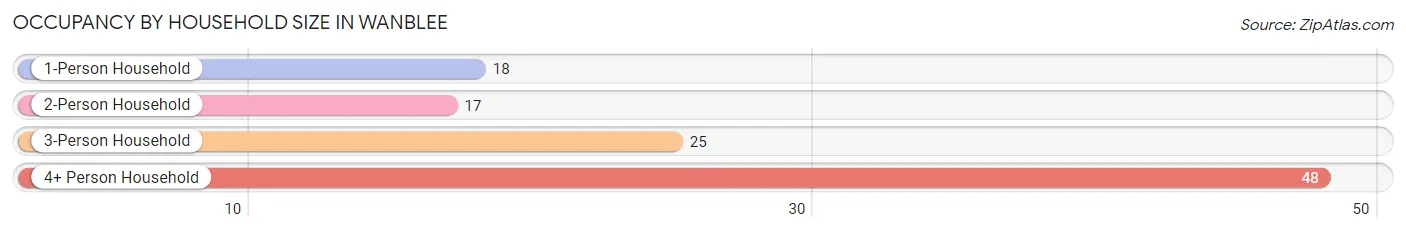
| Household Size | # Housing Units | % Housing Units |
| 1-Person Household | 18 | 16.7% |
| 2-Person Household | 17 | 15.7% |
| 3-Person Household | 25 | 23.2% |
| 4+ Person Household | 48 | 44.4% |
| Total Housing Units | 108 | 100.0% |
Occupancy by Ownership by Household Size in Wanblee
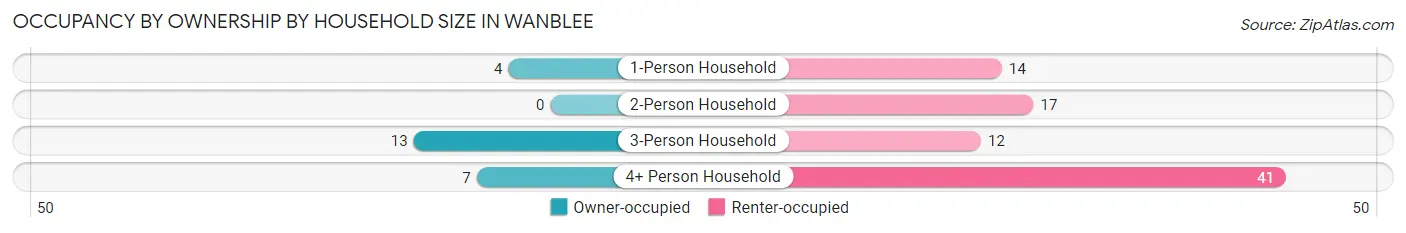
| Household Size | Owner-occupied | Renter-occupied |
| 1-Person Household | 4 (22.2%) | 14 (77.8%) |
| 2-Person Household | 0 (0.0%) | 17 (100.0%) |
| 3-Person Household | 13 (52.0%) | 12 (48.0%) |
| 4+ Person Household | 7 (14.6%) | 41 (85.4%) |
| Total Housing Units | 24 (22.2%) | 84 (77.8%) |
Occupancy by Educational Attainment in Wanblee
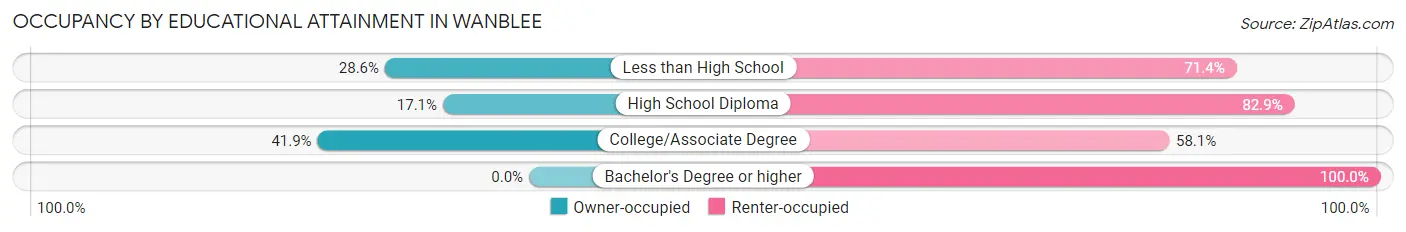
| Household Size | Owner-occupied | Renter-occupied |
| Less than High School | 4 (28.6%) | 10 (71.4%) |
| High School Diploma | 7 (17.1%) | 34 (82.9%) |
| College/Associate Degree | 13 (41.9%) | 18 (58.1%) |
| Bachelor's Degree or higher | 0 (0.0%) | 22 (100.0%) |
Occupancy by Age of Householder in Wanblee
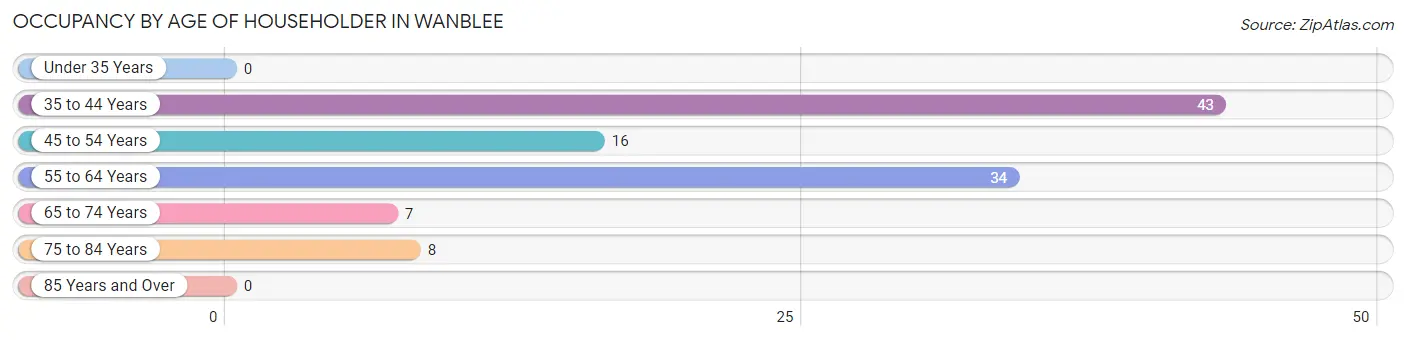
| Age Bracket | # Households | % Households |
| Under 35 Years | 0 | 0.0% |
| 35 to 44 Years | 43 | 39.8% |
| 45 to 54 Years | 16 | 14.8% |
| 55 to 64 Years | 34 | 31.5% |
| 65 to 74 Years | 7 | 6.5% |
| 75 to 84 Years | 8 | 7.4% |
| 85 Years and Over | 0 | 0.0% |
| Total | 108 | 100.0% |
Housing Finances in Wanblee
Median Income by Occupancy in Wanblee
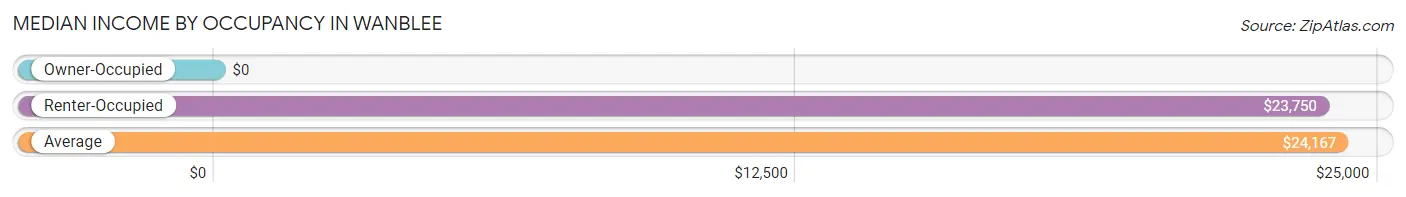
| Occupancy Type | # Households | Median Income |
| Owner-Occupied | 24 (22.2%) | $0 |
| Renter-Occupied | 84 (77.8%) | $23,750 |
| Average | 108 (100.0%) | $24,167 |
Occupancy by Householder Income Bracket in Wanblee
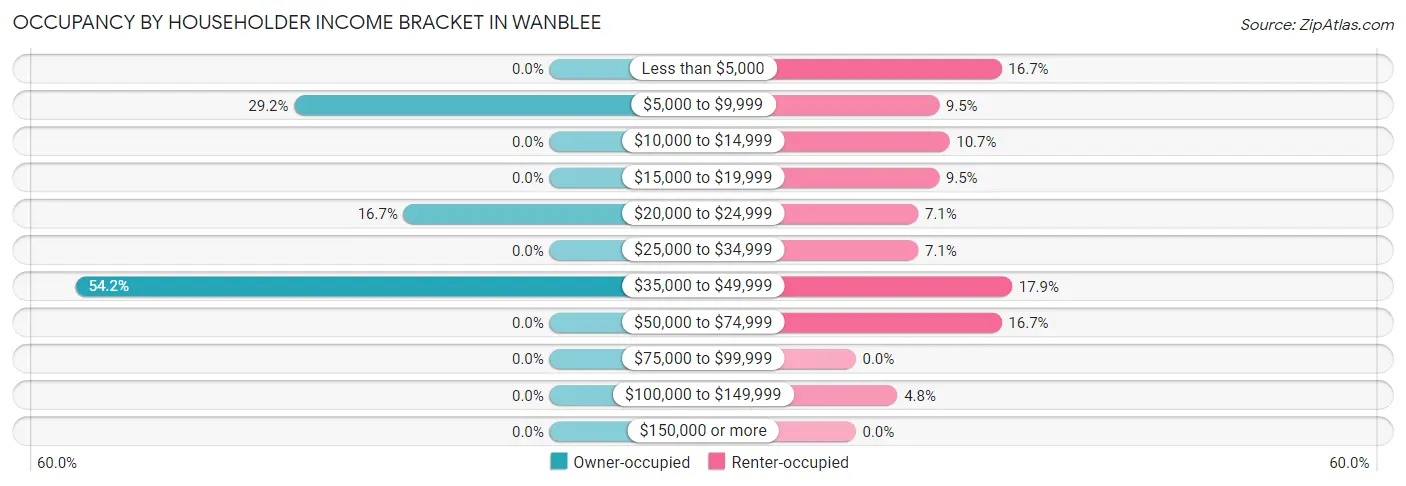
| Income Bracket | Owner-occupied | Renter-occupied |
| Less than $5,000 | 0 (0.0%) | 14 (16.7%) |
| $5,000 to $9,999 | 7 (29.2%) | 8 (9.5%) |
| $10,000 to $14,999 | 0 (0.0%) | 9 (10.7%) |
| $15,000 to $19,999 | 0 (0.0%) | 8 (9.5%) |
| $20,000 to $24,999 | 4 (16.7%) | 6 (7.1%) |
| $25,000 to $34,999 | 0 (0.0%) | 6 (7.1%) |
| $35,000 to $49,999 | 13 (54.2%) | 15 (17.9%) |
| $50,000 to $74,999 | 0 (0.0%) | 14 (16.7%) |
| $75,000 to $99,999 | 0 (0.0%) | 0 (0.0%) |
| $100,000 to $149,999 | 0 (0.0%) | 4 (4.8%) |
| $150,000 or more | 0 (0.0%) | 0 (0.0%) |
| Total | 24 (100.0%) | 84 (100.0%) |
Monthly Housing Cost Tiers in Wanblee
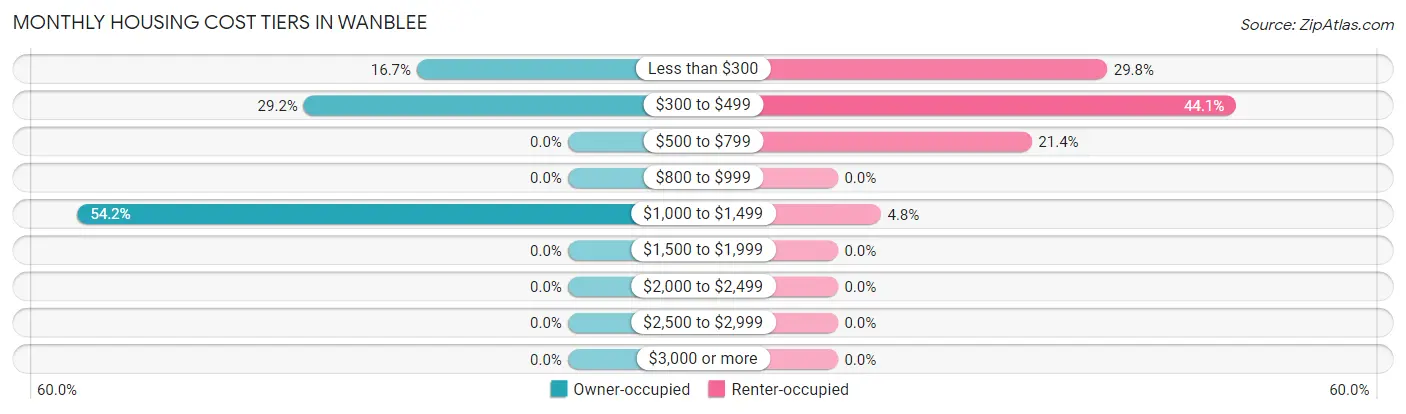
| Monthly Cost | Owner-occupied | Renter-occupied |
| Less than $300 | 4 (16.7%) | 25 (29.8%) |
| $300 to $499 | 7 (29.2%) | 37 (44.1%) |
| $500 to $799 | 0 (0.0%) | 18 (21.4%) |
| $800 to $999 | 0 (0.0%) | 0 (0.0%) |
| $1,000 to $1,499 | 13 (54.2%) | 4 (4.8%) |
| $1,500 to $1,999 | 0 (0.0%) | 0 (0.0%) |
| $2,000 to $2,499 | 0 (0.0%) | 0 (0.0%) |
| $2,500 to $2,999 | 0 (0.0%) | 0 (0.0%) |
| $3,000 or more | 0 (0.0%) | 0 (0.0%) |
| Total | 24 (100.0%) | 84 (100.0%) |
Physical Housing Characteristics in Wanblee
Housing Structures in Wanblee
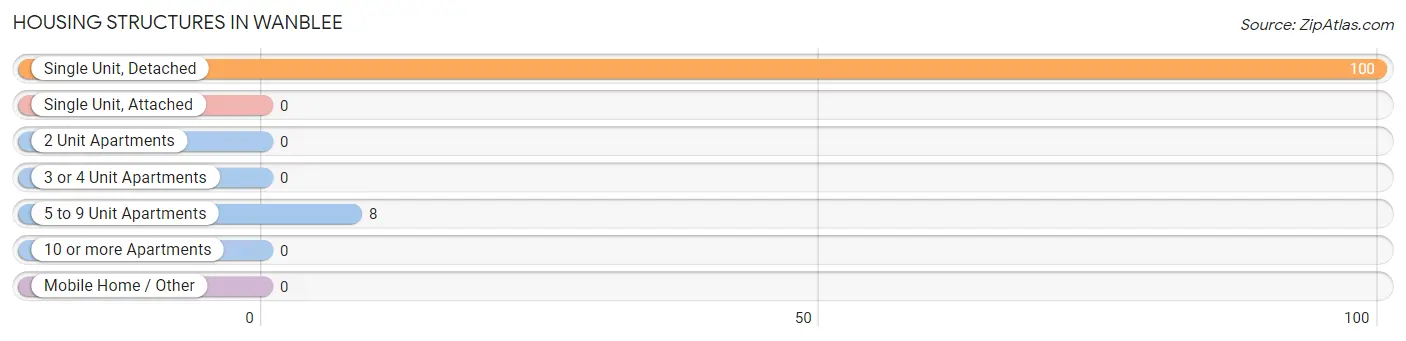
| Structure Type | # Housing Units | % Housing Units |
| Single Unit, Detached | 100 | 92.6% |
| Single Unit, Attached | 0 | 0.0% |
| 2 Unit Apartments | 0 | 0.0% |
| 3 or 4 Unit Apartments | 0 | 0.0% |
| 5 to 9 Unit Apartments | 8 | 7.4% |
| 10 or more Apartments | 0 | 0.0% |
| Mobile Home / Other | 0 | 0.0% |
| Total | 108 | 100.0% |
Housing Structures by Occupancy in Wanblee
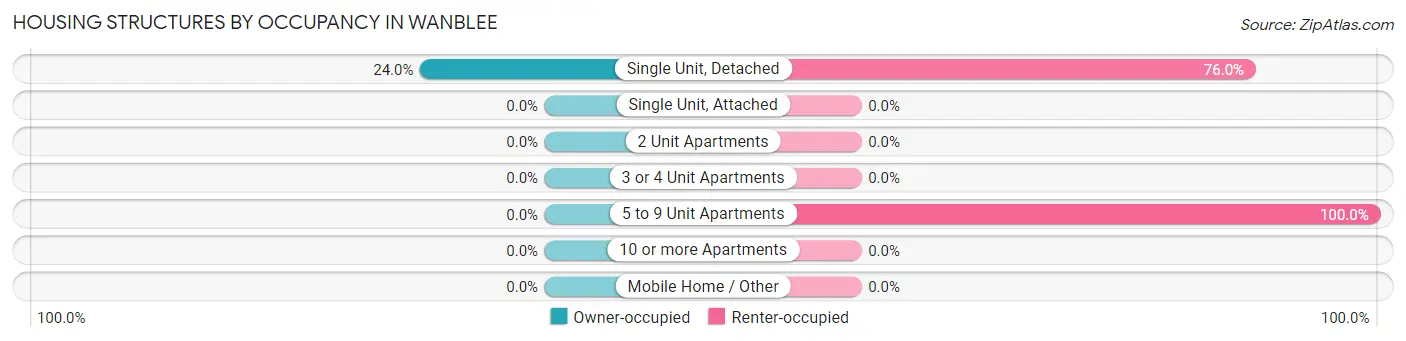
| Structure Type | Owner-occupied | Renter-occupied |
| Single Unit, Detached | 24 (24.0%) | 76 (76.0%) |
| Single Unit, Attached | 0 (0.0%) | 0 (0.0%) |
| 2 Unit Apartments | 0 (0.0%) | 0 (0.0%) |
| 3 or 4 Unit Apartments | 0 (0.0%) | 0 (0.0%) |
| 5 to 9 Unit Apartments | 0 (0.0%) | 8 (100.0%) |
| 10 or more Apartments | 0 (0.0%) | 0 (0.0%) |
| Mobile Home / Other | 0 (0.0%) | 0 (0.0%) |
| Total | 24 (22.2%) | 84 (77.8%) |
Housing Structures by Number of Rooms in Wanblee
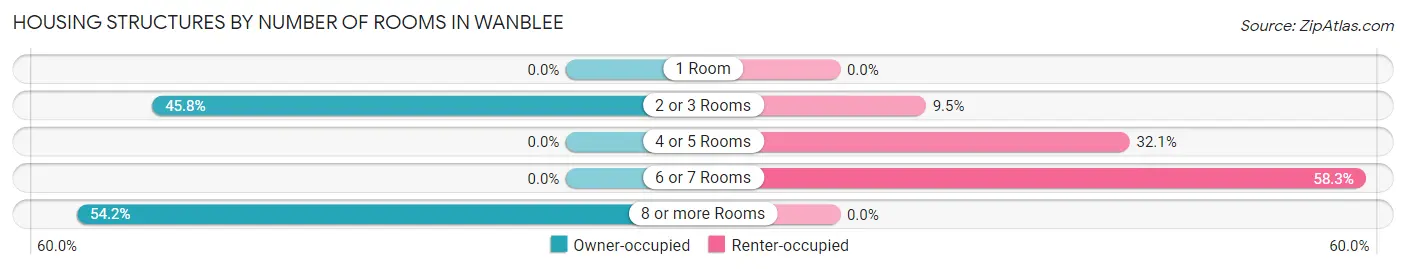
| Number of Rooms | Owner-occupied | Renter-occupied |
| 1 Room | 0 (0.0%) | 0 (0.0%) |
| 2 or 3 Rooms | 11 (45.8%) | 8 (9.5%) |
| 4 or 5 Rooms | 0 (0.0%) | 27 (32.1%) |
| 6 or 7 Rooms | 0 (0.0%) | 49 (58.3%) |
| 8 or more Rooms | 13 (54.2%) | 0 (0.0%) |
| Total | 24 (100.0%) | 84 (100.0%) |
Housing Structure by Heating Type in Wanblee
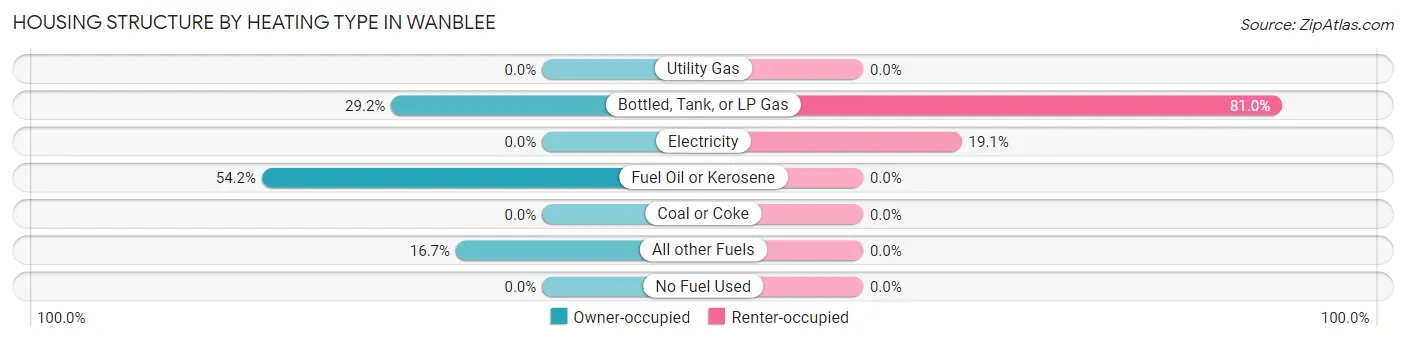
| Heating Type | Owner-occupied | Renter-occupied |
| Utility Gas | 0 (0.0%) | 0 (0.0%) |
| Bottled, Tank, or LP Gas | 7 (29.2%) | 68 (80.9%) |
| Electricity | 0 (0.0%) | 16 (19.1%) |
| Fuel Oil or Kerosene | 13 (54.2%) | 0 (0.0%) |
| Coal or Coke | 0 (0.0%) | 0 (0.0%) |
| All other Fuels | 4 (16.7%) | 0 (0.0%) |
| No Fuel Used | 0 (0.0%) | 0 (0.0%) |
| Total | 24 (100.0%) | 84 (100.0%) |
Household Vehicle Usage in Wanblee
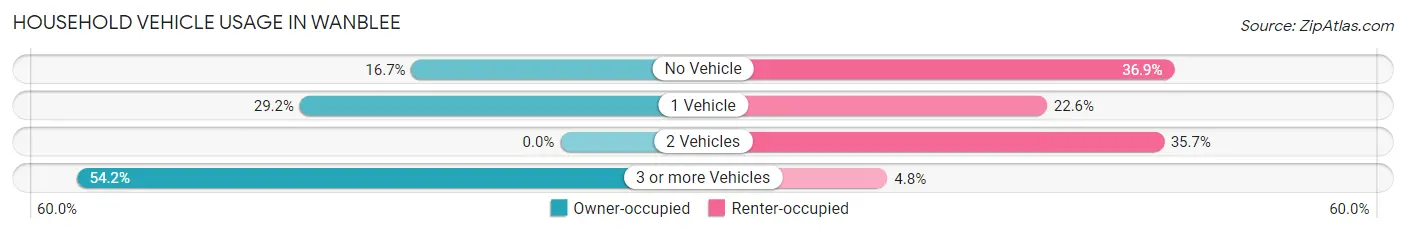
| Vehicles per Household | Owner-occupied | Renter-occupied |
| No Vehicle | 4 (16.7%) | 31 (36.9%) |
| 1 Vehicle | 7 (29.2%) | 19 (22.6%) |
| 2 Vehicles | 0 (0.0%) | 30 (35.7%) |
| 3 or more Vehicles | 13 (54.2%) | 4 (4.8%) |
| Total | 24 (100.0%) | 84 (100.0%) |
Real Estate & Mortgages in Wanblee
Real Estate and Mortgage Overview in Wanblee
| Characteristic | Without Mortgage | With Mortgage |
| Housing Units | 11 | 13 |
| Median Property Value | - | - |
| Median Household Income | - | - |
| Monthly Housing Costs | - | - |
| Real Estate Taxes | - | - |
Property Value by Mortgage Status in Wanblee
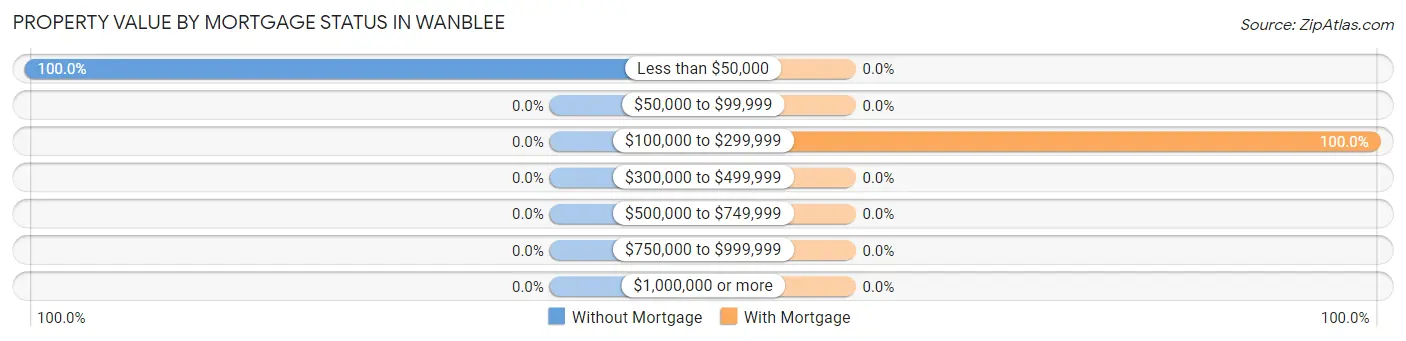
| Property Value | Without Mortgage | With Mortgage |
| Less than $50,000 | 11 (100.0%) | 0 (0.0%) |
| $50,000 to $99,999 | 0 (0.0%) | 0 (0.0%) |
| $100,000 to $299,999 | 0 (0.0%) | 13 (100.0%) |
| $300,000 to $499,999 | 0 (0.0%) | 0 (0.0%) |
| $500,000 to $749,999 | 0 (0.0%) | 0 (0.0%) |
| $750,000 to $999,999 | 0 (0.0%) | 0 (0.0%) |
| $1,000,000 or more | 0 (0.0%) | 0 (0.0%) |
| Total | 11 (100.0%) | 13 (100.0%) |
Household Income by Mortgage Status in Wanblee
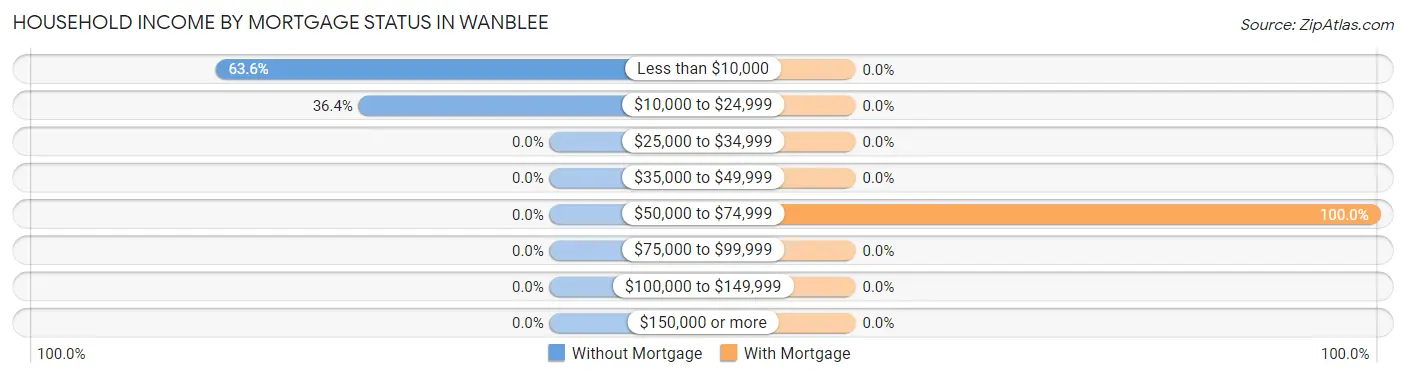
| Household Income | Without Mortgage | With Mortgage |
| Less than $10,000 | 7 (63.6%) | 0 (0.0%) |
| $10,000 to $24,999 | 4 (36.4%) | 0 (0.0%) |
| $25,000 to $34,999 | 0 (0.0%) | 0 (0.0%) |
| $35,000 to $49,999 | 0 (0.0%) | 0 (0.0%) |
| $50,000 to $74,999 | 0 (0.0%) | 13 (100.0%) |
| $75,000 to $99,999 | 0 (0.0%) | 0 (0.0%) |
| $100,000 to $149,999 | 0 (0.0%) | 0 (0.0%) |
| $150,000 or more | 0 (0.0%) | 0 (0.0%) |
| Total | 11 (100.0%) | 13 (100.0%) |
Property Value to Household Income Ratio in Wanblee
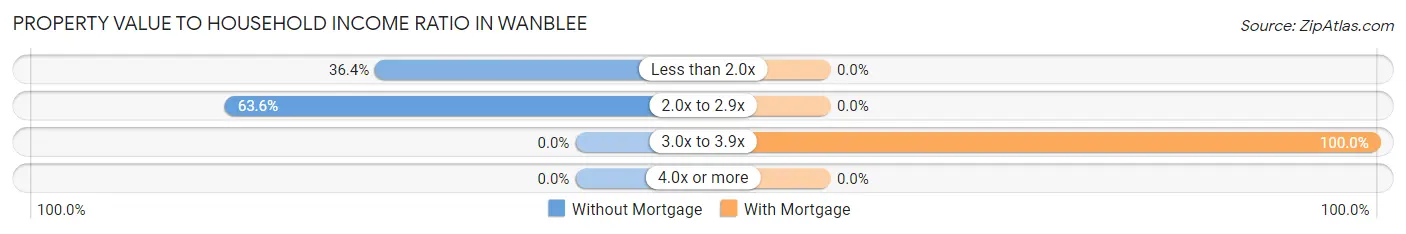
| Value-to-Income Ratio | Without Mortgage | With Mortgage |
| Less than 2.0x | 4 (36.4%) | 0 (0.0%) |
| 2.0x to 2.9x | 7 (63.6%) | 0 (0.0%) |
| 3.0x to 3.9x | 0 (0.0%) | 13 (100.0%) |
| 4.0x or more | 0 (0.0%) | 0 (0.0%) |
| Total | 11 (100.0%) | 13 (100.0%) |
Real Estate Taxes by Mortgage Status in Wanblee
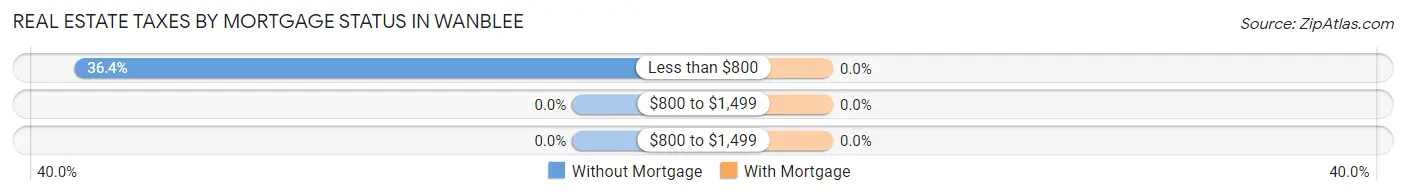
| Property Taxes | Without Mortgage | With Mortgage |
| Less than $800 | 4 (36.4%) | 0 (0.0%) |
| $800 to $1,499 | 0 (0.0%) | 0 (0.0%) |
| $800 to $1,499 | 0 (0.0%) | 0 (0.0%) |
| Total | 11 (100.0%) | 13 (100.0%) |
Health & Disability in Wanblee
Health Insurance Coverage by Age in Wanblee
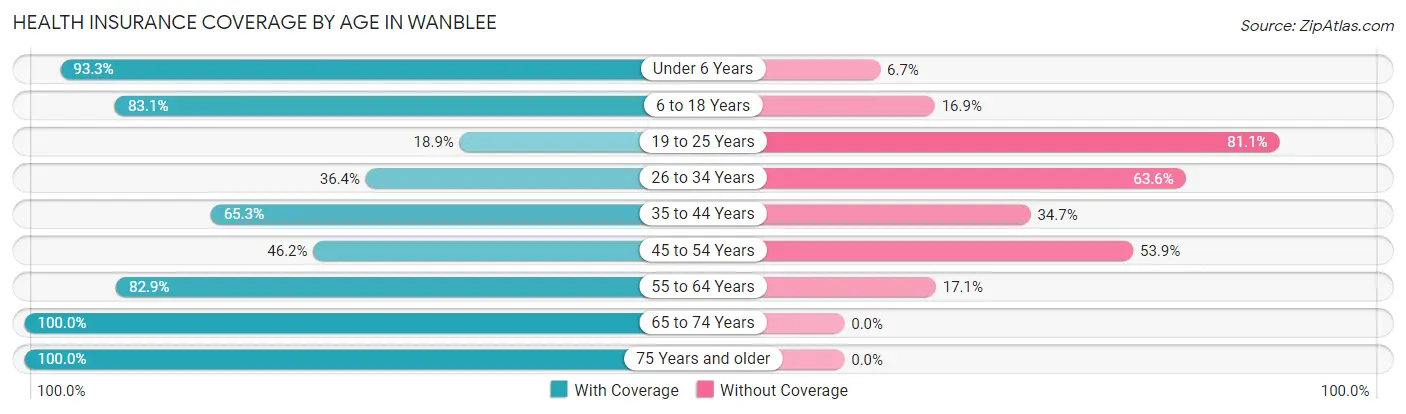
| Age Bracket | With Coverage | Without Coverage |
| Under 6 Years | 84 (93.3%) | 6 (6.7%) |
| 6 to 18 Years | 212 (83.1%) | 43 (16.9%) |
| 19 to 25 Years | 10 (18.9%) | 43 (81.1%) |
| 26 to 34 Years | 20 (36.4%) | 35 (63.6%) |
| 35 to 44 Years | 47 (65.3%) | 25 (34.7%) |
| 45 to 54 Years | 18 (46.2%) | 21 (53.8%) |
| 55 to 64 Years | 68 (82.9%) | 14 (17.1%) |
| 65 to 74 Years | 7 (100.0%) | 0 (0.0%) |
| 75 Years and older | 8 (100.0%) | 0 (0.0%) |
| Total | 474 (71.7%) | 187 (28.3%) |
Health Insurance Coverage by Citizenship Status in Wanblee
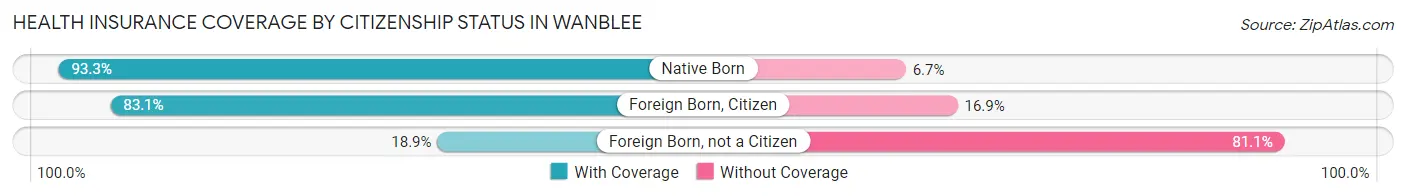
| Citizenship Status | With Coverage | Without Coverage |
| Native Born | 84 (93.3%) | 6 (6.7%) |
| Foreign Born, Citizen | 212 (83.1%) | 43 (16.9%) |
| Foreign Born, not a Citizen | 10 (18.9%) | 43 (81.1%) |
Health Insurance Coverage by Household Income in Wanblee
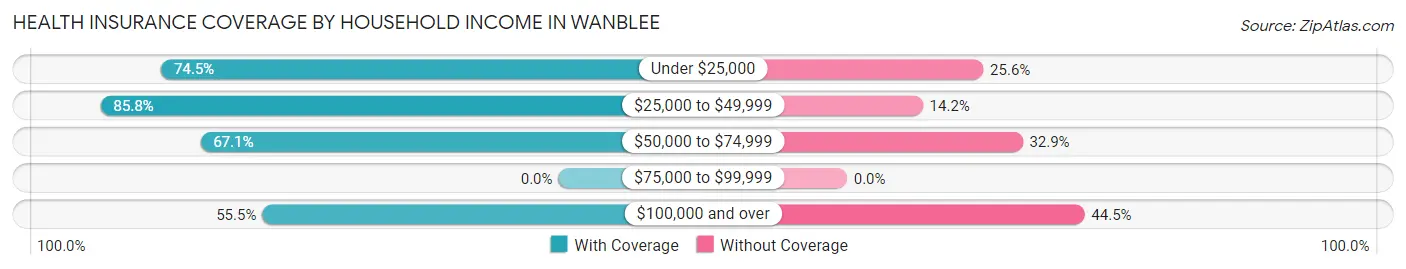
| Household Income | With Coverage | Without Coverage |
| Under $25,000 | 169 (74.5%) | 58 (25.6%) |
| $25,000 to $49,999 | 157 (85.8%) | 26 (14.2%) |
| $50,000 to $74,999 | 53 (67.1%) | 26 (32.9%) |
| $75,000 to $99,999 | 0 (0.0%) | 0 (0.0%) |
| $100,000 and over | 86 (55.5%) | 69 (44.5%) |
Public vs Private Health Insurance Coverage by Age in Wanblee
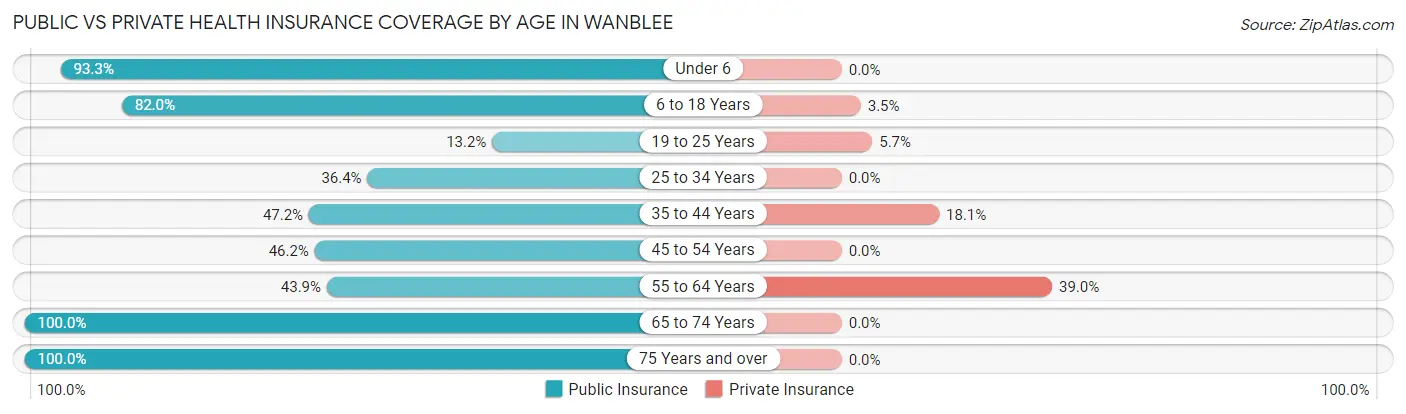
| Age Bracket | Public Insurance | Private Insurance |
| Under 6 | 84 (93.3%) | 0 (0.0%) |
| 6 to 18 Years | 209 (82.0%) | 9 (3.5%) |
| 19 to 25 Years | 7 (13.2%) | 3 (5.7%) |
| 25 to 34 Years | 20 (36.4%) | 0 (0.0%) |
| 35 to 44 Years | 34 (47.2%) | 13 (18.1%) |
| 45 to 54 Years | 18 (46.2%) | 0 (0.0%) |
| 55 to 64 Years | 36 (43.9%) | 32 (39.0%) |
| 65 to 74 Years | 7 (100.0%) | 0 (0.0%) |
| 75 Years and over | 8 (100.0%) | 0 (0.0%) |
| Total | 423 (64.0%) | 57 (8.6%) |
Disability Status by Sex by Age in Wanblee
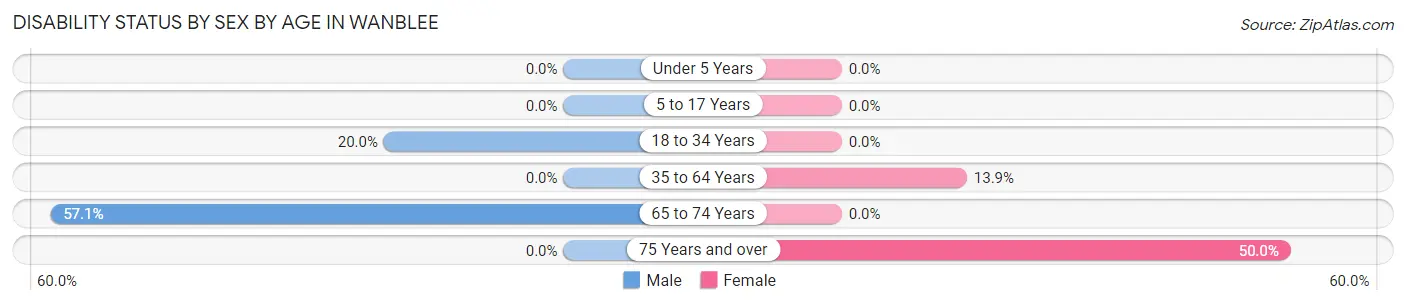
| Age Bracket | Male | Female |
| Under 5 Years | 0 (0.0%) | 0 (0.0%) |
| 5 to 17 Years | 0 (0.0%) | 0 (0.0%) |
| 18 to 34 Years | 13 (20.0%) | 0 (0.0%) |
| 35 to 64 Years | 0 (0.0%) | 17 (13.9%) |
| 65 to 74 Years | 4 (57.1%) | 0 (0.0%) |
| 75 Years and over | 0 (0.0%) | 4 (50.0%) |
Disability Class by Sex by Age in Wanblee
Disability Class: Hearing Difficulty
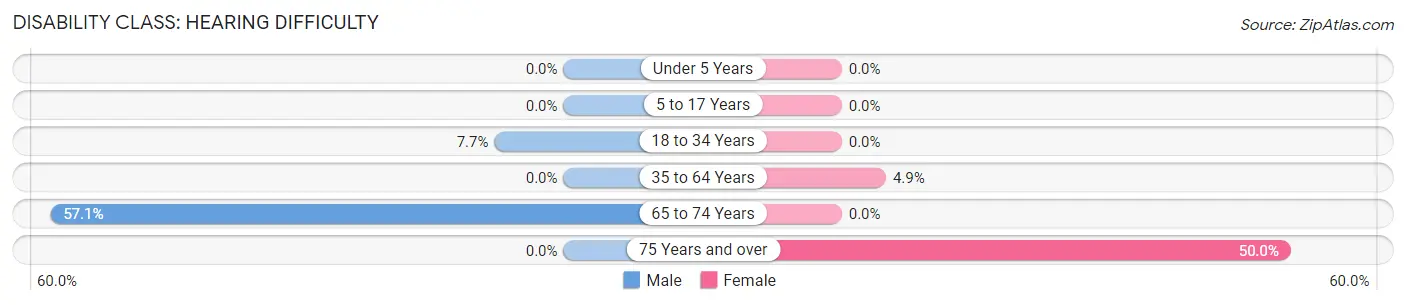
| Age Bracket | Male | Female |
| Under 5 Years | 0 (0.0%) | 0 (0.0%) |
| 5 to 17 Years | 0 (0.0%) | 0 (0.0%) |
| 18 to 34 Years | 5 (7.7%) | 0 (0.0%) |
| 35 to 64 Years | 0 (0.0%) | 6 (4.9%) |
| 65 to 74 Years | 4 (57.1%) | 0 (0.0%) |
| 75 Years and over | 0 (0.0%) | 4 (50.0%) |
Disability Class: Vision Difficulty
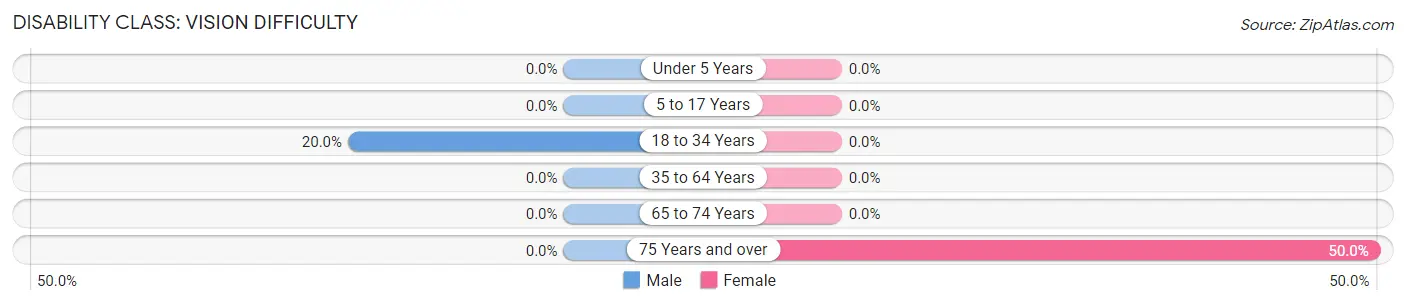
| Age Bracket | Male | Female |
| Under 5 Years | 0 (0.0%) | 0 (0.0%) |
| 5 to 17 Years | 0 (0.0%) | 0 (0.0%) |
| 18 to 34 Years | 13 (20.0%) | 0 (0.0%) |
| 35 to 64 Years | 0 (0.0%) | 0 (0.0%) |
| 65 to 74 Years | 0 (0.0%) | 0 (0.0%) |
| 75 Years and over | 0 (0.0%) | 4 (50.0%) |
Disability Class: Cognitive Difficulty
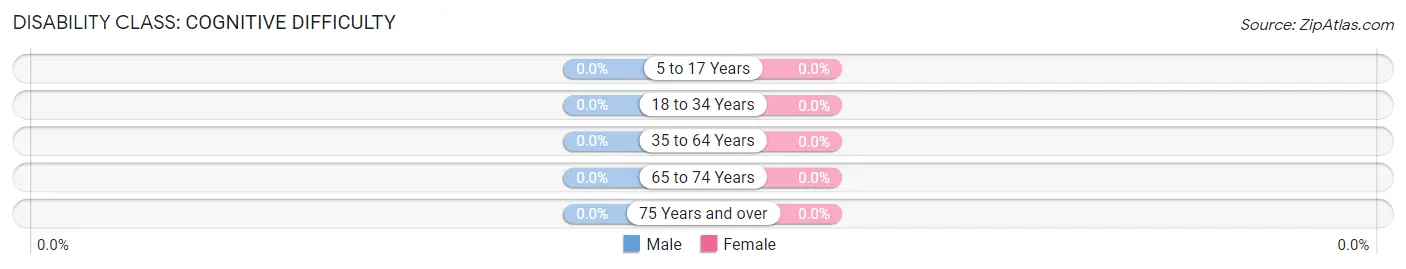
| Age Bracket | Male | Female |
| 5 to 17 Years | 0 (0.0%) | 0 (0.0%) |
| 18 to 34 Years | 0 (0.0%) | 0 (0.0%) |
| 35 to 64 Years | 0 (0.0%) | 0 (0.0%) |
| 65 to 74 Years | 0 (0.0%) | 0 (0.0%) |
| 75 Years and over | 0 (0.0%) | 0 (0.0%) |
Disability Class: Ambulatory Difficulty
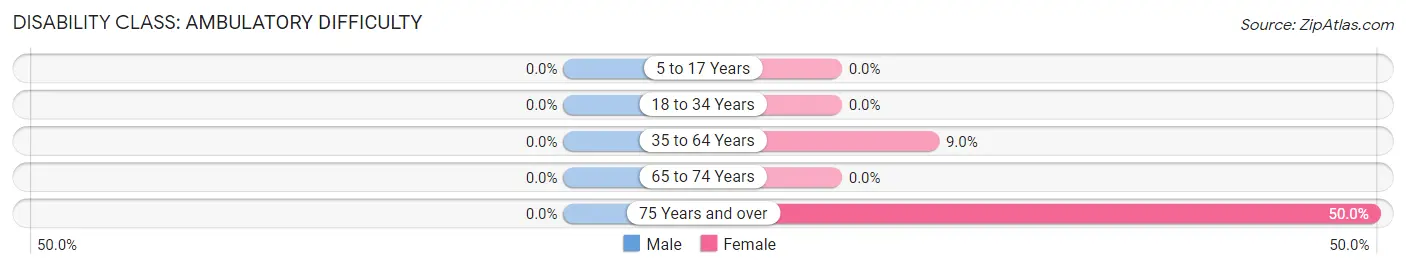
| Age Bracket | Male | Female |
| 5 to 17 Years | 0 (0.0%) | 0 (0.0%) |
| 18 to 34 Years | 0 (0.0%) | 0 (0.0%) |
| 35 to 64 Years | 0 (0.0%) | 11 (9.0%) |
| 65 to 74 Years | 0 (0.0%) | 0 (0.0%) |
| 75 Years and over | 0 (0.0%) | 4 (50.0%) |
Disability Class: Self-Care Difficulty
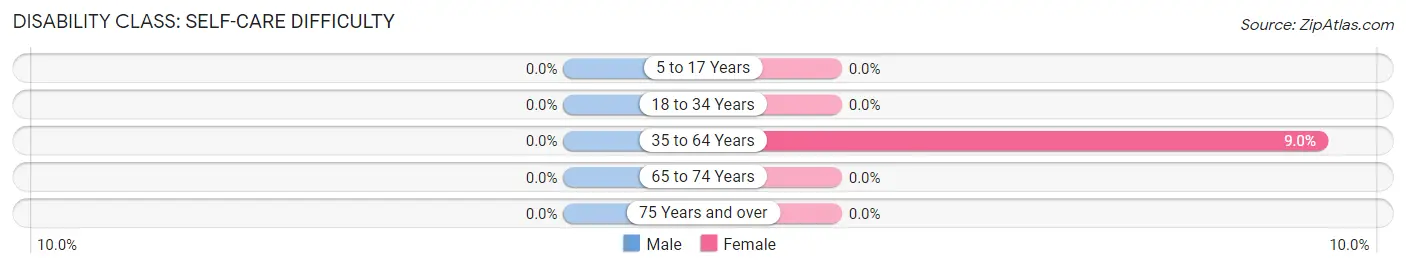
| Age Bracket | Male | Female |
| 5 to 17 Years | 0 (0.0%) | 0 (0.0%) |
| 18 to 34 Years | 0 (0.0%) | 0 (0.0%) |
| 35 to 64 Years | 0 (0.0%) | 11 (9.0%) |
| 65 to 74 Years | 0 (0.0%) | 0 (0.0%) |
| 75 Years and over | 0 (0.0%) | 0 (0.0%) |
Technology Access in Wanblee
Computing Device Access in Wanblee
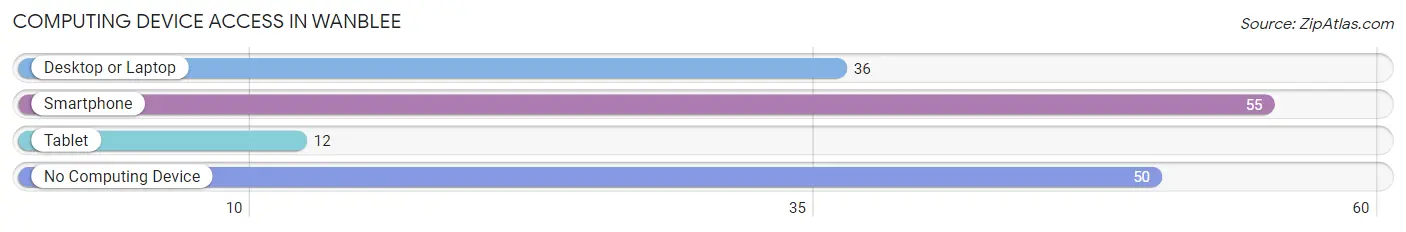
| Device Type | # Households | % Households |
| Desktop or Laptop | 36 | 33.3% |
| Smartphone | 55 | 50.9% |
| Tablet | 12 | 11.1% |
| No Computing Device | 50 | 46.3% |
| Total | 108 | 100.0% |
Internet Access in Wanblee
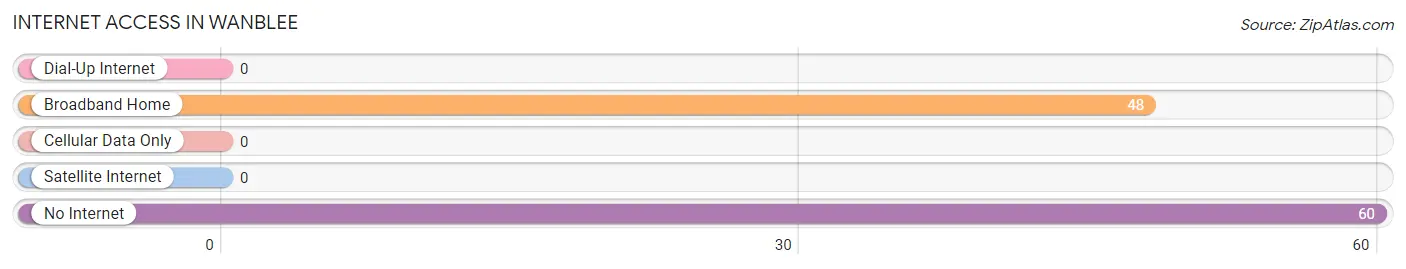
| Internet Type | # Households | % Households |
| Dial-Up Internet | 0 | 0.0% |
| Broadband Home | 48 | 44.4% |
| Cellular Data Only | 0 | 0.0% |
| Satellite Internet | 0 | 0.0% |
| No Internet | 60 | 55.6% |
| Total | 108 | 100.0% |
Wanblee Summary
History
The town of Wanblee, South Dakota is located in the heart of the Pine Ridge Indian Reservation. The town was established in the late 1800s and was originally known as “White Clay”. The name was changed to Wanblee in the early 1900s, which is a Lakota word meaning “eagle”. The town was originally a trading post for the Lakota people, and it was also a stop on the Chicago, Milwaukee, St. Paul and Pacific Railroad.
The town of Wanblee has a long and rich history of Native American culture and tradition. The Lakota people have lived in the area for centuries, and the town has been a center of Lakota culture and tradition since its founding. The town is home to the Wanblee Wicoti, a traditional Lakota dance group that performs at powwows and other events. The town is also home to the Wanblee Wicoti Museum, which houses artifacts and exhibits related to the history and culture of the Lakota people.
The town of Wanblee has also been a center of education for the Lakota people. The town is home to the Red Cloud Indian School, which was founded in 1888 and is the oldest Native American school in the United States. The school is still in operation today and provides educational opportunities for the Lakota people.
Geography
The town of Wanblee is located in the southwestern corner of South Dakota, in the heart of the Pine Ridge Indian Reservation. The town is situated in the Badlands region of the state, and is surrounded by rolling hills and prairies. The town is located at an elevation of 3,400 feet, and is approximately 25 miles from the Nebraska border.
The town of Wanblee is located in the Great Plains region of the United States, and is part of the Great Plains ecoregion. The climate in the area is semi-arid, with hot summers and cold winters. The average annual precipitation in the area is approximately 16 inches.
Economy
The economy of Wanblee is largely based on agriculture and tourism. The town is home to several farms and ranches, and the surrounding area is known for its production of cattle, sheep, and hay. The town is also home to several tourist attractions, including the Wanblee Wicoti Museum, the Red Cloud Indian School, and the Badlands National Park.
The town of Wanblee is also home to several businesses, including a grocery store, a gas station, a post office, and several restaurants. The town is also home to several government offices, including the Bureau of Indian Affairs, the Bureau of Land Management, and the U.S. Forest Service.
Demographics
As of the 2010 census, the town of Wanblee had a population of 1,072. The population is primarily Native American, with the majority of the population being of Lakota descent. The median age in the town is 28.7 years, and the median household income is $25,000. The town has a poverty rate of 33.3%, and the unemployment rate is 8.3%. The town is served by the Wanblee School District, which is part of the Oglala Lakota County School District.
Common Questions
What is Per Capita Income in Wanblee?
Per Capita income in Wanblee is $7,366.
What is the Median Household income in Wanblee?
Median Household Income in Wanblee is $24,167.
What is Income or Wage Gap in Wanblee?
Income or Wage Gap in Wanblee is 78.0%.
Women in Wanblee earn 22.0 cents for every dollar earned by a man.
What is Inequality or Gini Index in Wanblee?
Inequality or Gini Index in Wanblee is 0.47.
What is the Total Population of Wanblee?
Total Population of Wanblee is 661.
What is the Total Male Population of Wanblee?
Total Male Population of Wanblee is 314.
What is the Total Female Population of Wanblee?
Total Female Population of Wanblee is 347.
What is the Ratio of Males per 100 Females in Wanblee?
There are 90.49 Males per 100 Females in Wanblee.
What is the Ratio of Females per 100 Males in Wanblee?
There are 110.51 Females per 100 Males in Wanblee.
What is the Median Population Age in Wanblee?
Median Population Age in Wanblee is 18.0 Years.
What is the Average Family Size in Wanblee
Average Family Size in Wanblee is 6.9 People.
What is the Average Household Size in Wanblee
Average Household Size in Wanblee is 6.0 People.
How Large is the Labor Force in Wanblee?
There are 129 People in the Labor Forcein in Wanblee.
What is the Percentage of People in the Labor Force in Wanblee?
34.3% of People are in the Labor Force in Wanblee.
What is the Unemployment Rate in Wanblee?
Unemployment Rate in Wanblee is 22.5%.