White River, SD Map & Demographics
White River Map
White River Overview
$17,086
PER CAPITA INCOME
$51,480
AVG FAMILY INCOME
0.36
INEQUALITY / GINI INDEX
681
TOTAL POPULATION
324
MALE POPULATION
357
FEMALE POPULATION
90.76
MALES / 100 FEMALES
110.19
FEMALES / 100 MALES
27.7
MEDIAN AGE
4.0
AVG FAMILY SIZE
3.2
AVG HOUSEHOLD SIZE
279
LABOR FORCE [ PEOPLE ]
57.4%
PERCENT IN LABOR FORCE
2.2%
UNEMPLOYMENT RATE
White River Zip Codes
White River Area Codes
Income in White River
Income Overview in White River
| Characteristic | Number | Measure |
| Per Capita Income | 681 | $17,086 |
| Median Family Income | 127 | $51,480 |
| Mean Family Income | 127 | $55,991 |
| Median Household Income | 200 | $0 |
| Mean Household Income | 200 | $59,774 |
| Income Deficit | 127 | $0 |
| Wage / Income Gap (%) | 681 | 0.00% |
| Wage / Income Gap ($) | 681 | 100.00¢ per $1 |
| Gini / Inequality Index | 681 | 0.36 |
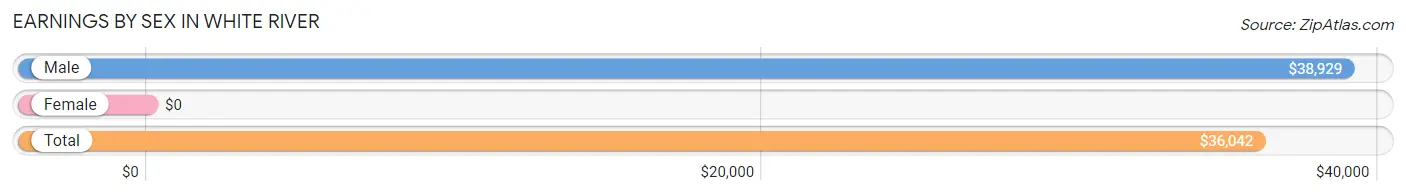
Earnings by Sex in White River
| Sex | Number | Average Earnings |
| Male | 106 (37.7%) | $38,929 |
| Female | 175 (62.3%) | $0 |
| Total | 281 (100.0%) | $36,042 |
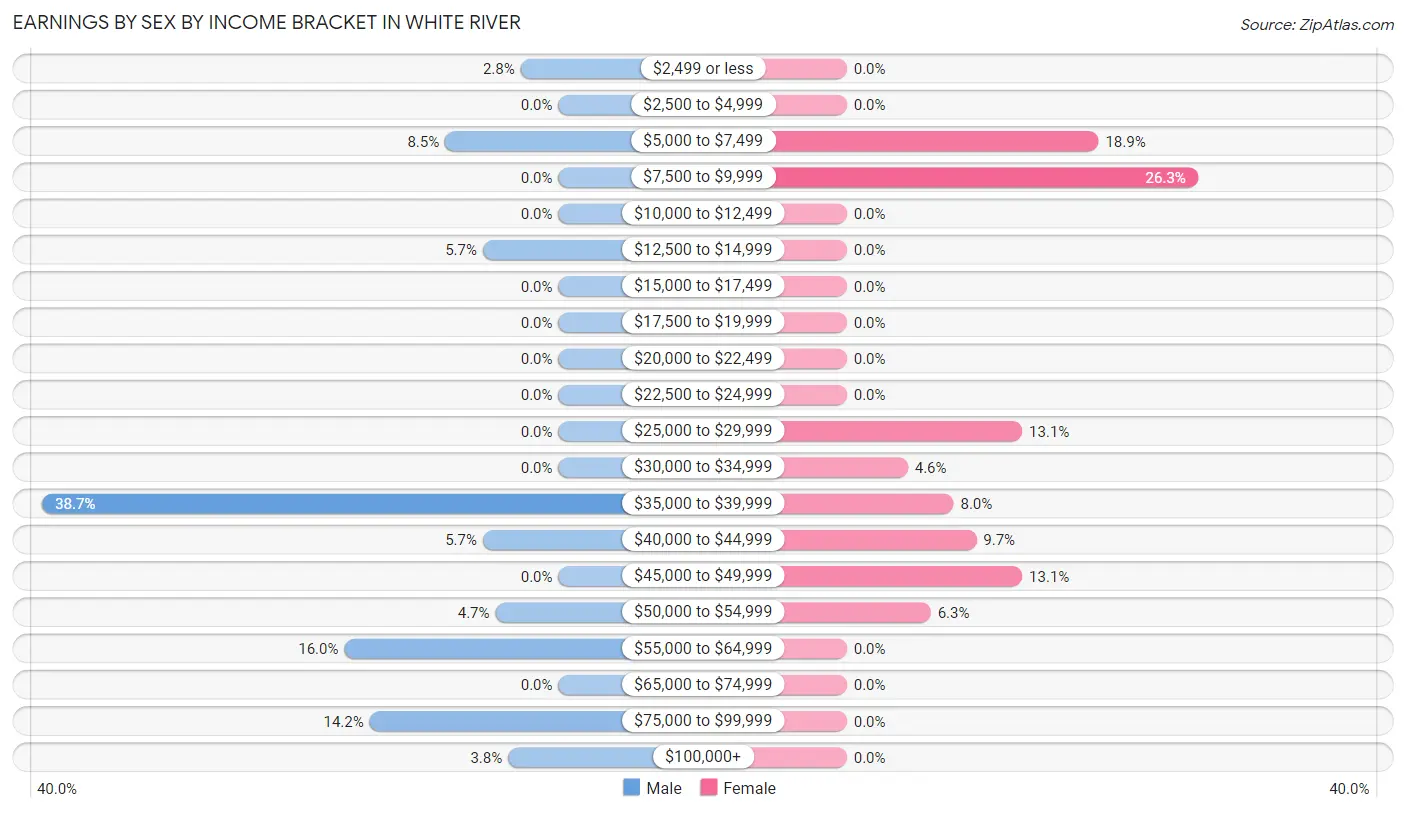
Earnings by Sex by Income Bracket in White River
The most common earnings brackets in White River are $35,000 to $39,999 for men (41 | 38.7%) and $7,500 to $9,999 for women (46 | 26.3%).
| Income | Male | Female |
| $2,499 or less | 3 (2.8%) | 0 (0.0%) |
| $2,500 to $4,999 | 0 (0.0%) | 0 (0.0%) |
| $5,000 to $7,499 | 9 (8.5%) | 33 (18.9%) |
| $7,500 to $9,999 | 0 (0.0%) | 46 (26.3%) |
| $10,000 to $12,499 | 0 (0.0%) | 0 (0.0%) |
| $12,500 to $14,999 | 6 (5.7%) | 0 (0.0%) |
| $15,000 to $17,499 | 0 (0.0%) | 0 (0.0%) |
| $17,500 to $19,999 | 0 (0.0%) | 0 (0.0%) |
| $20,000 to $22,499 | 0 (0.0%) | 0 (0.0%) |
| $22,500 to $24,999 | 0 (0.0%) | 0 (0.0%) |
| $25,000 to $29,999 | 0 (0.0%) | 23 (13.1%) |
| $30,000 to $34,999 | 0 (0.0%) | 8 (4.6%) |
| $35,000 to $39,999 | 41 (38.7%) | 14 (8.0%) |
| $40,000 to $44,999 | 6 (5.7%) | 17 (9.7%) |
| $45,000 to $49,999 | 0 (0.0%) | 23 (13.1%) |
| $50,000 to $54,999 | 5 (4.7%) | 11 (6.3%) |
| $55,000 to $64,999 | 17 (16.0%) | 0 (0.0%) |
| $65,000 to $74,999 | 0 (0.0%) | 0 (0.0%) |
| $75,000 to $99,999 | 15 (14.1%) | 0 (0.0%) |
| $100,000+ | 4 (3.8%) | 0 (0.0%) |
| Total | 106 (100.0%) | 175 (100.0%) |
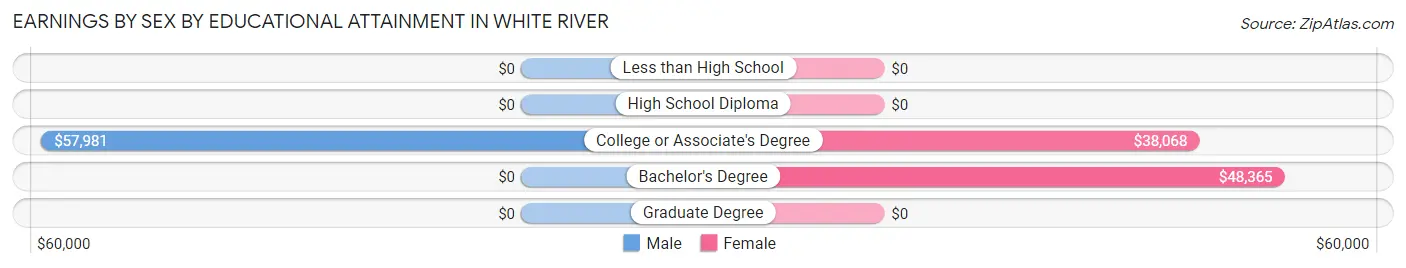
Earnings by Sex by Educational Attainment in White River
Average earnings in White River are $39,464 for men and $29,792 for women, a difference of 24.5%. Men with an educational attainment of college or associate's degree enjoy the highest average annual earnings of $57,981, while those with college or associate's degree education earn the least with $57,981. Women with an educational attainment of bachelor's degree earn the most with the average annual earnings of $48,365, while those with college or associate's degree education have the smallest earnings of $38,068.
| Educational Attainment | Male Income | Female Income |
| Less than High School | - | - |
| High School Diploma | - | - |
| College or Associate's Degree | $57,981 | $38,068 |
| Bachelor's Degree | - | - |
| Graduate Degree | - | - |
| Total | $39,464 | $29,792 |
Family Income in White River
Family Income Brackets in White River
According to the White River family income data, there are 43 families falling into the $50,000 to $74,999 income range, which is the most common income bracket and makes up 33.9% of all families.
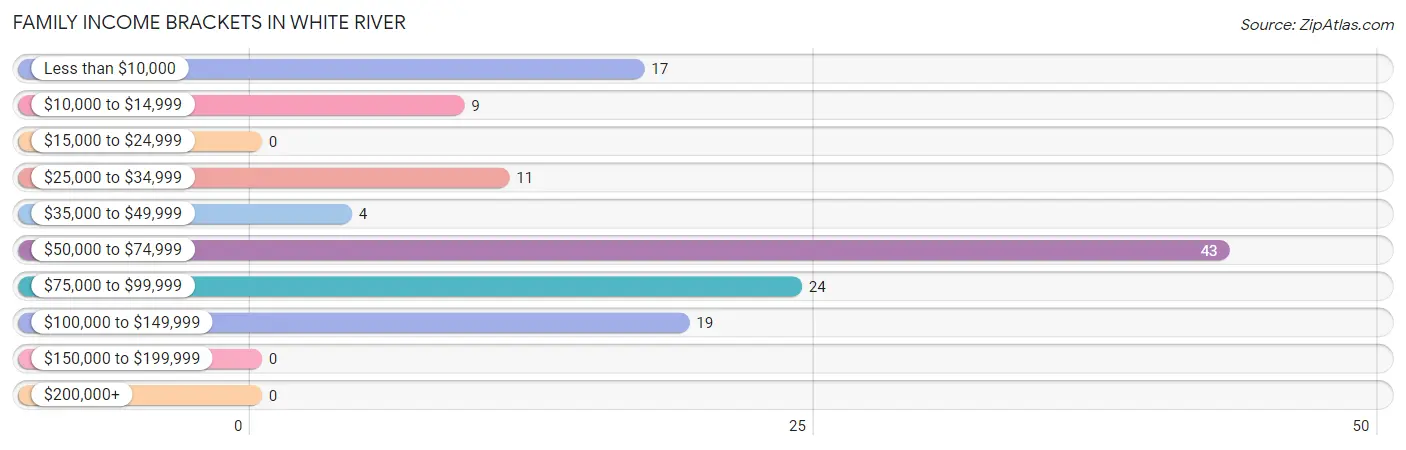
| Income Bracket | # Families | % Families |
| Less than $10,000 | 17 | 13.4% |
| $10,000 to $14,999 | 9 | 7.1% |
| $15,000 to $24,999 | 0 | 0.0% |
| $25,000 to $34,999 | 11 | 8.7% |
| $35,000 to $49,999 | 4 | 3.1% |
| $50,000 to $74,999 | 43 | 33.9% |
| $75,000 to $99,999 | 24 | 18.9% |
| $100,000 to $149,999 | 19 | 15.0% |
| $150,000 to $199,999 | 0 | 0.0% |
| $200,000+ | 0 | 0.0% |
Family Income by Famaliy Size in White River
3-person families (25 | 19.7%) account for the highest median family income in White River with $78,482 per family, while 3-person families (25 | 19.7%) have the highest median income of $26,161 per family member.
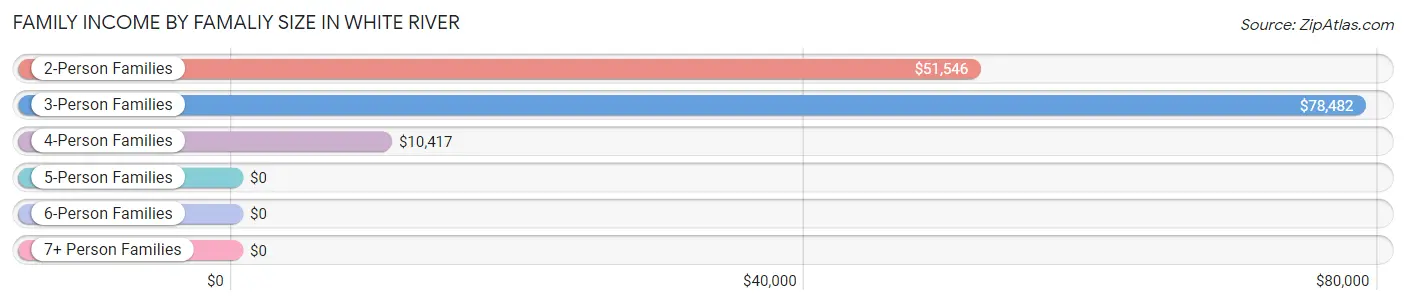
| Income Bracket | # Families | Median Income |
| 2-Person Families | 55 (43.3%) | $51,546 |
| 3-Person Families | 25 (19.7%) | $78,482 |
| 4-Person Families | 23 (18.1%) | $10,417 |
| 5-Person Families | 4 (3.2%) | $0 |
| 6-Person Families | 7 (5.5%) | $0 |
| 7+ Person Families | 13 (10.2%) | $0 |
| Total | 127 (100.0%) | $51,480 |
Family Income by Number of Earners in White River
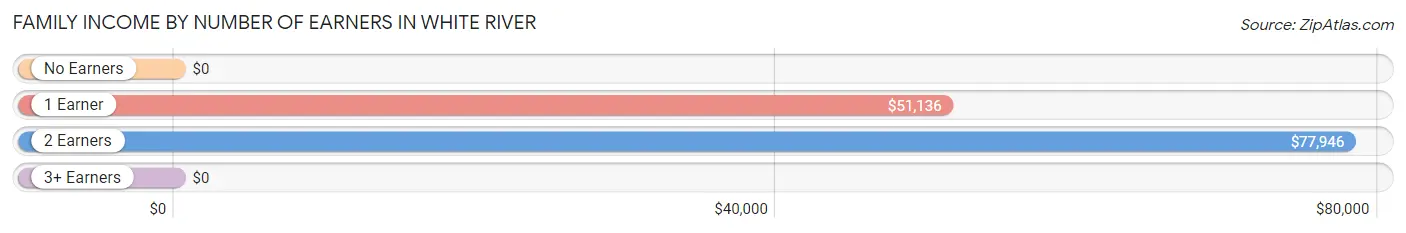
| Number of Earners | # Families | Median Income |
| No Earners | 34 (26.8%) | $0 |
| 1 Earner | 20 (15.8%) | $51,136 |
| 2 Earners | 69 (54.3%) | $77,946 |
| 3+ Earners | 4 (3.2%) | $0 |
| Total | 127 (100.0%) | $51,480 |
Household Income in White River
Household Income Brackets in White River
With 74 households falling in the category, the $75,000 to $99,999 income range is the most frequent in White River, accounting for 37.0% of all households.
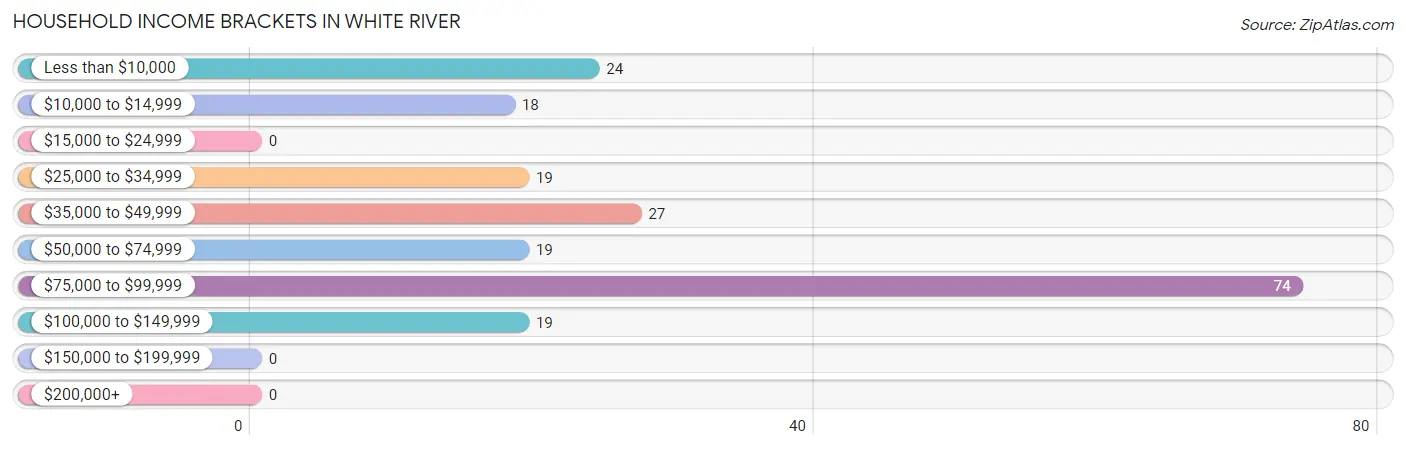
| Income Bracket | # Households | % Households |
| Less than $10,000 | 24 | 12.0% |
| $10,000 to $14,999 | 18 | 9.0% |
| $15,000 to $24,999 | 0 | 0.0% |
| $25,000 to $34,999 | 19 | 9.5% |
| $35,000 to $49,999 | 27 | 13.5% |
| $50,000 to $74,999 | 19 | 9.5% |
| $75,000 to $99,999 | 74 | 37.0% |
| $100,000 to $149,999 | 19 | 9.5% |
| $150,000 to $199,999 | 0 | 0.0% |
| $200,000+ | 0 | 0.0% |
Household Income by Householder Age in White River
The median household income in White River is $0, with the highest median household income of $92,798 found in the 25 to 44 years age bracket for the primary householder. A total of 63 households (31.5%) fall into this category. Meanwhile, the 15 to 24 years age bracket for the primary householder has the lowest median household income of $0, with 2 households (1.0%) in this group.
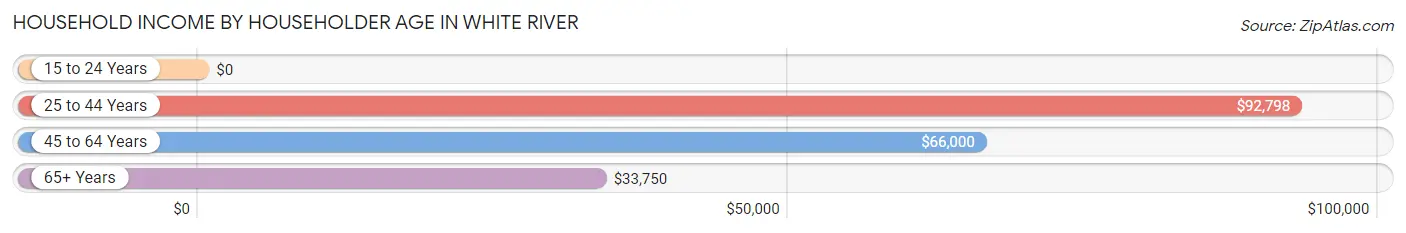
| Income Bracket | # Households | Median Income |
| 15 to 24 Years | 2 (1.0%) | $0 |
| 25 to 44 Years | 63 (31.5%) | $92,798 |
| 45 to 64 Years | 76 (38.0%) | $66,000 |
| 65+ Years | 59 (29.5%) | $33,750 |
| Total | 200 (100.0%) | $0 |
Poverty in White River
Income Below Poverty by Sex and Age in White River
With 36.9% poverty level for males and 33.0% for females among the residents of White River, under 5 year old males and 45 to 54 year old females are the most vulnerable to poverty, with 3 males (100.0%) and 14 females (82.4%) in their respective age groups living below the poverty level.
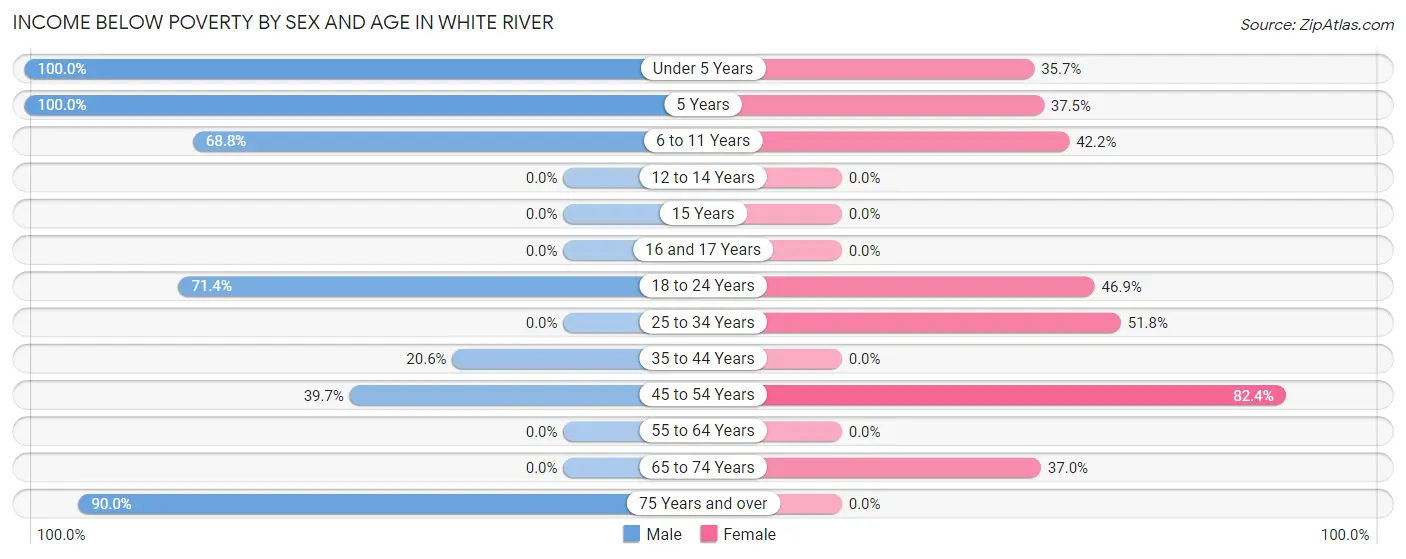
| Age Bracket | Male | Female |
| Under 5 Years | 3 (100.0%) | 5 (35.7%) |
| 5 Years | 6 (100.0%) | 3 (37.5%) |
| 6 to 11 Years | 22 (68.8%) | 19 (42.2%) |
| 12 to 14 Years | 0 (0.0%) | 0 (0.0%) |
| 15 Years | 0 (0.0%) | 0 (0.0%) |
| 16 and 17 Years | 0 (0.0%) | 0 (0.0%) |
| 18 to 24 Years | 30 (71.4%) | 23 (46.9%) |
| 25 to 34 Years | 0 (0.0%) | 29 (51.8%) |
| 35 to 44 Years | 7 (20.6%) | 0 (0.0%) |
| 45 to 54 Years | 23 (39.7%) | 14 (82.4%) |
| 55 to 64 Years | 0 (0.0%) | 0 (0.0%) |
| 65 to 74 Years | 0 (0.0%) | 17 (37.0%) |
| 75 Years and over | 9 (90.0%) | 0 (0.0%) |
| Total | 100 (36.9%) | 110 (33.0%) |
Income Above Poverty by Sex and Age in White River
According to the poverty statistics in White River, males aged 12 to 14 years and females aged 12 to 14 years are the age groups that are most secure financially, with 100.0% of males and 100.0% of females in these age groups living above the poverty line.
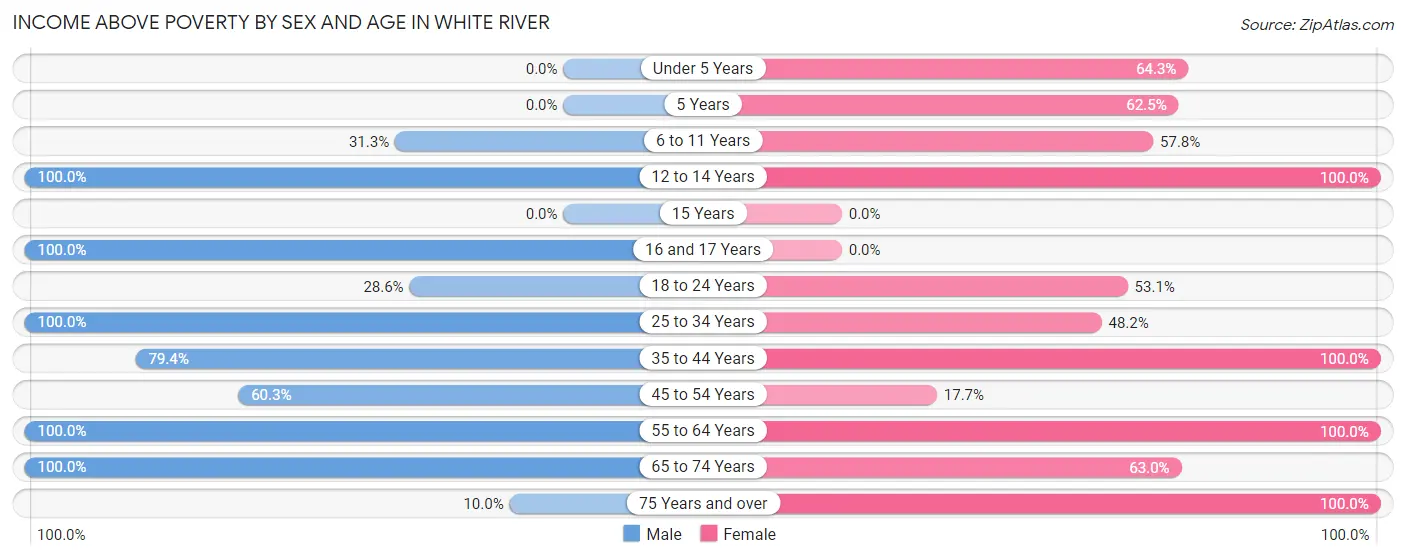
| Age Bracket | Male | Female |
| Under 5 Years | 0 (0.0%) | 9 (64.3%) |
| 5 Years | 0 (0.0%) | 5 (62.5%) |
| 6 to 11 Years | 10 (31.2%) | 26 (57.8%) |
| 12 to 14 Years | 44 (100.0%) | 11 (100.0%) |
| 15 Years | 0 (0.0%) | 0 (0.0%) |
| 16 and 17 Years | 11 (100.0%) | 0 (0.0%) |
| 18 to 24 Years | 12 (28.6%) | 26 (53.1%) |
| 25 to 34 Years | 21 (100.0%) | 27 (48.2%) |
| 35 to 44 Years | 27 (79.4%) | 48 (100.0%) |
| 45 to 54 Years | 35 (60.3%) | 3 (17.6%) |
| 55 to 64 Years | 5 (100.0%) | 27 (100.0%) |
| 65 to 74 Years | 5 (100.0%) | 29 (63.0%) |
| 75 Years and over | 1 (10.0%) | 12 (100.0%) |
| Total | 171 (63.1%) | 223 (67.0%) |
Income Below Poverty Among Married-Couple Families in White River
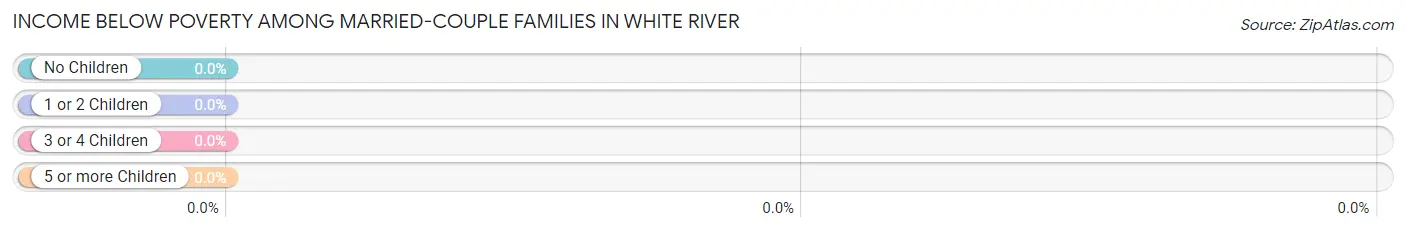
| Children | Above Poverty | Below Poverty |
| No Children | 17 (100.0%) | 0 (0.0%) |
| 1 or 2 Children | 18 (100.0%) | 0 (0.0%) |
| 3 or 4 Children | 0 (0.0%) | 0 (0.0%) |
| 5 or more Children | 13 (100.0%) | 0 (0.0%) |
| Total | 48 (100.0%) | 0 (0.0%) |
Income Below Poverty Among Single-Parent Households in White River
According to the poverty data in White River, 18.4% or 7 single-father households and 63.4% or 26 single-mother households are living below the poverty line. Among single-father households, those with 3 or 4 children have the highest poverty rate, with 7 households (100.0%) experiencing poverty. Likewise, among single-mother households, those with no children have the highest poverty rate, with 16 households (100.0%) falling below the poverty line.
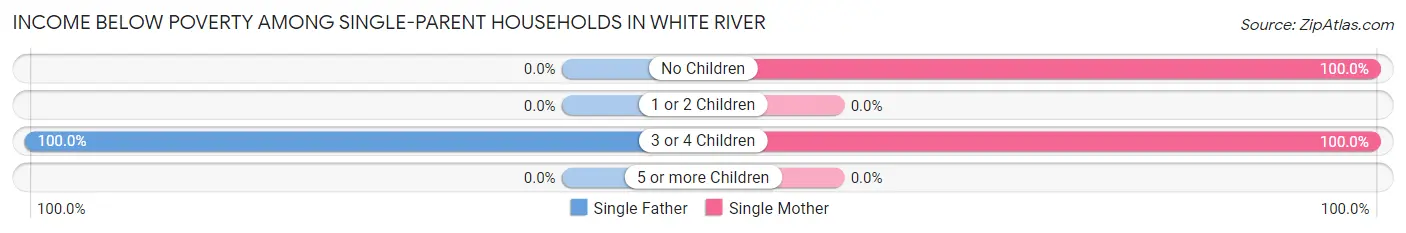
| Children | Single Father | Single Mother |
| No Children | 0 (0.0%) | 16 (100.0%) |
| 1 or 2 Children | 0 (0.0%) | 0 (0.0%) |
| 3 or 4 Children | 7 (100.0%) | 10 (100.0%) |
| 5 or more Children | 0 (0.0%) | 0 (0.0%) |
| Total | 7 (18.4%) | 26 (63.4%) |
Income Below Poverty Among Married-Couple vs Single-Parent Households in White River
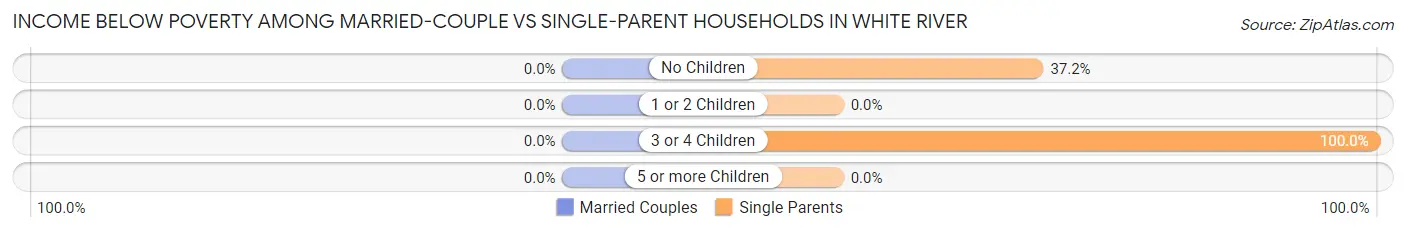
| Children | Married-Couple Families | Single-Parent Households |
| No Children | 0 (0.0%) | 16 (37.2%) |
| 1 or 2 Children | 0 (0.0%) | 0 (0.0%) |
| 3 or 4 Children | 0 (0.0%) | 17 (100.0%) |
| 5 or more Children | 0 (0.0%) | 0 (0.0%) |
| Total | 0 (0.0%) | 33 (41.8%) |
Race in White River
The most populous races in White River are Native / Alaskan (381 | 55.9%), White / Caucasian (224 | 32.9%), and Two or more Races (71 | 10.4%).
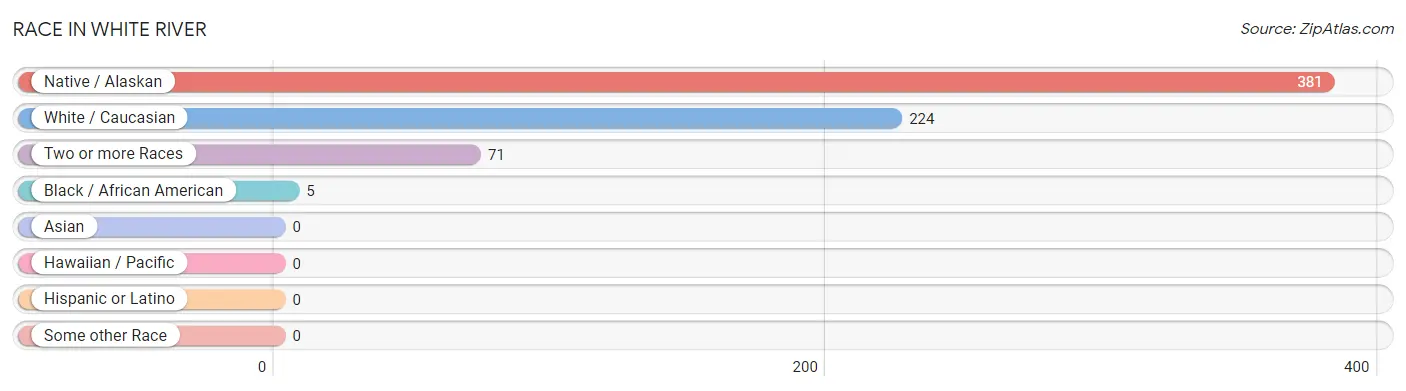
| Race | # Population | % Population |
| Asian | 0 | 0.0% |
| Black / African American | 5 | 0.7% |
| Hawaiian / Pacific | 0 | 0.0% |
| Hispanic or Latino | 0 | 0.0% |
| Native / Alaskan | 381 | 55.9% |
| White / Caucasian | 224 | 32.9% |
| Two or more Races | 71 | 10.4% |
| Some other Race | 0 | 0.0% |
| Total | 681 | 100.0% |
Ancestry in White River
The most populous ancestries reported in White River are Sioux (332 | 48.7%), German (91 | 13.4%), Russian (27 | 4.0%), Irish (26 | 3.8%), and American (21 | 3.1%), together accounting for 73.0% of all White River residents.
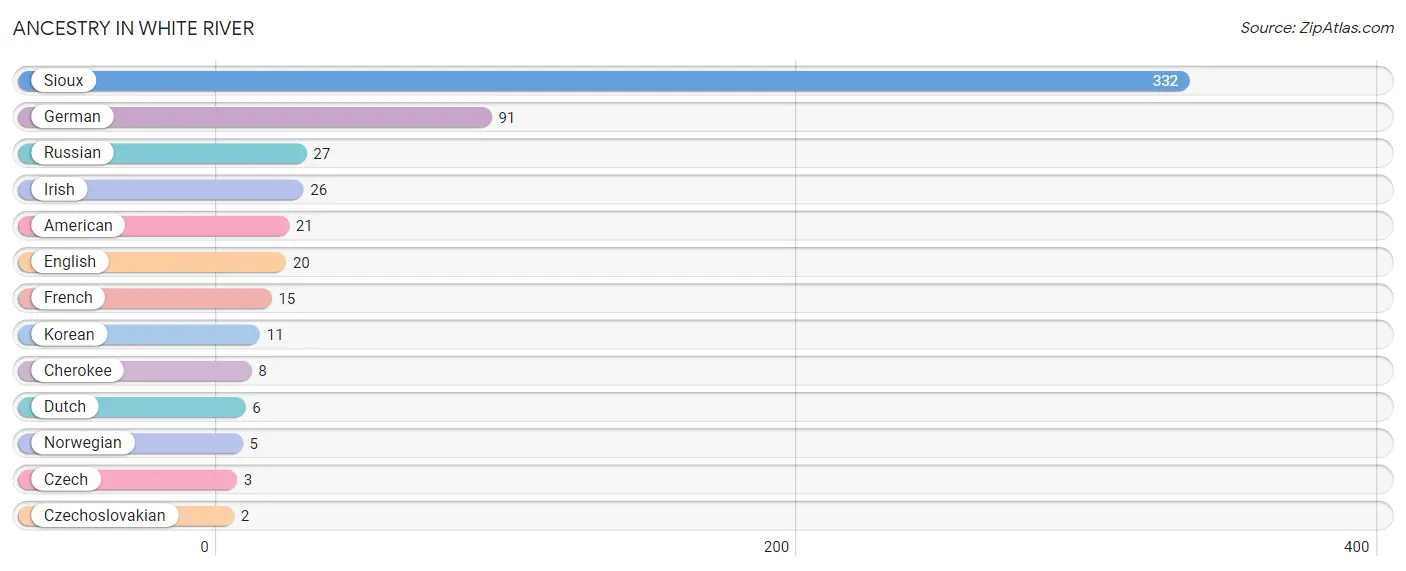
| Ancestry | # Population | % Population |
| American | 21 | 3.1% |
| Cherokee | 8 | 1.2% |
| Czech | 3 | 0.4% |
| Czechoslovakian | 2 | 0.3% |
| Dutch | 6 | 0.9% |
| English | 20 | 2.9% |
| French | 15 | 2.2% |
| German | 91 | 13.4% |
| Irish | 26 | 3.8% |
| Korean | 11 | 1.6% |
| Norwegian | 5 | 0.7% |
| Russian | 27 | 4.0% |
| Sioux | 332 | 48.7% | View All 13 Rows |
Immigrants in White River

| Immigration Origin | # Population | % Population | View All 0 Rows |
Sex and Age in White River
Sex and Age in White River
The most populous age groups in White River are 5 to 9 Years (57 | 17.6%) for men and 35 to 39 Years (48 | 13.5%) for women.
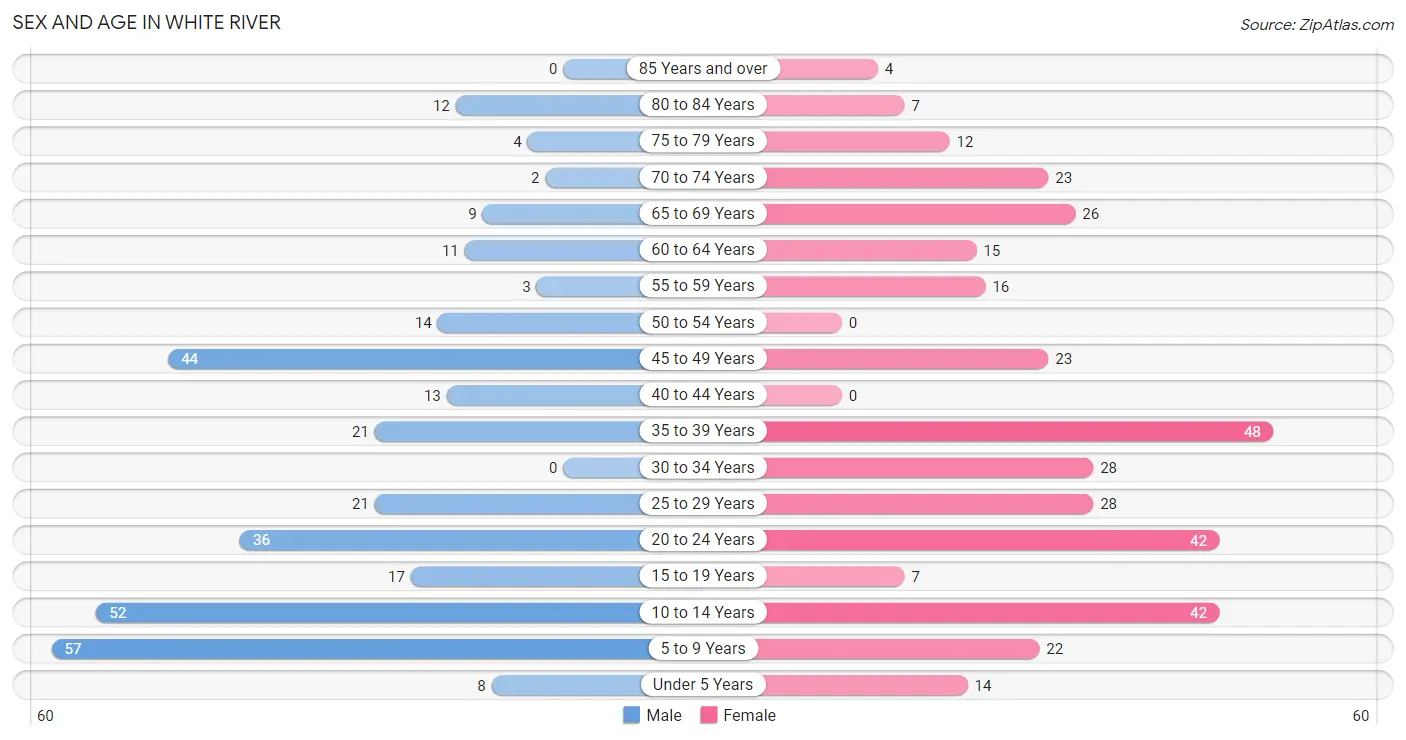
| Age Bracket | Male | Female |
| Under 5 Years | 8 (2.5%) | 14 (3.9%) |
| 5 to 9 Years | 57 (17.6%) | 22 (6.2%) |
| 10 to 14 Years | 52 (16.1%) | 42 (11.8%) |
| 15 to 19 Years | 17 (5.2%) | 7 (2.0%) |
| 20 to 24 Years | 36 (11.1%) | 42 (11.8%) |
| 25 to 29 Years | 21 (6.5%) | 28 (7.8%) |
| 30 to 34 Years | 0 (0.0%) | 28 (7.8%) |
| 35 to 39 Years | 21 (6.5%) | 48 (13.5%) |
| 40 to 44 Years | 13 (4.0%) | 0 (0.0%) |
| 45 to 49 Years | 44 (13.6%) | 23 (6.4%) |
| 50 to 54 Years | 14 (4.3%) | 0 (0.0%) |
| 55 to 59 Years | 3 (0.9%) | 16 (4.5%) |
| 60 to 64 Years | 11 (3.4%) | 15 (4.2%) |
| 65 to 69 Years | 9 (2.8%) | 26 (7.3%) |
| 70 to 74 Years | 2 (0.6%) | 23 (6.4%) |
| 75 to 79 Years | 4 (1.2%) | 12 (3.4%) |
| 80 to 84 Years | 12 (3.7%) | 7 (2.0%) |
| 85 Years and over | 0 (0.0%) | 4 (1.1%) |
| Total | 324 (100.0%) | 357 (100.0%) |
Families and Households in White River
Median Family Size in White River
The median family size in White River is 3.98 persons per family, with single female/mother families (41 | 32.3%) accounting for the largest median family size of 5.98 persons per family. On the other hand, single male/father families (38 | 29.9%) represent the smallest median family size with 2.26 persons per family.
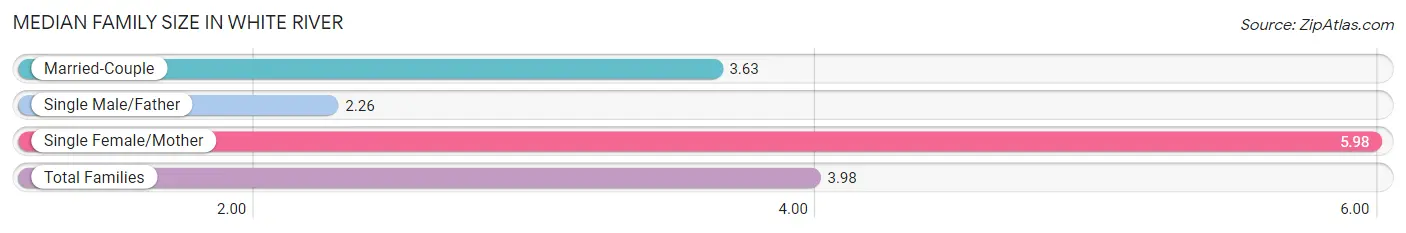
| Family Type | # Families | Family Size |
| Married-Couple | 48 (37.8%) | 3.63 |
| Single Male/Father | 38 (29.9%) | 2.26 |
| Single Female/Mother | 41 (32.3%) | 5.98 |
| Total Families | 127 (100.0%) | 3.98 |
Median Household Size in White River
The median household size in White River is 3.18 persons per household, with single female/mother households (41 | 20.5%) accounting for the largest median household size of 6.32 persons per household. non-family households (73 | 36.5%) represent the smallest median household size with 1.12 persons per household.
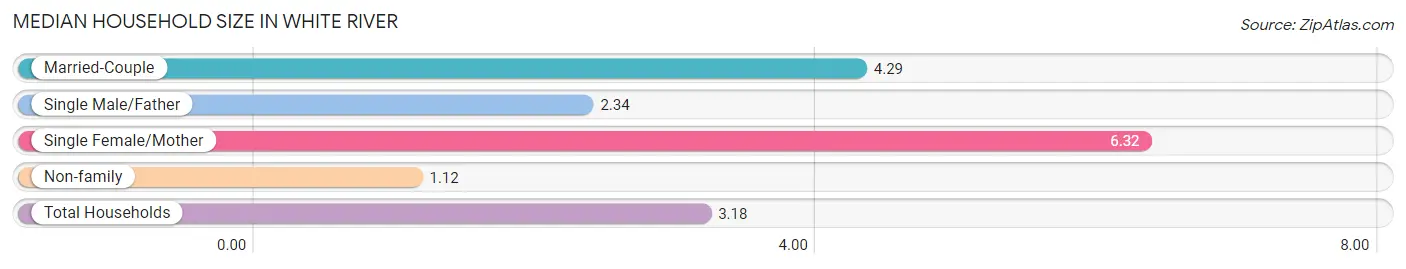
| Household Type | # Households | Household Size |
| Married-Couple | 48 (24.0%) | 4.29 |
| Single Male/Father | 38 (19.0%) | 2.34 |
| Single Female/Mother | 41 (20.5%) | 6.32 |
| Non-family | 73 (36.5%) | 1.12 |
| Total Households | 200 (100.0%) | 3.18 |
Household Size by Marriage Status in White River
Out of a total of 200 households in White River, 127 (63.5%) are family households, while 73 (36.5%) are nonfamily households. The most numerous type of family households are 3-person households, comprising 56, and the most common type of nonfamily households are 1-person households, comprising 68.
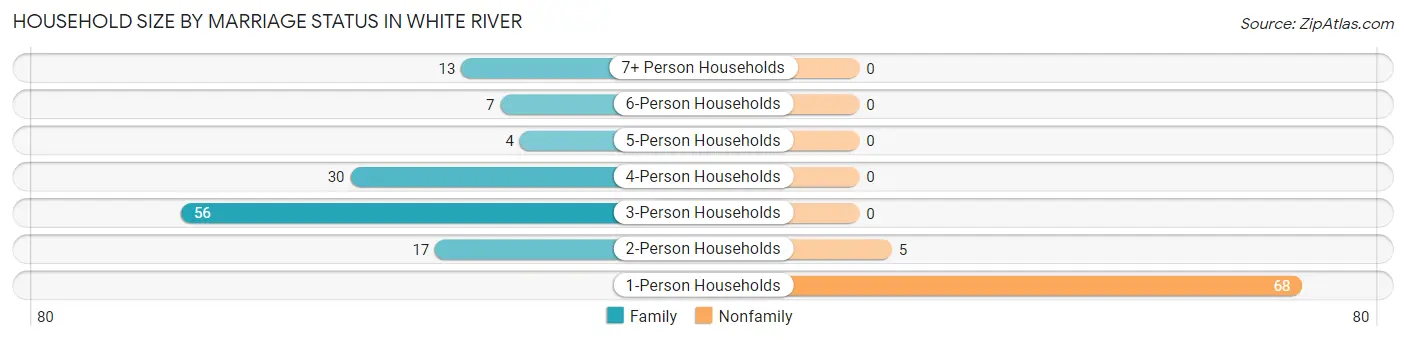
| Household Size | Family Households | Nonfamily Households |
| 1-Person Households | - | 68 (34.0%) |
| 2-Person Households | 17 (8.5%) | 5 (2.5%) |
| 3-Person Households | 56 (28.0%) | 0 (0.0%) |
| 4-Person Households | 30 (15.0%) | 0 (0.0%) |
| 5-Person Households | 4 (2.0%) | 0 (0.0%) |
| 6-Person Households | 7 (3.5%) | 0 (0.0%) |
| 7+ Person Households | 13 (6.5%) | 0 (0.0%) |
| Total | 127 (63.5%) | 73 (36.5%) |
Female Fertility in White River
Fertility by Age in White River
Average fertility rate in White River is 11.0 births per 1,000 women. Women in the age bracket of 20 to 34 years have the highest fertility rate with 20.0 births per 1,000 women. Women in the age bracket of 20 to 34 years acount for 100.0% of all women with births.
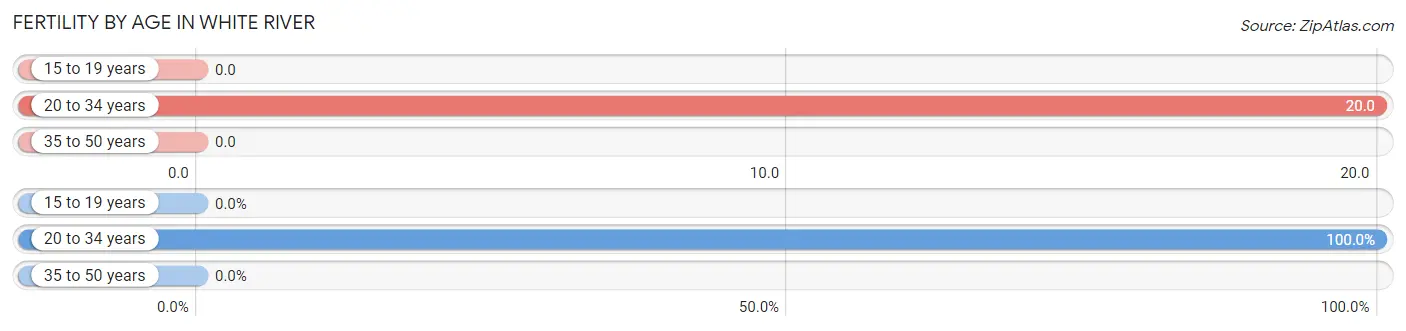
| Age Bracket | Women with Births | Births / 1,000 Women |
| 15 to 19 years | 0 (0.0%) | 0.0 |
| 20 to 34 years | 2 (100.0%) | 20.0 |
| 35 to 50 years | 0 (0.0%) | 0.0 |
| Total | 2 (100.0%) | 11.0 |
Fertility by Age by Marriage Status in White River
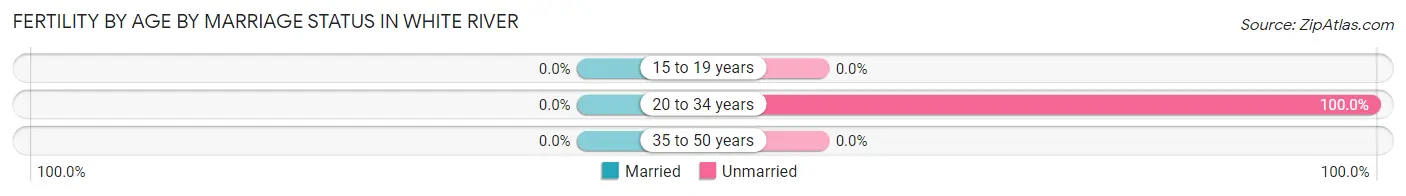
| Age Bracket | Married | Unmarried |
| 15 to 19 years | 0 (0.0%) | 0 (0.0%) |
| 20 to 34 years | 0 (0.0%) | 2 (100.0%) |
| 35 to 50 years | 0 (0.0%) | 0 (0.0%) |
| Total | 0 (0.0%) | 2 (100.0%) |
Fertility by Education in White River
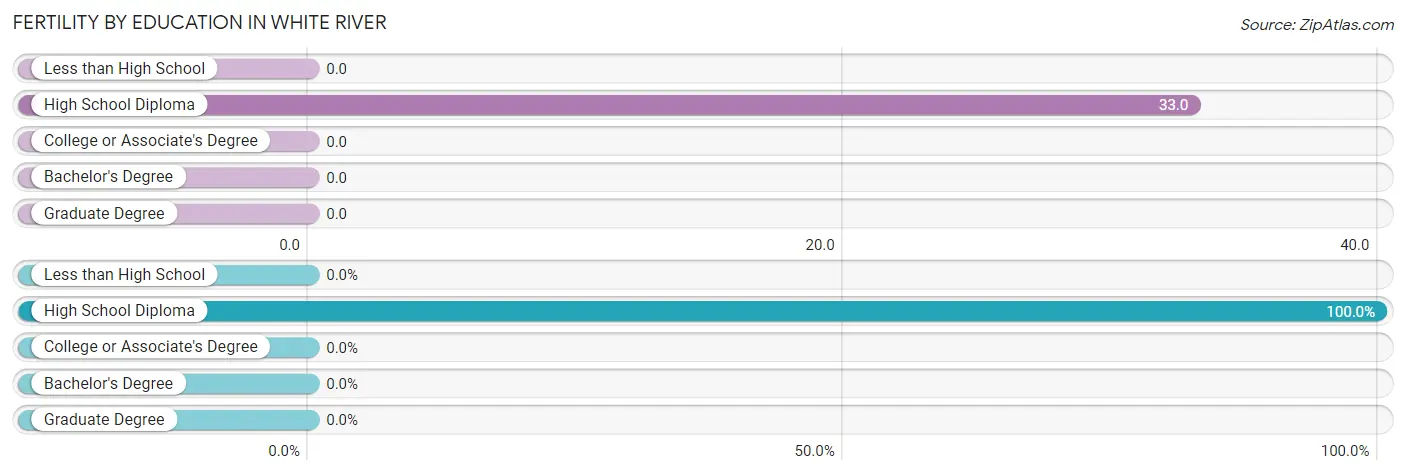
| Educational Attainment | Women with Births | Births / 1,000 Women |
| Less than High School | 0 (0.0%) | 0.0 |
| High School Diploma | 2 (100.0%) | 33.0 |
| College or Associate's Degree | 0 (0.0%) | 0.0 |
| Bachelor's Degree | 0 (0.0%) | 0.0 |
| Graduate Degree | 0 (0.0%) | 0.0 |
| Total | 2 (100.0%) | 11.0 |
Fertility by Education by Marriage Status in White River
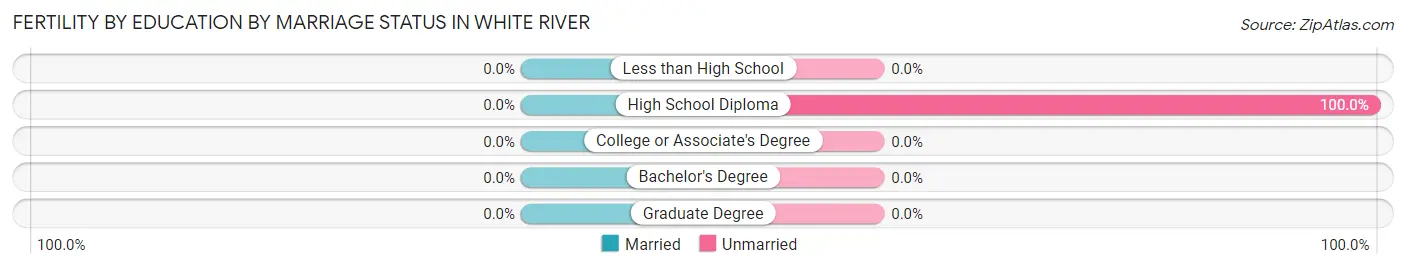
| Educational Attainment | Married | Unmarried |
| Less than High School | 0 (0.0%) | 0 (0.0%) |
| High School Diploma | 0 (0.0%) | 2 (100.0%) |
| College or Associate's Degree | 0 (0.0%) | 0 (0.0%) |
| Bachelor's Degree | 0 (0.0%) | 0 (0.0%) |
| Graduate Degree | 0 (0.0%) | 0 (0.0%) |
| Total | 0 (0.0%) | 2 (100.0%) |
Employment Characteristics in White River
Employment by Class of Employer in White River
Among the 273 employed individuals in White River, local government employees (76 | 27.8%), private company employees (58 | 21.2%), and not-for-profit organizations (45 | 16.5%) make up the most common classes of employment.
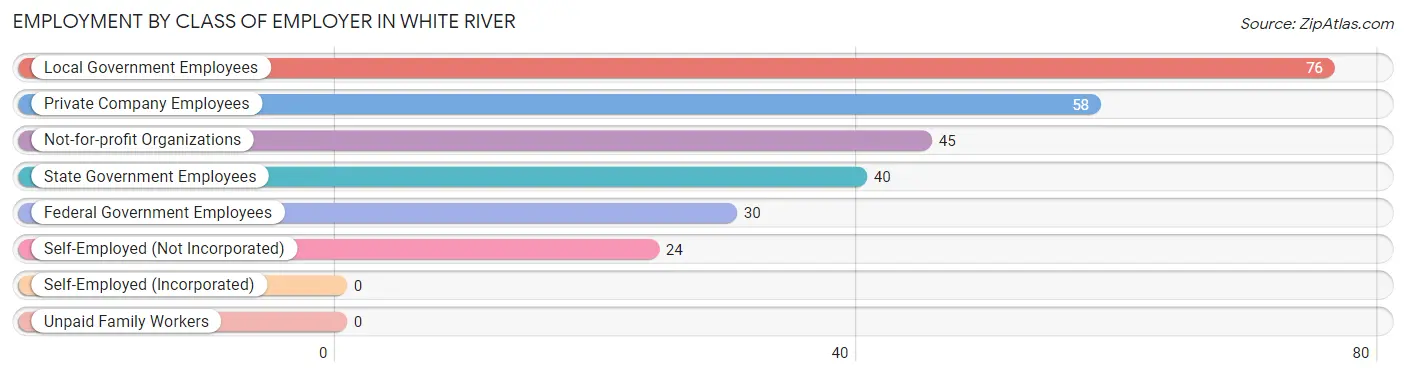
| Employer Class | # Employees | % Employees |
| Private Company Employees | 58 | 21.2% |
| Self-Employed (Incorporated) | 0 | 0.0% |
| Self-Employed (Not Incorporated) | 24 | 8.8% |
| Not-for-profit Organizations | 45 | 16.5% |
| Local Government Employees | 76 | 27.8% |
| State Government Employees | 40 | 14.6% |
| Federal Government Employees | 30 | 11.0% |
| Unpaid Family Workers | 0 | 0.0% |
| Total | 273 | 100.0% |
Employment Status by Age in White River
According to the labor force statistics for White River, out of the total population over 16 years of age (486), 57.4% or 279 individuals are in the labor force, with 2.2% or 6 of them unemployed. The age group with the highest labor force participation rate is 35 to 44 years, with 91.5% or 75 individuals in the labor force. Within the labor force, the 30 to 34 years age range has the highest percentage of unemployed individuals, with 30.0% or 6 of them being unemployed.
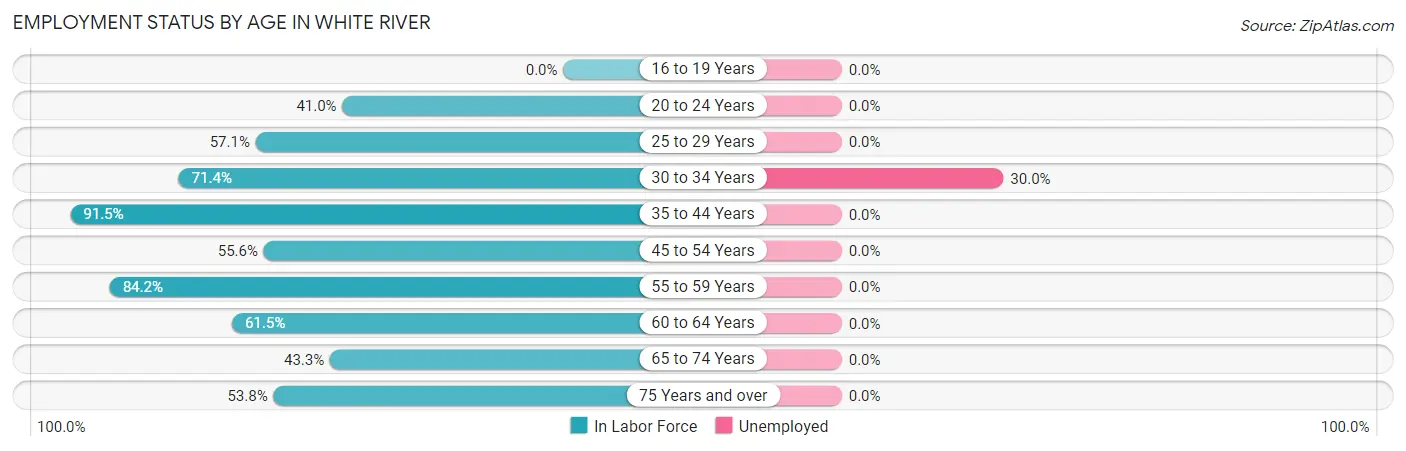
| Age Bracket | In Labor Force | Unemployed |
| 16 to 19 Years | 0 (0.0%) | 0 (0.0%) |
| 20 to 24 Years | 32 (41.0%) | 0 (0.0%) |
| 25 to 29 Years | 28 (57.1%) | 0 (0.0%) |
| 30 to 34 Years | 20 (71.4%) | 6 (30.0%) |
| 35 to 44 Years | 75 (91.5%) | 0 (0.0%) |
| 45 to 54 Years | 45 (55.6%) | 0 (0.0%) |
| 55 to 59 Years | 16 (84.2%) | 0 (0.0%) |
| 60 to 64 Years | 16 (61.5%) | 0 (0.0%) |
| 65 to 74 Years | 26 (43.3%) | 0 (0.0%) |
| 75 Years and over | 21 (53.8%) | 0 (0.0%) |
| Total | 279 (57.4%) | 6 (2.2%) |
Employment Status by Educational Attainment in White River
According to labor force statistics for White River, 70.2% of individuals (200) out of the total population between 25 and 64 years of age (285) are in the labor force, with 3.0% or 6 of them being unemployed. The group with the highest labor force participation rate are those with the educational attainment of bachelor's degree or higher, with 100.0% or 31 individuals in the labor force. Within the labor force, individuals with high school diploma education have the highest percentage of unemployment, with 11.5% or 6 of them being unemployed.
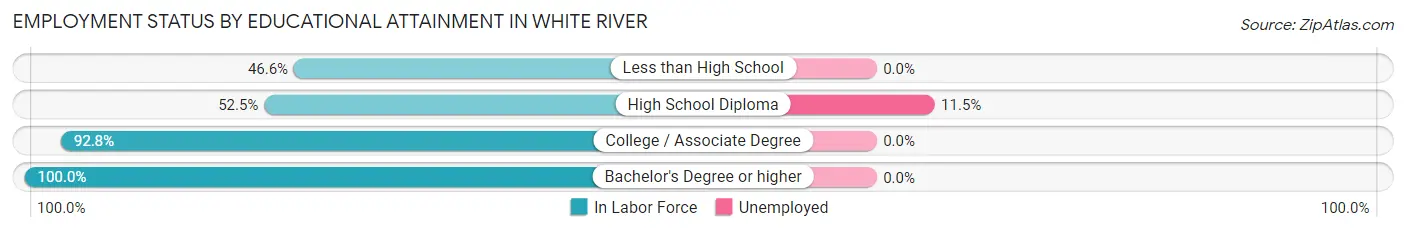
| Educational Attainment | In Labor Force | Unemployed |
| Less than High School | 27 (46.6%) | 0 (0.0%) |
| High School Diploma | 52 (52.5%) | 11 (11.5%) |
| College / Associate Degree | 90 (92.8%) | 0 (0.0%) |
| Bachelor's Degree or higher | 31 (100.0%) | 0 (0.0%) |
| Total | 200 (70.2%) | 9 (3.0%) |
Employment Occupations by Sex in White River
Management, Business, Science and Arts Occupations
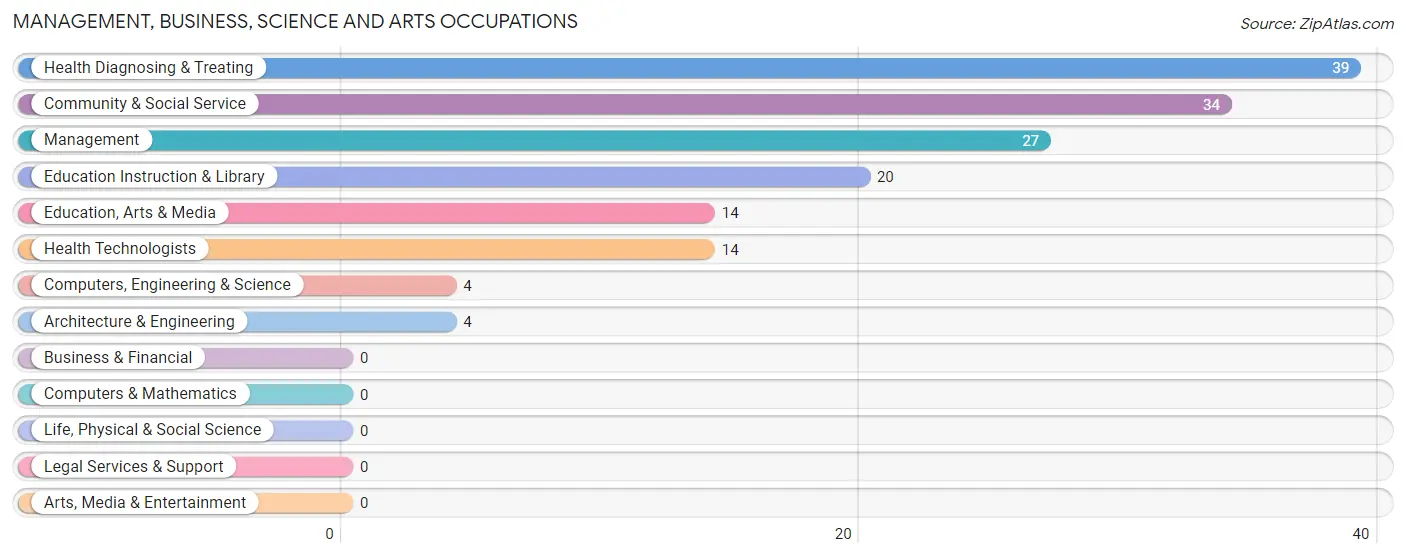
The most common Management, Business, Science and Arts occupations in White River are Health Diagnosing & Treating (39 | 14.3%), Community & Social Service (34 | 12.4%), Management (27 | 9.9%), Education Instruction & Library (20 | 7.3%), and Education, Arts & Media (14 | 5.1%).
Management, Business, Science and Arts Occupations by Sex
Within the Management, Business, Science and Arts occupations in White River, the most male-oriented occupations are Computers, Engineering & Science (100.0%), Architecture & Engineering (100.0%), and Management (59.3%), while the most female-oriented occupations are Community & Social Service (100.0%), Education, Arts & Media (100.0%), and Education Instruction & Library (100.0%).
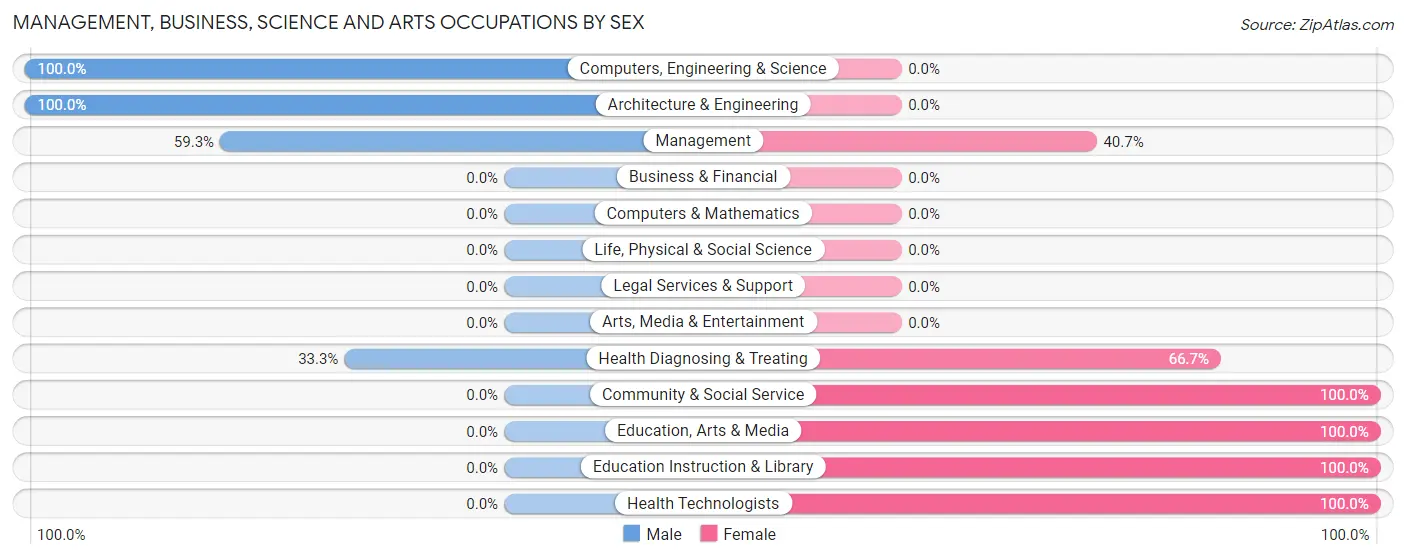
| Occupation | Male | Female |
| Management | 16 (59.3%) | 11 (40.7%) |
| Business & Financial | 0 (0.0%) | 0 (0.0%) |
| Computers, Engineering & Science | 4 (100.0%) | 0 (0.0%) |
| Computers & Mathematics | 0 (0.0%) | 0 (0.0%) |
| Architecture & Engineering | 4 (100.0%) | 0 (0.0%) |
| Life, Physical & Social Science | 0 (0.0%) | 0 (0.0%) |
| Community & Social Service | 0 (0.0%) | 34 (100.0%) |
| Education, Arts & Media | 0 (0.0%) | 14 (100.0%) |
| Legal Services & Support | 0 (0.0%) | 0 (0.0%) |
| Education Instruction & Library | 0 (0.0%) | 20 (100.0%) |
| Arts, Media & Entertainment | 0 (0.0%) | 0 (0.0%) |
| Health Diagnosing & Treating | 13 (33.3%) | 26 (66.7%) |
| Health Technologists | 0 (0.0%) | 14 (100.0%) |
| Total (Category) | 33 (31.7%) | 71 (68.3%) |
| Total (Overall) | 106 (38.8%) | 167 (61.2%) |
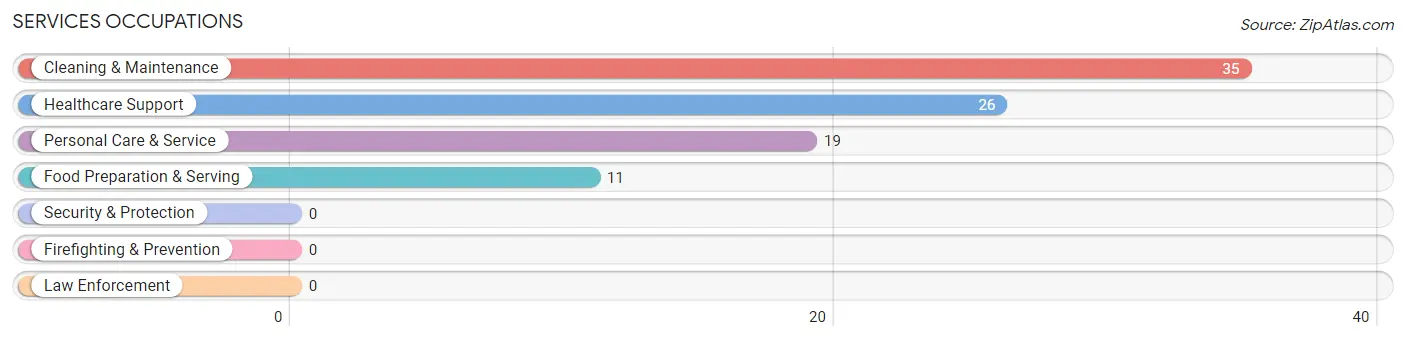
Services Occupations
The most common Services occupations in White River are Cleaning & Maintenance (35 | 12.8%), Healthcare Support (26 | 9.5%), Personal Care & Service (19 | 7.0%), and Food Preparation & Serving (11 | 4.0%).
Services Occupations by Sex
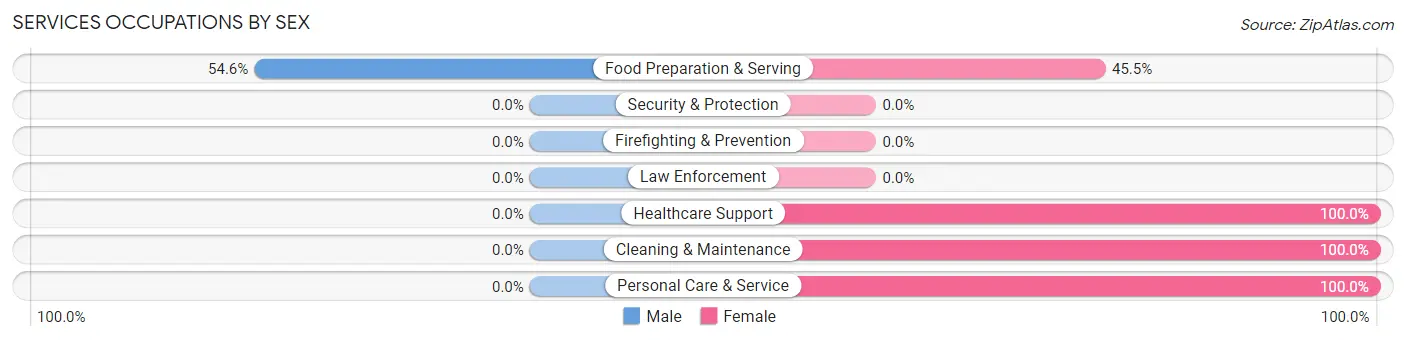
| Occupation | Male | Female |
| Healthcare Support | 0 (0.0%) | 26 (100.0%) |
| Security & Protection | 0 (0.0%) | 0 (0.0%) |
| Firefighting & Prevention | 0 (0.0%) | 0 (0.0%) |
| Law Enforcement | 0 (0.0%) | 0 (0.0%) |
| Food Preparation & Serving | 6 (54.5%) | 5 (45.5%) |
| Cleaning & Maintenance | 0 (0.0%) | 35 (100.0%) |
| Personal Care & Service | 0 (0.0%) | 19 (100.0%) |
| Total (Category) | 6 (6.6%) | 85 (93.4%) |
| Total (Overall) | 106 (38.8%) | 167 (61.2%) |
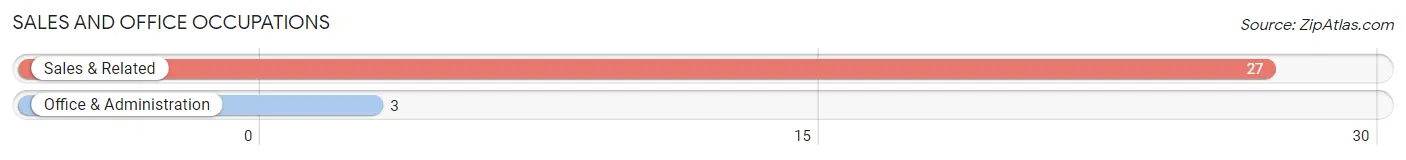
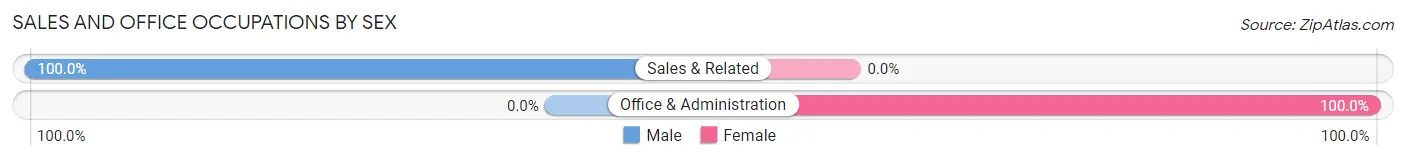
Sales and Office Occupations
The most common Sales and Office occupations in White River are Sales & Related (27 | 9.9%), and Office & Administration (3 | 1.1%).
Sales and Office Occupations by Sex
| Occupation | Male | Female |
| Sales & Related | 27 (100.0%) | 0 (0.0%) |
| Office & Administration | 0 (0.0%) | 3 (100.0%) |
| Total (Category) | 27 (90.0%) | 3 (10.0%) |
| Total (Overall) | 106 (38.8%) | 167 (61.2%) |
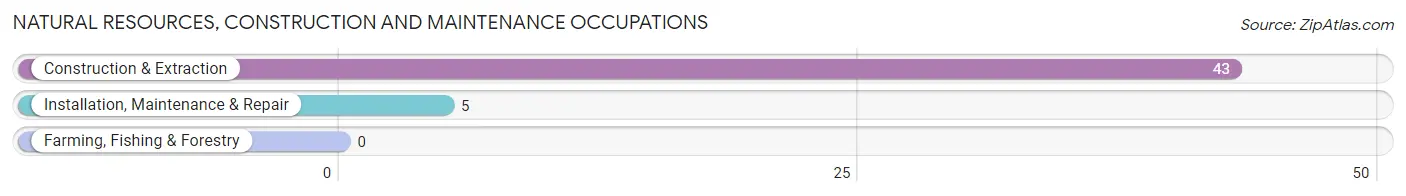
Natural Resources, Construction and Maintenance Occupations
The most common Natural Resources, Construction and Maintenance occupations in White River are Construction & Extraction (43 | 15.8%), and Installation, Maintenance & Repair (5 | 1.8%).
Natural Resources, Construction and Maintenance Occupations by Sex
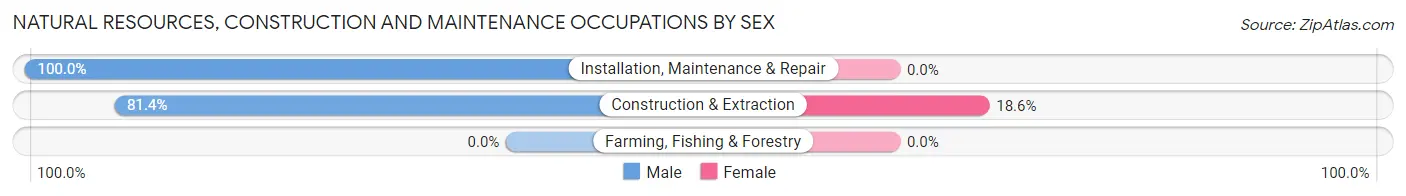
| Occupation | Male | Female |
| Farming, Fishing & Forestry | 0 (0.0%) | 0 (0.0%) |
| Construction & Extraction | 35 (81.4%) | 8 (18.6%) |
| Installation, Maintenance & Repair | 5 (100.0%) | 0 (0.0%) |
| Total (Category) | 40 (83.3%) | 8 (16.7%) |
| Total (Overall) | 106 (38.8%) | 167 (61.2%) |
Production, Transportation and Moving Occupations
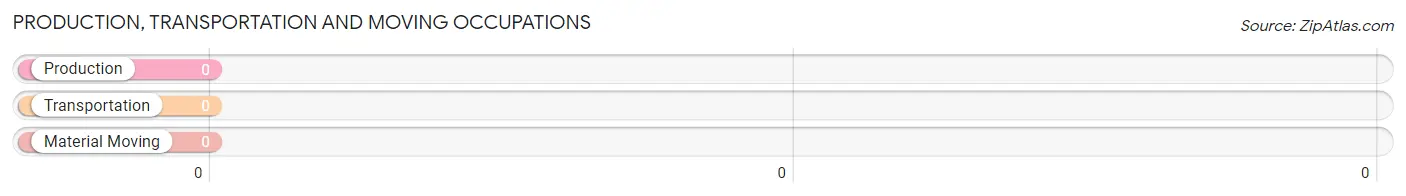
Production, Transportation and Moving Occupations by Sex
| Occupation | Male | Female |
| Production | 0 (0.0%) | 0 (0.0%) |
| Transportation | 0 (0.0%) | 0 (0.0%) |
| Material Moving | 0 (0.0%) | 0 (0.0%) |
| Total (Category) | 0 (0.0%) | 0 (0.0%) |
| Total (Overall) | 106 (38.8%) | 167 (61.2%) |
Employment Industries by Sex in White River
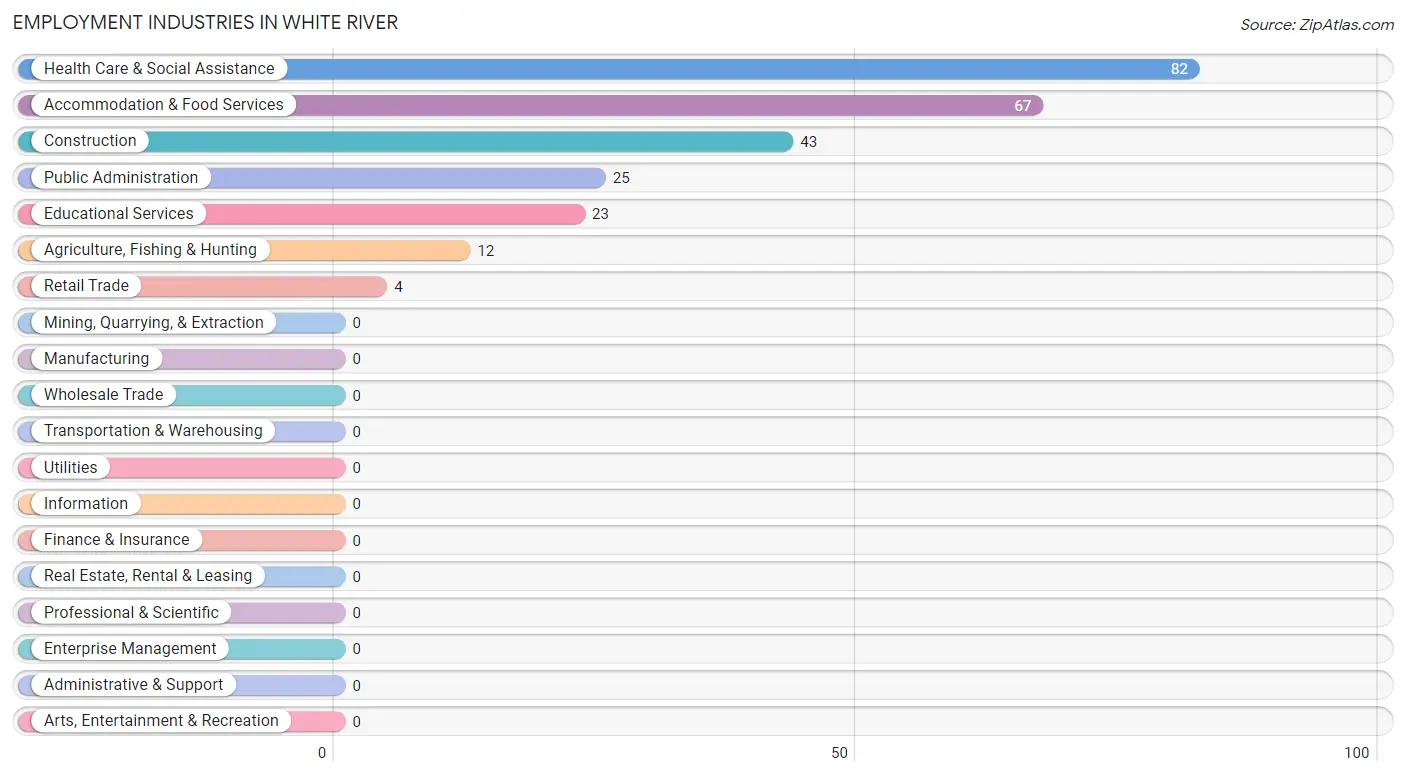
Employment Industries in White River
The major employment industries in White River include Health Care & Social Assistance (82 | 30.0%), Accommodation & Food Services (67 | 24.5%), Construction (43 | 15.8%), Public Administration (25 | 9.2%), and Educational Services (23 | 8.4%).
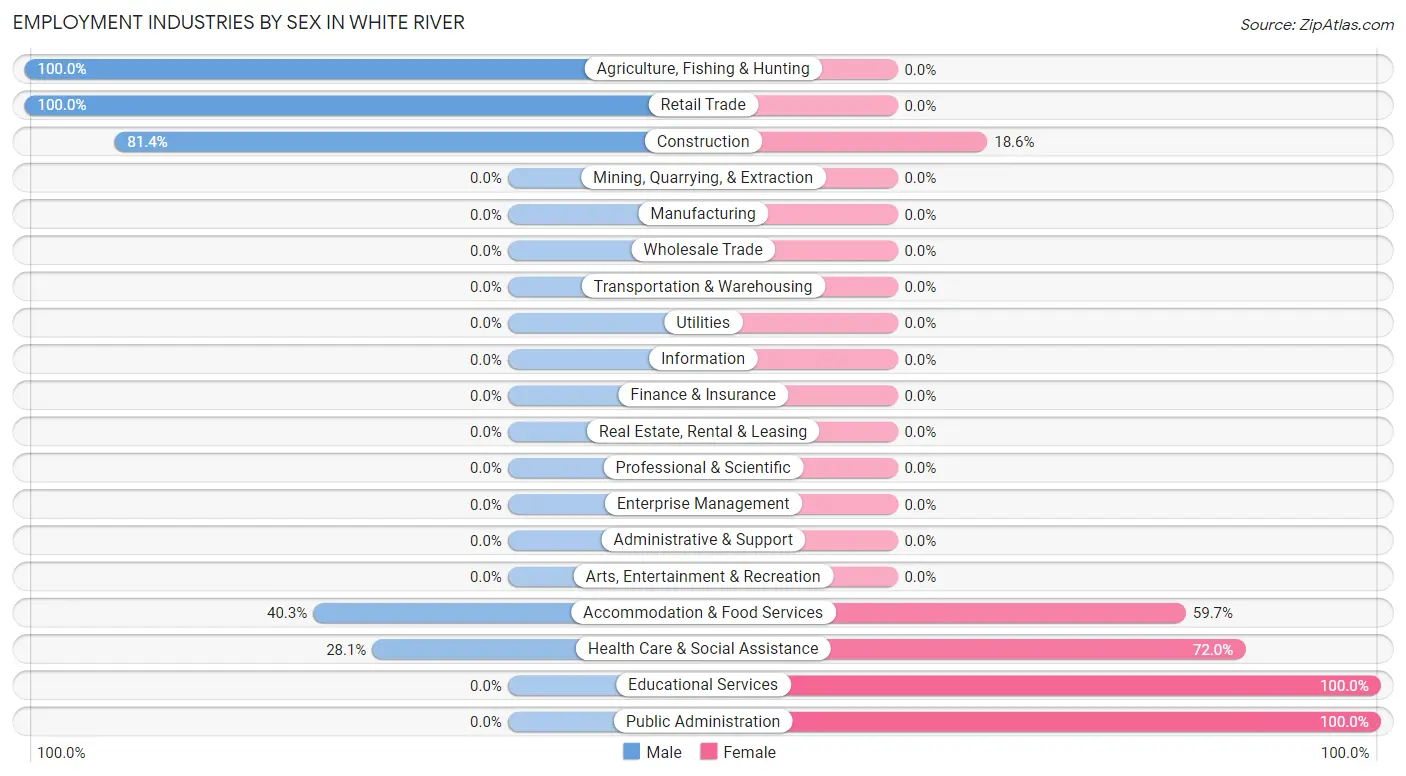
Employment Industries by Sex in White River
The White River industries that see more men than women are Agriculture, Fishing & Hunting (100.0%), Retail Trade (100.0%), and Construction (81.4%), whereas the industries that tend to have a higher number of women are Educational Services (100.0%), Public Administration (100.0%), and Health Care & Social Assistance (72.0%).
| Industry | Male | Female |
| Agriculture, Fishing & Hunting | 12 (100.0%) | 0 (0.0%) |
| Mining, Quarrying, & Extraction | 0 (0.0%) | 0 (0.0%) |
| Construction | 35 (81.4%) | 8 (18.6%) |
| Manufacturing | 0 (0.0%) | 0 (0.0%) |
| Wholesale Trade | 0 (0.0%) | 0 (0.0%) |
| Retail Trade | 4 (100.0%) | 0 (0.0%) |
| Transportation & Warehousing | 0 (0.0%) | 0 (0.0%) |
| Utilities | 0 (0.0%) | 0 (0.0%) |
| Information | 0 (0.0%) | 0 (0.0%) |
| Finance & Insurance | 0 (0.0%) | 0 (0.0%) |
| Real Estate, Rental & Leasing | 0 (0.0%) | 0 (0.0%) |
| Professional & Scientific | 0 (0.0%) | 0 (0.0%) |
| Enterprise Management | 0 (0.0%) | 0 (0.0%) |
| Administrative & Support | 0 (0.0%) | 0 (0.0%) |
| Educational Services | 0 (0.0%) | 23 (100.0%) |
| Health Care & Social Assistance | 23 (28.1%) | 59 (72.0%) |
| Arts, Entertainment & Recreation | 0 (0.0%) | 0 (0.0%) |
| Accommodation & Food Services | 27 (40.3%) | 40 (59.7%) |
| Public Administration | 0 (0.0%) | 25 (100.0%) |
| Total | 106 (38.8%) | 167 (61.2%) |
Education in White River
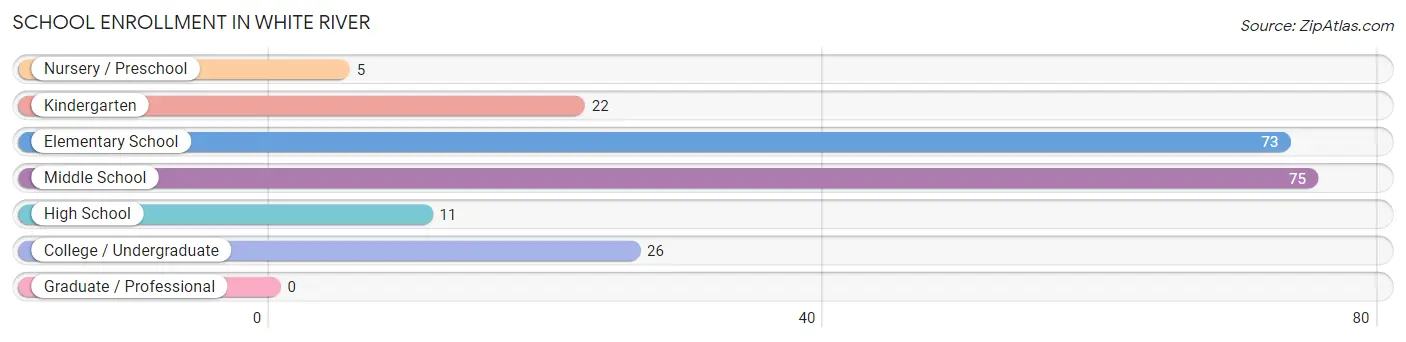
School Enrollment in White River
The most common levels of schooling among the 212 students in White River are middle school (75 | 35.4%), elementary school (73 | 34.4%), and college / undergraduate (26 | 12.3%).
| School Level | # Students | % Students |
| Nursery / Preschool | 5 | 2.4% |
| Kindergarten | 22 | 10.4% |
| Elementary School | 73 | 34.4% |
| Middle School | 75 | 35.4% |
| High School | 11 | 5.2% |
| College / Undergraduate | 26 | 12.3% |
| Graduate / Professional | 0 | 0.0% |
| Total | 212 | 100.0% |
School Enrollment by Age by Funding Source in White River
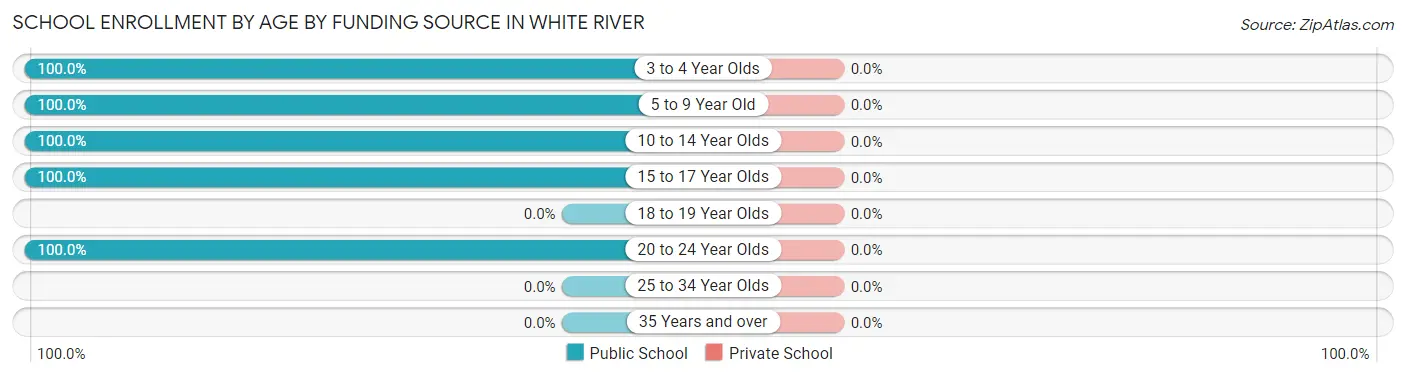
| Age Bracket | Public School | Private School |
| 3 to 4 Year Olds | 5 (100.0%) | 0 (0.0%) |
| 5 to 9 Year Old | 76 (100.0%) | 0 (0.0%) |
| 10 to 14 Year Olds | 94 (100.0%) | 0 (0.0%) |
| 15 to 17 Year Olds | 11 (100.0%) | 0 (0.0%) |
| 18 to 19 Year Olds | 0 (0.0%) | 0 (0.0%) |
| 20 to 24 Year Olds | 26 (100.0%) | 0 (0.0%) |
| 25 to 34 Year Olds | 0 (0.0%) | 0 (0.0%) |
| 35 Years and over | 0 (0.0%) | 0 (0.0%) |
| Total | 212 (100.0%) | 0 (0.0%) |
Educational Attainment by Field of Study in White River
Education (22 | 50.0%), science & technology (16 | 36.4%), psychology (3 | 6.8%), and visual & performing arts (3 | 6.8%) are the most common fields of study among 44 individuals in White River who have obtained a bachelor's degree or higher.
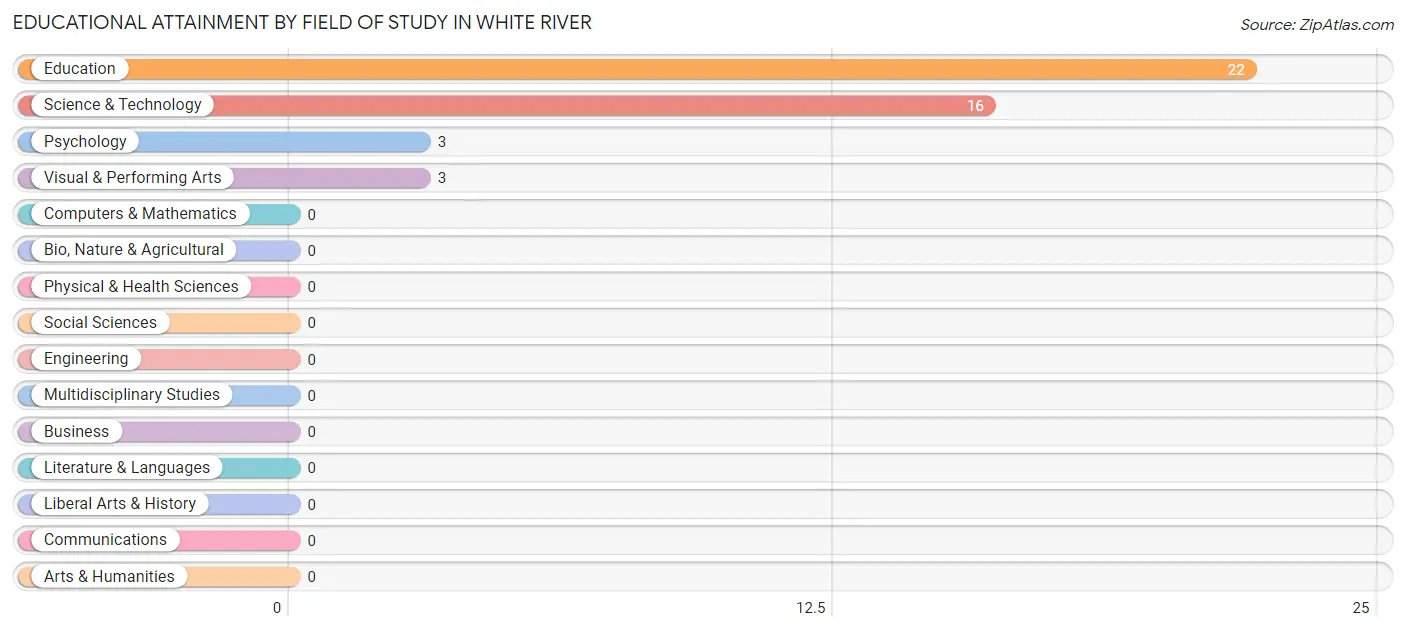
| Field of Study | # Graduates | % Graduates |
| Computers & Mathematics | 0 | 0.0% |
| Bio, Nature & Agricultural | 0 | 0.0% |
| Physical & Health Sciences | 0 | 0.0% |
| Psychology | 3 | 6.8% |
| Social Sciences | 0 | 0.0% |
| Engineering | 0 | 0.0% |
| Multidisciplinary Studies | 0 | 0.0% |
| Science & Technology | 16 | 36.4% |
| Business | 0 | 0.0% |
| Education | 22 | 50.0% |
| Literature & Languages | 0 | 0.0% |
| Liberal Arts & History | 0 | 0.0% |
| Visual & Performing Arts | 3 | 6.8% |
| Communications | 0 | 0.0% |
| Arts & Humanities | 0 | 0.0% |
| Total | 44 | 100.0% |
Transportation & Commute in White River
Vehicle Availability by Sex in White River
The most prevalent vehicle ownership categories in White River are males with 3 vehicles (52, accounting for 49.1%) and females with 3 vehicles (99, making up 31.1%).
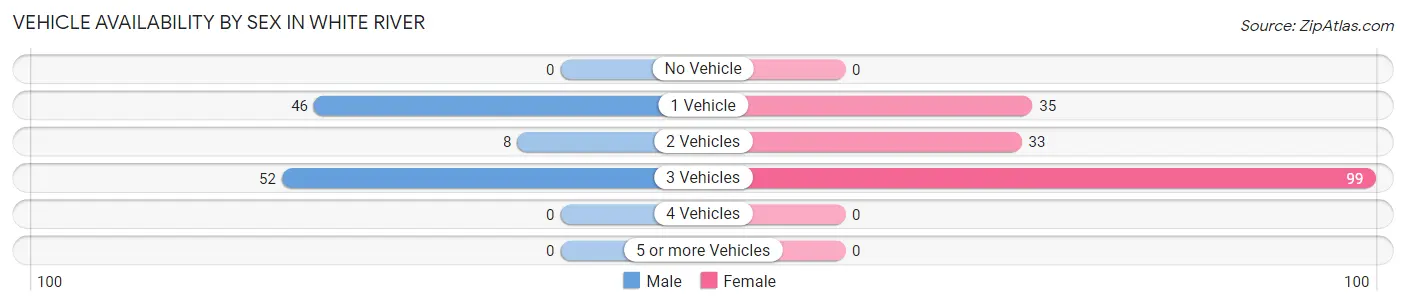
| Vehicles Available | Male | Female |
| No Vehicle | 0 (0.0%) | 0 (0.0%) |
| 1 Vehicle | 46 (43.4%) | 35 (21.0%) |
| 2 Vehicles | 8 (7.5%) | 33 (19.8%) |
| 3 Vehicles | 52 (49.1%) | 99 (59.3%) |
| 4 Vehicles | 0 (0.0%) | 0 (0.0%) |
| 5 or more Vehicles | 0 (0.0%) | 0 (0.0%) |
| Total | 106 (100.0%) | 167 (100.0%) |
Commute Time in White River
The most frequently occuring commute durations in White River are less than 5 minutes (59 commuters, 22.4%), 5 to 9 minutes (44 commuters, 16.7%), and 15 to 19 minutes (36 commuters, 13.6%).
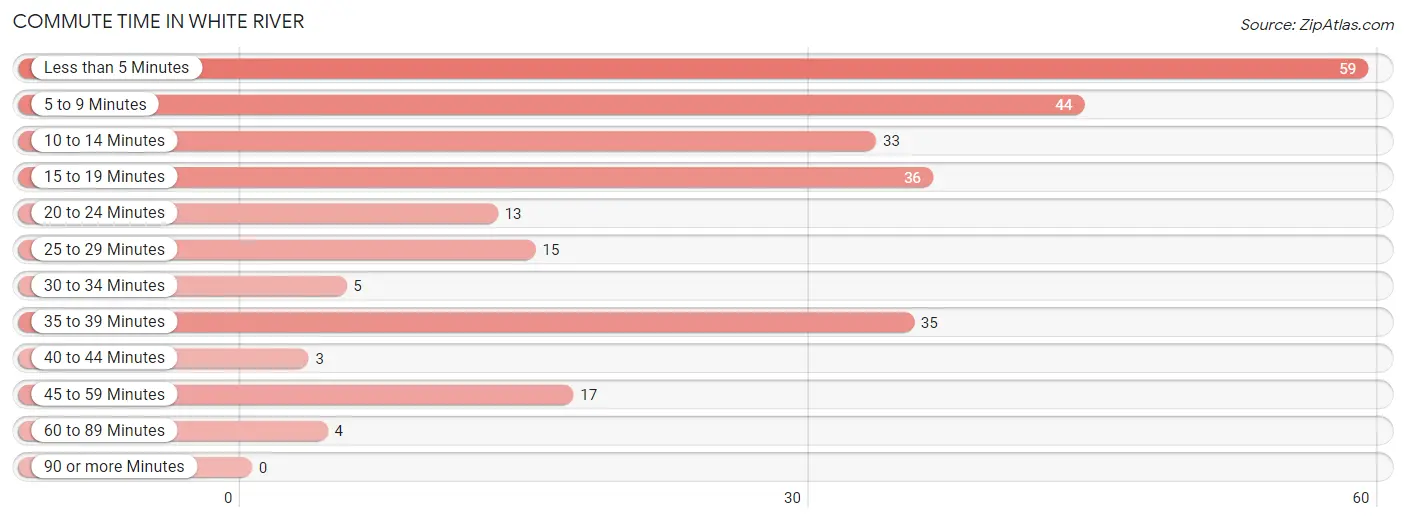
| Commute Time | # Commuters | % Commuters |
| Less than 5 Minutes | 59 | 22.4% |
| 5 to 9 Minutes | 44 | 16.7% |
| 10 to 14 Minutes | 33 | 12.5% |
| 15 to 19 Minutes | 36 | 13.6% |
| 20 to 24 Minutes | 13 | 4.9% |
| 25 to 29 Minutes | 15 | 5.7% |
| 30 to 34 Minutes | 5 | 1.9% |
| 35 to 39 Minutes | 35 | 13.3% |
| 40 to 44 Minutes | 3 | 1.1% |
| 45 to 59 Minutes | 17 | 6.4% |
| 60 to 89 Minutes | 4 | 1.5% |
| 90 or more Minutes | 0 | 0.0% |
Commute Time by Sex in White River
The most common commute times in White River are 15 to 19 minutes (33 commuters, 34.0%) for males and less than 5 minutes (45 commuters, 27.0%) for females.
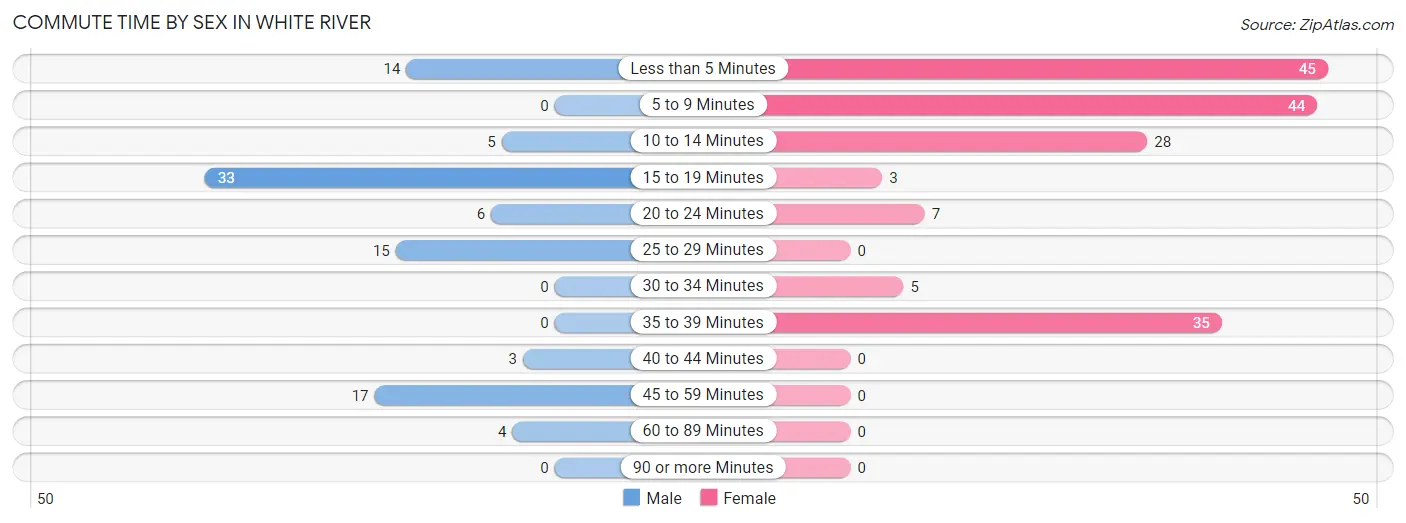
| Commute Time | Male | Female |
| Less than 5 Minutes | 14 (14.4%) | 45 (27.0%) |
| 5 to 9 Minutes | 0 (0.0%) | 44 (26.4%) |
| 10 to 14 Minutes | 5 (5.1%) | 28 (16.8%) |
| 15 to 19 Minutes | 33 (34.0%) | 3 (1.8%) |
| 20 to 24 Minutes | 6 (6.2%) | 7 (4.2%) |
| 25 to 29 Minutes | 15 (15.5%) | 0 (0.0%) |
| 30 to 34 Minutes | 0 (0.0%) | 5 (3.0%) |
| 35 to 39 Minutes | 0 (0.0%) | 35 (21.0%) |
| 40 to 44 Minutes | 3 (3.1%) | 0 (0.0%) |
| 45 to 59 Minutes | 17 (17.5%) | 0 (0.0%) |
| 60 to 89 Minutes | 4 (4.1%) | 0 (0.0%) |
| 90 or more Minutes | 0 (0.0%) | 0 (0.0%) |
Time of Departure to Work by Sex in White River
The most frequent times of departure to work in White River are 7:30 AM to 7:59 AM (47, 48.4%) for males and 7:30 AM to 7:59 AM (69, 41.3%) for females.
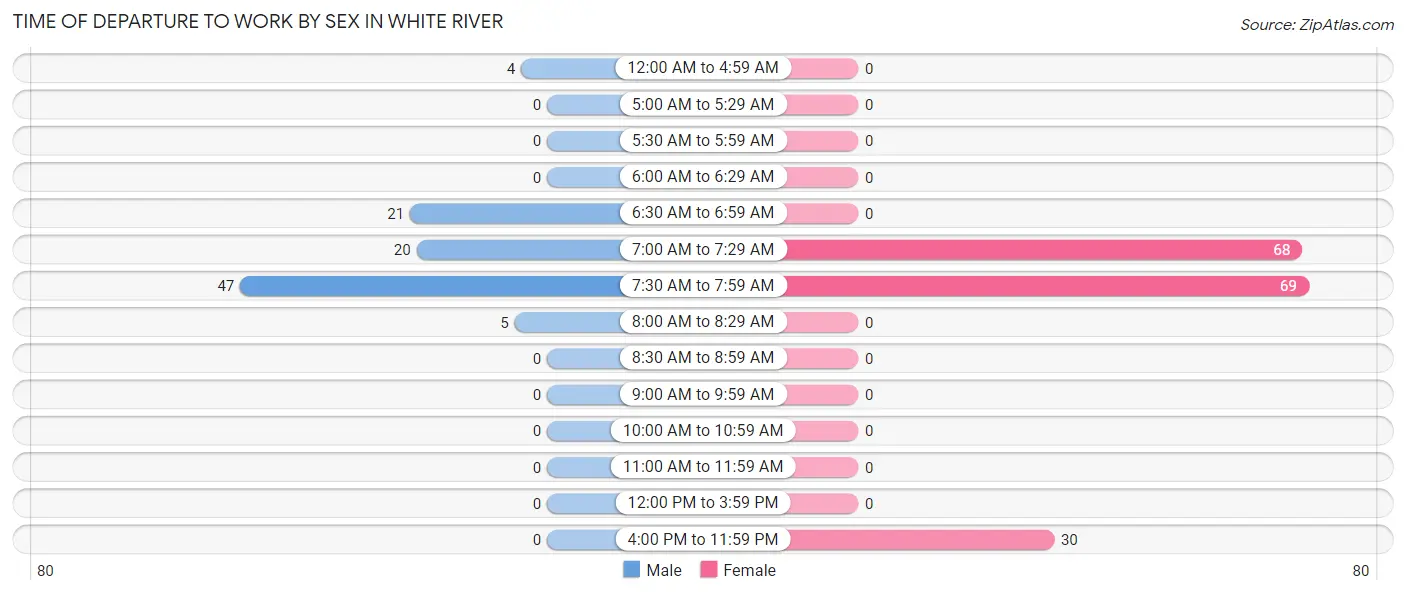
| Time of Departure | Male | Female |
| 12:00 AM to 4:59 AM | 4 (4.1%) | 0 (0.0%) |
| 5:00 AM to 5:29 AM | 0 (0.0%) | 0 (0.0%) |
| 5:30 AM to 5:59 AM | 0 (0.0%) | 0 (0.0%) |
| 6:00 AM to 6:29 AM | 0 (0.0%) | 0 (0.0%) |
| 6:30 AM to 6:59 AM | 21 (21.6%) | 0 (0.0%) |
| 7:00 AM to 7:29 AM | 20 (20.6%) | 68 (40.7%) |
| 7:30 AM to 7:59 AM | 47 (48.4%) | 69 (41.3%) |
| 8:00 AM to 8:29 AM | 5 (5.1%) | 0 (0.0%) |
| 8:30 AM to 8:59 AM | 0 (0.0%) | 0 (0.0%) |
| 9:00 AM to 9:59 AM | 0 (0.0%) | 0 (0.0%) |
| 10:00 AM to 10:59 AM | 0 (0.0%) | 0 (0.0%) |
| 11:00 AM to 11:59 AM | 0 (0.0%) | 0 (0.0%) |
| 12:00 PM to 3:59 PM | 0 (0.0%) | 0 (0.0%) |
| 4:00 PM to 11:59 PM | 0 (0.0%) | 30 (18.0%) |
| Total | 97 (100.0%) | 167 (100.0%) |
Housing Occupancy in White River
Occupancy by Ownership in White River
Of the total 200 dwellings in White River, owner-occupied units account for 97 (48.5%), while renter-occupied units make up 103 (51.5%).
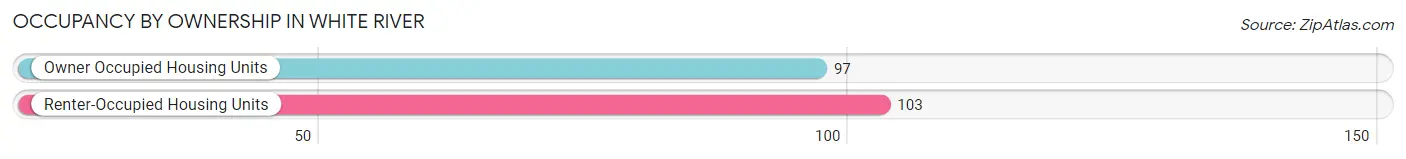
| Occupancy | # Housing Units | % Housing Units |
| Owner Occupied Housing Units | 97 | 48.5% |
| Renter-Occupied Housing Units | 103 | 51.5% |
| Total Occupied Housing Units | 200 | 100.0% |
Occupancy by Household Size in White River
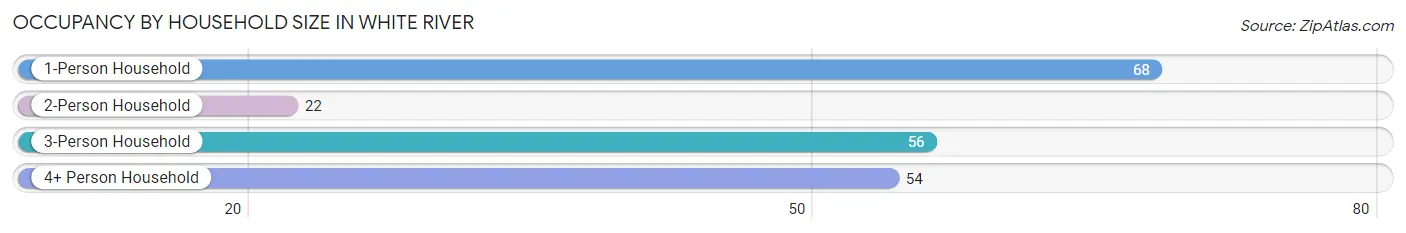
| Household Size | # Housing Units | % Housing Units |
| 1-Person Household | 68 | 34.0% |
| 2-Person Household | 22 | 11.0% |
| 3-Person Household | 56 | 28.0% |
| 4+ Person Household | 54 | 27.0% |
| Total Housing Units | 200 | 100.0% |
Occupancy by Ownership by Household Size in White River
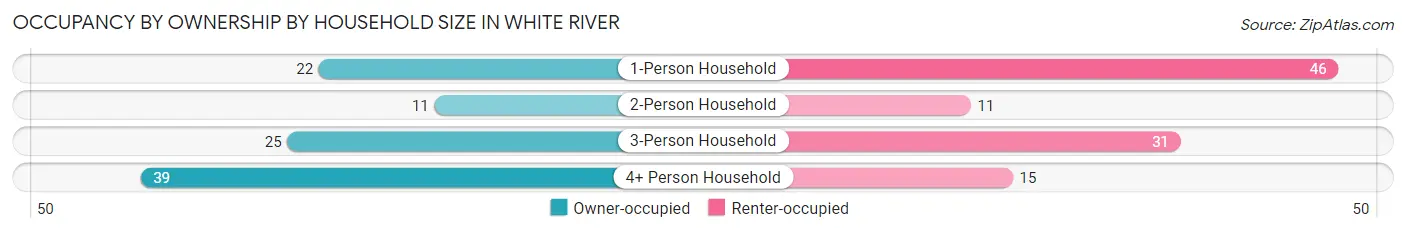
| Household Size | Owner-occupied | Renter-occupied |
| 1-Person Household | 22 (32.4%) | 46 (67.6%) |
| 2-Person Household | 11 (50.0%) | 11 (50.0%) |
| 3-Person Household | 25 (44.6%) | 31 (55.4%) |
| 4+ Person Household | 39 (72.2%) | 15 (27.8%) |
| Total Housing Units | 97 (48.5%) | 103 (51.5%) |
Occupancy by Educational Attainment in White River
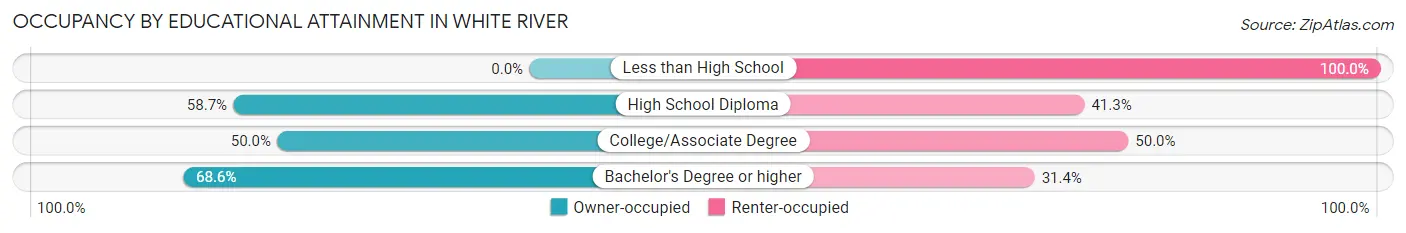
| Household Size | Owner-occupied | Renter-occupied |
| Less than High School | 0 (0.0%) | 27 (100.0%) |
| High School Diploma | 27 (58.7%) | 19 (41.3%) |
| College/Associate Degree | 46 (50.0%) | 46 (50.0%) |
| Bachelor's Degree or higher | 24 (68.6%) | 11 (31.4%) |
Occupancy by Age of Householder in White River
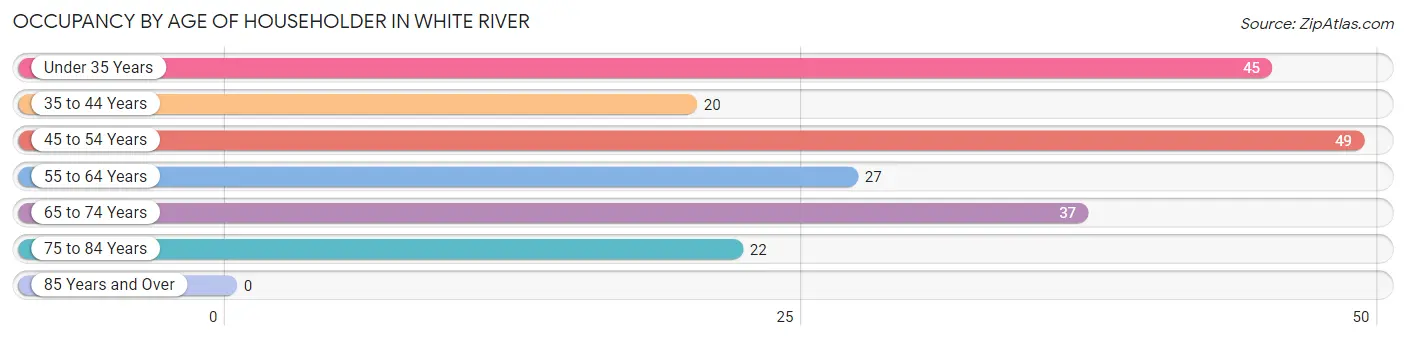
| Age Bracket | # Households | % Households |
| Under 35 Years | 45 | 22.5% |
| 35 to 44 Years | 20 | 10.0% |
| 45 to 54 Years | 49 | 24.5% |
| 55 to 64 Years | 27 | 13.5% |
| 65 to 74 Years | 37 | 18.5% |
| 75 to 84 Years | 22 | 11.0% |
| 85 Years and Over | 0 | 0.0% |
| Total | 200 | 100.0% |
Housing Finances in White River
Median Income by Occupancy in White River
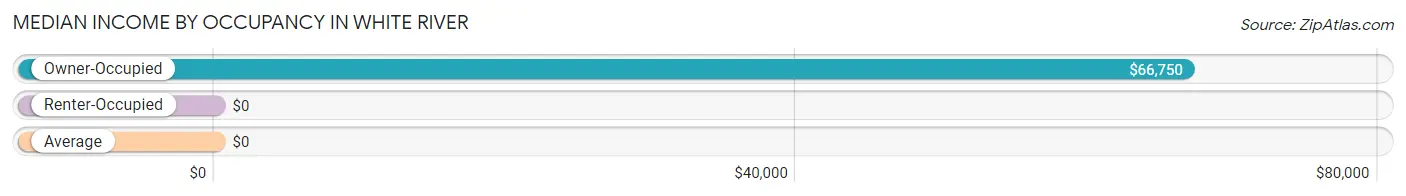
| Occupancy Type | # Households | Median Income |
| Owner-Occupied | 97 (48.5%) | $66,750 |
| Renter-Occupied | 103 (51.5%) | $0 |
| Average | 200 (100.0%) | $0 |
Occupancy by Householder Income Bracket in White River
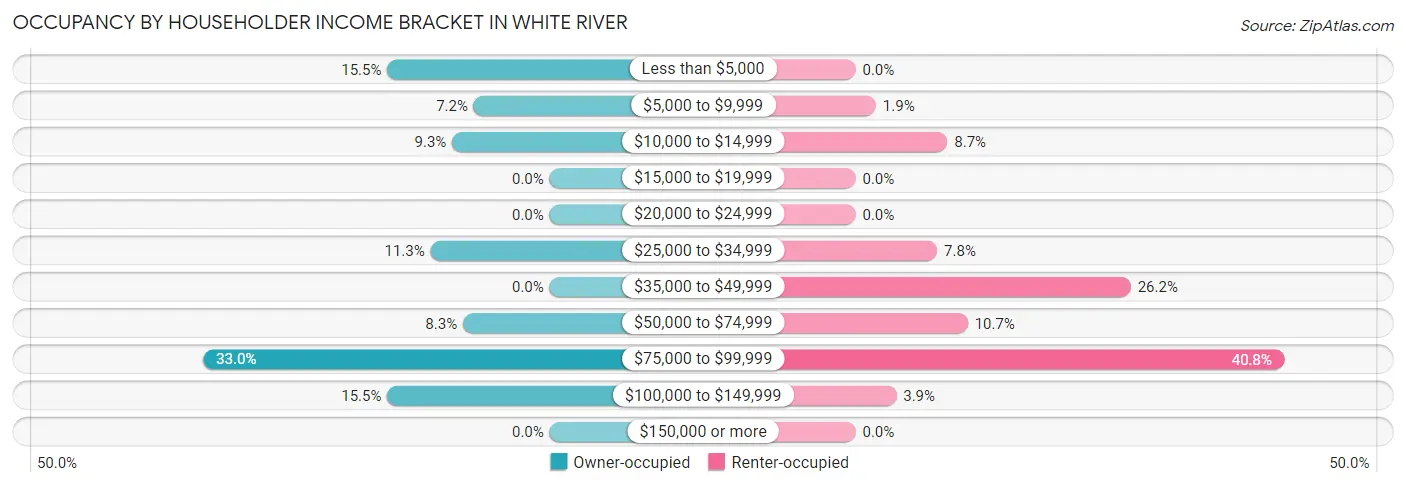
| Income Bracket | Owner-occupied | Renter-occupied |
| Less than $5,000 | 15 (15.5%) | 0 (0.0%) |
| $5,000 to $9,999 | 7 (7.2%) | 2 (1.9%) |
| $10,000 to $14,999 | 9 (9.3%) | 9 (8.7%) |
| $15,000 to $19,999 | 0 (0.0%) | 0 (0.0%) |
| $20,000 to $24,999 | 0 (0.0%) | 0 (0.0%) |
| $25,000 to $34,999 | 11 (11.3%) | 8 (7.8%) |
| $35,000 to $49,999 | 0 (0.0%) | 27 (26.2%) |
| $50,000 to $74,999 | 8 (8.3%) | 11 (10.7%) |
| $75,000 to $99,999 | 32 (33.0%) | 42 (40.8%) |
| $100,000 to $149,999 | 15 (15.5%) | 4 (3.9%) |
| $150,000 or more | 0 (0.0%) | 0 (0.0%) |
| Total | 97 (100.0%) | 103 (100.0%) |
Monthly Housing Cost Tiers in White River
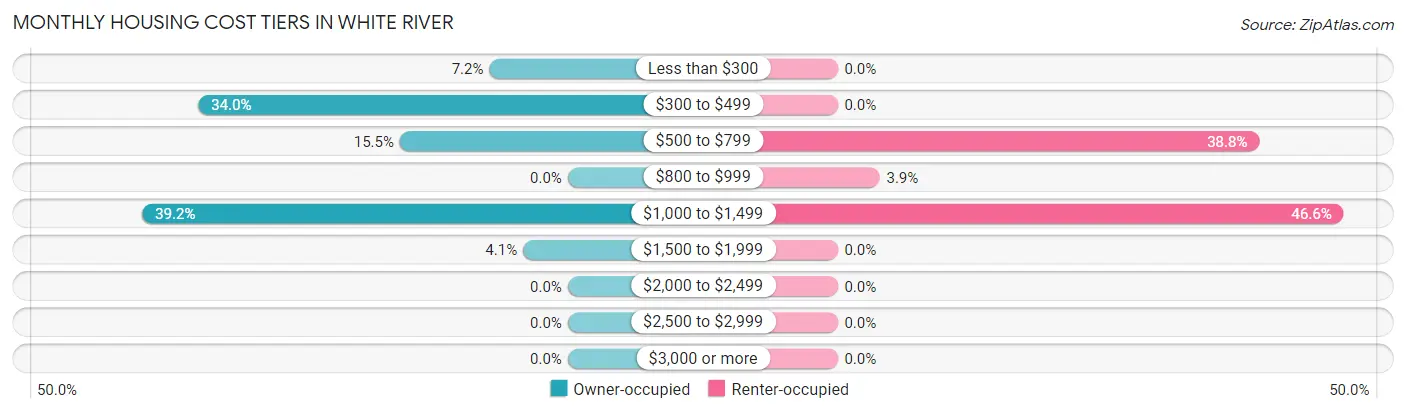
| Monthly Cost | Owner-occupied | Renter-occupied |
| Less than $300 | 7 (7.2%) | 0 (0.0%) |
| $300 to $499 | 33 (34.0%) | 0 (0.0%) |
| $500 to $799 | 15 (15.5%) | 40 (38.8%) |
| $800 to $999 | 0 (0.0%) | 4 (3.9%) |
| $1,000 to $1,499 | 38 (39.2%) | 48 (46.6%) |
| $1,500 to $1,999 | 4 (4.1%) | 0 (0.0%) |
| $2,000 to $2,499 | 0 (0.0%) | 0 (0.0%) |
| $2,500 to $2,999 | 0 (0.0%) | 0 (0.0%) |
| $3,000 or more | 0 (0.0%) | 0 (0.0%) |
| Total | 97 (100.0%) | 103 (100.0%) |
Physical Housing Characteristics in White River
Housing Structures in White River
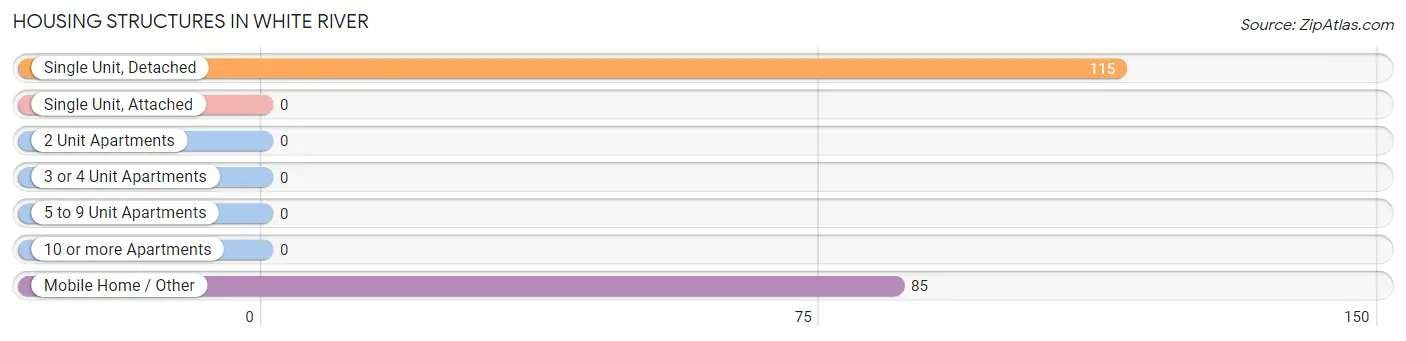
| Structure Type | # Housing Units | % Housing Units |
| Single Unit, Detached | 115 | 57.5% |
| Single Unit, Attached | 0 | 0.0% |
| 2 Unit Apartments | 0 | 0.0% |
| 3 or 4 Unit Apartments | 0 | 0.0% |
| 5 to 9 Unit Apartments | 0 | 0.0% |
| 10 or more Apartments | 0 | 0.0% |
| Mobile Home / Other | 85 | 42.5% |
| Total | 200 | 100.0% |
Housing Structures by Occupancy in White River
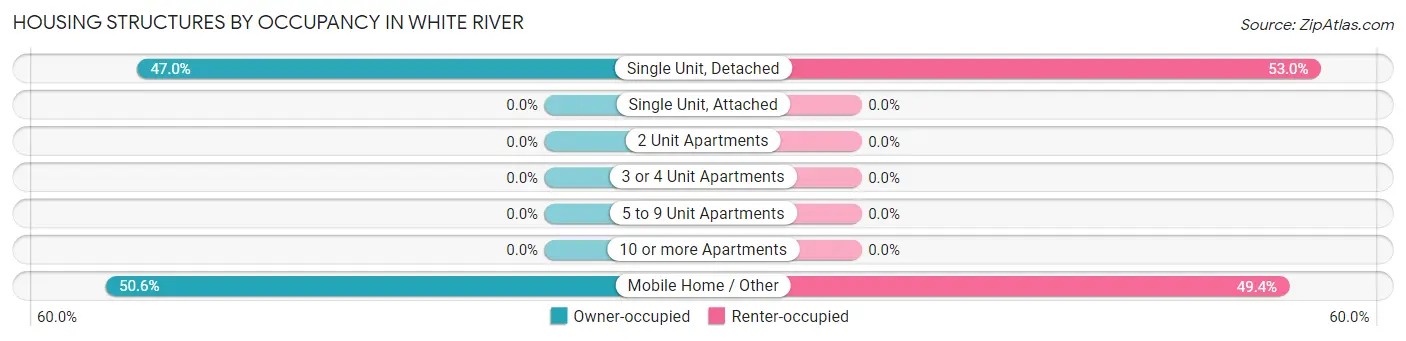
| Structure Type | Owner-occupied | Renter-occupied |
| Single Unit, Detached | 54 (47.0%) | 61 (53.0%) |
| Single Unit, Attached | 0 (0.0%) | 0 (0.0%) |
| 2 Unit Apartments | 0 (0.0%) | 0 (0.0%) |
| 3 or 4 Unit Apartments | 0 (0.0%) | 0 (0.0%) |
| 5 to 9 Unit Apartments | 0 (0.0%) | 0 (0.0%) |
| 10 or more Apartments | 0 (0.0%) | 0 (0.0%) |
| Mobile Home / Other | 43 (50.6%) | 42 (49.4%) |
| Total | 97 (48.5%) | 103 (51.5%) |
Housing Structures by Number of Rooms in White River
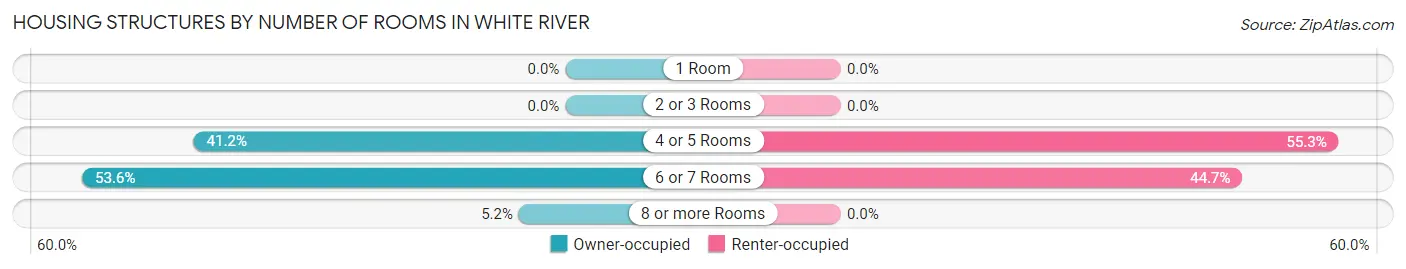
| Number of Rooms | Owner-occupied | Renter-occupied |
| 1 Room | 0 (0.0%) | 0 (0.0%) |
| 2 or 3 Rooms | 0 (0.0%) | 0 (0.0%) |
| 4 or 5 Rooms | 40 (41.2%) | 57 (55.3%) |
| 6 or 7 Rooms | 52 (53.6%) | 46 (44.7%) |
| 8 or more Rooms | 5 (5.1%) | 0 (0.0%) |
| Total | 97 (100.0%) | 103 (100.0%) |
Housing Structure by Heating Type in White River
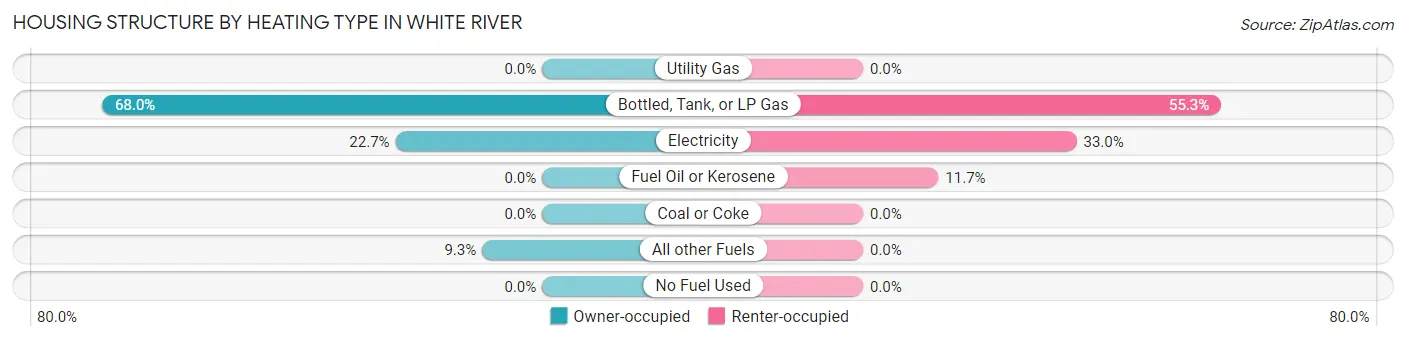
| Heating Type | Owner-occupied | Renter-occupied |
| Utility Gas | 0 (0.0%) | 0 (0.0%) |
| Bottled, Tank, or LP Gas | 66 (68.0%) | 57 (55.3%) |
| Electricity | 22 (22.7%) | 34 (33.0%) |
| Fuel Oil or Kerosene | 0 (0.0%) | 12 (11.7%) |
| Coal or Coke | 0 (0.0%) | 0 (0.0%) |
| All other Fuels | 9 (9.3%) | 0 (0.0%) |
| No Fuel Used | 0 (0.0%) | 0 (0.0%) |
| Total | 97 (100.0%) | 103 (100.0%) |
Household Vehicle Usage in White River
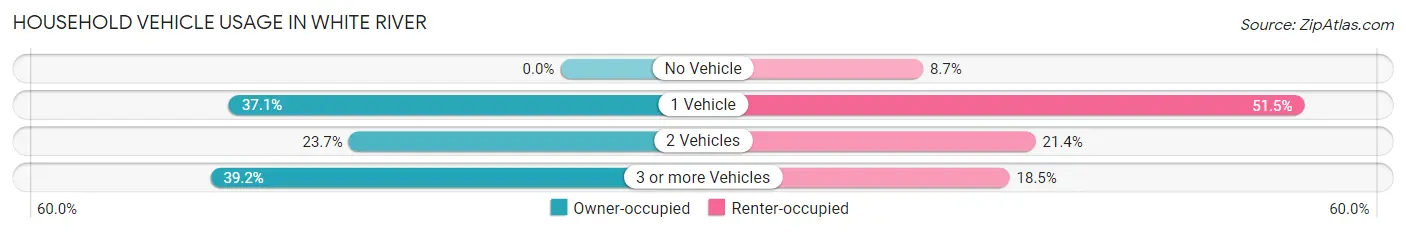
| Vehicles per Household | Owner-occupied | Renter-occupied |
| No Vehicle | 0 (0.0%) | 9 (8.7%) |
| 1 Vehicle | 36 (37.1%) | 53 (51.5%) |
| 2 Vehicles | 23 (23.7%) | 22 (21.4%) |
| 3 or more Vehicles | 38 (39.2%) | 19 (18.4%) |
| Total | 97 (100.0%) | 103 (100.0%) |
Real Estate & Mortgages in White River
Real Estate and Mortgage Overview in White River
| Characteristic | Without Mortgage | With Mortgage |
| Housing Units | 55 | 42 |
| Median Property Value | $51,600 | $80,800 |
| Median Household Income | - | - |
| Monthly Housing Costs | $384 | $0 |
| Real Estate Taxes | $1,679 | $0 |
Property Value by Mortgage Status in White River
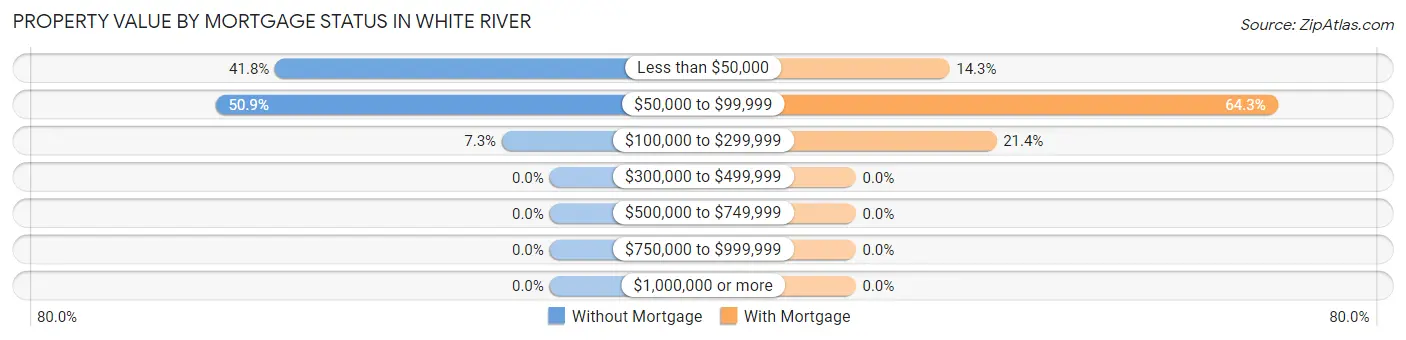
| Property Value | Without Mortgage | With Mortgage |
| Less than $50,000 | 23 (41.8%) | 6 (14.3%) |
| $50,000 to $99,999 | 28 (50.9%) | 27 (64.3%) |
| $100,000 to $299,999 | 4 (7.3%) | 9 (21.4%) |
| $300,000 to $499,999 | 0 (0.0%) | 0 (0.0%) |
| $500,000 to $749,999 | 0 (0.0%) | 0 (0.0%) |
| $750,000 to $999,999 | 0 (0.0%) | 0 (0.0%) |
| $1,000,000 or more | 0 (0.0%) | 0 (0.0%) |
| Total | 55 (100.0%) | 42 (100.0%) |
Household Income by Mortgage Status in White River
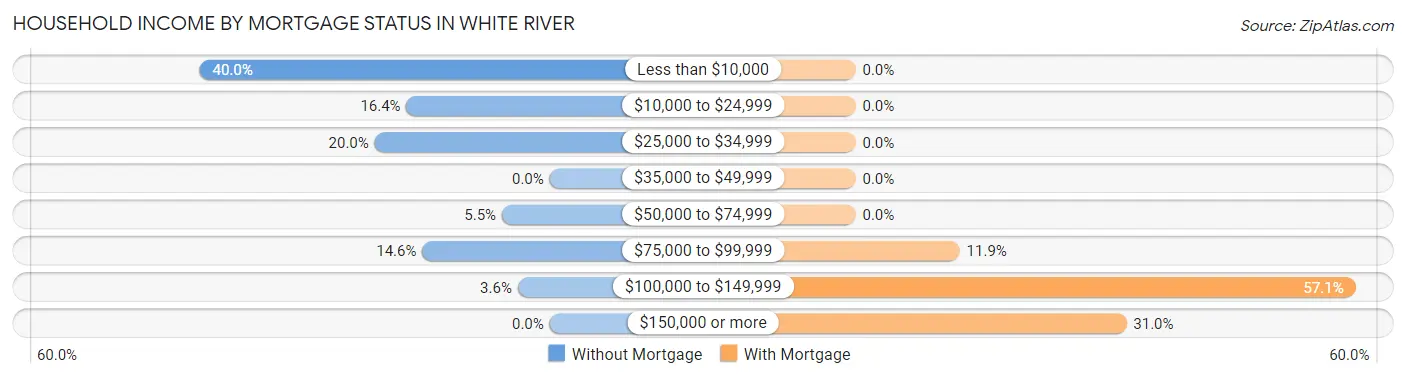
| Household Income | Without Mortgage | With Mortgage |
| Less than $10,000 | 22 (40.0%) | 0 (0.0%) |
| $10,000 to $24,999 | 9 (16.4%) | 0 (0.0%) |
| $25,000 to $34,999 | 11 (20.0%) | 0 (0.0%) |
| $35,000 to $49,999 | 0 (0.0%) | 0 (0.0%) |
| $50,000 to $74,999 | 3 (5.4%) | 0 (0.0%) |
| $75,000 to $99,999 | 8 (14.5%) | 5 (11.9%) |
| $100,000 to $149,999 | 2 (3.6%) | 24 (57.1%) |
| $150,000 or more | 0 (0.0%) | 13 (30.9%) |
| Total | 55 (100.0%) | 42 (100.0%) |
Property Value to Household Income Ratio in White River
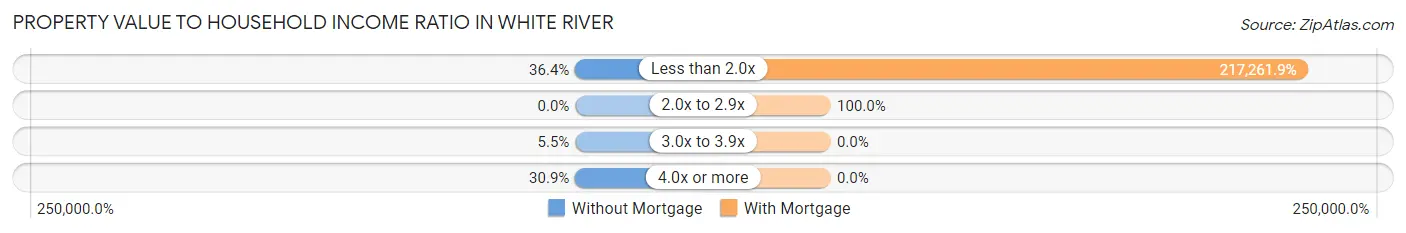
| Value-to-Income Ratio | Without Mortgage | With Mortgage |
| Less than 2.0x | 20 (36.4%) | 91,250 (217,261.9%) |
| 2.0x to 2.9x | 0 (0.0%) | 42 (100.0%) |
| 3.0x to 3.9x | 3 (5.4%) | 0 (0.0%) |
| 4.0x or more | 17 (30.9%) | 0 (0.0%) |
| Total | 55 (100.0%) | 42 (100.0%) |
Real Estate Taxes by Mortgage Status in White River
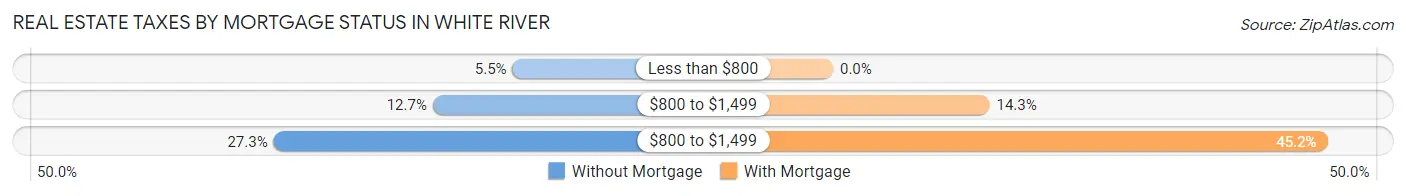
| Property Taxes | Without Mortgage | With Mortgage |
| Less than $800 | 3 (5.4%) | 0 (0.0%) |
| $800 to $1,499 | 7 (12.7%) | 6 (14.3%) |
| $800 to $1,499 | 15 (27.3%) | 19 (45.2%) |
| Total | 55 (100.0%) | 42 (100.0%) |
Health & Disability in White River
Health Insurance Coverage by Age in White River
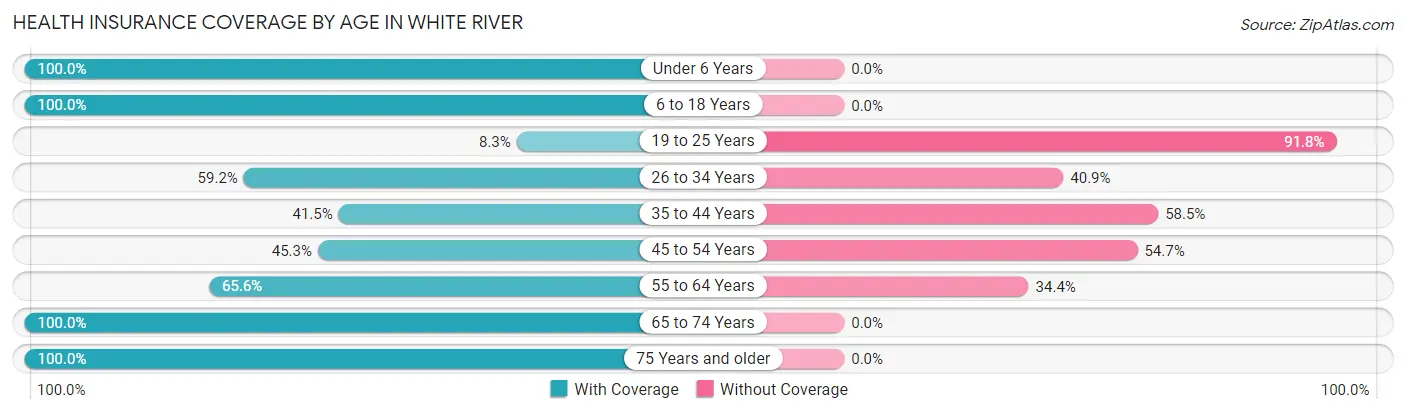
| Age Bracket | With Coverage | Without Coverage |
| Under 6 Years | 36 (100.0%) | 0 (0.0%) |
| 6 to 18 Years | 170 (100.0%) | 0 (0.0%) |
| 19 to 25 Years | 8 (8.3%) | 89 (91.7%) |
| 26 to 34 Years | 42 (59.2%) | 29 (40.8%) |
| 35 to 44 Years | 34 (41.5%) | 48 (58.5%) |
| 45 to 54 Years | 34 (45.3%) | 41 (54.7%) |
| 55 to 64 Years | 21 (65.6%) | 11 (34.4%) |
| 65 to 74 Years | 51 (100.0%) | 0 (0.0%) |
| 75 Years and older | 22 (100.0%) | 0 (0.0%) |
| Total | 418 (65.7%) | 218 (34.3%) |
Health Insurance Coverage by Citizenship Status in White River
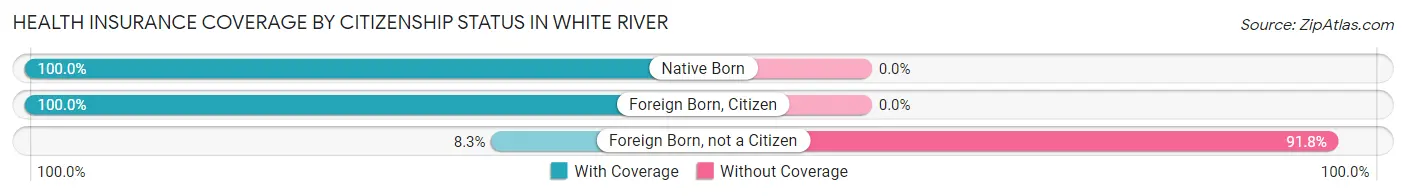
| Citizenship Status | With Coverage | Without Coverage |
| Native Born | 36 (100.0%) | 0 (0.0%) |
| Foreign Born, Citizen | 170 (100.0%) | 0 (0.0%) |
| Foreign Born, not a Citizen | 8 (8.3%) | 89 (91.7%) |
Health Insurance Coverage by Household Income in White River
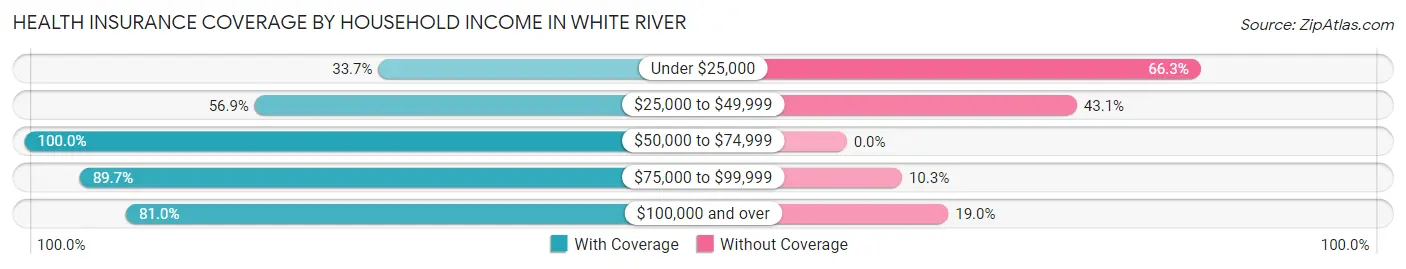
| Household Income | With Coverage | Without Coverage |
| Under $25,000 | 55 (33.7%) | 108 (66.3%) |
| $25,000 to $49,999 | 95 (56.9%) | 72 (43.1%) |
| $50,000 to $74,999 | 40 (100.0%) | 0 (0.0%) |
| $75,000 to $99,999 | 130 (89.7%) | 15 (10.3%) |
| $100,000 and over | 98 (81.0%) | 23 (19.0%) |
Public vs Private Health Insurance Coverage by Age in White River
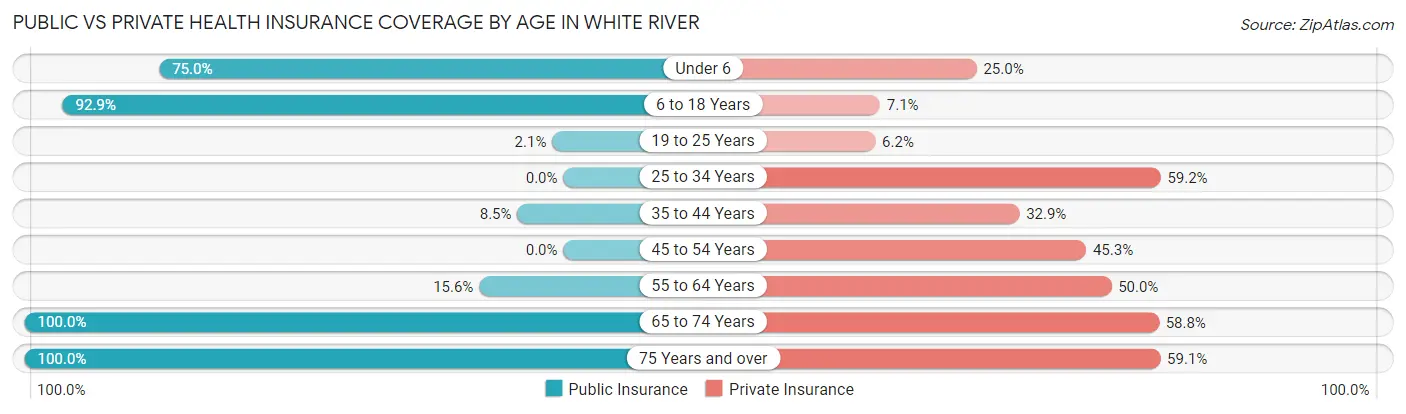
| Age Bracket | Public Insurance | Private Insurance |
| Under 6 | 27 (75.0%) | 9 (25.0%) |
| 6 to 18 Years | 158 (92.9%) | 12 (7.1%) |
| 19 to 25 Years | 2 (2.1%) | 6 (6.2%) |
| 25 to 34 Years | 0 (0.0%) | 42 (59.2%) |
| 35 to 44 Years | 7 (8.5%) | 27 (32.9%) |
| 45 to 54 Years | 0 (0.0%) | 34 (45.3%) |
| 55 to 64 Years | 5 (15.6%) | 16 (50.0%) |
| 65 to 74 Years | 51 (100.0%) | 30 (58.8%) |
| 75 Years and over | 22 (100.0%) | 13 (59.1%) |
| Total | 272 (42.8%) | 189 (29.7%) |
Disability Status by Sex by Age in White River
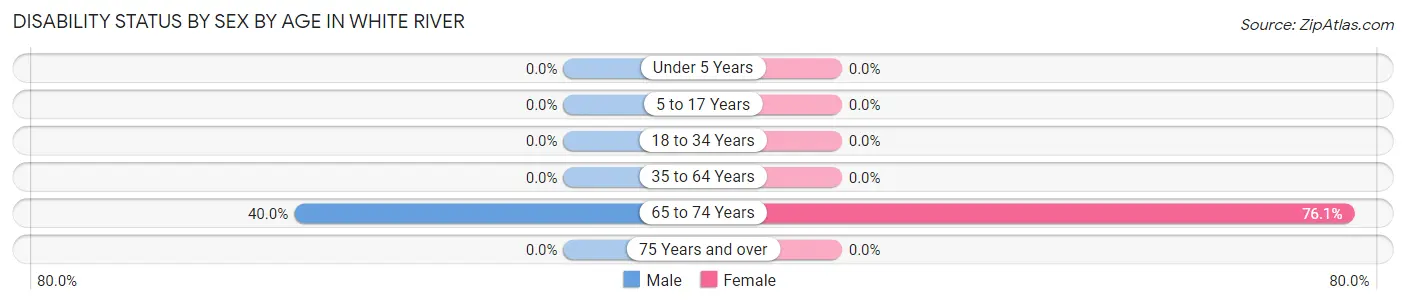
| Age Bracket | Male | Female |
| Under 5 Years | 0 (0.0%) | 0 (0.0%) |
| 5 to 17 Years | 0 (0.0%) | 0 (0.0%) |
| 18 to 34 Years | 0 (0.0%) | 0 (0.0%) |
| 35 to 64 Years | 0 (0.0%) | 0 (0.0%) |
| 65 to 74 Years | 2 (40.0%) | 35 (76.1%) |
| 75 Years and over | 0 (0.0%) | 0 (0.0%) |
Disability Class by Sex by Age in White River
Disability Class: Hearing Difficulty
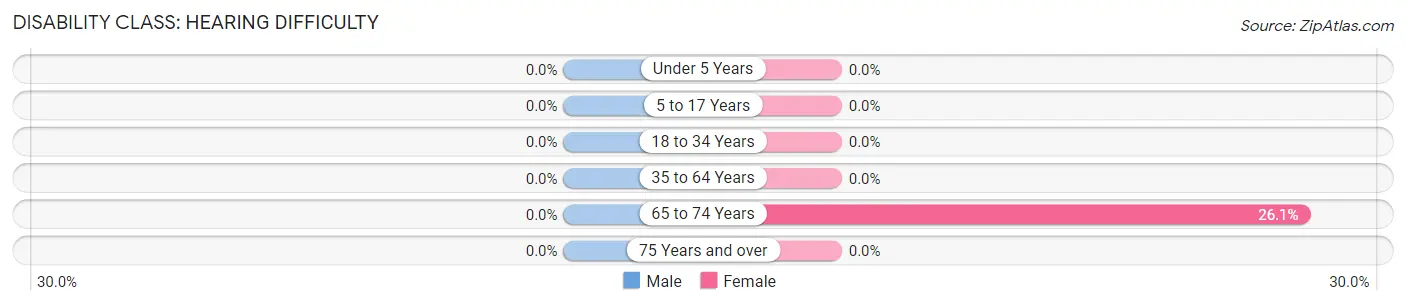
| Age Bracket | Male | Female |
| Under 5 Years | 0 (0.0%) | 0 (0.0%) |
| 5 to 17 Years | 0 (0.0%) | 0 (0.0%) |
| 18 to 34 Years | 0 (0.0%) | 0 (0.0%) |
| 35 to 64 Years | 0 (0.0%) | 0 (0.0%) |
| 65 to 74 Years | 0 (0.0%) | 12 (26.1%) |
| 75 Years and over | 0 (0.0%) | 0 (0.0%) |
Disability Class: Vision Difficulty
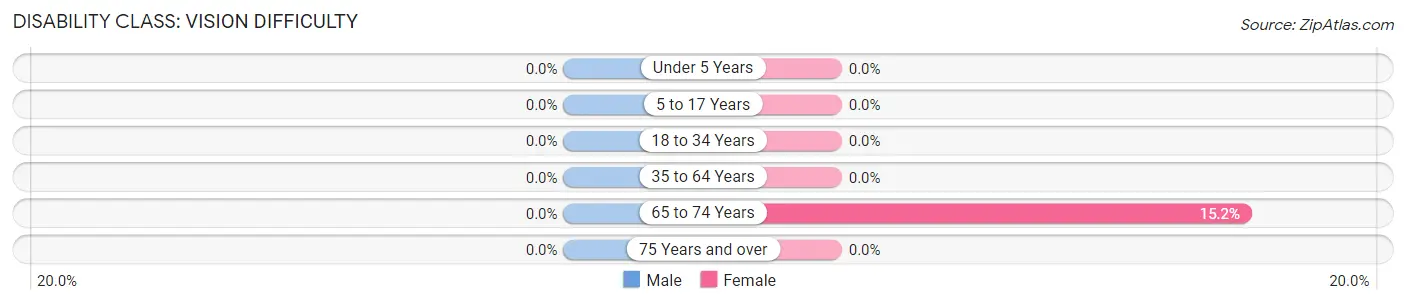
| Age Bracket | Male | Female |
| Under 5 Years | 0 (0.0%) | 0 (0.0%) |
| 5 to 17 Years | 0 (0.0%) | 0 (0.0%) |
| 18 to 34 Years | 0 (0.0%) | 0 (0.0%) |
| 35 to 64 Years | 0 (0.0%) | 0 (0.0%) |
| 65 to 74 Years | 0 (0.0%) | 7 (15.2%) |
| 75 Years and over | 0 (0.0%) | 0 (0.0%) |
Disability Class: Cognitive Difficulty
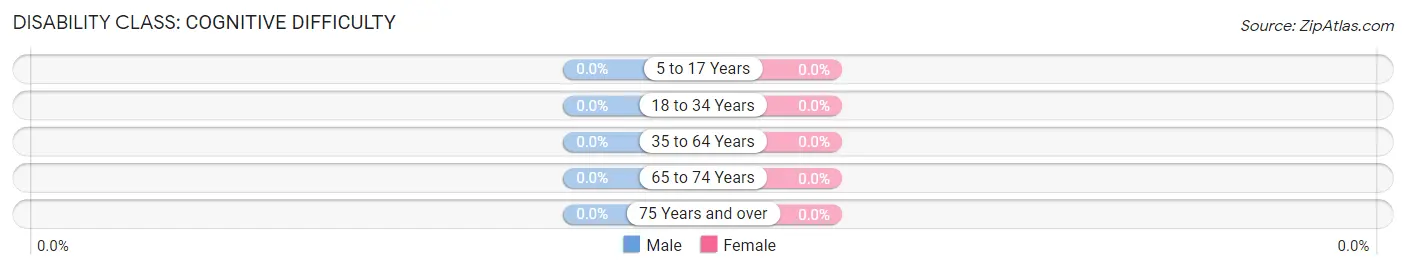
| Age Bracket | Male | Female |
| 5 to 17 Years | 0 (0.0%) | 0 (0.0%) |
| 18 to 34 Years | 0 (0.0%) | 0 (0.0%) |
| 35 to 64 Years | 0 (0.0%) | 0 (0.0%) |
| 65 to 74 Years | 0 (0.0%) | 0 (0.0%) |
| 75 Years and over | 0 (0.0%) | 0 (0.0%) |
Disability Class: Ambulatory Difficulty
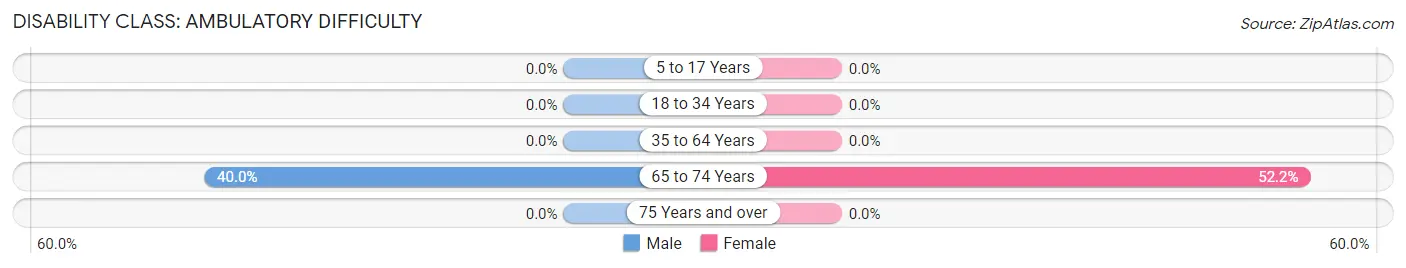
| Age Bracket | Male | Female |
| 5 to 17 Years | 0 (0.0%) | 0 (0.0%) |
| 18 to 34 Years | 0 (0.0%) | 0 (0.0%) |
| 35 to 64 Years | 0 (0.0%) | 0 (0.0%) |
| 65 to 74 Years | 2 (40.0%) | 24 (52.2%) |
| 75 Years and over | 0 (0.0%) | 0 (0.0%) |
Disability Class: Self-Care Difficulty
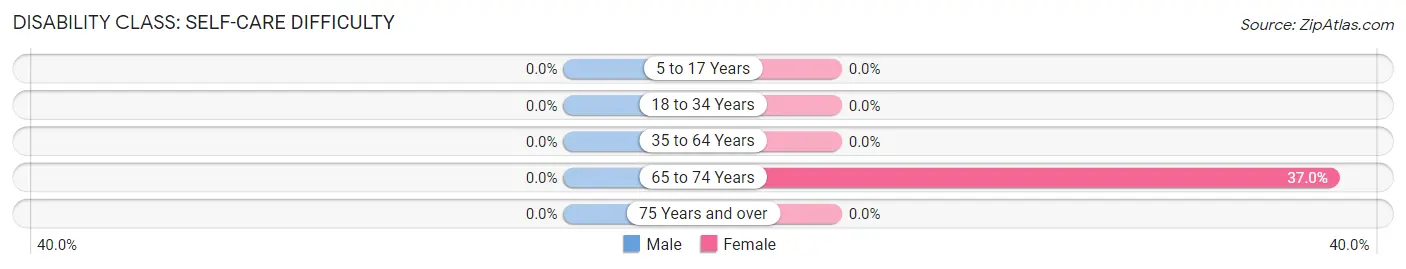
| Age Bracket | Male | Female |
| 5 to 17 Years | 0 (0.0%) | 0 (0.0%) |
| 18 to 34 Years | 0 (0.0%) | 0 (0.0%) |
| 35 to 64 Years | 0 (0.0%) | 0 (0.0%) |
| 65 to 74 Years | 0 (0.0%) | 17 (37.0%) |
| 75 Years and over | 0 (0.0%) | 0 (0.0%) |
Technology Access in White River
Computing Device Access in White River
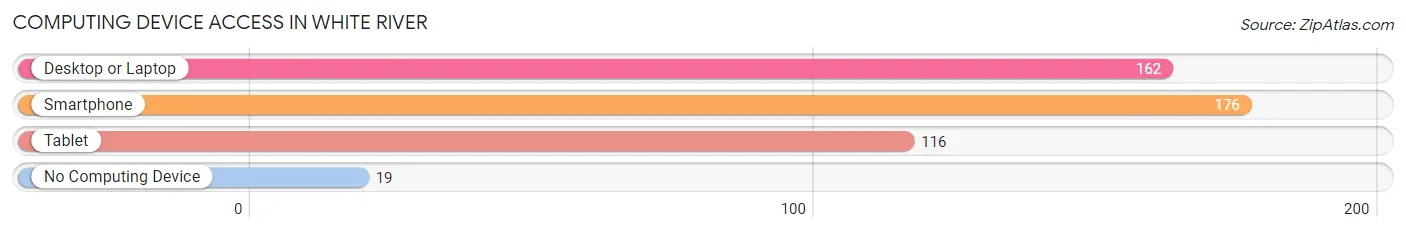
| Device Type | # Households | % Households |
| Desktop or Laptop | 162 | 81.0% |
| Smartphone | 176 | 88.0% |
| Tablet | 116 | 58.0% |
| No Computing Device | 19 | 9.5% |
| Total | 200 | 100.0% |
Internet Access in White River
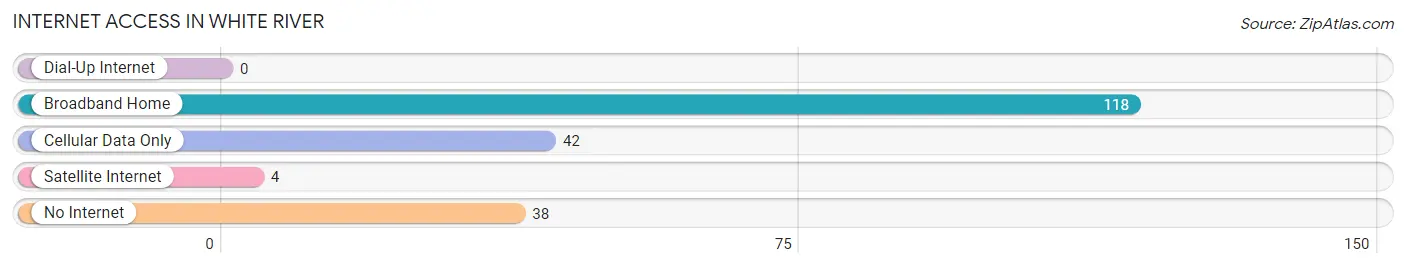
| Internet Type | # Households | % Households |
| Dial-Up Internet | 0 | 0.0% |
| Broadband Home | 118 | 59.0% |
| Cellular Data Only | 42 | 21.0% |
| Satellite Internet | 4 | 2.0% |
| No Internet | 38 | 19.0% |
| Total | 200 | 100.0% |
White River Summary
White River is a small town located in the southwestern corner of South Dakota, in the United States. It is situated in the White River Valley, which is part of the Great Plains region. The town is located in the White River Indian Reservation, which is home to the Oglala Sioux Tribe. The population of White River was 1,093 at the 2010 census.
History
White River was established in 1876 as a trading post for the Oglala Sioux Tribe. The town was named after the nearby White River, which was named by the Sioux for its white-colored sand. The town was incorporated in 1883 and was the first incorporated town in the state of South Dakota.
In the late 19th century, White River was a major stop on the Chicago, Milwaukee, St. Paul and Pacific Railroad. The railroad brought settlers to the area, and the town grew rapidly. By the early 20th century, White River had become a bustling commercial center, with a variety of businesses, including a bank, a hotel, a newspaper, and a variety of stores.
In the early 20th century, White River was also a major center for the cattle industry. The town was home to several large ranches, and the surrounding area was used for grazing. The cattle industry declined in the mid-20th century, and the town's economy shifted to tourism and recreation.
Geography
White River is located in the White River Valley, which is part of the Great Plains region. The town is situated at an elevation of 3,845 feet (1,172 m). The White River flows through the town, and the nearby Badlands National Park is located to the east.
The climate in White River is semi-arid, with hot summers and cold winters. The average annual temperature is 48.3 °F (9.1 °C), and the average annual precipitation is 16.9 inches (429 mm).
Economy
The economy of White River is largely based on tourism and recreation. The town is home to several tourist attractions, including the Badlands National Park, the White River Valley Museum, and the White River State Fish Hatchery. The town is also home to several restaurants, hotels, and other businesses that cater to tourists.
In addition to tourism, White River is also home to several businesses that provide goods and services to the local community. These businesses include a grocery store, a hardware store, a gas station, and a variety of other stores.
Demographics
As of the 2010 census, the population of White River was 1,093. The racial makeup of the town was 94.3% Native American, 4.2% White, 0.2% African American, 0.2% Asian, and 0.9% from other races. The median household income was $25,938, and the median family income was $30,625. The per capita income was $13,945.
White River is home to the Oglala Sioux Tribe, and the majority of the town's residents are Native American. The town is also home to a small population of non-Native Americans, including White, African American, and Asian residents.
Common Questions
What is Per Capita Income in White River?
Per Capita income in White River is $17,086.
What is the Median Family Income in White River?
Median Family Income in White River is $51,480.
What is Inequality or Gini Index in White River?
Inequality or Gini Index in White River is 0.36.
What is the Total Population of White River?
Total Population of White River is 681.
What is the Total Male Population of White River?
Total Male Population of White River is 324.
What is the Total Female Population of White River?
Total Female Population of White River is 357.
What is the Ratio of Males per 100 Females in White River?
There are 90.76 Males per 100 Females in White River.
What is the Ratio of Females per 100 Males in White River?
There are 110.19 Females per 100 Males in White River.
What is the Median Population Age in White River?
Median Population Age in White River is 27.7 Years.
What is the Average Family Size in White River
Average Family Size in White River is 4.0 People.
What is the Average Household Size in White River
Average Household Size in White River is 3.2 People.
How Large is the Labor Force in White River?
There are 279 People in the Labor Forcein in White River.
What is the Percentage of People in the Labor Force in White River?
57.4% of People are in the Labor Force in White River.
What is the Unemployment Rate in White River?
Unemployment Rate in White River is 2.2%.