Irene, SD Map & Demographics
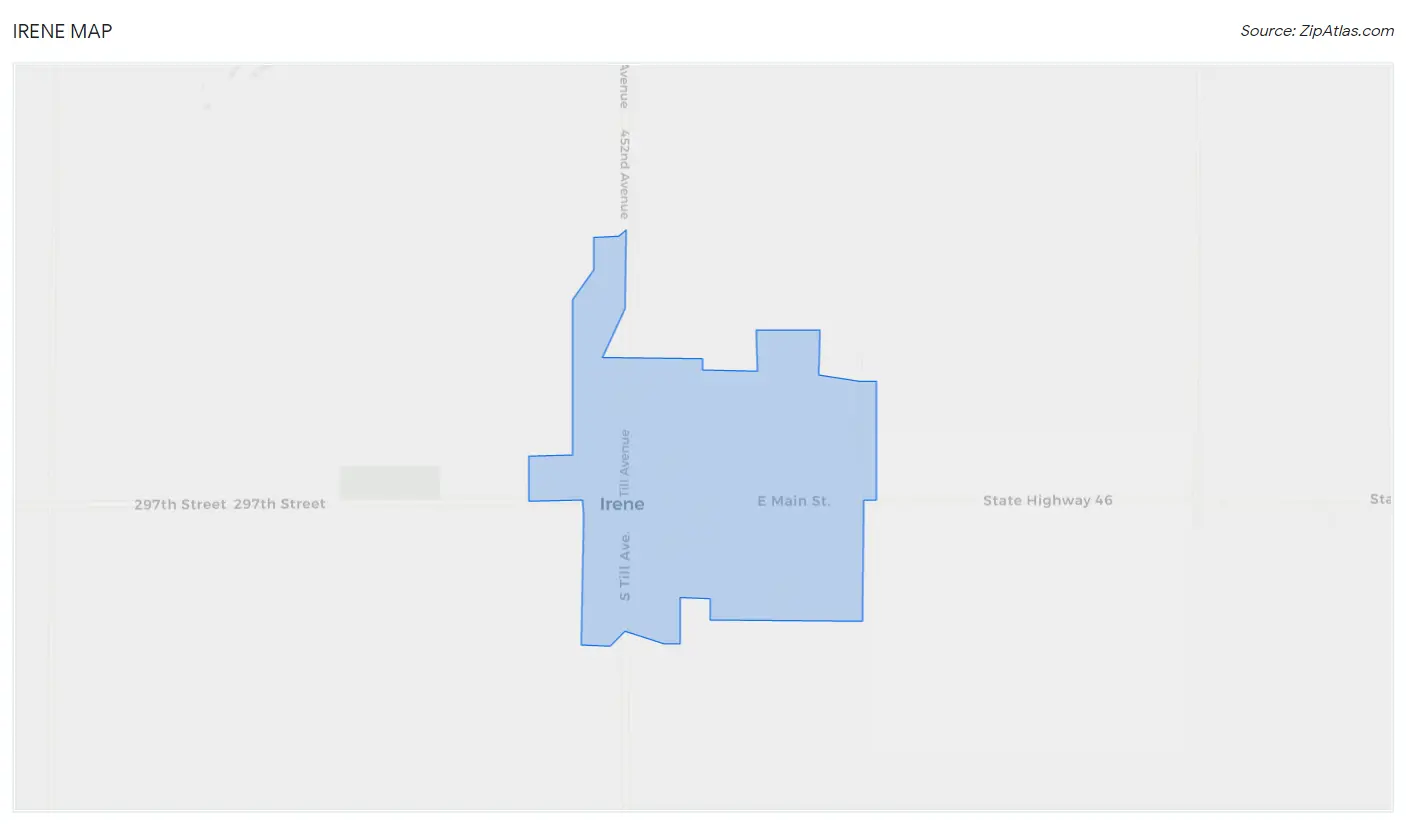
Irene Map
Irene Overview
$28,637
PER CAPITA INCOME
$65,417
AVG FAMILY INCOME
$50,625
AVG HOUSEHOLD INCOME
25.6%
WAGE / INCOME GAP [ % ]
74.4¢/ $1
WAGE / INCOME GAP [ $ ]
0.39
INEQUALITY / GINI INDEX
513
TOTAL POPULATION
221
MALE POPULATION
292
FEMALE POPULATION
75.68
MALES / 100 FEMALES
132.13
FEMALES / 100 MALES
37.0
MEDIAN AGE
2.7
AVG FAMILY SIZE
2.2
AVG HOUSEHOLD SIZE
268
LABOR FORCE [ PEOPLE ]
66.0%
PERCENT IN LABOR FORCE
Irene Zip Codes
Irene Area Codes
Income in Irene
Income Overview in Irene
Per Capita Income in Irene is $28,637, while median incomes of families and households are $65,417 and $50,625 respectively.
| Characteristic | Number | Measure |
| Per Capita Income | 513 | $28,637 |
| Median Family Income | 110 | $65,417 |
| Mean Family Income | 110 | $78,512 |
| Median Household Income | 213 | $50,625 |
| Mean Household Income | 213 | $63,837 |
| Income Deficit | 110 | $0 |
| Wage / Income Gap (%) | 513 | 25.59% |
| Wage / Income Gap ($) | 513 | 74.41¢ per $1 |
| Gini / Inequality Index | 513 | 0.39 |
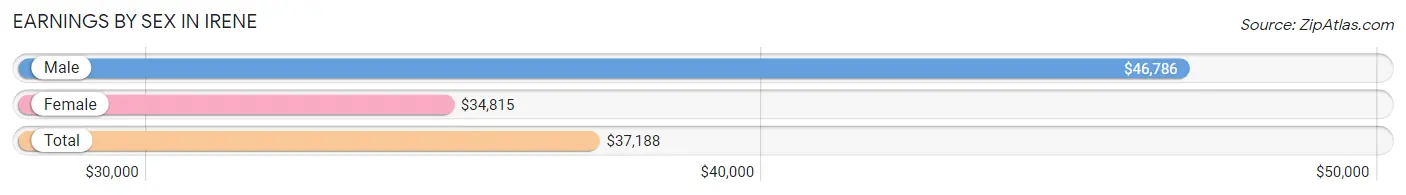
Earnings by Sex in Irene
Average Earnings in Irene are $37,188, $46,786 for men and $34,815 for women, a difference of 25.6%.
| Sex | Number | Average Earnings |
| Male | 128 (46.0%) | $46,786 |
| Female | 150 (54.0%) | $34,815 |
| Total | 278 (100.0%) | $37,188 |
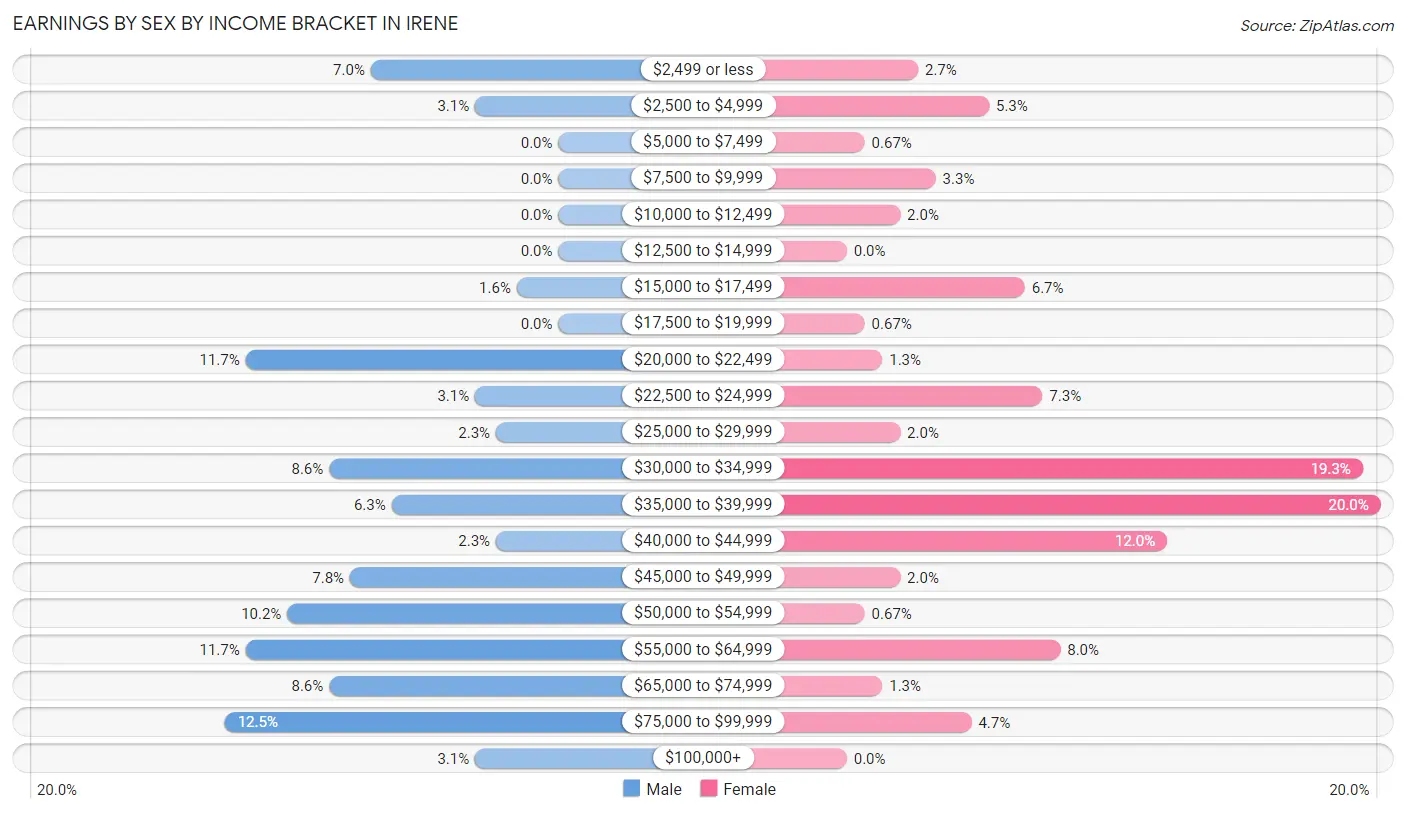
Earnings by Sex by Income Bracket in Irene
The most common earnings brackets in Irene are $75,000 to $99,999 for men (16 | 12.5%) and $35,000 to $39,999 for women (30 | 20.0%).
| Income | Male | Female |
| $2,499 or less | 9 (7.0%) | 4 (2.7%) |
| $2,500 to $4,999 | 4 (3.1%) | 8 (5.3%) |
| $5,000 to $7,499 | 0 (0.0%) | 1 (0.7%) |
| $7,500 to $9,999 | 0 (0.0%) | 5 (3.3%) |
| $10,000 to $12,499 | 0 (0.0%) | 3 (2.0%) |
| $12,500 to $14,999 | 0 (0.0%) | 0 (0.0%) |
| $15,000 to $17,499 | 2 (1.6%) | 10 (6.7%) |
| $17,500 to $19,999 | 0 (0.0%) | 1 (0.7%) |
| $20,000 to $22,499 | 15 (11.7%) | 2 (1.3%) |
| $22,500 to $24,999 | 4 (3.1%) | 11 (7.3%) |
| $25,000 to $29,999 | 3 (2.3%) | 3 (2.0%) |
| $30,000 to $34,999 | 11 (8.6%) | 29 (19.3%) |
| $35,000 to $39,999 | 8 (6.2%) | 30 (20.0%) |
| $40,000 to $44,999 | 3 (2.3%) | 18 (12.0%) |
| $45,000 to $49,999 | 10 (7.8%) | 3 (2.0%) |
| $50,000 to $54,999 | 13 (10.2%) | 1 (0.7%) |
| $55,000 to $64,999 | 15 (11.7%) | 12 (8.0%) |
| $65,000 to $74,999 | 11 (8.6%) | 2 (1.3%) |
| $75,000 to $99,999 | 16 (12.5%) | 7 (4.7%) |
| $100,000+ | 4 (3.1%) | 0 (0.0%) |
| Total | 128 (100.0%) | 150 (100.0%) |
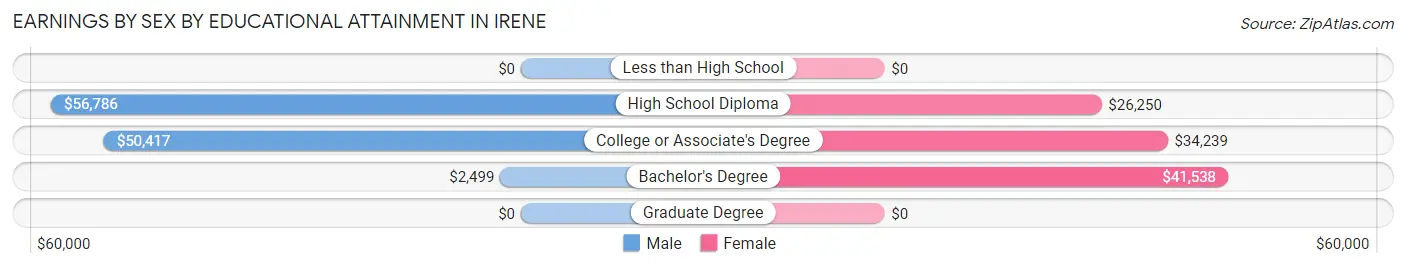
Earnings by Sex by Educational Attainment in Irene
Average earnings in Irene are $51,111 for men and $34,630 for women, a difference of 32.3%. Men with an educational attainment of high school diploma enjoy the highest average annual earnings of $56,786, while those with bachelor's degree education earn the least with $2,499. Women with an educational attainment of bachelor's degree earn the most with the average annual earnings of $41,538, while those with high school diploma education have the smallest earnings of $26,250.
| Educational Attainment | Male Income | Female Income |
| Less than High School | - | - |
| High School Diploma | $56,786 | $26,250 |
| College or Associate's Degree | $50,417 | $34,239 |
| Bachelor's Degree | $2,499 | $41,538 |
| Graduate Degree | - | - |
| Total | $51,111 | $34,630 |
Family Income in Irene
Family Income Brackets in Irene
According to the Irene family income data, there are 29 families falling into the $35,000 to $49,999 income range, which is the most common income bracket and makes up 26.4% of all families.
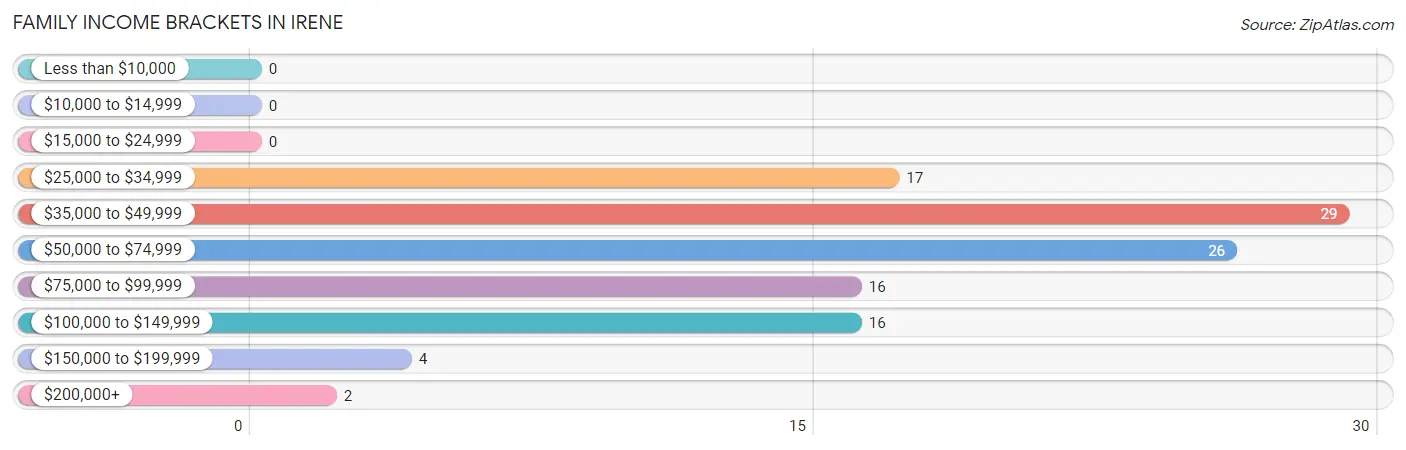
| Income Bracket | # Families | % Families |
| Less than $10,000 | 0 | 0.0% |
| $10,000 to $14,999 | 0 | 0.0% |
| $15,000 to $24,999 | 0 | 0.0% |
| $25,000 to $34,999 | 17 | 15.5% |
| $35,000 to $49,999 | 29 | 26.4% |
| $50,000 to $74,999 | 26 | 23.6% |
| $75,000 to $99,999 | 16 | 14.5% |
| $100,000 to $149,999 | 16 | 14.5% |
| $150,000 to $199,999 | 4 | 3.6% |
| $200,000+ | 2 | 1.8% |
Family Income by Famaliy Size in Irene
4-person families (24 | 21.8%) account for the highest median family income in Irene with $70,357 per family, while 2-person families (56 | 50.9%) have the highest median income of $31,875 per family member.
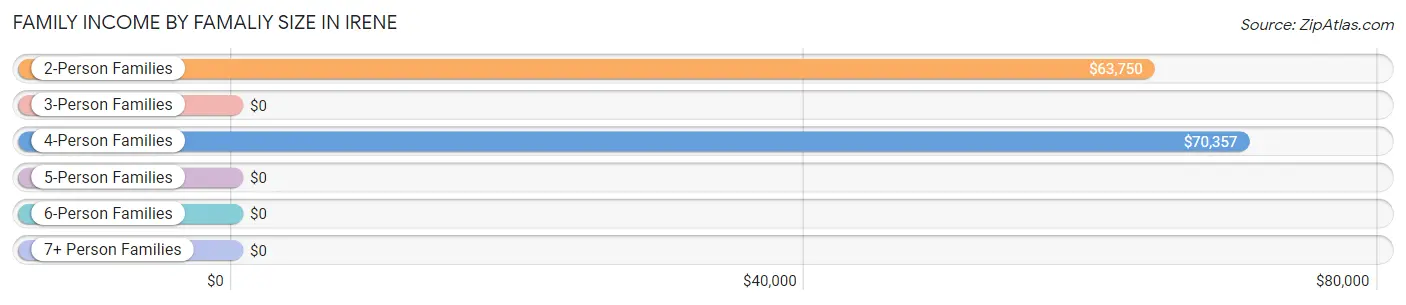
| Income Bracket | # Families | Median Income |
| 2-Person Families | 56 (50.9%) | $63,750 |
| 3-Person Families | 25 (22.7%) | $0 |
| 4-Person Families | 24 (21.8%) | $70,357 |
| 5-Person Families | 1 (0.9%) | $0 |
| 6-Person Families | 4 (3.6%) | $0 |
| 7+ Person Families | 0 (0.0%) | $0 |
| Total | 110 (100.0%) | $65,417 |
Family Income by Number of Earners in Irene
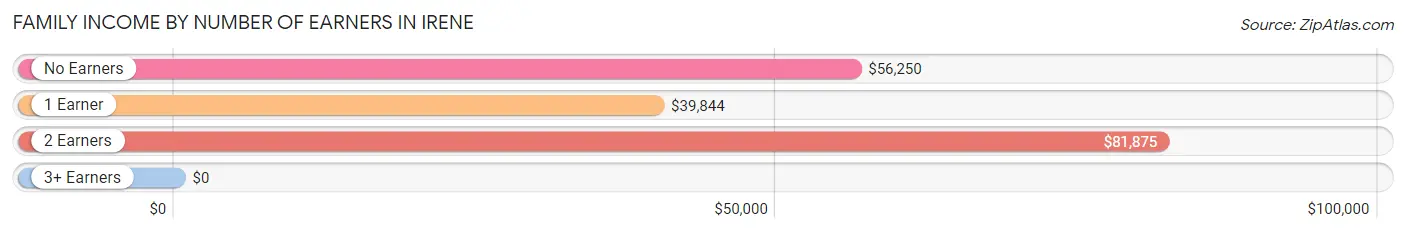
| Number of Earners | # Families | Median Income |
| No Earners | 5 (4.5%) | $56,250 |
| 1 Earner | 49 (44.6%) | $39,844 |
| 2 Earners | 49 (44.6%) | $81,875 |
| 3+ Earners | 7 (6.4%) | $0 |
| Total | 110 (100.0%) | $65,417 |
Household Income in Irene
Household Income Brackets in Irene
With 56 households falling in the category, the $50,000 to $74,999 income range is the most frequent in Irene, accounting for 26.3% of all households. In contrast, only 2 households (0.9%) fall into the $200,000+ income bracket, making it the least populous group.
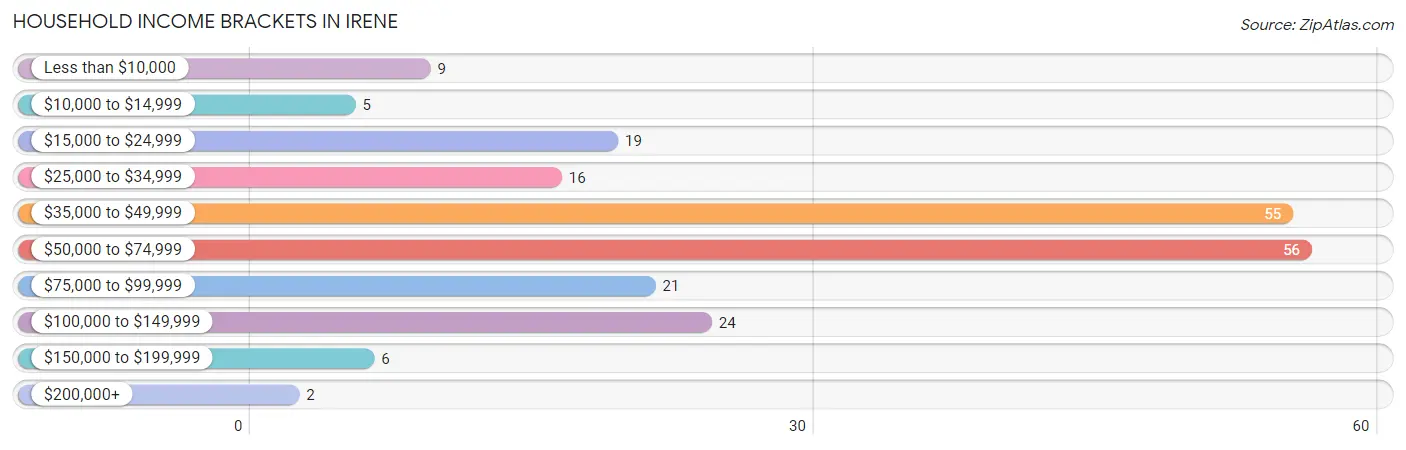
| Income Bracket | # Households | % Households |
| Less than $10,000 | 9 | 4.2% |
| $10,000 to $14,999 | 5 | 2.3% |
| $15,000 to $24,999 | 19 | 8.9% |
| $25,000 to $34,999 | 16 | 7.5% |
| $35,000 to $49,999 | 55 | 25.8% |
| $50,000 to $74,999 | 56 | 26.3% |
| $75,000 to $99,999 | 21 | 9.9% |
| $100,000 to $149,999 | 24 | 11.3% |
| $150,000 to $199,999 | 6 | 2.8% |
| $200,000+ | 2 | 0.9% |
Household Income by Householder Age in Irene
The median household income in Irene is $50,625, with the highest median household income of $70,469 found in the 45 to 64 years age bracket for the primary householder. A total of 65 households (30.5%) fall into this category. Meanwhile, the 15 to 24 years age bracket for the primary householder has the lowest median household income of $39,479, with 19 households (8.9%) in this group.
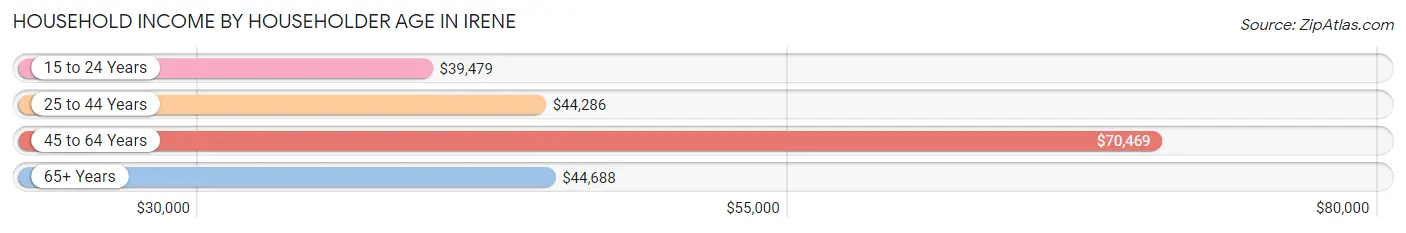
| Income Bracket | # Households | Median Income |
| 15 to 24 Years | 19 (8.9%) | $39,479 |
| 25 to 44 Years | 88 (41.3%) | $44,286 |
| 45 to 64 Years | 65 (30.5%) | $70,469 |
| 65+ Years | 41 (19.3%) | $44,688 |
| Total | 213 (100.0%) | $50,625 |
Poverty in Irene
Income Below Poverty by Sex and Age in Irene
With 10.5% poverty level for males and 19.3% for females among the residents of Irene, 5 year old males and 15 year old females are the most vulnerable to poverty, with 4 males (80.0%) and 6 females (66.7%) in their respective age groups living below the poverty level.
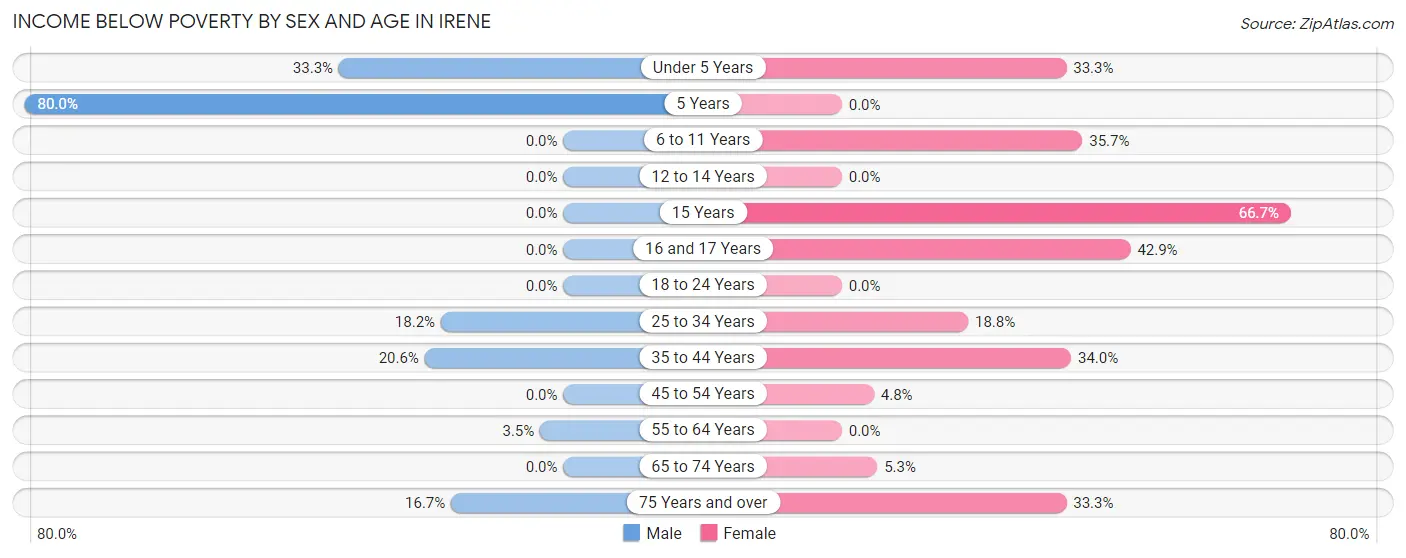
| Age Bracket | Male | Female |
| Under 5 Years | 4 (33.3%) | 4 (33.3%) |
| 5 Years | 4 (80.0%) | 0 (0.0%) |
| 6 to 11 Years | 0 (0.0%) | 5 (35.7%) |
| 12 to 14 Years | 0 (0.0%) | 0 (0.0%) |
| 15 Years | 0 (0.0%) | 6 (66.7%) |
| 16 and 17 Years | 0 (0.0%) | 6 (42.9%) |
| 18 to 24 Years | 0 (0.0%) | 0 (0.0%) |
| 25 to 34 Years | 4 (18.2%) | 9 (18.8%) |
| 35 to 44 Years | 7 (20.6%) | 16 (34.0%) |
| 45 to 54 Years | 0 (0.0%) | 1 (4.8%) |
| 55 to 64 Years | 1 (3.5%) | 0 (0.0%) |
| 65 to 74 Years | 0 (0.0%) | 1 (5.3%) |
| 75 Years and over | 1 (16.7%) | 3 (33.3%) |
| Total | 21 (10.5%) | 51 (19.3%) |
Income Above Poverty by Sex and Age in Irene
According to the poverty statistics in Irene, males aged 6 to 11 years and females aged 5 years are the age groups that are most secure financially, with 100.0% of males and 100.0% of females in these age groups living above the poverty line.
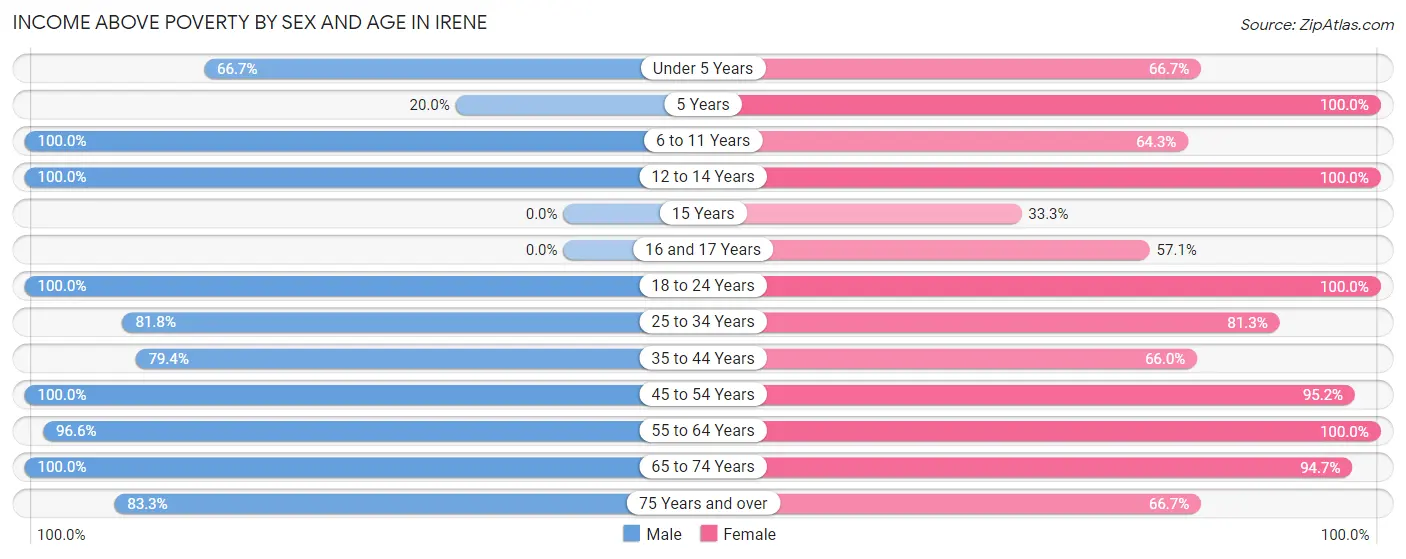
| Age Bracket | Male | Female |
| Under 5 Years | 8 (66.7%) | 8 (66.7%) |
| 5 Years | 1 (20.0%) | 7 (100.0%) |
| 6 to 11 Years | 16 (100.0%) | 9 (64.3%) |
| 12 to 14 Years | 17 (100.0%) | 11 (100.0%) |
| 15 Years | 0 (0.0%) | 3 (33.3%) |
| 16 and 17 Years | 0 (0.0%) | 8 (57.1%) |
| 18 to 24 Years | 18 (100.0%) | 24 (100.0%) |
| 25 to 34 Years | 18 (81.8%) | 39 (81.2%) |
| 35 to 44 Years | 27 (79.4%) | 31 (66.0%) |
| 45 to 54 Years | 17 (100.0%) | 20 (95.2%) |
| 55 to 64 Years | 28 (96.6%) | 30 (100.0%) |
| 65 to 74 Years | 23 (100.0%) | 18 (94.7%) |
| 75 Years and over | 5 (83.3%) | 6 (66.7%) |
| Total | 178 (89.4%) | 214 (80.7%) |
Income Below Poverty Among Married-Couple Families in Irene
The poverty statistics for married-couple families in Irene show that 6.7% or 4 of the total 60 families live below the poverty line. Families with 3 or 4 children have the highest poverty rate of 80.0%, comprising of 4 families. On the other hand, families with no children have the lowest poverty rate of 0.0%, which includes 0 families.
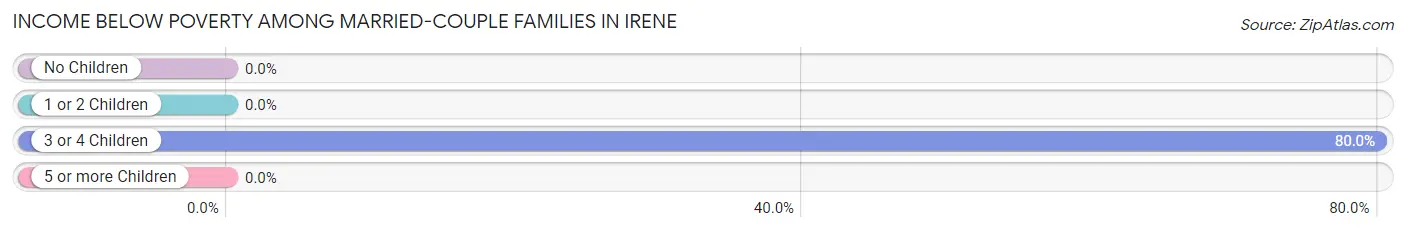
| Children | Above Poverty | Below Poverty |
| No Children | 32 (100.0%) | 0 (0.0%) |
| 1 or 2 Children | 23 (100.0%) | 0 (0.0%) |
| 3 or 4 Children | 1 (20.0%) | 4 (80.0%) |
| 5 or more Children | 0 (0.0%) | 0 (0.0%) |
| Total | 56 (93.3%) | 4 (6.7%) |
Income Below Poverty Among Single-Parent Households in Irene
| Children | Single Father | Single Mother |
| No Children | 0 (0.0%) | 0 (0.0%) |
| 1 or 2 Children | 0 (0.0%) | 0 (0.0%) |
| 3 or 4 Children | 0 (0.0%) | 0 (0.0%) |
| 5 or more Children | 0 (0.0%) | 0 (0.0%) |
| Total | 0 (0.0%) | 0 (0.0%) |
Income Below Poverty Among Married-Couple vs Single-Parent Households in Irene
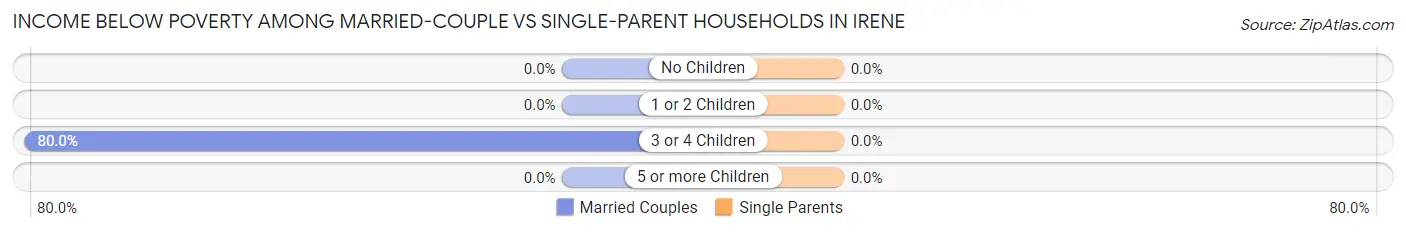
| Children | Married-Couple Families | Single-Parent Households |
| No Children | 0 (0.0%) | 0 (0.0%) |
| 1 or 2 Children | 0 (0.0%) | 0 (0.0%) |
| 3 or 4 Children | 4 (80.0%) | 0 (0.0%) |
| 5 or more Children | 0 (0.0%) | 0 (0.0%) |
| Total | 4 (6.7%) | 0 (0.0%) |
Race in Irene
The most populous races in Irene are White / Caucasian (488 | 95.1%), Two or more Races (16 | 3.1%), and Native / Alaskan (9 | 1.8%).
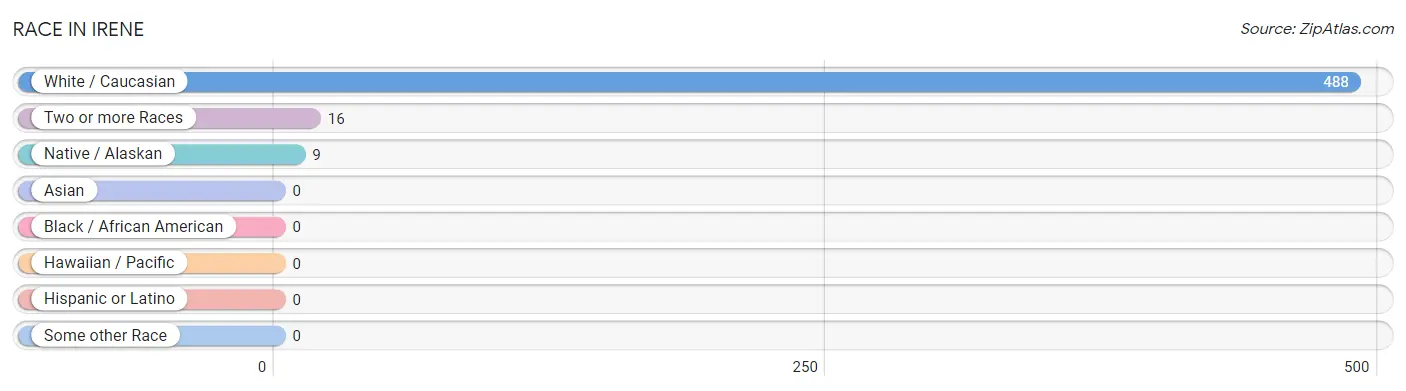
| Race | # Population | % Population |
| Asian | 0 | 0.0% |
| Black / African American | 0 | 0.0% |
| Hawaiian / Pacific | 0 | 0.0% |
| Hispanic or Latino | 0 | 0.0% |
| Native / Alaskan | 9 | 1.8% |
| White / Caucasian | 488 | 95.1% |
| Two or more Races | 16 | 3.1% |
| Some other Race | 0 | 0.0% |
| Total | 513 | 100.0% |
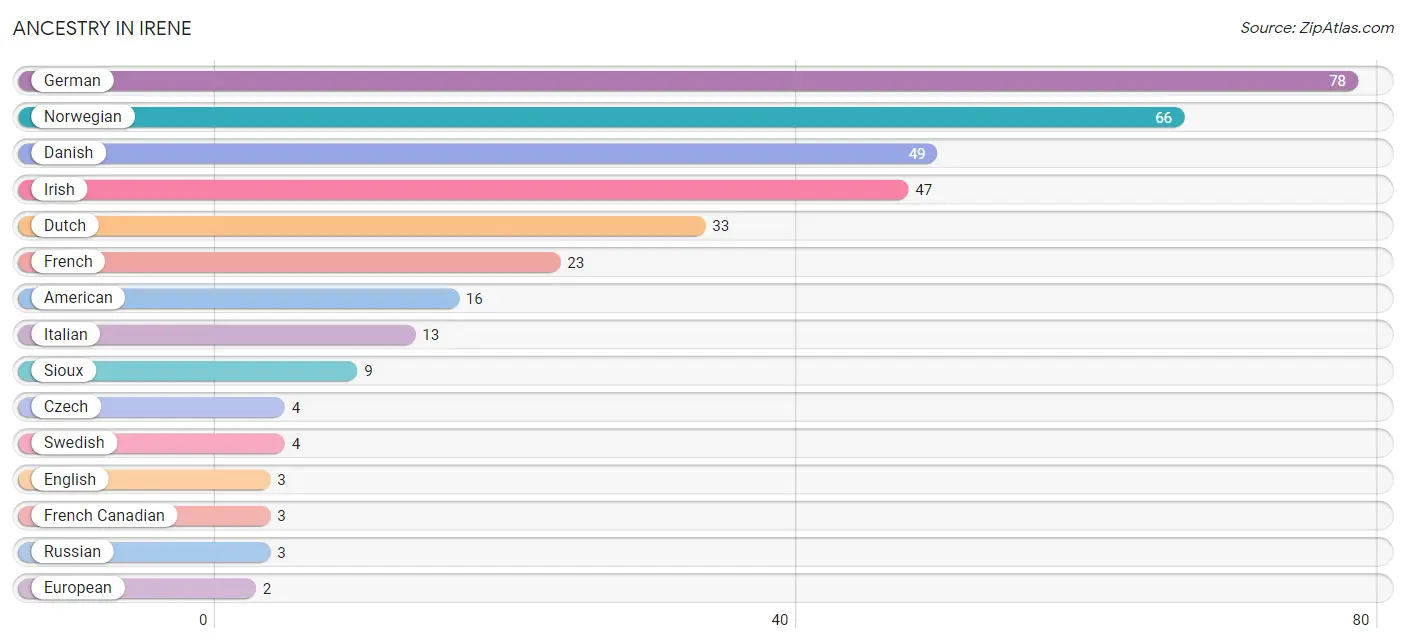
Ancestry in Irene
The most populous ancestries reported in Irene are German (78 | 15.2%), Norwegian (66 | 12.9%), Danish (49 | 9.6%), Irish (47 | 9.2%), and Dutch (33 | 6.4%), together accounting for 53.2% of all Irene residents.
| Ancestry | # Population | % Population |
| American | 16 | 3.1% |
| Arab | 1 | 0.2% |
| British | 1 | 0.2% |
| Czech | 4 | 0.8% |
| Danish | 49 | 9.6% |
| Dutch | 33 | 6.4% |
| English | 3 | 0.6% |
| European | 2 | 0.4% |
| French | 23 | 4.5% |
| French Canadian | 3 | 0.6% |
| German | 78 | 15.2% |
| Irish | 47 | 9.2% |
| Italian | 13 | 2.5% |
| Norwegian | 66 | 12.9% |
| Portuguese | 2 | 0.4% |
| Russian | 3 | 0.6% |
| Scandinavian | 1 | 0.2% |
| Scotch-Irish | 1 | 0.2% |
| Sioux | 9 | 1.8% |
| Swedish | 4 | 0.8% |
| Syrian | 1 | 0.2% | View All 21 Rows |
Immigrants in Irene
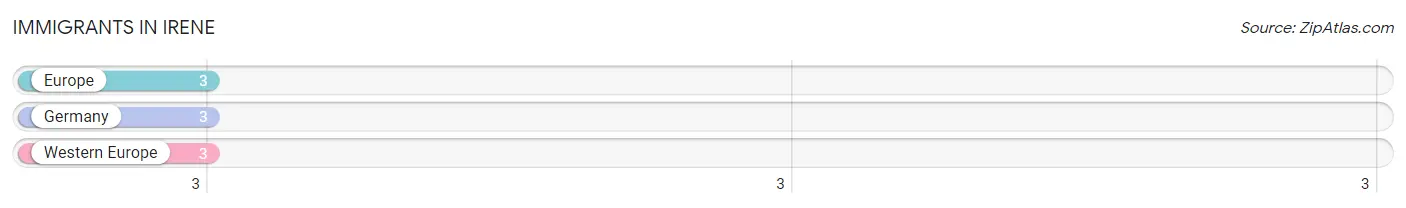
The most numerous immigrant groups reported in Irene came from Europe (3 | 0.6%), Germany (3 | 0.6%), and Western Europe (3 | 0.6%), together accounting for 1.7% of all Irene residents.
| Immigration Origin | # Population | % Population |
| Europe | 3 | 0.6% |
| Germany | 3 | 0.6% |
| Western Europe | 3 | 0.6% | View All 3 Rows |
Sex and Age in Irene
Sex and Age in Irene
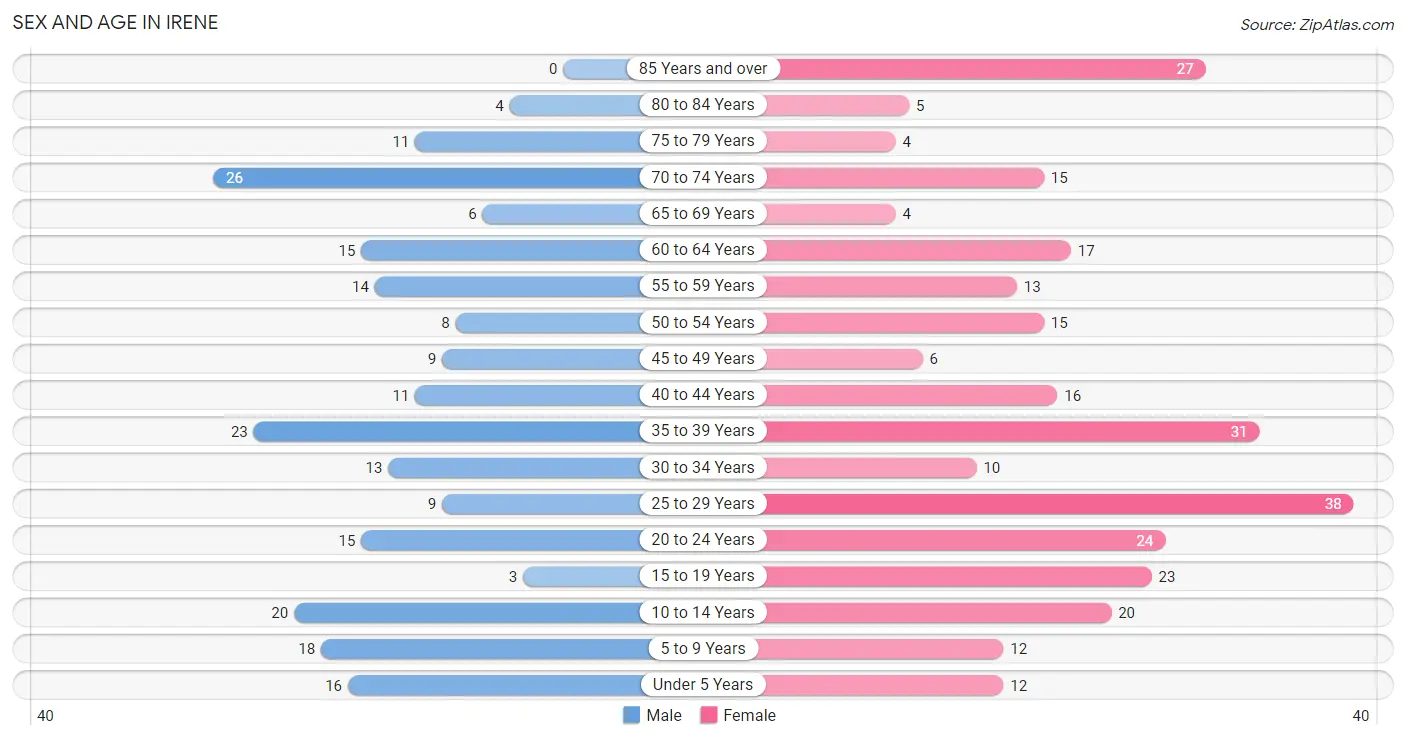
The most populous age groups in Irene are 70 to 74 Years (26 | 11.8%) for men and 25 to 29 Years (38 | 13.0%) for women.
| Age Bracket | Male | Female |
| Under 5 Years | 16 (7.2%) | 12 (4.1%) |
| 5 to 9 Years | 18 (8.1%) | 12 (4.1%) |
| 10 to 14 Years | 20 (9.0%) | 20 (6.9%) |
| 15 to 19 Years | 3 (1.4%) | 23 (7.9%) |
| 20 to 24 Years | 15 (6.8%) | 24 (8.2%) |
| 25 to 29 Years | 9 (4.1%) | 38 (13.0%) |
| 30 to 34 Years | 13 (5.9%) | 10 (3.4%) |
| 35 to 39 Years | 23 (10.4%) | 31 (10.6%) |
| 40 to 44 Years | 11 (5.0%) | 16 (5.5%) |
| 45 to 49 Years | 9 (4.1%) | 6 (2.1%) |
| 50 to 54 Years | 8 (3.6%) | 15 (5.1%) |
| 55 to 59 Years | 14 (6.3%) | 13 (4.4%) |
| 60 to 64 Years | 15 (6.8%) | 17 (5.8%) |
| 65 to 69 Years | 6 (2.7%) | 4 (1.4%) |
| 70 to 74 Years | 26 (11.8%) | 15 (5.1%) |
| 75 to 79 Years | 11 (5.0%) | 4 (1.4%) |
| 80 to 84 Years | 4 (1.8%) | 5 (1.7%) |
| 85 Years and over | 0 (0.0%) | 27 (9.2%) |
| Total | 221 (100.0%) | 292 (100.0%) |
Families and Households in Irene
Median Family Size in Irene
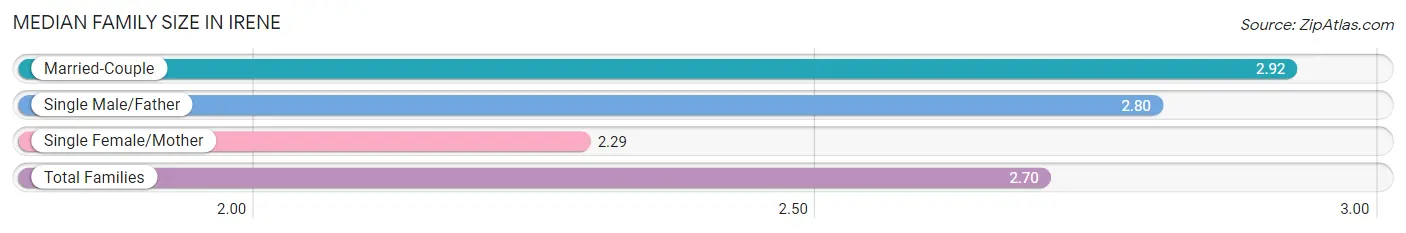
The median family size in Irene is 2.70 persons per family, with married-couple families (60 | 54.5%) accounting for the largest median family size of 2.92 persons per family. On the other hand, single female/mother families (35 | 31.8%) represent the smallest median family size with 2.29 persons per family.
| Family Type | # Families | Family Size |
| Married-Couple | 60 (54.5%) | 2.92 |
| Single Male/Father | 15 (13.6%) | 2.80 |
| Single Female/Mother | 35 (31.8%) | 2.29 |
| Total Families | 110 (100.0%) | 2.70 |
Median Household Size in Irene
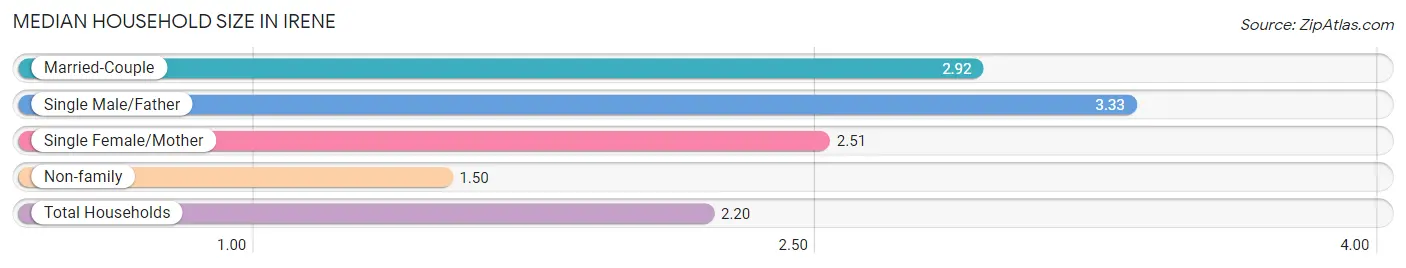
The median household size in Irene is 2.20 persons per household, with single male/father households (15 | 7.0%) accounting for the largest median household size of 3.33 persons per household. non-family households (103 | 48.4%) represent the smallest median household size with 1.50 persons per household.
| Household Type | # Households | Household Size |
| Married-Couple | 60 (28.2%) | 2.92 |
| Single Male/Father | 15 (7.0%) | 3.33 |
| Single Female/Mother | 35 (16.4%) | 2.51 |
| Non-family | 103 (48.4%) | 1.50 |
| Total Households | 213 (100.0%) | 2.20 |
Household Size by Marriage Status in Irene
Out of a total of 213 households in Irene, 110 (51.6%) are family households, while 103 (48.4%) are nonfamily households. The most numerous type of family households are 2-person households, comprising 51, and the most common type of nonfamily households are 1-person households, comprising 78.
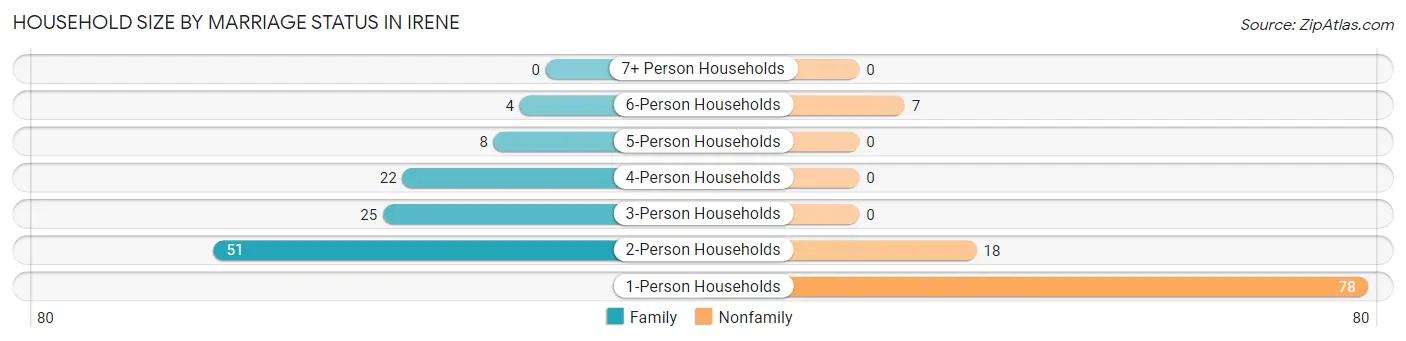
| Household Size | Family Households | Nonfamily Households |
| 1-Person Households | - | 78 (36.6%) |
| 2-Person Households | 51 (23.9%) | 18 (8.5%) |
| 3-Person Households | 25 (11.7%) | 0 (0.0%) |
| 4-Person Households | 22 (10.3%) | 0 (0.0%) |
| 5-Person Households | 8 (3.8%) | 0 (0.0%) |
| 6-Person Households | 4 (1.9%) | 7 (3.3%) |
| 7+ Person Households | 0 (0.0%) | 0 (0.0%) |
| Total | 110 (51.6%) | 103 (48.4%) |
Female Fertility in Irene
Fertility by Age in Irene
Average fertility rate in Irene is 7.0 births per 1,000 women. Women in the age bracket of 20 to 34 years have the highest fertility rate with 14.0 births per 1,000 women. Women in the age bracket of 20 to 34 years acount for 100.0% of all women with births.
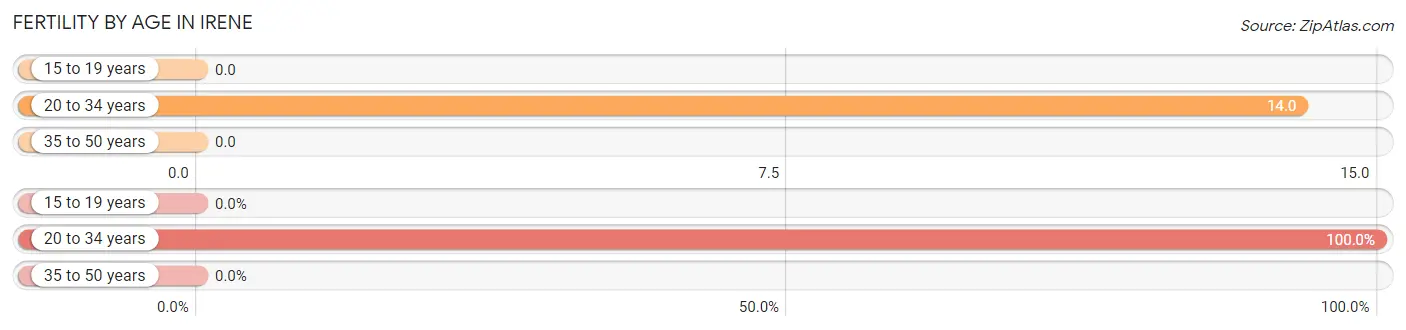
| Age Bracket | Women with Births | Births / 1,000 Women |
| 15 to 19 years | 0 (0.0%) | 0.0 |
| 20 to 34 years | 1 (100.0%) | 14.0 |
| 35 to 50 years | 0 (0.0%) | 0.0 |
| Total | 1 (100.0%) | 7.0 |
Fertility by Age by Marriage Status in Irene
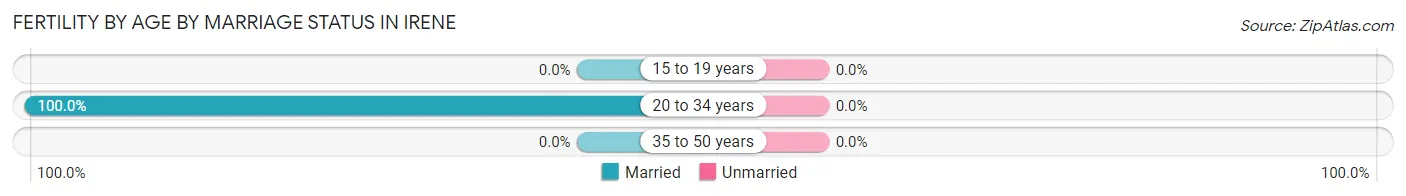
| Age Bracket | Married | Unmarried |
| 15 to 19 years | 0 (0.0%) | 0 (0.0%) |
| 20 to 34 years | 1 (100.0%) | 0 (0.0%) |
| 35 to 50 years | 0 (0.0%) | 0 (0.0%) |
| Total | 1 (100.0%) | 0 (0.0%) |
Fertility by Education in Irene
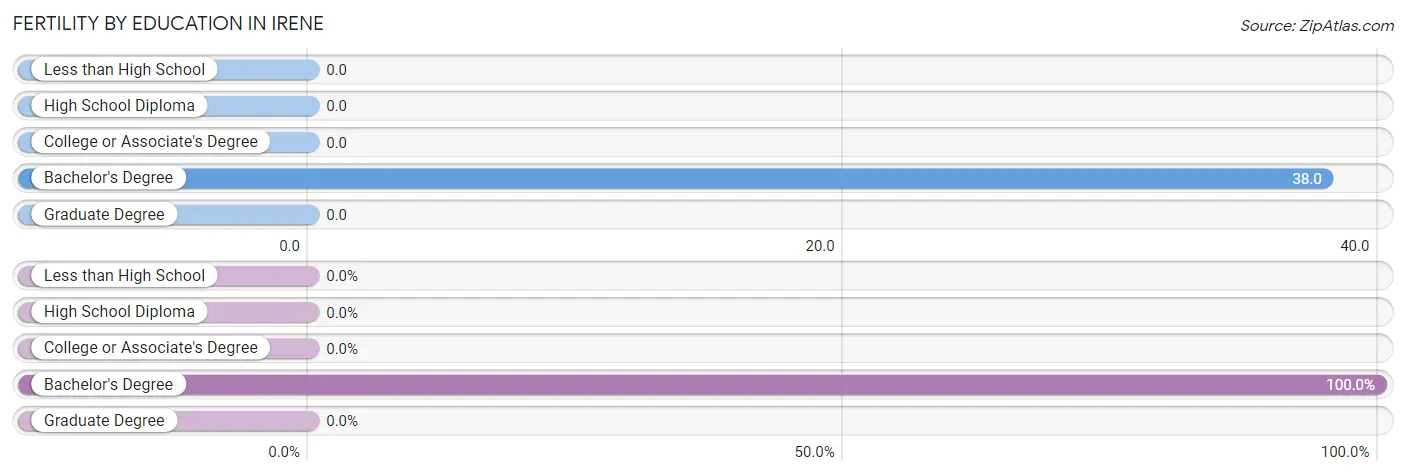
| Educational Attainment | Women with Births | Births / 1,000 Women |
| Less than High School | 0 (0.0%) | 0.0 |
| High School Diploma | 0 (0.0%) | 0.0 |
| College or Associate's Degree | 0 (0.0%) | 0.0 |
| Bachelor's Degree | 1 (100.0%) | 38.0 |
| Graduate Degree | 0 (0.0%) | 0.0 |
| Total | 1 (100.0%) | 7.0 |
Fertility by Education by Marriage Status in Irene
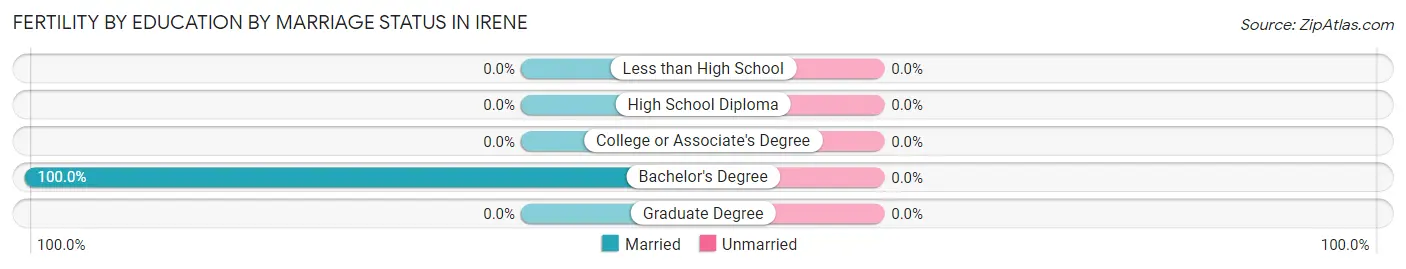
| Educational Attainment | Married | Unmarried |
| Less than High School | 0 (0.0%) | 0 (0.0%) |
| High School Diploma | 0 (0.0%) | 0 (0.0%) |
| College or Associate's Degree | 0 (0.0%) | 0 (0.0%) |
| Bachelor's Degree | 1 (100.0%) | 0 (0.0%) |
| Graduate Degree | 0 (0.0%) | 0 (0.0%) |
| Total | 1 (100.0%) | 0 (0.0%) |
Employment Characteristics in Irene
Employment by Class of Employer in Irene
Among the 267 employed individuals in Irene, private company employees (147 | 55.1%), not-for-profit organizations (32 | 12.0%), and self-employed (not incorporated) (30 | 11.2%) make up the most common classes of employment.
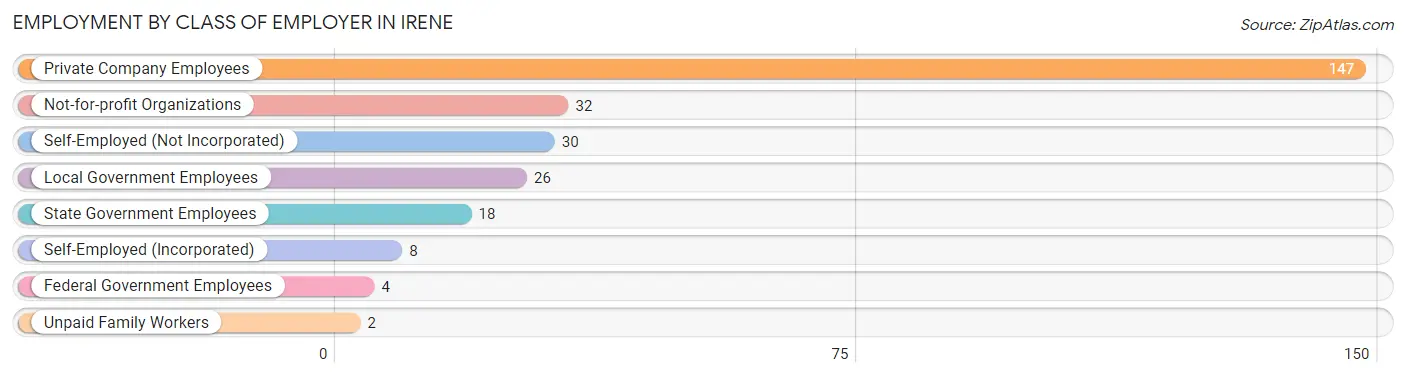
| Employer Class | # Employees | % Employees |
| Private Company Employees | 147 | 55.1% |
| Self-Employed (Incorporated) | 8 | 3.0% |
| Self-Employed (Not Incorporated) | 30 | 11.2% |
| Not-for-profit Organizations | 32 | 12.0% |
| Local Government Employees | 26 | 9.7% |
| State Government Employees | 18 | 6.7% |
| Federal Government Employees | 4 | 1.5% |
| Unpaid Family Workers | 2 | 0.7% |
| Total | 267 | 100.0% |
Employment Status by Age in Irene
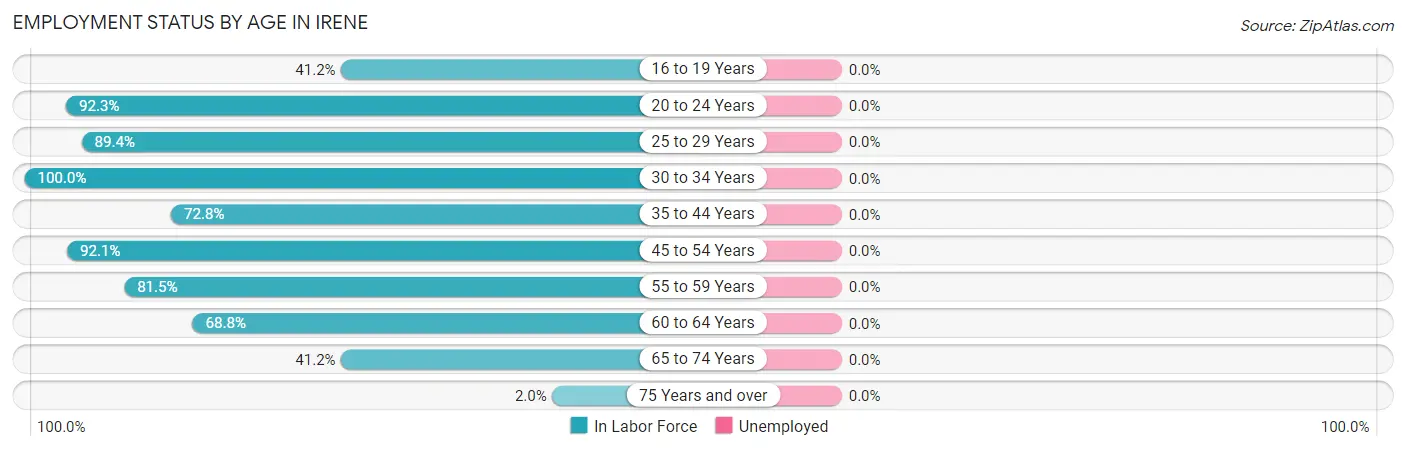
| Age Bracket | In Labor Force | Unemployed |
| 16 to 19 Years | 7 (41.2%) | 0 (0.0%) |
| 20 to 24 Years | 36 (92.3%) | 0 (0.0%) |
| 25 to 29 Years | 42 (89.4%) | 0 (0.0%) |
| 30 to 34 Years | 23 (100.0%) | 0 (0.0%) |
| 35 to 44 Years | 59 (72.8%) | 0 (0.0%) |
| 45 to 54 Years | 35 (92.1%) | 0 (0.0%) |
| 55 to 59 Years | 22 (81.5%) | 0 (0.0%) |
| 60 to 64 Years | 22 (68.8%) | 0 (0.0%) |
| 65 to 74 Years | 21 (41.2%) | 0 (0.0%) |
| 75 Years and over | 1 (2.0%) | 0 (0.0%) |
| Total | 268 (66.0%) | 0 (0.0%) |
Employment Status by Educational Attainment in Irene
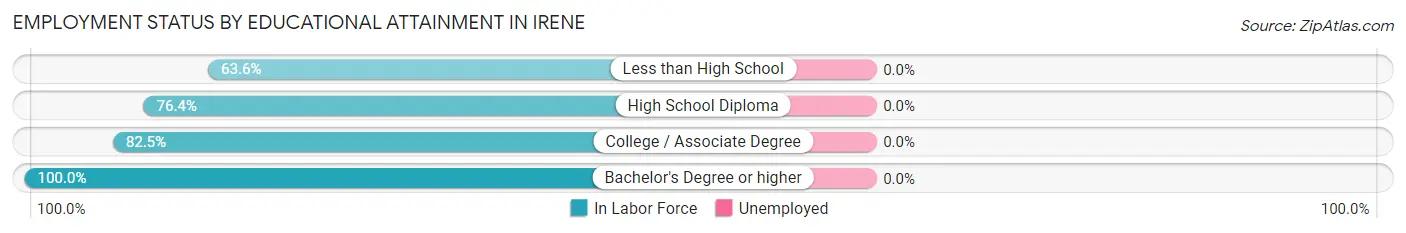
| Educational Attainment | In Labor Force | Unemployed |
| Less than High School | 14 (63.6%) | 0 (0.0%) |
| High School Diploma | 55 (76.4%) | 0 (0.0%) |
| College / Associate Degree | 94 (82.5%) | 0 (0.0%) |
| Bachelor's Degree or higher | 40 (100.0%) | 0 (0.0%) |
| Total | 203 (81.9%) | 0 (0.0%) |
Employment Occupations by Sex in Irene
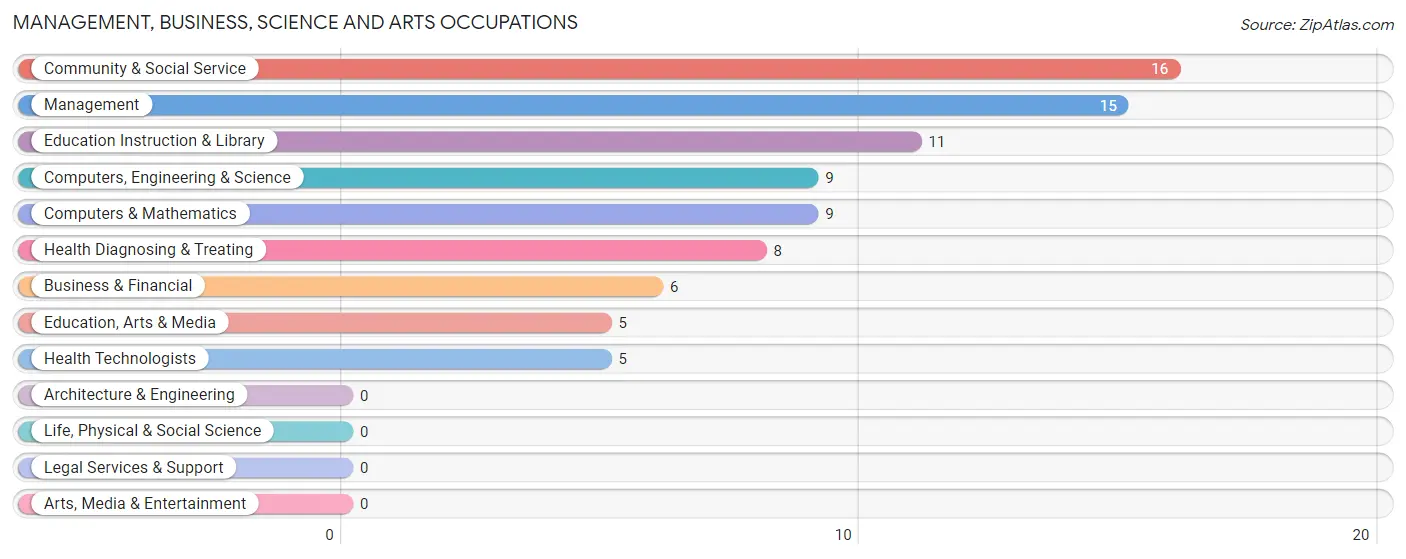
Management, Business, Science and Arts Occupations
The most common Management, Business, Science and Arts occupations in Irene are Community & Social Service (16 | 6.0%), Management (15 | 5.6%), Education Instruction & Library (11 | 4.1%), Computers, Engineering & Science (9 | 3.4%), and Computers & Mathematics (9 | 3.4%).
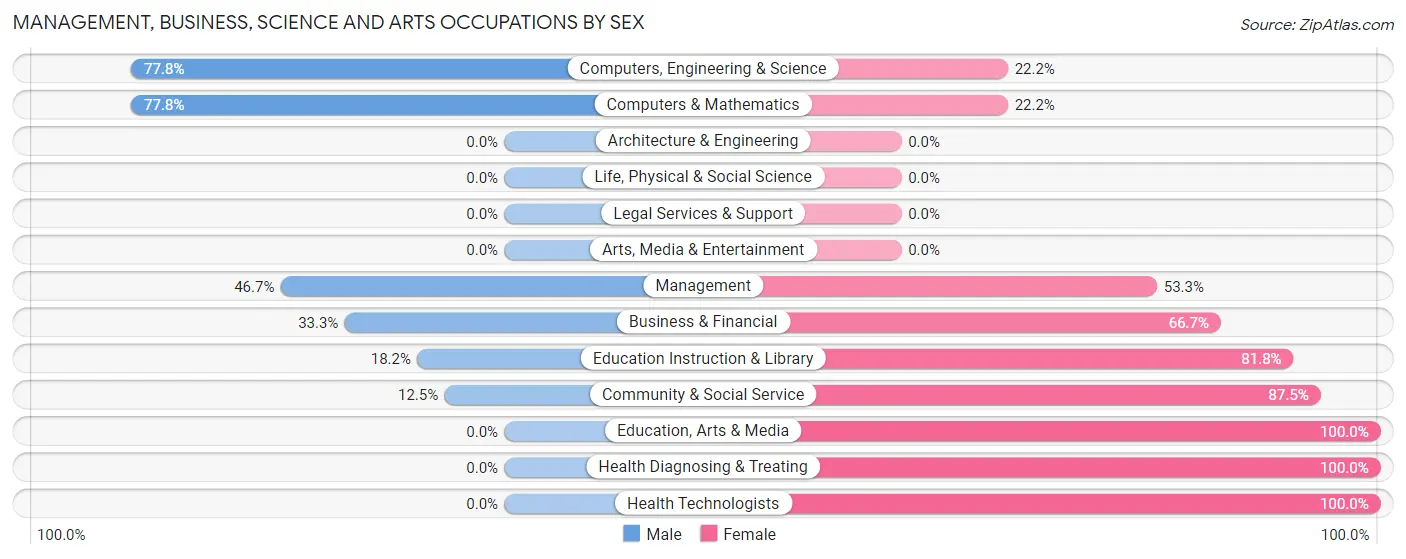
Management, Business, Science and Arts Occupations by Sex
Within the Management, Business, Science and Arts occupations in Irene, the most male-oriented occupations are Computers, Engineering & Science (77.8%), Computers & Mathematics (77.8%), and Management (46.7%), while the most female-oriented occupations are Education, Arts & Media (100.0%), Health Diagnosing & Treating (100.0%), and Health Technologists (100.0%).
| Occupation | Male | Female |
| Management | 7 (46.7%) | 8 (53.3%) |
| Business & Financial | 2 (33.3%) | 4 (66.7%) |
| Computers, Engineering & Science | 7 (77.8%) | 2 (22.2%) |
| Computers & Mathematics | 7 (77.8%) | 2 (22.2%) |
| Architecture & Engineering | 0 (0.0%) | 0 (0.0%) |
| Life, Physical & Social Science | 0 (0.0%) | 0 (0.0%) |
| Community & Social Service | 2 (12.5%) | 14 (87.5%) |
| Education, Arts & Media | 0 (0.0%) | 5 (100.0%) |
| Legal Services & Support | 0 (0.0%) | 0 (0.0%) |
| Education Instruction & Library | 2 (18.2%) | 9 (81.8%) |
| Arts, Media & Entertainment | 0 (0.0%) | 0 (0.0%) |
| Health Diagnosing & Treating | 0 (0.0%) | 8 (100.0%) |
| Health Technologists | 0 (0.0%) | 5 (100.0%) |
| Total (Category) | 18 (33.3%) | 36 (66.7%) |
| Total (Overall) | 126 (47.0%) | 142 (53.0%) |
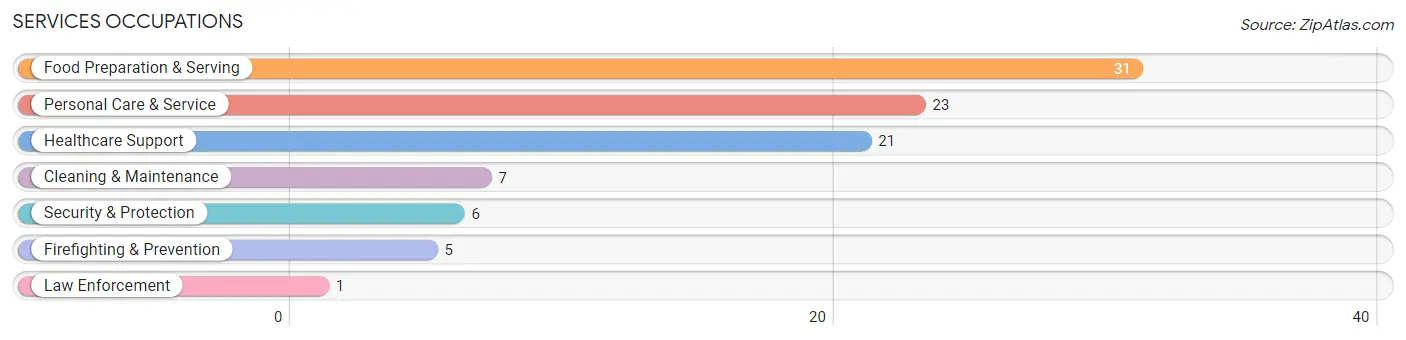
Services Occupations
The most common Services occupations in Irene are Food Preparation & Serving (31 | 11.6%), Personal Care & Service (23 | 8.6%), Healthcare Support (21 | 7.8%), Cleaning & Maintenance (7 | 2.6%), and Security & Protection (6 | 2.2%).
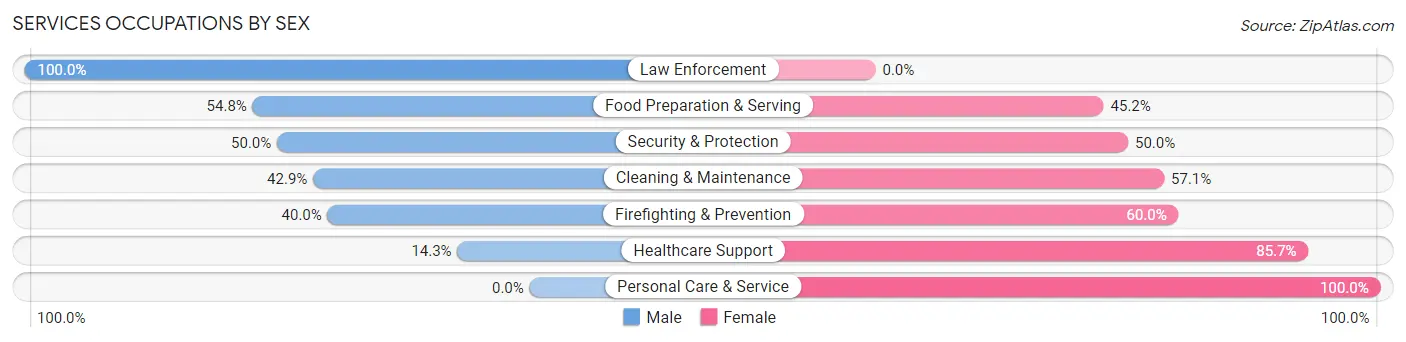
Services Occupations by Sex
Within the Services occupations in Irene, the most male-oriented occupations are Law Enforcement (100.0%), Food Preparation & Serving (54.8%), and Security & Protection (50.0%), while the most female-oriented occupations are Personal Care & Service (100.0%), Healthcare Support (85.7%), and Firefighting & Prevention (60.0%).
| Occupation | Male | Female |
| Healthcare Support | 3 (14.3%) | 18 (85.7%) |
| Security & Protection | 3 (50.0%) | 3 (50.0%) |
| Firefighting & Prevention | 2 (40.0%) | 3 (60.0%) |
| Law Enforcement | 1 (100.0%) | 0 (0.0%) |
| Food Preparation & Serving | 17 (54.8%) | 14 (45.2%) |
| Cleaning & Maintenance | 3 (42.9%) | 4 (57.1%) |
| Personal Care & Service | 0 (0.0%) | 23 (100.0%) |
| Total (Category) | 26 (29.5%) | 62 (70.5%) |
| Total (Overall) | 126 (47.0%) | 142 (53.0%) |
Sales and Office Occupations
The most common Sales and Office occupations in Irene are Sales & Related (28 | 10.4%), and Office & Administration (22 | 8.2%).
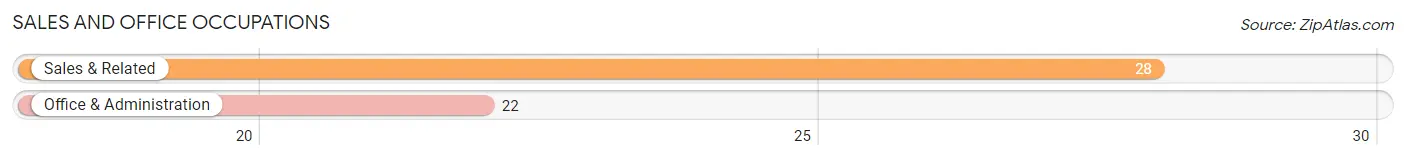
Sales and Office Occupations by Sex
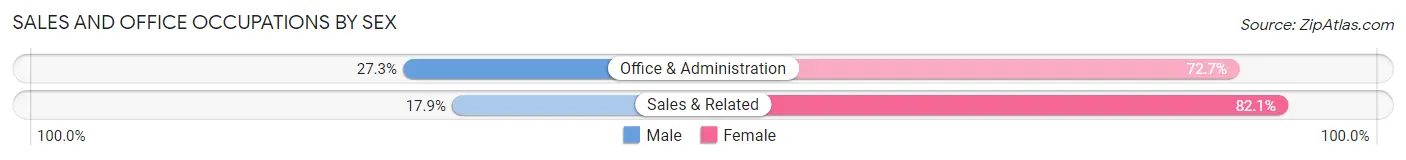
| Occupation | Male | Female |
| Sales & Related | 5 (17.9%) | 23 (82.1%) |
| Office & Administration | 6 (27.3%) | 16 (72.7%) |
| Total (Category) | 11 (22.0%) | 39 (78.0%) |
| Total (Overall) | 126 (47.0%) | 142 (53.0%) |
Natural Resources, Construction and Maintenance Occupations
The most common Natural Resources, Construction and Maintenance occupations in Irene are Construction & Extraction (30 | 11.2%), and Installation, Maintenance & Repair (9 | 3.4%).
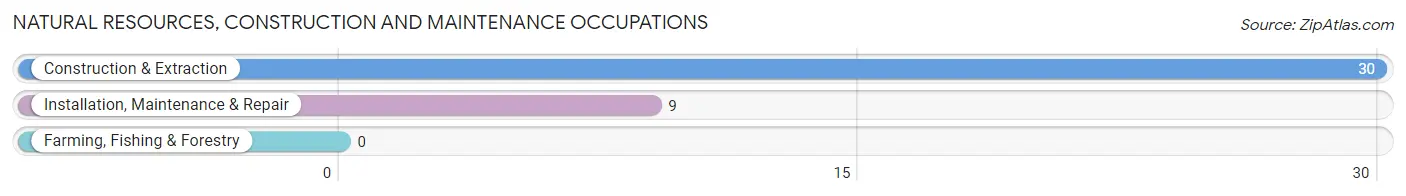
Natural Resources, Construction and Maintenance Occupations by Sex
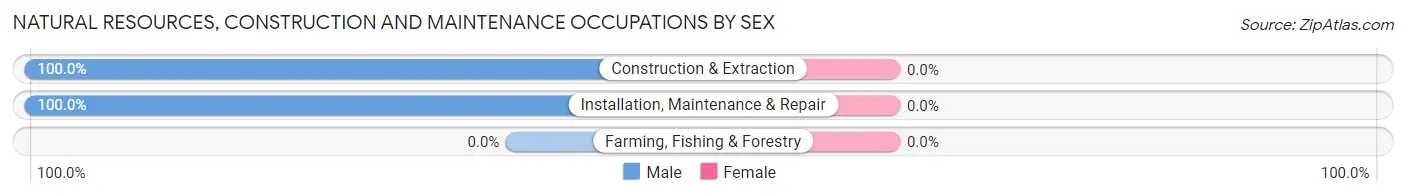
| Occupation | Male | Female |
| Farming, Fishing & Forestry | 0 (0.0%) | 0 (0.0%) |
| Construction & Extraction | 30 (100.0%) | 0 (0.0%) |
| Installation, Maintenance & Repair | 9 (100.0%) | 0 (0.0%) |
| Total (Category) | 39 (100.0%) | 0 (0.0%) |
| Total (Overall) | 126 (47.0%) | 142 (53.0%) |
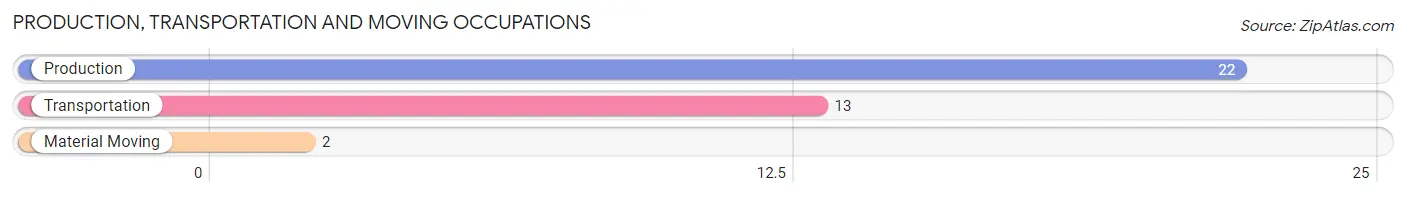
Production, Transportation and Moving Occupations
The most common Production, Transportation and Moving occupations in Irene are Production (22 | 8.2%), Transportation (13 | 4.9%), and Material Moving (2 | 0.7%).
Production, Transportation and Moving Occupations by Sex
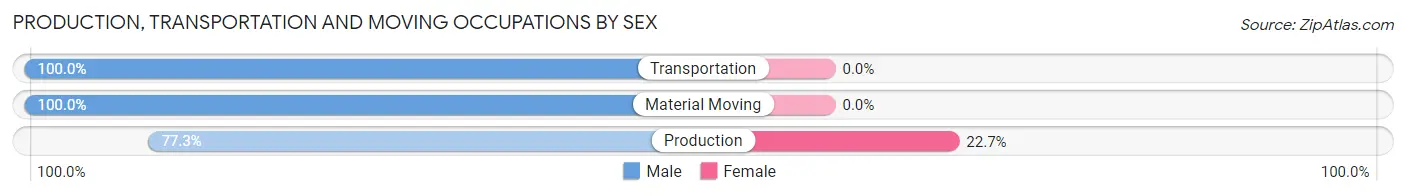
| Occupation | Male | Female |
| Production | 17 (77.3%) | 5 (22.7%) |
| Transportation | 13 (100.0%) | 0 (0.0%) |
| Material Moving | 2 (100.0%) | 0 (0.0%) |
| Total (Category) | 32 (86.5%) | 5 (13.5%) |
| Total (Overall) | 126 (47.0%) | 142 (53.0%) |
Employment Industries by Sex in Irene
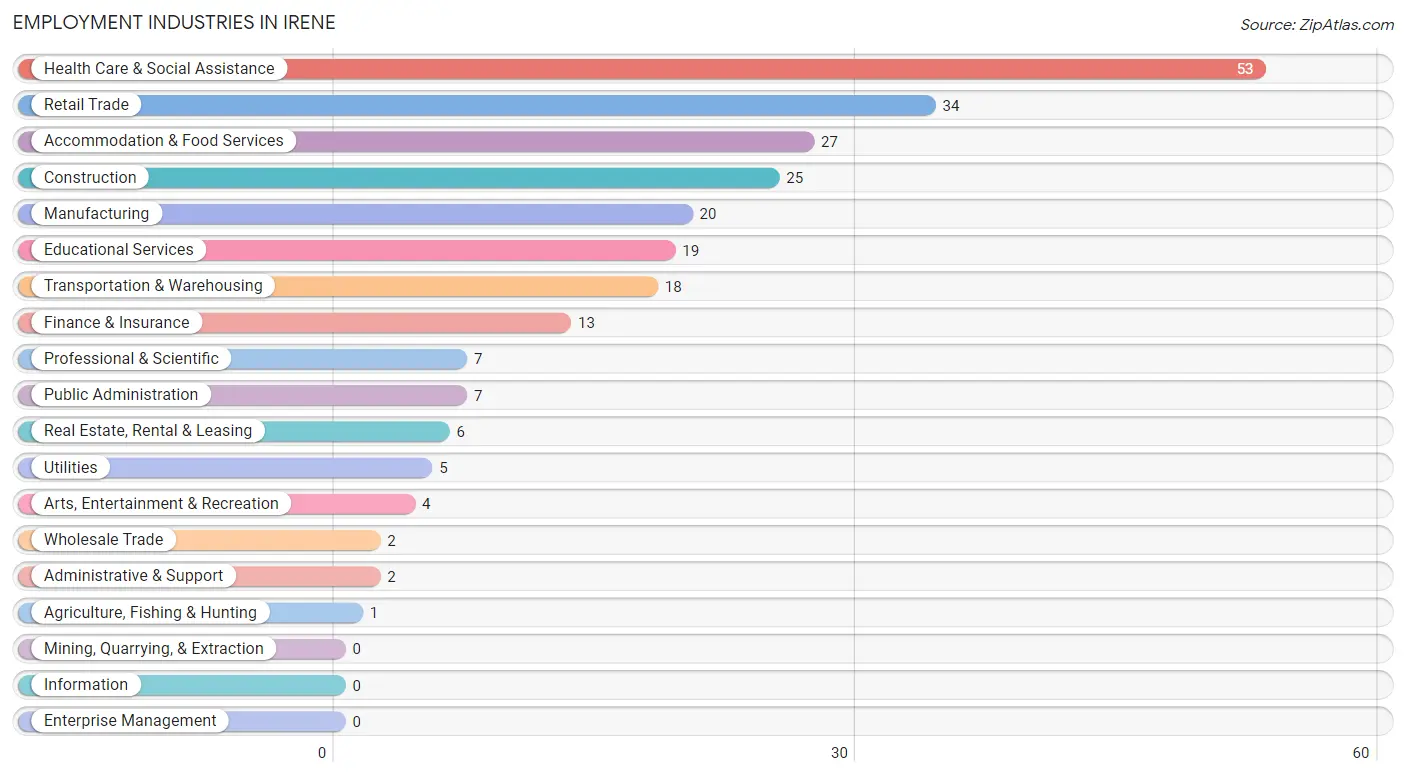
Employment Industries in Irene
The major employment industries in Irene include Health Care & Social Assistance (53 | 19.8%), Retail Trade (34 | 12.7%), Accommodation & Food Services (27 | 10.1%), Construction (25 | 9.3%), and Manufacturing (20 | 7.5%).
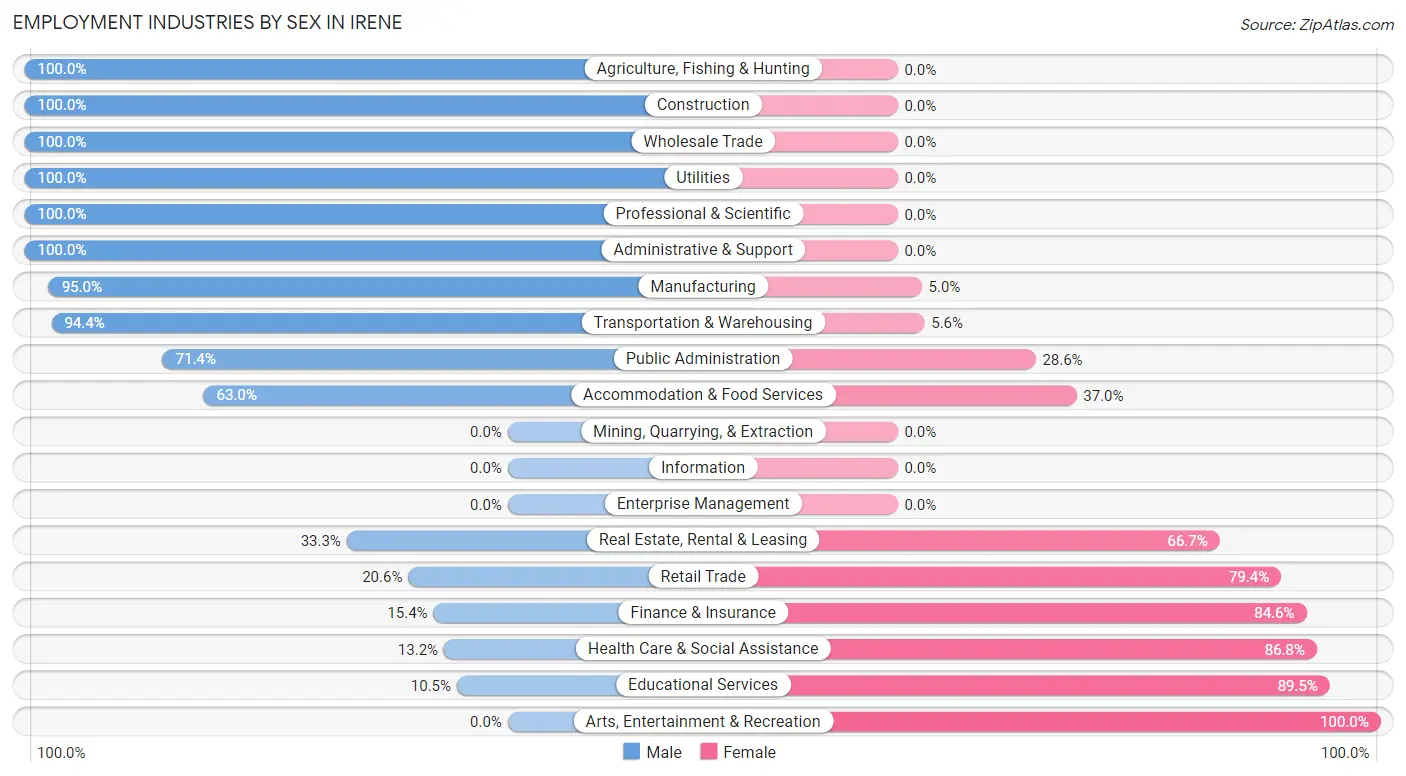
Employment Industries by Sex in Irene
The Irene industries that see more men than women are Agriculture, Fishing & Hunting (100.0%), Construction (100.0%), and Wholesale Trade (100.0%), whereas the industries that tend to have a higher number of women are Arts, Entertainment & Recreation (100.0%), Educational Services (89.5%), and Health Care & Social Assistance (86.8%).
| Industry | Male | Female |
| Agriculture, Fishing & Hunting | 1 (100.0%) | 0 (0.0%) |
| Mining, Quarrying, & Extraction | 0 (0.0%) | 0 (0.0%) |
| Construction | 25 (100.0%) | 0 (0.0%) |
| Manufacturing | 19 (95.0%) | 1 (5.0%) |
| Wholesale Trade | 2 (100.0%) | 0 (0.0%) |
| Retail Trade | 7 (20.6%) | 27 (79.4%) |
| Transportation & Warehousing | 17 (94.4%) | 1 (5.6%) |
| Utilities | 5 (100.0%) | 0 (0.0%) |
| Information | 0 (0.0%) | 0 (0.0%) |
| Finance & Insurance | 2 (15.4%) | 11 (84.6%) |
| Real Estate, Rental & Leasing | 2 (33.3%) | 4 (66.7%) |
| Professional & Scientific | 7 (100.0%) | 0 (0.0%) |
| Enterprise Management | 0 (0.0%) | 0 (0.0%) |
| Administrative & Support | 2 (100.0%) | 0 (0.0%) |
| Educational Services | 2 (10.5%) | 17 (89.5%) |
| Health Care & Social Assistance | 7 (13.2%) | 46 (86.8%) |
| Arts, Entertainment & Recreation | 0 (0.0%) | 4 (100.0%) |
| Accommodation & Food Services | 17 (63.0%) | 10 (37.0%) |
| Public Administration | 5 (71.4%) | 2 (28.6%) |
| Total | 126 (47.0%) | 142 (53.0%) |
Education in Irene
School Enrollment in Irene
The most common levels of schooling among the 86 students in Irene are middle school (29 | 33.7%), high school (24 | 27.9%), and kindergarten (18 | 20.9%).
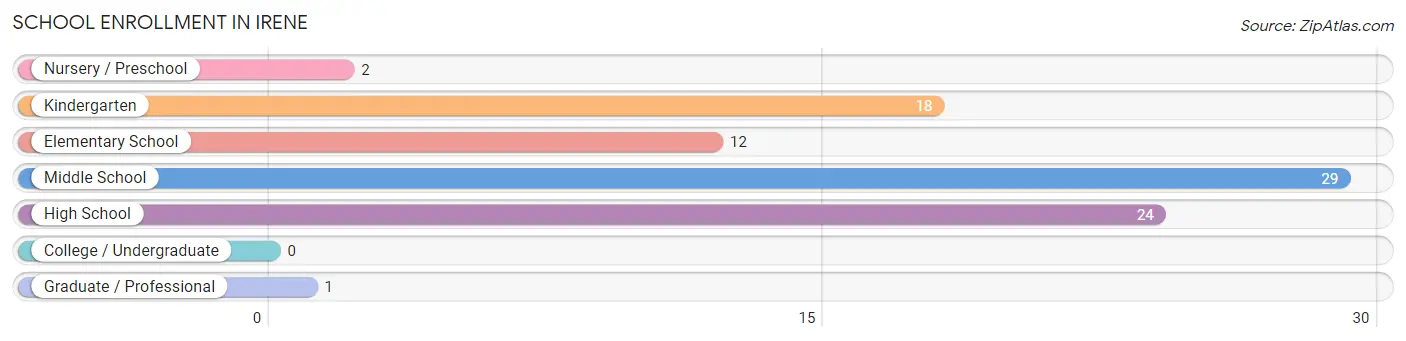
| School Level | # Students | % Students |
| Nursery / Preschool | 2 | 2.3% |
| Kindergarten | 18 | 20.9% |
| Elementary School | 12 | 14.0% |
| Middle School | 29 | 33.7% |
| High School | 24 | 27.9% |
| College / Undergraduate | 0 | 0.0% |
| Graduate / Professional | 1 | 1.2% |
| Total | 86 | 100.0% |
School Enrollment by Age by Funding Source in Irene
Out of a total of 86 students who are enrolled in schools in Irene, 7 (8.1%) attend a private institution, while the remaining 79 (91.9%) are enrolled in public schools. The age group of 15 to 17 year olds has the highest likelihood of being enrolled in private schools, with 6 (31.6% in the age bracket) enrolled. Conversely, the age group of 3 to 4 year olds has the lowest likelihood of being enrolled in a private school, with 1 (100.0% in the age bracket) attending a public institution.
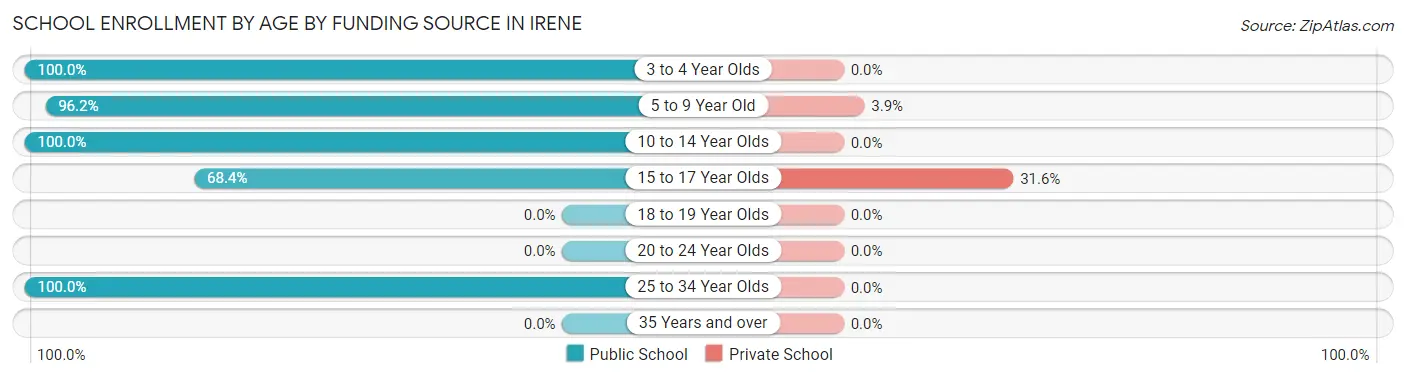
| Age Bracket | Public School | Private School |
| 3 to 4 Year Olds | 1 (100.0%) | 0 (0.0%) |
| 5 to 9 Year Old | 25 (96.2%) | 1 (3.8%) |
| 10 to 14 Year Olds | 39 (100.0%) | 0 (0.0%) |
| 15 to 17 Year Olds | 13 (68.4%) | 6 (31.6%) |
| 18 to 19 Year Olds | 0 (0.0%) | 0 (0.0%) |
| 20 to 24 Year Olds | 0 (0.0%) | 0 (0.0%) |
| 25 to 34 Year Olds | 1 (100.0%) | 0 (0.0%) |
| 35 Years and over | 0 (0.0%) | 0 (0.0%) |
| Total | 79 (91.9%) | 7 (8.1%) |
Educational Attainment by Field of Study in Irene
Education (23 | 39.7%), science & technology (15 | 25.9%), business (7 | 12.1%), computers & mathematics (5 | 8.6%), and bio, nature & agricultural (4 | 6.9%) are the most common fields of study among 58 individuals in Irene who have obtained a bachelor's degree or higher.
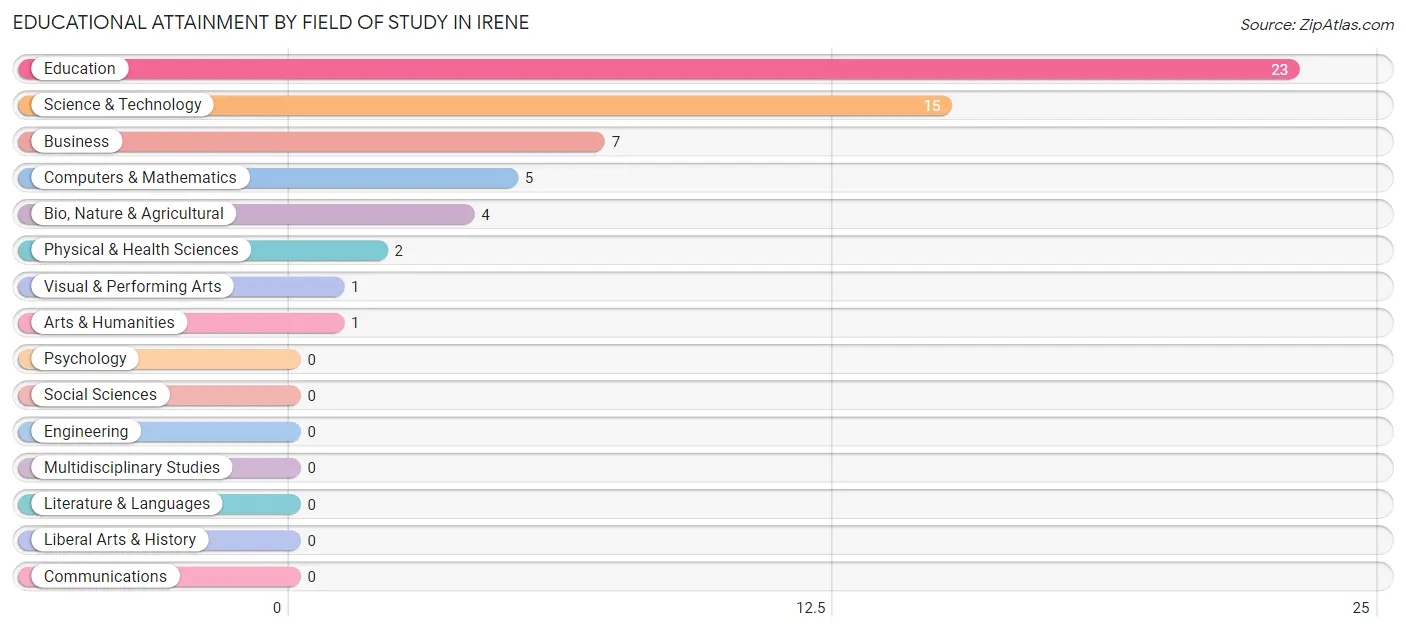
| Field of Study | # Graduates | % Graduates |
| Computers & Mathematics | 5 | 8.6% |
| Bio, Nature & Agricultural | 4 | 6.9% |
| Physical & Health Sciences | 2 | 3.5% |
| Psychology | 0 | 0.0% |
| Social Sciences | 0 | 0.0% |
| Engineering | 0 | 0.0% |
| Multidisciplinary Studies | 0 | 0.0% |
| Science & Technology | 15 | 25.9% |
| Business | 7 | 12.1% |
| Education | 23 | 39.7% |
| Literature & Languages | 0 | 0.0% |
| Liberal Arts & History | 0 | 0.0% |
| Visual & Performing Arts | 1 | 1.7% |
| Communications | 0 | 0.0% |
| Arts & Humanities | 1 | 1.7% |
| Total | 58 | 100.0% |
Transportation & Commute in Irene
Vehicle Availability by Sex in Irene
The most prevalent vehicle ownership categories in Irene are males with 2 vehicles (35, accounting for 27.8%) and females with 2 vehicles (38, making up 24.8%).
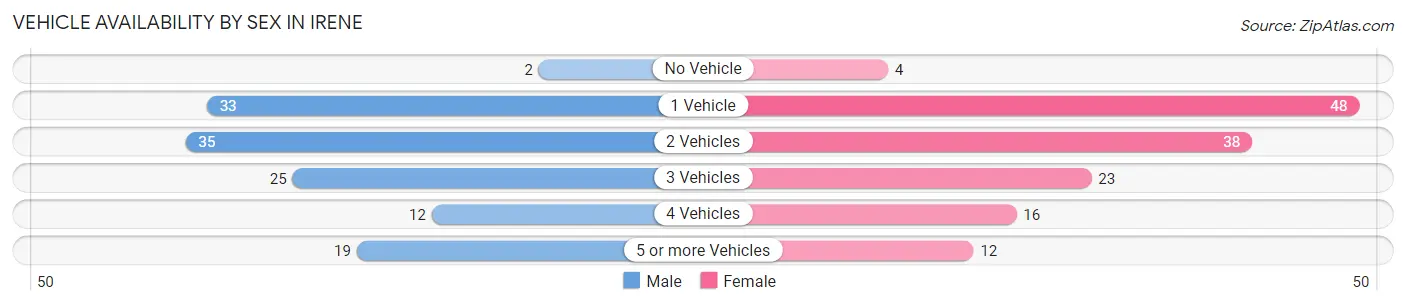
| Vehicles Available | Male | Female |
| No Vehicle | 2 (1.6%) | 4 (2.8%) |
| 1 Vehicle | 33 (26.2%) | 48 (34.0%) |
| 2 Vehicles | 35 (27.8%) | 38 (27.0%) |
| 3 Vehicles | 25 (19.8%) | 23 (16.3%) |
| 4 Vehicles | 12 (9.5%) | 16 (11.4%) |
| 5 or more Vehicles | 19 (15.1%) | 12 (8.5%) |
| Total | 126 (100.0%) | 141 (100.0%) |
Commute Time in Irene
The most frequently occuring commute durations in Irene are 30 to 34 minutes (52 commuters, 21.7%), less than 5 minutes (33 commuters, 13.8%), and 5 to 9 minutes (28 commuters, 11.7%).
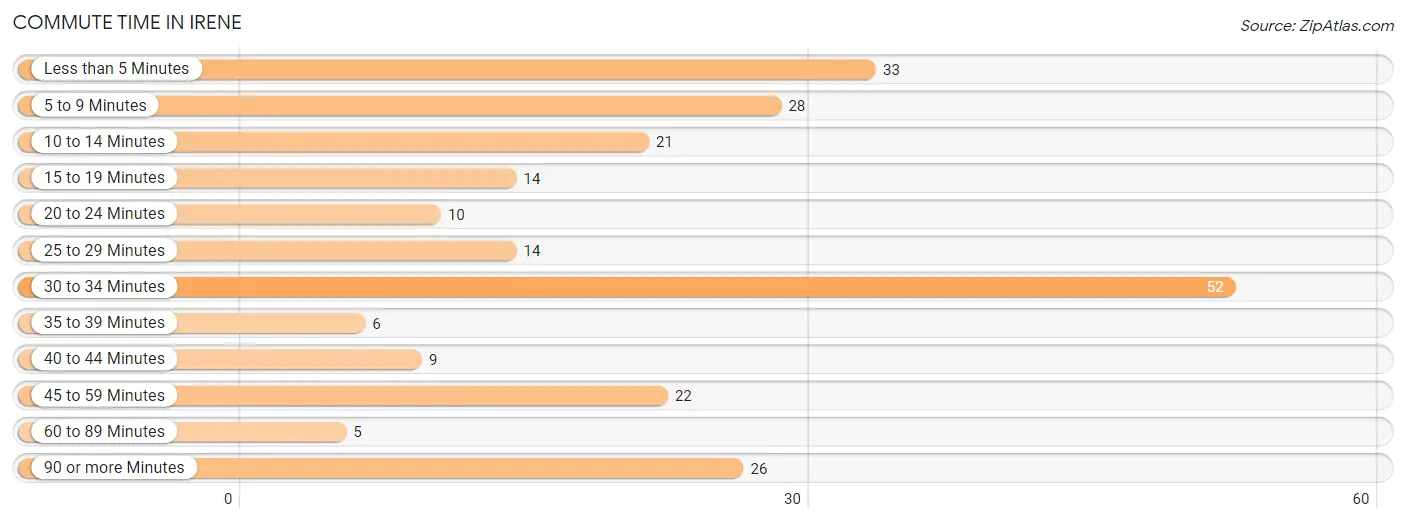
| Commute Time | # Commuters | % Commuters |
| Less than 5 Minutes | 33 | 13.8% |
| 5 to 9 Minutes | 28 | 11.7% |
| 10 to 14 Minutes | 21 | 8.7% |
| 15 to 19 Minutes | 14 | 5.8% |
| 20 to 24 Minutes | 10 | 4.2% |
| 25 to 29 Minutes | 14 | 5.8% |
| 30 to 34 Minutes | 52 | 21.7% |
| 35 to 39 Minutes | 6 | 2.5% |
| 40 to 44 Minutes | 9 | 3.7% |
| 45 to 59 Minutes | 22 | 9.2% |
| 60 to 89 Minutes | 5 | 2.1% |
| 90 or more Minutes | 26 | 10.8% |
Commute Time by Sex in Irene
The most common commute times in Irene are 30 to 34 minutes (29 commuters, 24.4%) for males and 30 to 34 minutes (23 commuters, 19.0%) for females.
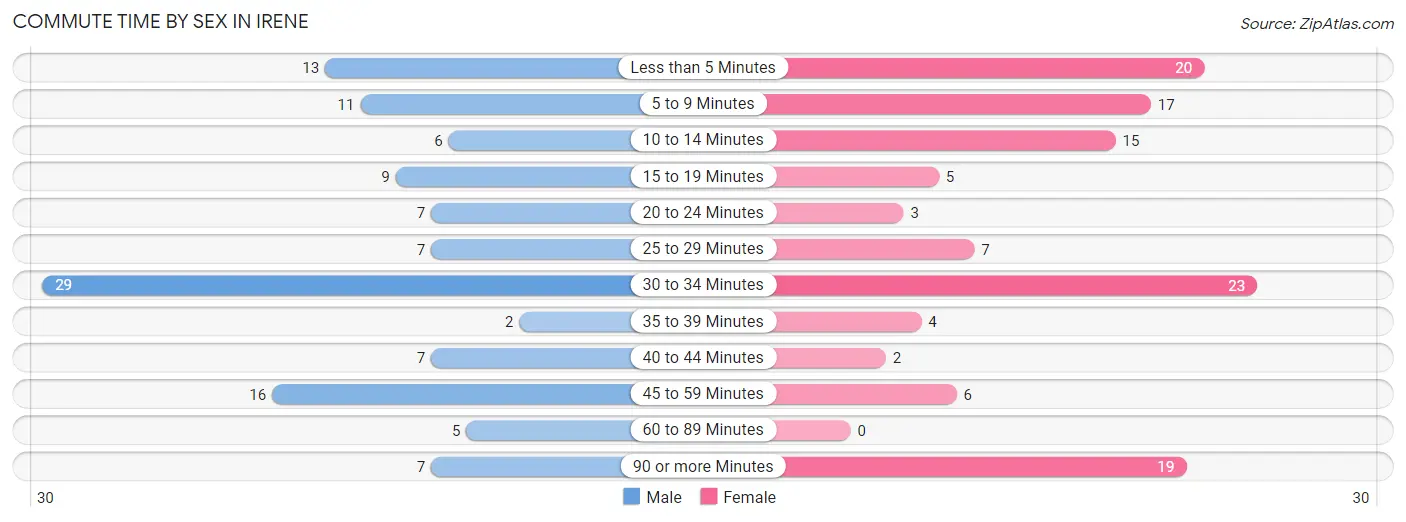
| Commute Time | Male | Female |
| Less than 5 Minutes | 13 (10.9%) | 20 (16.5%) |
| 5 to 9 Minutes | 11 (9.2%) | 17 (14.1%) |
| 10 to 14 Minutes | 6 (5.0%) | 15 (12.4%) |
| 15 to 19 Minutes | 9 (7.6%) | 5 (4.1%) |
| 20 to 24 Minutes | 7 (5.9%) | 3 (2.5%) |
| 25 to 29 Minutes | 7 (5.9%) | 7 (5.8%) |
| 30 to 34 Minutes | 29 (24.4%) | 23 (19.0%) |
| 35 to 39 Minutes | 2 (1.7%) | 4 (3.3%) |
| 40 to 44 Minutes | 7 (5.9%) | 2 (1.7%) |
| 45 to 59 Minutes | 16 (13.5%) | 6 (5.0%) |
| 60 to 89 Minutes | 5 (4.2%) | 0 (0.0%) |
| 90 or more Minutes | 7 (5.9%) | 19 (15.7%) |
Time of Departure to Work by Sex in Irene
The most frequent times of departure to work in Irene are 6:30 AM to 6:59 AM (22, 18.5%) for males and 7:00 AM to 7:29 AM (22, 18.2%) for females.
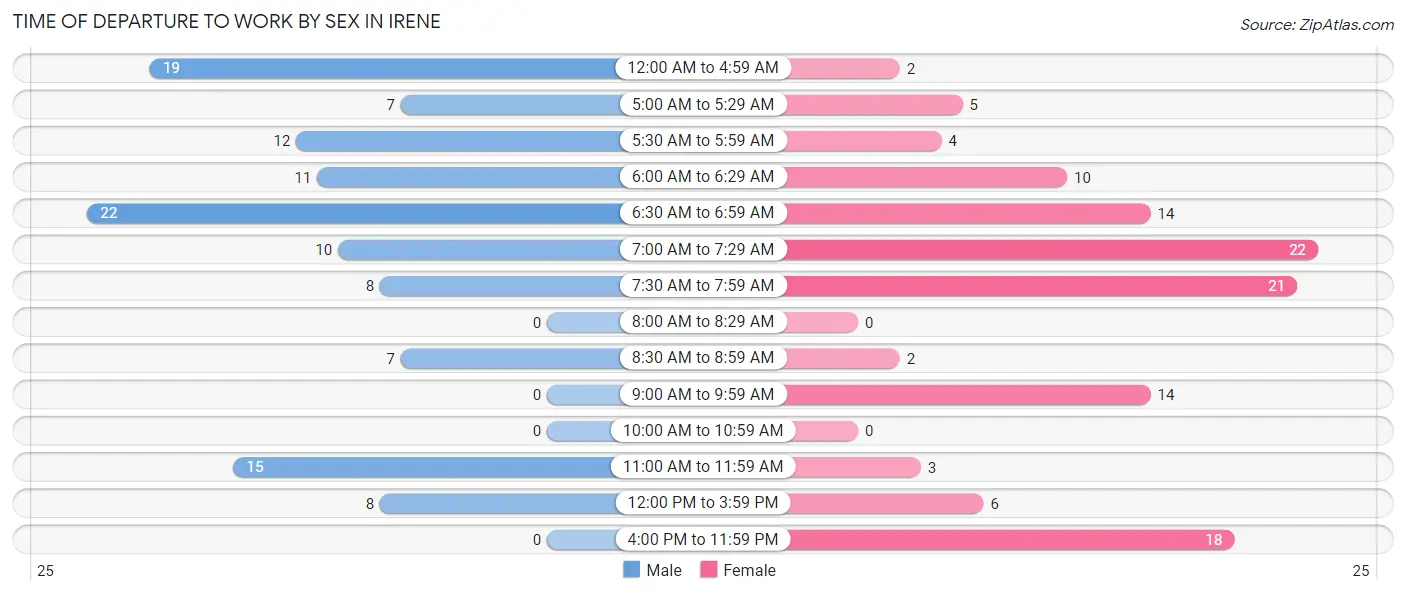
| Time of Departure | Male | Female |
| 12:00 AM to 4:59 AM | 19 (16.0%) | 2 (1.7%) |
| 5:00 AM to 5:29 AM | 7 (5.9%) | 5 (4.1%) |
| 5:30 AM to 5:59 AM | 12 (10.1%) | 4 (3.3%) |
| 6:00 AM to 6:29 AM | 11 (9.2%) | 10 (8.3%) |
| 6:30 AM to 6:59 AM | 22 (18.5%) | 14 (11.6%) |
| 7:00 AM to 7:29 AM | 10 (8.4%) | 22 (18.2%) |
| 7:30 AM to 7:59 AM | 8 (6.7%) | 21 (17.4%) |
| 8:00 AM to 8:29 AM | 0 (0.0%) | 0 (0.0%) |
| 8:30 AM to 8:59 AM | 7 (5.9%) | 2 (1.7%) |
| 9:00 AM to 9:59 AM | 0 (0.0%) | 14 (11.6%) |
| 10:00 AM to 10:59 AM | 0 (0.0%) | 0 (0.0%) |
| 11:00 AM to 11:59 AM | 15 (12.6%) | 3 (2.5%) |
| 12:00 PM to 3:59 PM | 8 (6.7%) | 6 (5.0%) |
| 4:00 PM to 11:59 PM | 0 (0.0%) | 18 (14.9%) |
| Total | 119 (100.0%) | 121 (100.0%) |
Housing Occupancy in Irene
Occupancy by Ownership in Irene
Of the total 213 dwellings in Irene, owner-occupied units account for 132 (62.0%), while renter-occupied units make up 81 (38.0%).
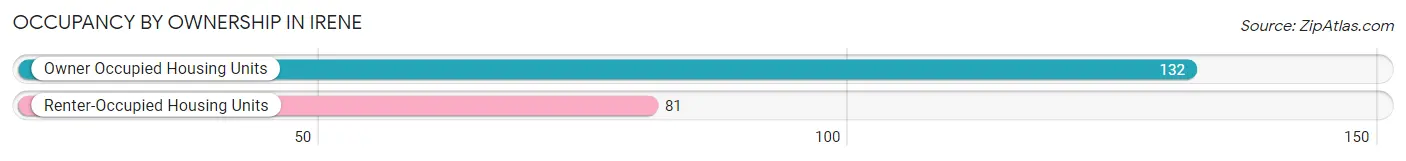
| Occupancy | # Housing Units | % Housing Units |
| Owner Occupied Housing Units | 132 | 62.0% |
| Renter-Occupied Housing Units | 81 | 38.0% |
| Total Occupied Housing Units | 213 | 100.0% |
Occupancy by Household Size in Irene
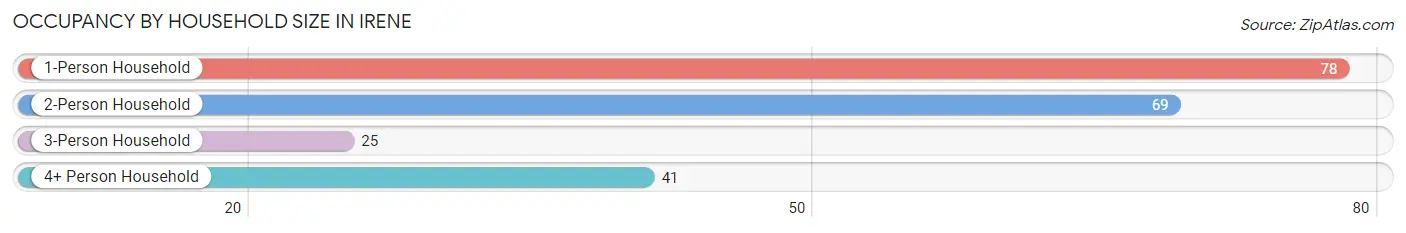
| Household Size | # Housing Units | % Housing Units |
| 1-Person Household | 78 | 36.6% |
| 2-Person Household | 69 | 32.4% |
| 3-Person Household | 25 | 11.7% |
| 4+ Person Household | 41 | 19.3% |
| Total Housing Units | 213 | 100.0% |
Occupancy by Ownership by Household Size in Irene
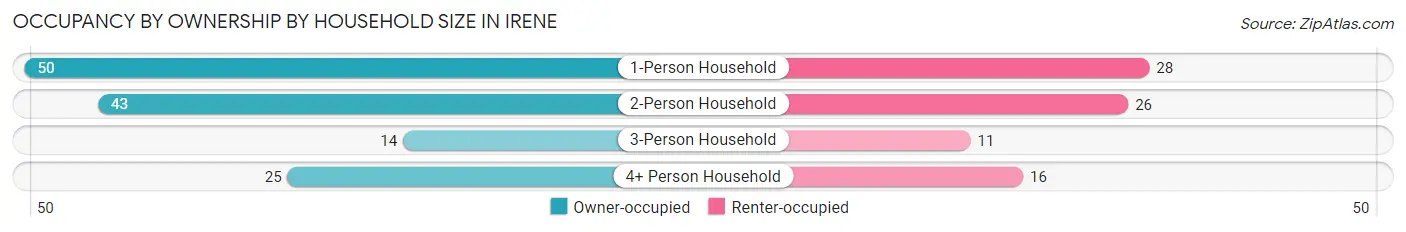
| Household Size | Owner-occupied | Renter-occupied |
| 1-Person Household | 50 (64.1%) | 28 (35.9%) |
| 2-Person Household | 43 (62.3%) | 26 (37.7%) |
| 3-Person Household | 14 (56.0%) | 11 (44.0%) |
| 4+ Person Household | 25 (61.0%) | 16 (39.0%) |
| Total Housing Units | 132 (62.0%) | 81 (38.0%) |
Occupancy by Educational Attainment in Irene
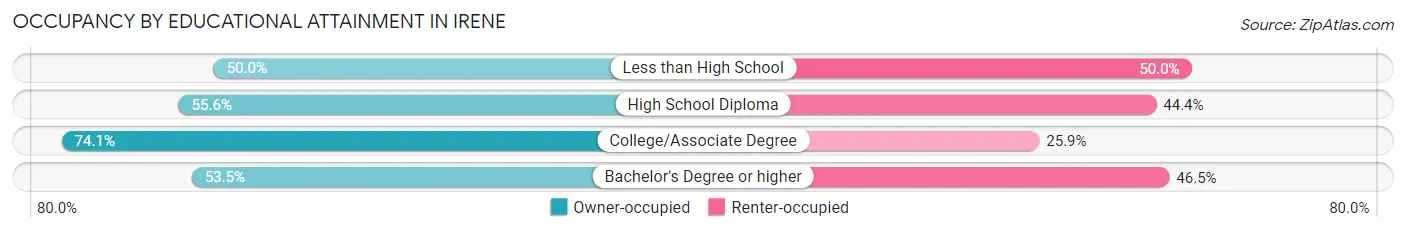
| Household Size | Owner-occupied | Renter-occupied |
| Less than High School | 11 (50.0%) | 11 (50.0%) |
| High School Diploma | 35 (55.6%) | 28 (44.4%) |
| College/Associate Degree | 63 (74.1%) | 22 (25.9%) |
| Bachelor's Degree or higher | 23 (53.5%) | 20 (46.5%) |
Occupancy by Age of Householder in Irene
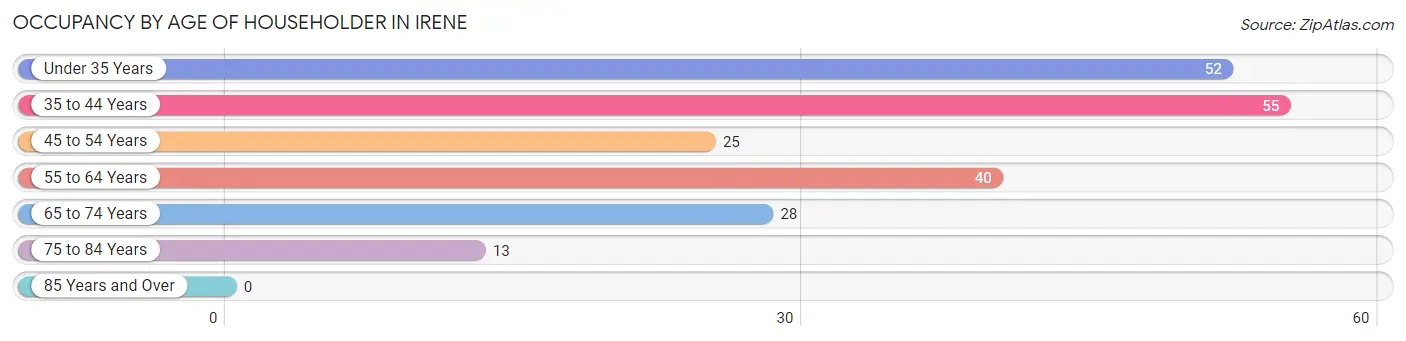
| Age Bracket | # Households | % Households |
| Under 35 Years | 52 | 24.4% |
| 35 to 44 Years | 55 | 25.8% |
| 45 to 54 Years | 25 | 11.7% |
| 55 to 64 Years | 40 | 18.8% |
| 65 to 74 Years | 28 | 13.2% |
| 75 to 84 Years | 13 | 6.1% |
| 85 Years and Over | 0 | 0.0% |
| Total | 213 | 100.0% |
Housing Finances in Irene
Median Income by Occupancy in Irene
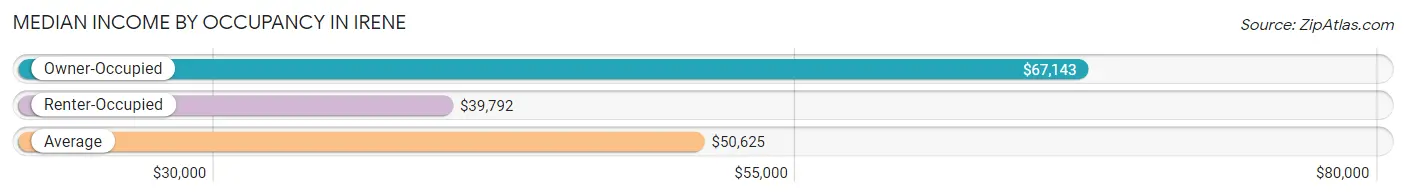
| Occupancy Type | # Households | Median Income |
| Owner-Occupied | 132 (62.0%) | $67,143 |
| Renter-Occupied | 81 (38.0%) | $39,792 |
| Average | 213 (100.0%) | $50,625 |
Occupancy by Householder Income Bracket in Irene
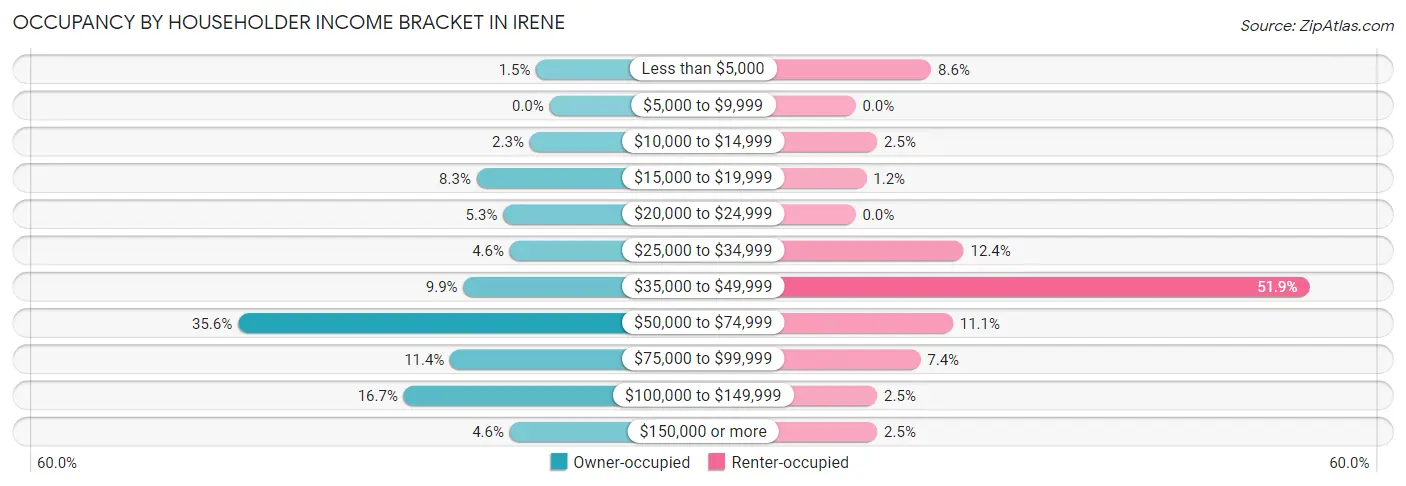
| Income Bracket | Owner-occupied | Renter-occupied |
| Less than $5,000 | 2 (1.5%) | 7 (8.6%) |
| $5,000 to $9,999 | 0 (0.0%) | 0 (0.0%) |
| $10,000 to $14,999 | 3 (2.3%) | 2 (2.5%) |
| $15,000 to $19,999 | 11 (8.3%) | 1 (1.2%) |
| $20,000 to $24,999 | 7 (5.3%) | 0 (0.0%) |
| $25,000 to $34,999 | 6 (4.5%) | 10 (12.3%) |
| $35,000 to $49,999 | 13 (9.9%) | 42 (51.8%) |
| $50,000 to $74,999 | 47 (35.6%) | 9 (11.1%) |
| $75,000 to $99,999 | 15 (11.4%) | 6 (7.4%) |
| $100,000 to $149,999 | 22 (16.7%) | 2 (2.5%) |
| $150,000 or more | 6 (4.5%) | 2 (2.5%) |
| Total | 132 (100.0%) | 81 (100.0%) |
Monthly Housing Cost Tiers in Irene
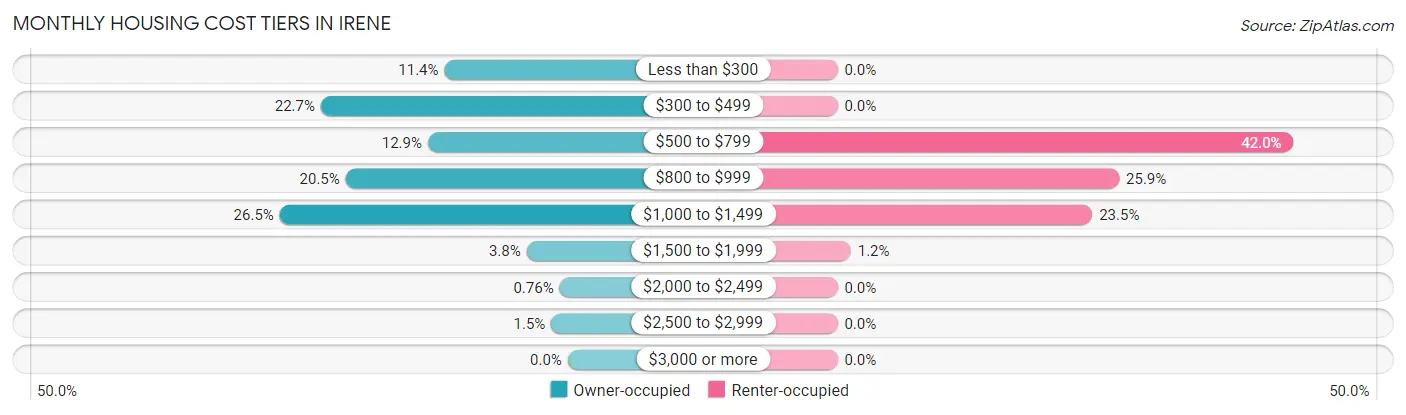
| Monthly Cost | Owner-occupied | Renter-occupied |
| Less than $300 | 15 (11.4%) | 0 (0.0%) |
| $300 to $499 | 30 (22.7%) | 0 (0.0%) |
| $500 to $799 | 17 (12.9%) | 34 (42.0%) |
| $800 to $999 | 27 (20.4%) | 21 (25.9%) |
| $1,000 to $1,499 | 35 (26.5%) | 19 (23.5%) |
| $1,500 to $1,999 | 5 (3.8%) | 1 (1.2%) |
| $2,000 to $2,499 | 1 (0.8%) | 0 (0.0%) |
| $2,500 to $2,999 | 2 (1.5%) | 0 (0.0%) |
| $3,000 or more | 0 (0.0%) | 0 (0.0%) |
| Total | 132 (100.0%) | 81 (100.0%) |
Physical Housing Characteristics in Irene
Housing Structures in Irene
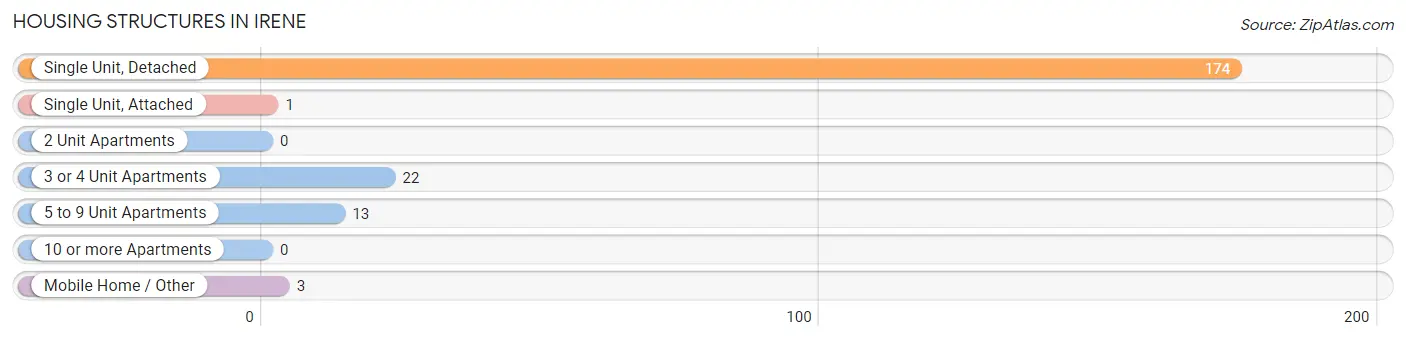
| Structure Type | # Housing Units | % Housing Units |
| Single Unit, Detached | 174 | 81.7% |
| Single Unit, Attached | 1 | 0.5% |
| 2 Unit Apartments | 0 | 0.0% |
| 3 or 4 Unit Apartments | 22 | 10.3% |
| 5 to 9 Unit Apartments | 13 | 6.1% |
| 10 or more Apartments | 0 | 0.0% |
| Mobile Home / Other | 3 | 1.4% |
| Total | 213 | 100.0% |
Housing Structures by Occupancy in Irene
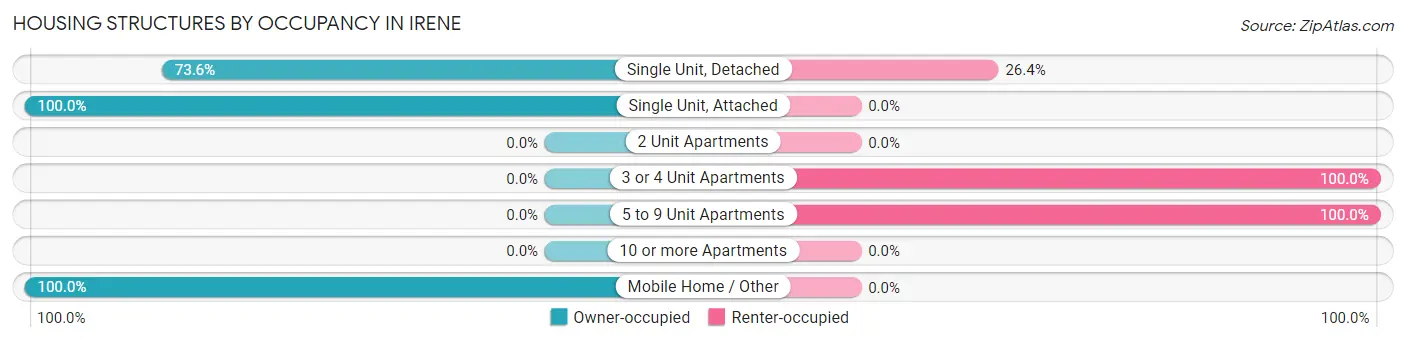
| Structure Type | Owner-occupied | Renter-occupied |
| Single Unit, Detached | 128 (73.6%) | 46 (26.4%) |
| Single Unit, Attached | 1 (100.0%) | 0 (0.0%) |
| 2 Unit Apartments | 0 (0.0%) | 0 (0.0%) |
| 3 or 4 Unit Apartments | 0 (0.0%) | 22 (100.0%) |
| 5 to 9 Unit Apartments | 0 (0.0%) | 13 (100.0%) |
| 10 or more Apartments | 0 (0.0%) | 0 (0.0%) |
| Mobile Home / Other | 3 (100.0%) | 0 (0.0%) |
| Total | 132 (62.0%) | 81 (38.0%) |
Housing Structures by Number of Rooms in Irene
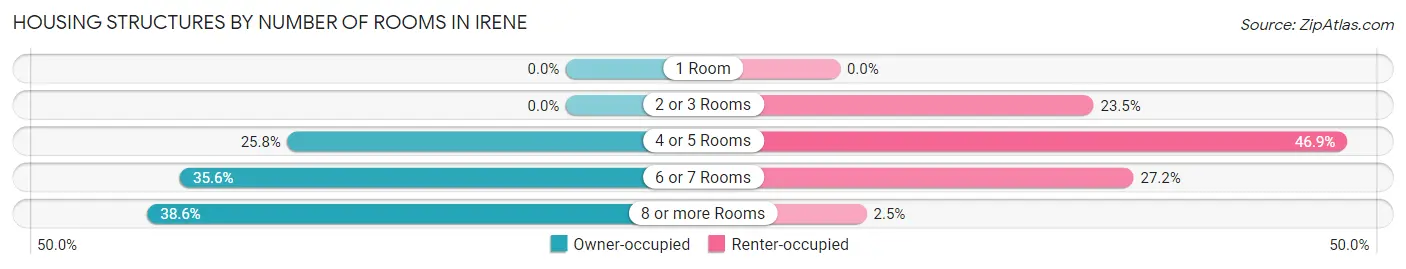
| Number of Rooms | Owner-occupied | Renter-occupied |
| 1 Room | 0 (0.0%) | 0 (0.0%) |
| 2 or 3 Rooms | 0 (0.0%) | 19 (23.5%) |
| 4 or 5 Rooms | 34 (25.8%) | 38 (46.9%) |
| 6 or 7 Rooms | 47 (35.6%) | 22 (27.2%) |
| 8 or more Rooms | 51 (38.6%) | 2 (2.5%) |
| Total | 132 (100.0%) | 81 (100.0%) |
Housing Structure by Heating Type in Irene
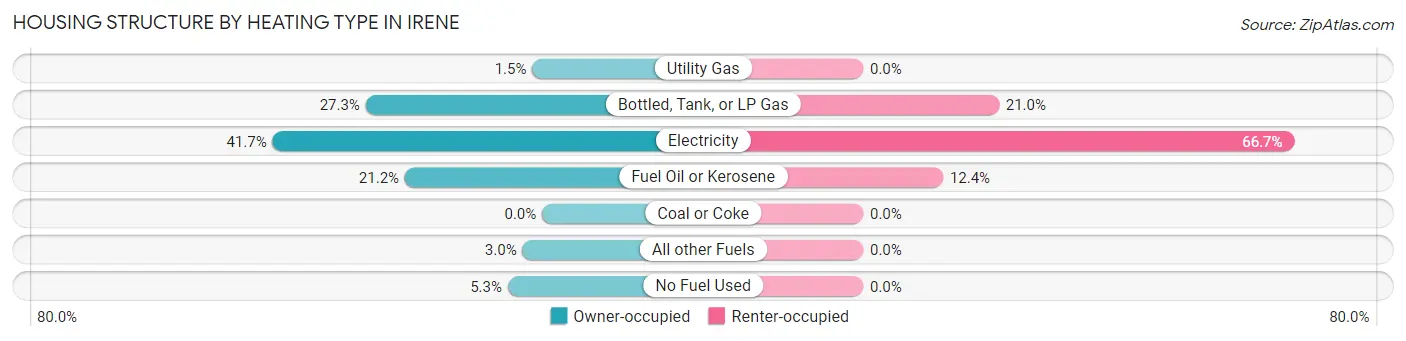
| Heating Type | Owner-occupied | Renter-occupied |
| Utility Gas | 2 (1.5%) | 0 (0.0%) |
| Bottled, Tank, or LP Gas | 36 (27.3%) | 17 (21.0%) |
| Electricity | 55 (41.7%) | 54 (66.7%) |
| Fuel Oil or Kerosene | 28 (21.2%) | 10 (12.3%) |
| Coal or Coke | 0 (0.0%) | 0 (0.0%) |
| All other Fuels | 4 (3.0%) | 0 (0.0%) |
| No Fuel Used | 7 (5.3%) | 0 (0.0%) |
| Total | 132 (100.0%) | 81 (100.0%) |
Household Vehicle Usage in Irene
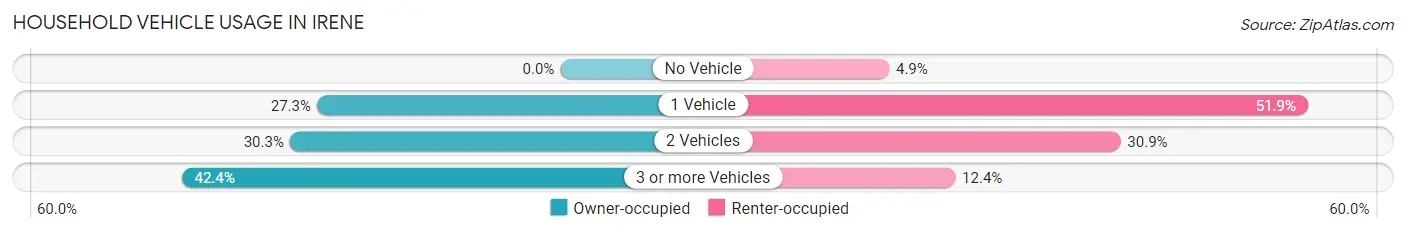
| Vehicles per Household | Owner-occupied | Renter-occupied |
| No Vehicle | 0 (0.0%) | 4 (4.9%) |
| 1 Vehicle | 36 (27.3%) | 42 (51.8%) |
| 2 Vehicles | 40 (30.3%) | 25 (30.9%) |
| 3 or more Vehicles | 56 (42.4%) | 10 (12.3%) |
| Total | 132 (100.0%) | 81 (100.0%) |
Real Estate & Mortgages in Irene
Real Estate and Mortgage Overview in Irene
| Characteristic | Without Mortgage | With Mortgage |
| Housing Units | 62 | 70 |
| Median Property Value | $55,000 | $114,600 |
| Median Household Income | $56,250 | $4 |
| Monthly Housing Costs | $442 | $0 |
| Real Estate Taxes | $1,063 | $3 |
Property Value by Mortgage Status in Irene
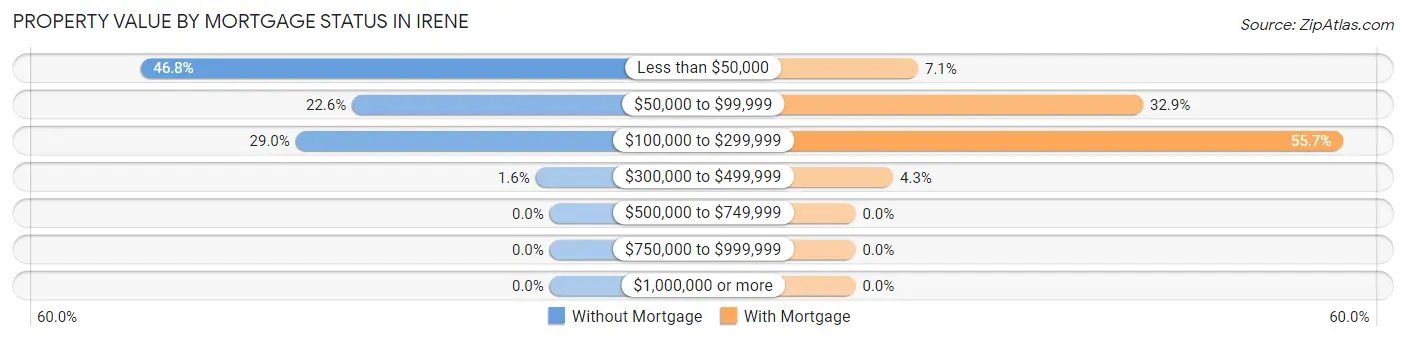
| Property Value | Without Mortgage | With Mortgage |
| Less than $50,000 | 29 (46.8%) | 5 (7.1%) |
| $50,000 to $99,999 | 14 (22.6%) | 23 (32.9%) |
| $100,000 to $299,999 | 18 (29.0%) | 39 (55.7%) |
| $300,000 to $499,999 | 1 (1.6%) | 3 (4.3%) |
| $500,000 to $749,999 | 0 (0.0%) | 0 (0.0%) |
| $750,000 to $999,999 | 0 (0.0%) | 0 (0.0%) |
| $1,000,000 or more | 0 (0.0%) | 0 (0.0%) |
| Total | 62 (100.0%) | 70 (100.0%) |
Household Income by Mortgage Status in Irene
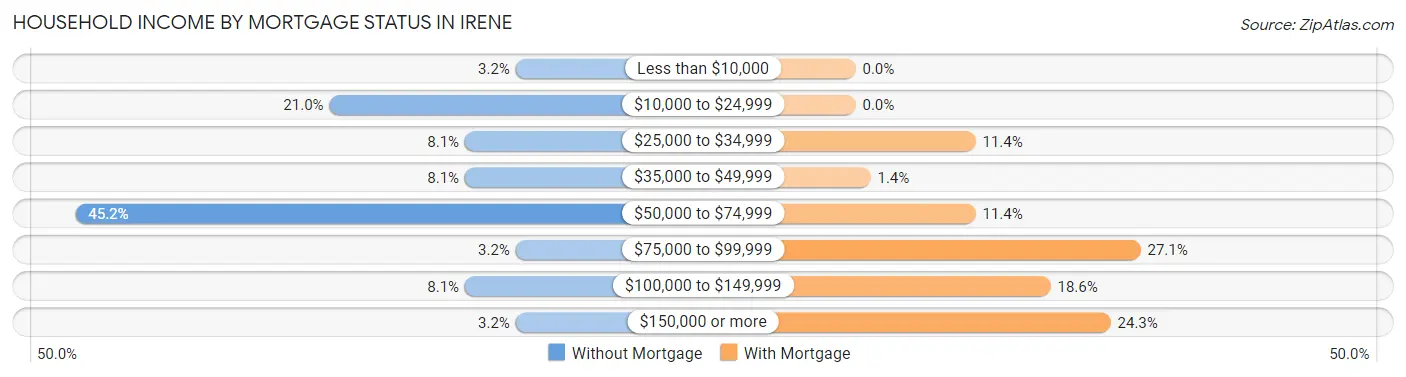
| Household Income | Without Mortgage | With Mortgage |
| Less than $10,000 | 2 (3.2%) | 0 (0.0%) |
| $10,000 to $24,999 | 13 (21.0%) | 0 (0.0%) |
| $25,000 to $34,999 | 5 (8.1%) | 8 (11.4%) |
| $35,000 to $49,999 | 5 (8.1%) | 1 (1.4%) |
| $50,000 to $74,999 | 28 (45.2%) | 8 (11.4%) |
| $75,000 to $99,999 | 2 (3.2%) | 19 (27.1%) |
| $100,000 to $149,999 | 5 (8.1%) | 13 (18.6%) |
| $150,000 or more | 2 (3.2%) | 17 (24.3%) |
| Total | 62 (100.0%) | 70 (100.0%) |
Property Value to Household Income Ratio in Irene
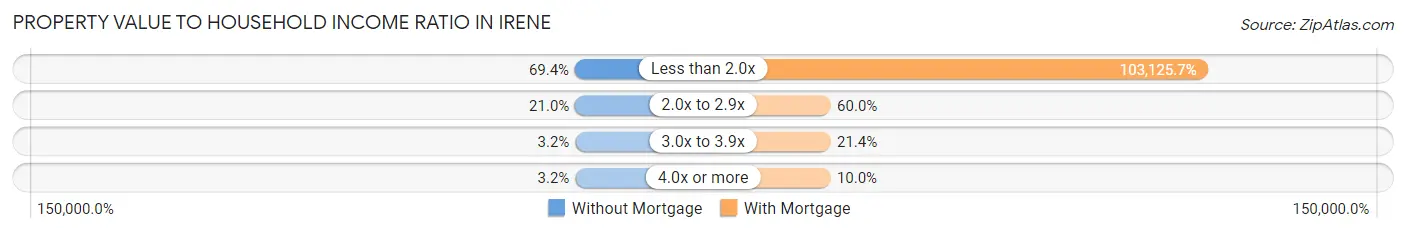
| Value-to-Income Ratio | Without Mortgage | With Mortgage |
| Less than 2.0x | 43 (69.4%) | 72,188 (103,125.7%) |
| 2.0x to 2.9x | 13 (21.0%) | 42 (60.0%) |
| 3.0x to 3.9x | 2 (3.2%) | 15 (21.4%) |
| 4.0x or more | 2 (3.2%) | 7 (10.0%) |
| Total | 62 (100.0%) | 70 (100.0%) |
Real Estate Taxes by Mortgage Status in Irene
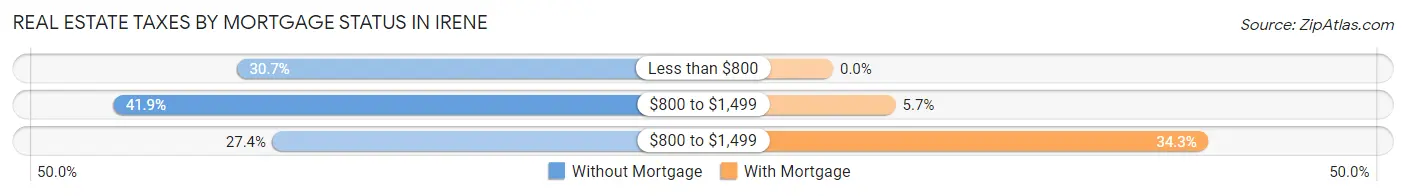
| Property Taxes | Without Mortgage | With Mortgage |
| Less than $800 | 19 (30.6%) | 0 (0.0%) |
| $800 to $1,499 | 26 (41.9%) | 4 (5.7%) |
| $800 to $1,499 | 17 (27.4%) | 24 (34.3%) |
| Total | 62 (100.0%) | 70 (100.0%) |
Health & Disability in Irene
Health Insurance Coverage by Age in Irene
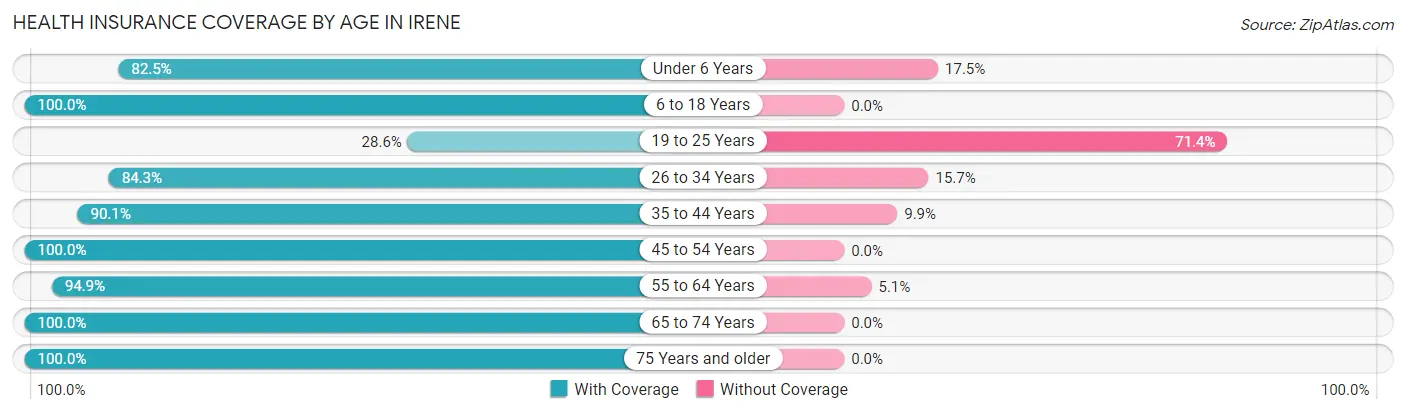
| Age Bracket | With Coverage | Without Coverage |
| Under 6 Years | 33 (82.5%) | 7 (17.5%) |
| 6 to 18 Years | 81 (100.0%) | 0 (0.0%) |
| 19 to 25 Years | 12 (28.6%) | 30 (71.4%) |
| 26 to 34 Years | 59 (84.3%) | 11 (15.7%) |
| 35 to 44 Years | 73 (90.1%) | 8 (9.9%) |
| 45 to 54 Years | 38 (100.0%) | 0 (0.0%) |
| 55 to 64 Years | 56 (94.9%) | 3 (5.1%) |
| 65 to 74 Years | 42 (100.0%) | 0 (0.0%) |
| 75 Years and older | 15 (100.0%) | 0 (0.0%) |
| Total | 409 (87.4%) | 59 (12.6%) |
Health Insurance Coverage by Citizenship Status in Irene
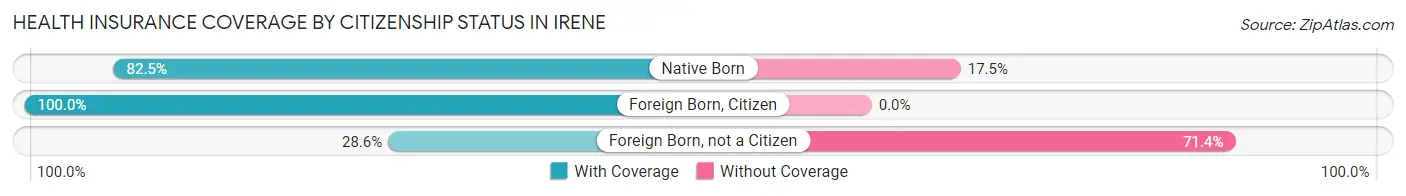
| Citizenship Status | With Coverage | Without Coverage |
| Native Born | 33 (82.5%) | 7 (17.5%) |
| Foreign Born, Citizen | 81 (100.0%) | 0 (0.0%) |
| Foreign Born, not a Citizen | 12 (28.6%) | 30 (71.4%) |
Health Insurance Coverage by Household Income in Irene
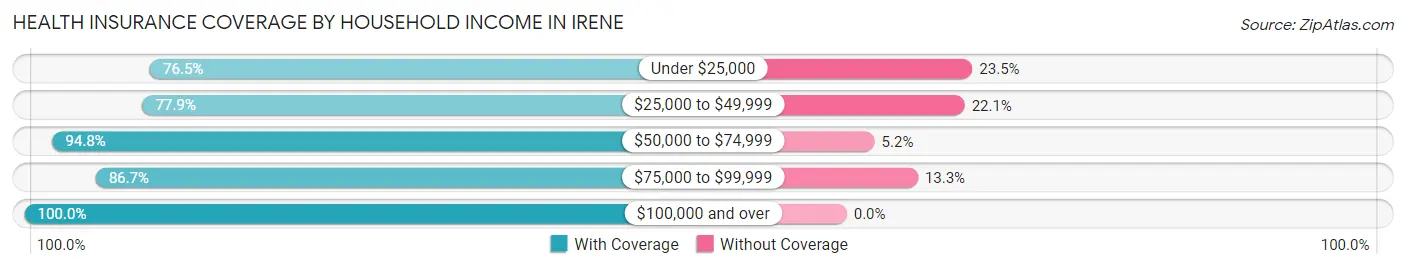
| Household Income | With Coverage | Without Coverage |
| Under $25,000 | 26 (76.5%) | 8 (23.5%) |
| $25,000 to $49,999 | 134 (77.9%) | 38 (22.1%) |
| $50,000 to $74,999 | 127 (94.8%) | 7 (5.2%) |
| $75,000 to $99,999 | 39 (86.7%) | 6 (13.3%) |
| $100,000 and over | 83 (100.0%) | 0 (0.0%) |
Public vs Private Health Insurance Coverage by Age in Irene
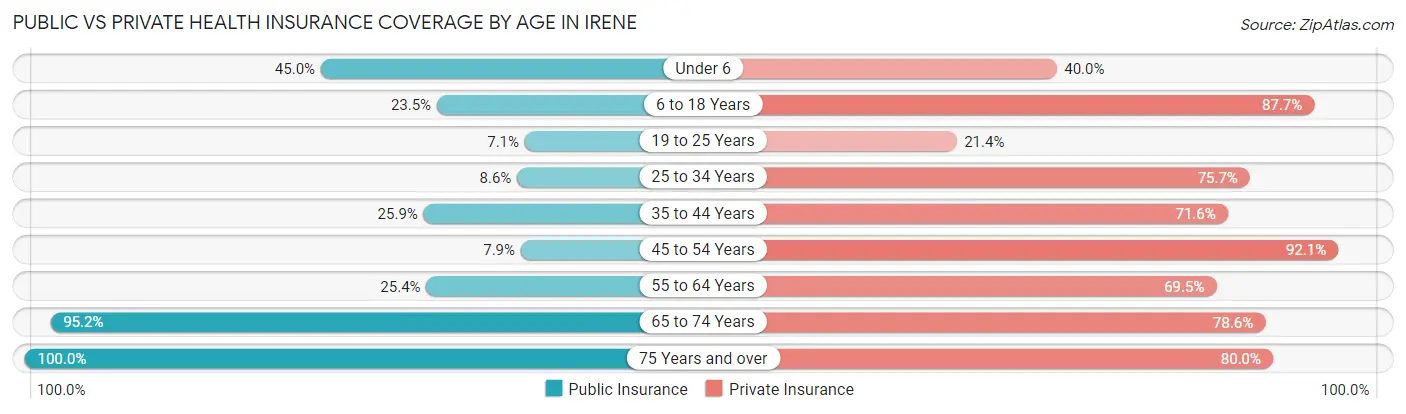
| Age Bracket | Public Insurance | Private Insurance |
| Under 6 | 18 (45.0%) | 16 (40.0%) |
| 6 to 18 Years | 19 (23.5%) | 71 (87.6%) |
| 19 to 25 Years | 3 (7.1%) | 9 (21.4%) |
| 25 to 34 Years | 6 (8.6%) | 53 (75.7%) |
| 35 to 44 Years | 21 (25.9%) | 58 (71.6%) |
| 45 to 54 Years | 3 (7.9%) | 35 (92.1%) |
| 55 to 64 Years | 15 (25.4%) | 41 (69.5%) |
| 65 to 74 Years | 40 (95.2%) | 33 (78.6%) |
| 75 Years and over | 15 (100.0%) | 12 (80.0%) |
| Total | 140 (29.9%) | 328 (70.1%) |
Disability Status by Sex by Age in Irene
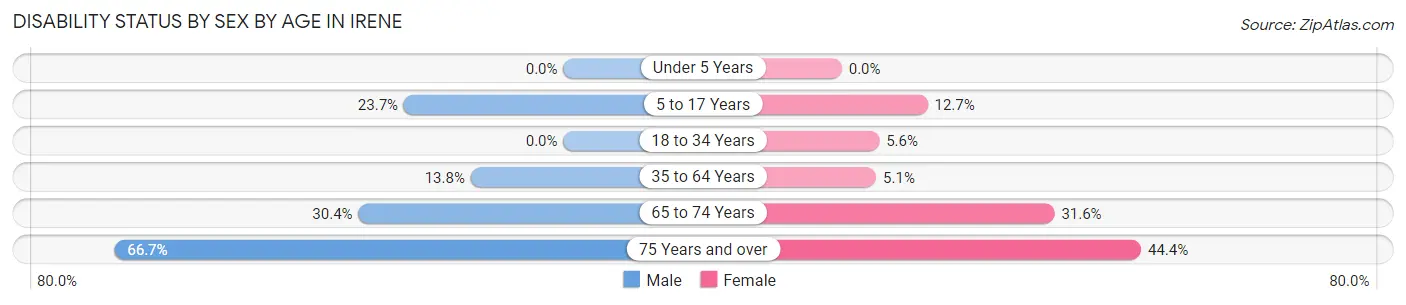
| Age Bracket | Male | Female |
| Under 5 Years | 0 (0.0%) | 0 (0.0%) |
| 5 to 17 Years | 9 (23.7%) | 7 (12.7%) |
| 18 to 34 Years | 0 (0.0%) | 4 (5.6%) |
| 35 to 64 Years | 11 (13.8%) | 5 (5.1%) |
| 65 to 74 Years | 7 (30.4%) | 6 (31.6%) |
| 75 Years and over | 4 (66.7%) | 4 (44.4%) |
Disability Class by Sex by Age in Irene
Disability Class: Hearing Difficulty
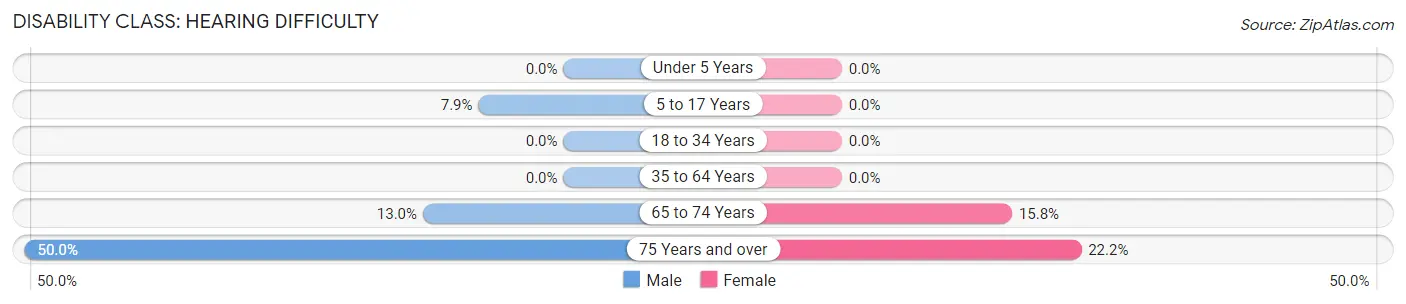
| Age Bracket | Male | Female |
| Under 5 Years | 0 (0.0%) | 0 (0.0%) |
| 5 to 17 Years | 3 (7.9%) | 0 (0.0%) |
| 18 to 34 Years | 0 (0.0%) | 0 (0.0%) |
| 35 to 64 Years | 0 (0.0%) | 0 (0.0%) |
| 65 to 74 Years | 3 (13.0%) | 3 (15.8%) |
| 75 Years and over | 3 (50.0%) | 2 (22.2%) |
Disability Class: Vision Difficulty
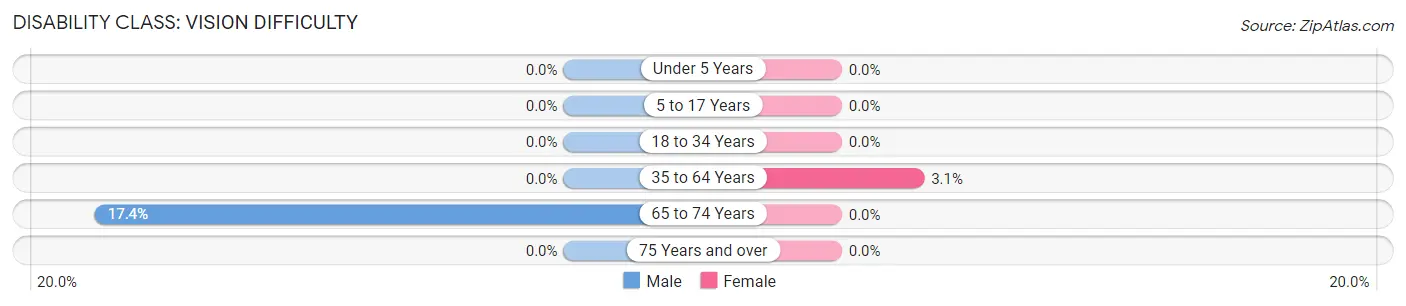
| Age Bracket | Male | Female |
| Under 5 Years | 0 (0.0%) | 0 (0.0%) |
| 5 to 17 Years | 0 (0.0%) | 0 (0.0%) |
| 18 to 34 Years | 0 (0.0%) | 0 (0.0%) |
| 35 to 64 Years | 0 (0.0%) | 3 (3.1%) |
| 65 to 74 Years | 4 (17.4%) | 0 (0.0%) |
| 75 Years and over | 0 (0.0%) | 0 (0.0%) |
Disability Class: Cognitive Difficulty
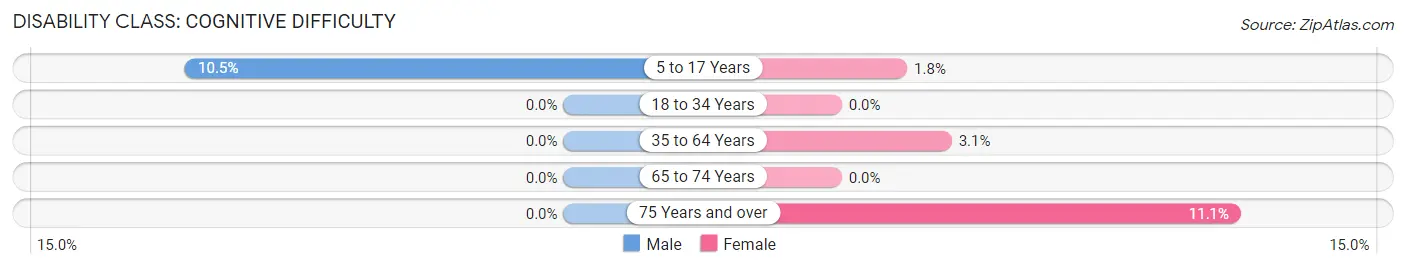
| Age Bracket | Male | Female |
| 5 to 17 Years | 4 (10.5%) | 1 (1.8%) |
| 18 to 34 Years | 0 (0.0%) | 0 (0.0%) |
| 35 to 64 Years | 0 (0.0%) | 3 (3.1%) |
| 65 to 74 Years | 0 (0.0%) | 0 (0.0%) |
| 75 Years and over | 0 (0.0%) | 1 (11.1%) |
Disability Class: Ambulatory Difficulty
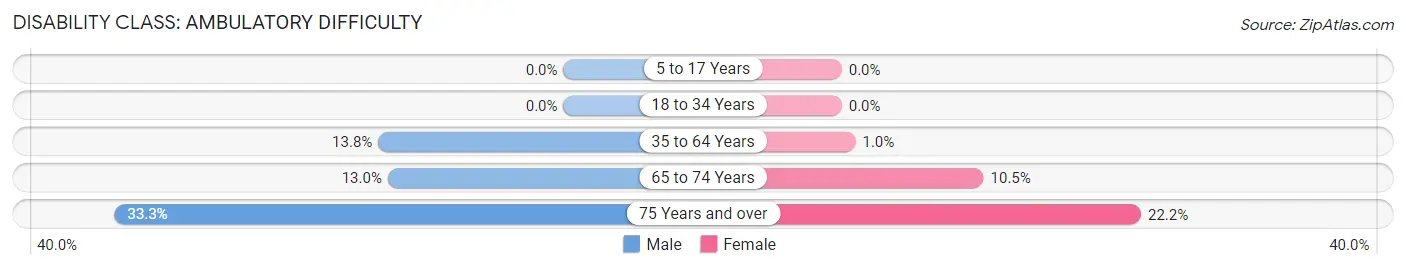
| Age Bracket | Male | Female |
| 5 to 17 Years | 0 (0.0%) | 0 (0.0%) |
| 18 to 34 Years | 0 (0.0%) | 0 (0.0%) |
| 35 to 64 Years | 11 (13.8%) | 1 (1.0%) |
| 65 to 74 Years | 3 (13.0%) | 2 (10.5%) |
| 75 Years and over | 2 (33.3%) | 2 (22.2%) |
Disability Class: Self-Care Difficulty
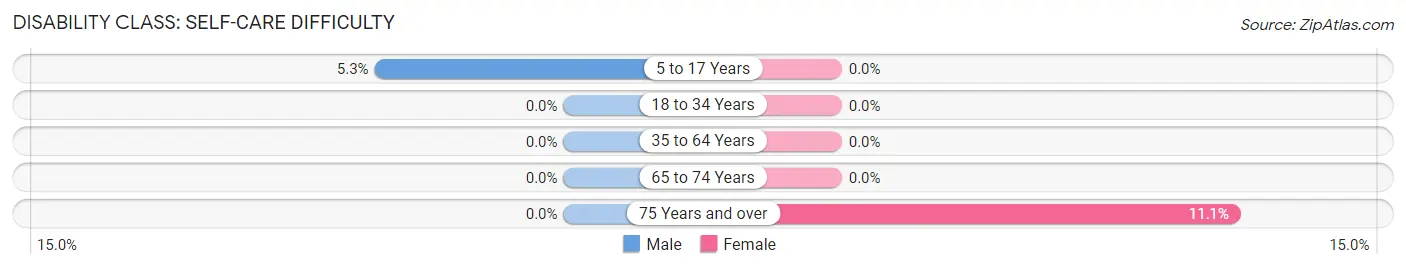
| Age Bracket | Male | Female |
| 5 to 17 Years | 2 (5.3%) | 0 (0.0%) |
| 18 to 34 Years | 0 (0.0%) | 0 (0.0%) |
| 35 to 64 Years | 0 (0.0%) | 0 (0.0%) |
| 65 to 74 Years | 0 (0.0%) | 0 (0.0%) |
| 75 Years and over | 0 (0.0%) | 1 (11.1%) |
Technology Access in Irene
Computing Device Access in Irene
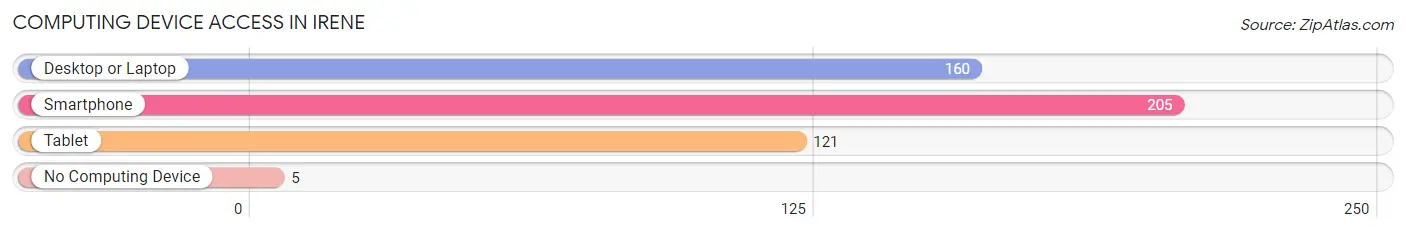
| Device Type | # Households | % Households |
| Desktop or Laptop | 160 | 75.1% |
| Smartphone | 205 | 96.2% |
| Tablet | 121 | 56.8% |
| No Computing Device | 5 | 2.4% |
| Total | 213 | 100.0% |
Internet Access in Irene
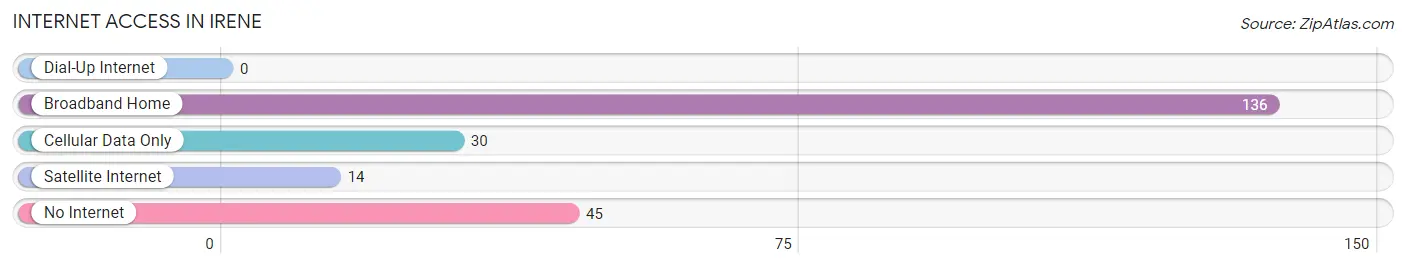
| Internet Type | # Households | % Households |
| Dial-Up Internet | 0 | 0.0% |
| Broadband Home | 136 | 63.8% |
| Cellular Data Only | 30 | 14.1% |
| Satellite Internet | 14 | 6.6% |
| No Internet | 45 | 21.1% |
| Total | 213 | 100.0% |
Irene Summary
Irene is a small town located in the southeastern corner of South Dakota, in the United States. It is situated in the heart of the Great Plains, and is surrounded by rolling hills and prairies. The town is located in the county of Hutchinson, and is part of the Sioux Falls Metropolitan Statistical Area. As of the 2010 census, the population of Irene was 545.
Geography
Irene is located at 43°25'17" North, 96°45'45" West (43.4214, -96.7625). It is situated in the southeastern corner of South Dakota, in the United States. It is situated in the heart of the Great Plains, and is surrounded by rolling hills and prairies. The town is located in the county of Hutchinson, and is part of the Sioux Falls Metropolitan Statistical Area.
The town is situated on the Big Sioux River, which is a tributary of the Missouri River. The Big Sioux River is a popular destination for fishing, canoeing, and kayaking. The town is also located near the Big Sioux Recreation Area, which offers camping, hiking, and other outdoor activities.
Climate
Irene has a humid continental climate, with hot summers and cold winters. The average annual temperature is 48.3°F (9.1°C). The average annual precipitation is 22.3 inches (567 mm).
Demographics
As of the 2010 census, the population of Irene was 545. The racial makeup of the town was 97.3% White, 0.2% African American, 0.2% Native American, 0.2% Asian, 0.4% from other races, and 1.7% from two or more races. Hispanic or Latino of any race were 1.3% of the population.
The median age in Irene was 43.2 years. About 24.3% of residents were under the age of 18; 6.2% were between the ages of 18 and 24; 22.2% were from 25 to 44; 28.2% were from 45 to 64; and 19.1% were 65 years of age or older. The gender makeup of the town was 49.3% male and 50.7% female.
Economy
Irene’s economy is largely based on agriculture. The town is home to several farms, which produce corn, soybeans, wheat, and other crops. The town is also home to several businesses, including a grocery store, a hardware store, a restaurant, and a bank.
The town is also home to several manufacturing companies, including a furniture manufacturer, a plastics manufacturer, and a metal fabrication company. The town is also home to several service-based businesses, including a veterinary clinic, a car dealership, and a construction company.
Conclusion
Irene is a small town located in the southeastern corner of South Dakota, in the United States. It is situated in the heart of the Great Plains, and is surrounded by rolling hills and prairies. The town is located in the county of Hutchinson, and is part of the Sioux Falls Metropolitan Statistical Area. As of the 2010 census, the population of Irene was 545. The town’s economy is largely based on agriculture, and it is also home to several businesses and manufacturing companies.
Common Questions
What is Per Capita Income in Irene?
Per Capita income in Irene is $28,637.
What is the Median Family Income in Irene?
Median Family Income in Irene is $65,417.
What is the Median Household income in Irene?
Median Household Income in Irene is $50,625.
What is Income or Wage Gap in Irene?
Income or Wage Gap in Irene is 25.6%.
Women in Irene earn 74.4 cents for every dollar earned by a man.
What is Inequality or Gini Index in Irene?
Inequality or Gini Index in Irene is 0.39.
What is the Total Population of Irene?
Total Population of Irene is 513.
What is the Total Male Population of Irene?
Total Male Population of Irene is 221.
What is the Total Female Population of Irene?
Total Female Population of Irene is 292.
What is the Ratio of Males per 100 Females in Irene?
There are 75.68 Males per 100 Females in Irene.
What is the Ratio of Females per 100 Males in Irene?
There are 132.13 Females per 100 Males in Irene.
What is the Median Population Age in Irene?
Median Population Age in Irene is 37.0 Years.
What is the Average Family Size in Irene
Average Family Size in Irene is 2.7 People.
What is the Average Household Size in Irene
Average Household Size in Irene is 2.2 People.
How Large is the Labor Force in Irene?
There are 268 People in the Labor Forcein in Irene.
What is the Percentage of People in the Labor Force in Irene?
66.0% of People are in the Labor Force in Irene.