Zip Codes with the Highest Percentage of Population Employed in Accommodation & Food Services in Greer, SC
RELATED REPORTS & OPTIONS
Accommodation & Food Services
Greer
Compare Zip Codes
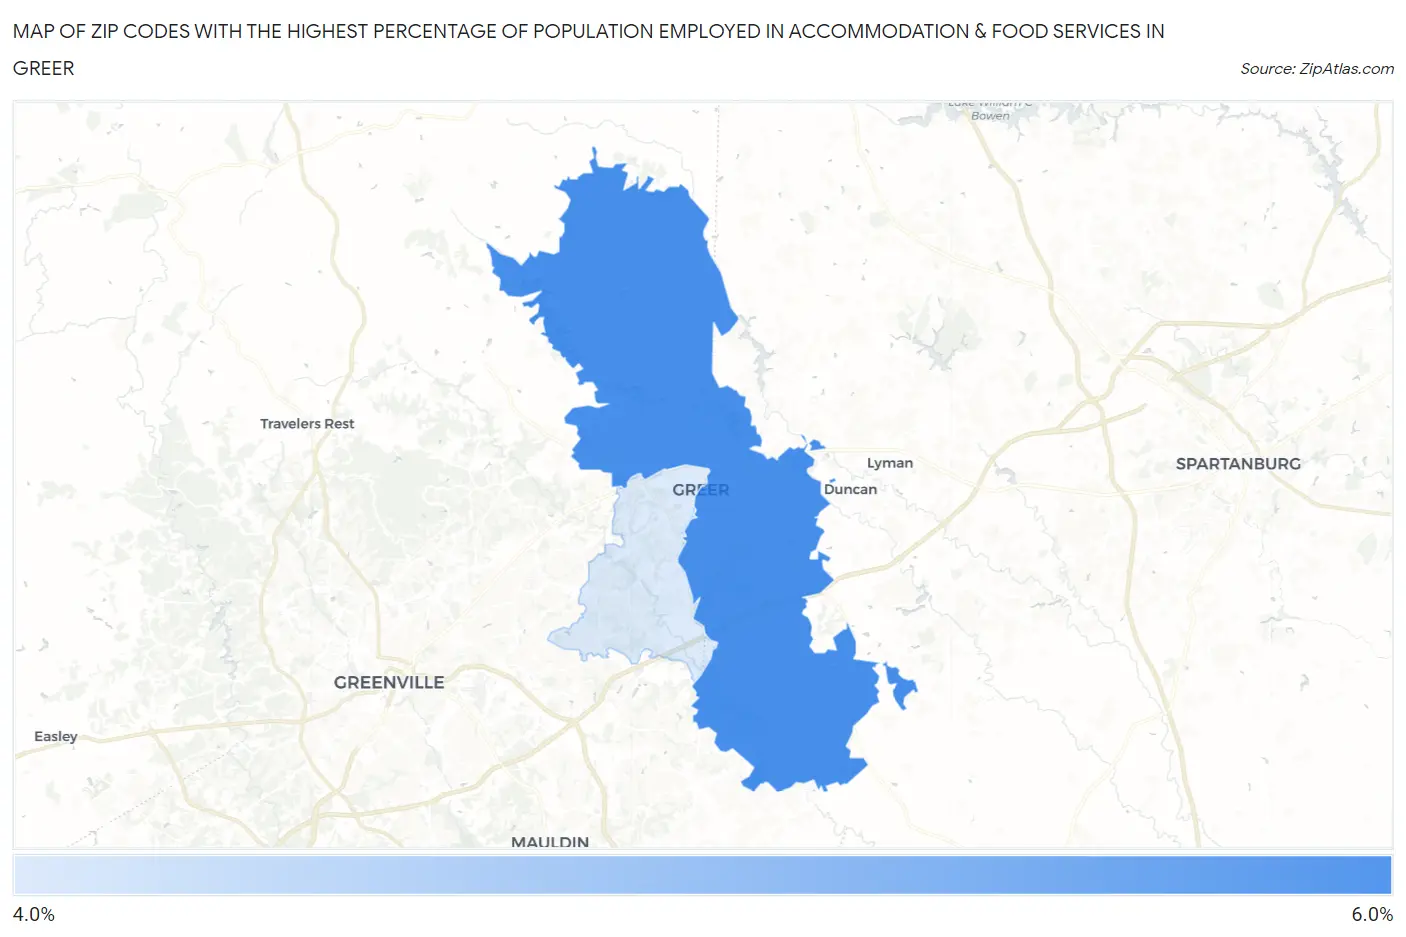
Map of Zip Codes with the Highest Percentage of Population Employed in Accommodation & Food Services in Greer
5.0%
5.4%
Zip Codes with the Highest Percentage of Population Employed in Accommodation & Food Services in Greer, SC
| Zip Code | % Employed | vs State | vs National | |
| 1. | 29651 | 5.4% | 8.0%(-2.61)#258 | 6.9%(-1.52)#15,531 |
| 2. | 29650 | 5.0% | 8.0%(-3.01)#273 | 6.9%(-1.92)#16,961 |
1
Common Questions
What are the Top Zip Codes with the Highest Percentage of Population Employed in Accommodation & Food Services in Greer, SC?
Top Zip Codes with the Highest Percentage of Population Employed in Accommodation & Food Services in Greer, SC are:
What zip code has the Highest Percentage of Population Employed in Accommodation & Food Services in Greer, SC?
29651 has the Highest Percentage of Population Employed in Accommodation & Food Services in Greer, SC with 5.4%.
What is the Percentage of Population Employed in Accommodation & Food Services in Greer, SC?
Percentage of Population Employed in Accommodation & Food Services in Greer is 6.5%.
What is the Percentage of Population Employed in Accommodation & Food Services in South Carolina?
Percentage of Population Employed in Accommodation & Food Services in South Carolina is 8.0%.
What is the Percentage of Population Employed in Accommodation & Food Services in the United States?
Percentage of Population Employed in Accommodation & Food Services in the United States is 6.9%.