Harrisville, RI Map & Demographics
Harrisville Map
Harrisville Overview
$38,447
PER CAPITA INCOME
$123,654
AVG FAMILY INCOME
$62,750
AVG HOUSEHOLD INCOME
4.8%
WAGE / INCOME GAP [ % ]
95.2¢/ $1
WAGE / INCOME GAP [ $ ]
0.45
INEQUALITY / GINI INDEX
1,515
TOTAL POPULATION
426
MALE POPULATION
1,089
FEMALE POPULATION
39.12
MALES / 100 FEMALES
255.63
FEMALES / 100 MALES
52.2
MEDIAN AGE
3.2
AVG FAMILY SIZE
1.9
AVG HOUSEHOLD SIZE
791
LABOR FORCE [ PEOPLE ]
63.6%
PERCENT IN LABOR FORCE
5.7%
UNEMPLOYMENT RATE
Harrisville Zip Codes
Harrisville Area Codes
Income in Harrisville
Income Overview in Harrisville
Per Capita Income in Harrisville is $38,447, while median incomes of families and households are $123,654 and $62,750 respectively.
| Characteristic | Number | Measure |
| Per Capita Income | 1,515 | $38,447 |
| Median Family Income | 298 | $123,654 |
| Mean Family Income | 298 | $126,546 |
| Median Household Income | 787 | $62,750 |
| Mean Household Income | 787 | $73,115 |
| Income Deficit | 298 | $0 |
| Wage / Income Gap (%) | 1,515 | 4.82% |
| Wage / Income Gap ($) | 1,515 | 95.18¢ per $1 |
| Gini / Inequality Index | 1,515 | 0.45 |
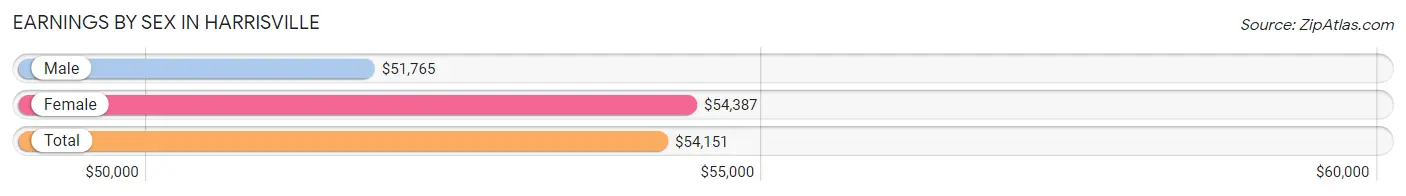
Earnings by Sex in Harrisville
Average Earnings in Harrisville are $54,151, $51,765 for men and $54,387 for women, a difference of 4.8%.
| Sex | Number | Average Earnings |
| Male | 334 (43.7%) | $51,765 |
| Female | 430 (56.3%) | $54,387 |
| Total | 764 (100.0%) | $54,151 |
Earnings by Sex by Income Bracket in Harrisville
The most common earnings brackets in Harrisville are $100,000+ for men (91 | 27.3%) and $65,000 to $74,999 for women (89 | 20.7%).

| Income | Male | Female |
| $2,499 or less | 18 (5.4%) | 0 (0.0%) |
| $2,500 to $4,999 | 0 (0.0%) | 0 (0.0%) |
| $5,000 to $7,499 | 16 (4.8%) | 0 (0.0%) |
| $7,500 to $9,999 | 0 (0.0%) | 0 (0.0%) |
| $10,000 to $12,499 | 0 (0.0%) | 0 (0.0%) |
| $12,500 to $14,999 | 0 (0.0%) | 0 (0.0%) |
| $15,000 to $17,499 | 0 (0.0%) | 16 (3.7%) |
| $17,500 to $19,999 | 0 (0.0%) | 0 (0.0%) |
| $20,000 to $22,499 | 0 (0.0%) | 0 (0.0%) |
| $22,500 to $24,999 | 0 (0.0%) | 0 (0.0%) |
| $25,000 to $29,999 | 32 (9.6%) | 16 (3.7%) |
| $30,000 to $34,999 | 0 (0.0%) | 84 (19.5%) |
| $35,000 to $39,999 | 43 (12.9%) | 0 (0.0%) |
| $40,000 to $44,999 | 46 (13.8%) | 0 (0.0%) |
| $45,000 to $49,999 | 0 (0.0%) | 59 (13.7%) |
| $50,000 to $54,999 | 17 (5.1%) | 53 (12.3%) |
| $55,000 to $64,999 | 30 (9.0%) | 26 (6.0%) |
| $65,000 to $74,999 | 17 (5.1%) | 89 (20.7%) |
| $75,000 to $99,999 | 24 (7.2%) | 71 (16.5%) |
| $100,000+ | 91 (27.3%) | 16 (3.7%) |
| Total | 334 (100.0%) | 430 (100.0%) |
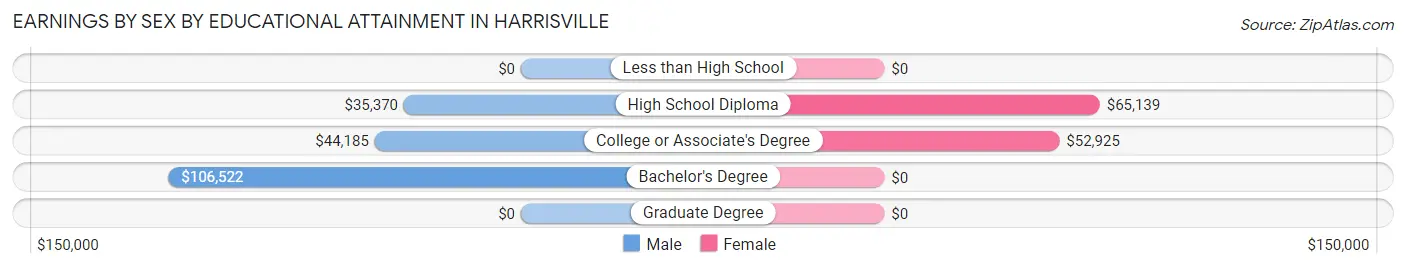
Earnings by Sex by Educational Attainment in Harrisville
Average earnings in Harrisville are $62,750 for men and $54,033 for women, a difference of 13.9%. Men with an educational attainment of bachelor's degree enjoy the highest average annual earnings of $106,522, while those with high school diploma education earn the least with $35,370. Women with an educational attainment of high school diploma earn the most with the average annual earnings of $65,139, while those with college or associate's degree education have the smallest earnings of $52,925.
| Educational Attainment | Male Income | Female Income |
| Less than High School | - | - |
| High School Diploma | $35,370 | $65,139 |
| College or Associate's Degree | $44,185 | $52,925 |
| Bachelor's Degree | $106,522 | $0 |
| Graduate Degree | - | - |
| Total | $62,750 | $54,033 |
Family Income in Harrisville
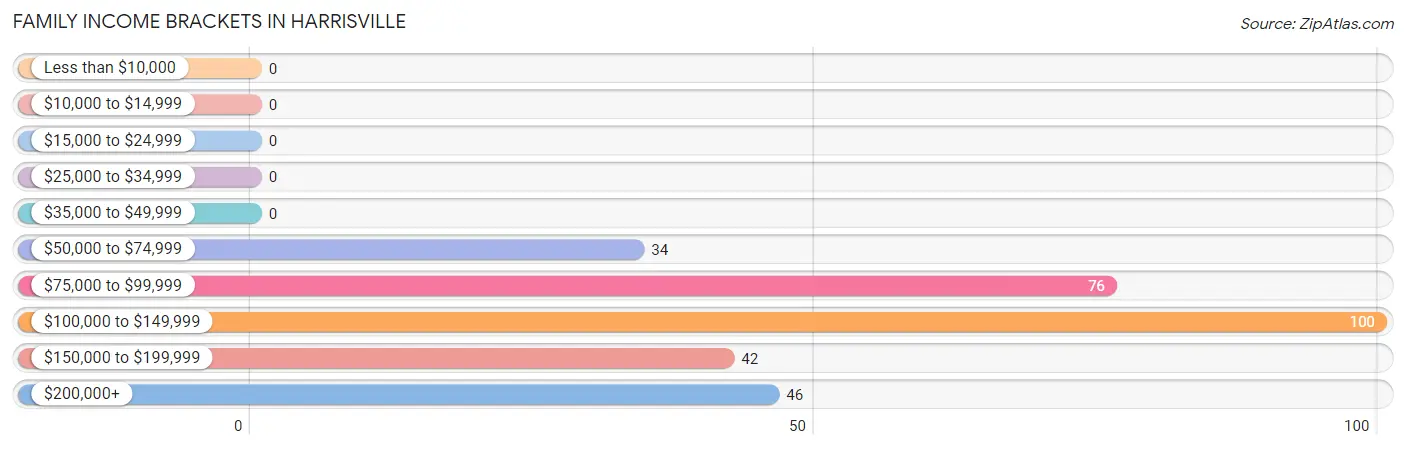
Family Income Brackets in Harrisville
According to the Harrisville family income data, there are 100 families falling into the $100,000 to $149,999 income range, which is the most common income bracket and makes up 33.6% of all families.
| Income Bracket | # Families | % Families |
| Less than $10,000 | 0 | 0.0% |
| $10,000 to $14,999 | 0 | 0.0% |
| $15,000 to $24,999 | 0 | 0.0% |
| $25,000 to $34,999 | 0 | 0.0% |
| $35,000 to $49,999 | 0 | 0.0% |
| $50,000 to $74,999 | 34 | 11.4% |
| $75,000 to $99,999 | 76 | 25.5% |
| $100,000 to $149,999 | 100 | 33.6% |
| $150,000 to $199,999 | 42 | 14.1% |
| $200,000+ | 46 | 15.4% |
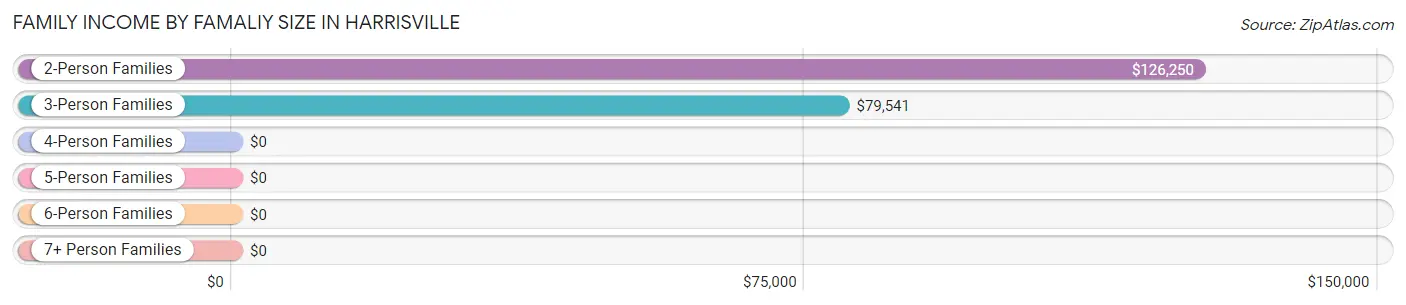
Family Income by Famaliy Size in Harrisville
2-person families (152 | 51.0%) account for the highest median family income in Harrisville with $126,250 per family, while 2-person families (152 | 51.0%) have the highest median income of $63,125 per family member.
| Income Bracket | # Families | Median Income |
| 2-Person Families | 152 (51.0%) | $126,250 |
| 3-Person Families | 80 (26.9%) | $79,541 |
| 4-Person Families | 28 (9.4%) | $0 |
| 5-Person Families | 0 (0.0%) | $0 |
| 6-Person Families | 0 (0.0%) | $0 |
| 7+ Person Families | 38 (12.8%) | $0 |
| Total | 298 (100.0%) | $123,654 |
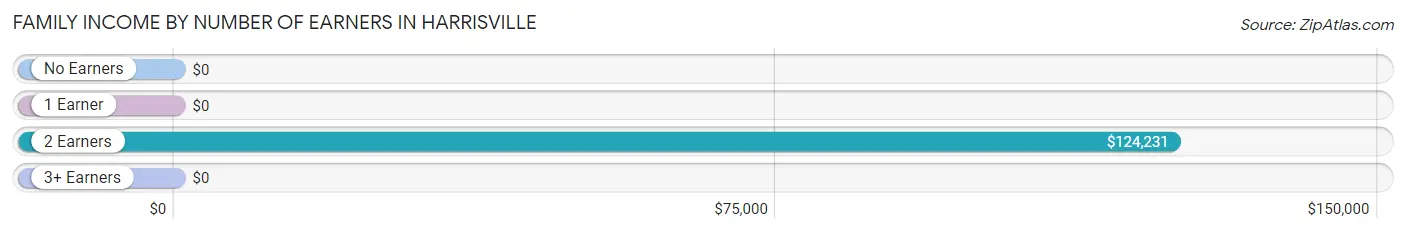
Family Income by Number of Earners in Harrisville
| Number of Earners | # Families | Median Income |
| No Earners | 0 (0.0%) | $0 |
| 1 Earner | 82 (27.5%) | $0 |
| 2 Earners | 216 (72.5%) | $124,231 |
| 3+ Earners | 0 (0.0%) | $0 |
| Total | 298 (100.0%) | $123,654 |
Household Income in Harrisville
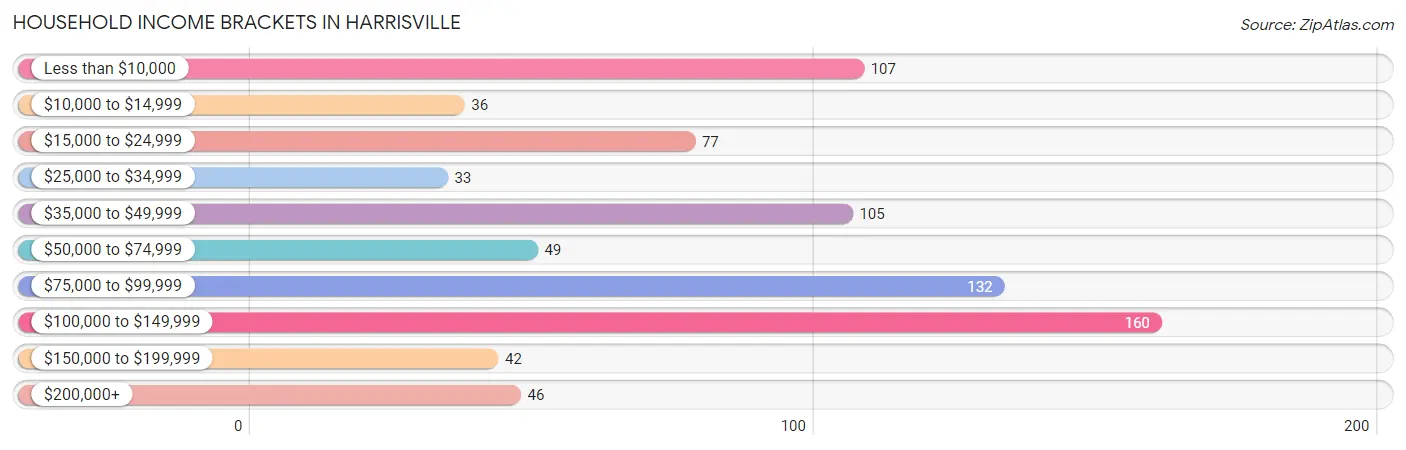
Household Income Brackets in Harrisville
With 160 households falling in the category, the $100,000 to $149,999 income range is the most frequent in Harrisville, accounting for 20.3% of all households. In contrast, only 33 households (4.2%) fall into the $25,000 to $34,999 income bracket, making it the least populous group.
| Income Bracket | # Households | % Households |
| Less than $10,000 | 107 | 13.6% |
| $10,000 to $14,999 | 36 | 4.6% |
| $15,000 to $24,999 | 77 | 9.8% |
| $25,000 to $34,999 | 33 | 4.2% |
| $35,000 to $49,999 | 105 | 13.3% |
| $50,000 to $74,999 | 49 | 6.2% |
| $75,000 to $99,999 | 132 | 16.8% |
| $100,000 to $149,999 | 160 | 20.3% |
| $150,000 to $199,999 | 42 | 5.3% |
| $200,000+ | 46 | 5.8% |
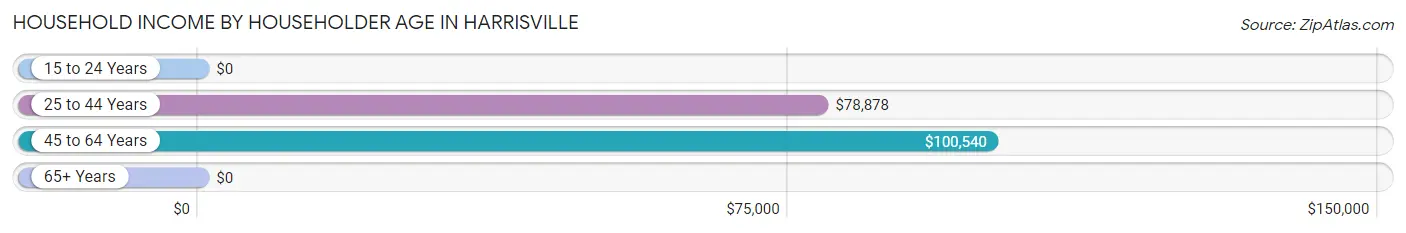
Household Income by Householder Age in Harrisville
The median household income in Harrisville is $62,750, with the highest median household income of $100,540 found in the 45 to 64 years age bracket for the primary householder. A total of 247 households (31.4%) fall into this category. Meanwhile, the 15 to 24 years age bracket for the primary householder has the lowest median household income of $0, with 15 households (1.9%) in this group.
| Income Bracket | # Households | Median Income |
| 15 to 24 Years | 15 (1.9%) | $0 |
| 25 to 44 Years | 186 (23.6%) | $78,878 |
| 45 to 64 Years | 247 (31.4%) | $100,540 |
| 65+ Years | 339 (43.1%) | $0 |
| Total | 787 (100.0%) | $62,750 |
Poverty in Harrisville
Income Below Poverty by Sex and Age in Harrisville
With 7.0% poverty level for males and 11.8% for females among the residents of Harrisville, 75 year old and over males and 75 year old and over females are the most vulnerable to poverty, with 14 males (29.2%) and 77 females (51.0%) in their respective age groups living below the poverty level.
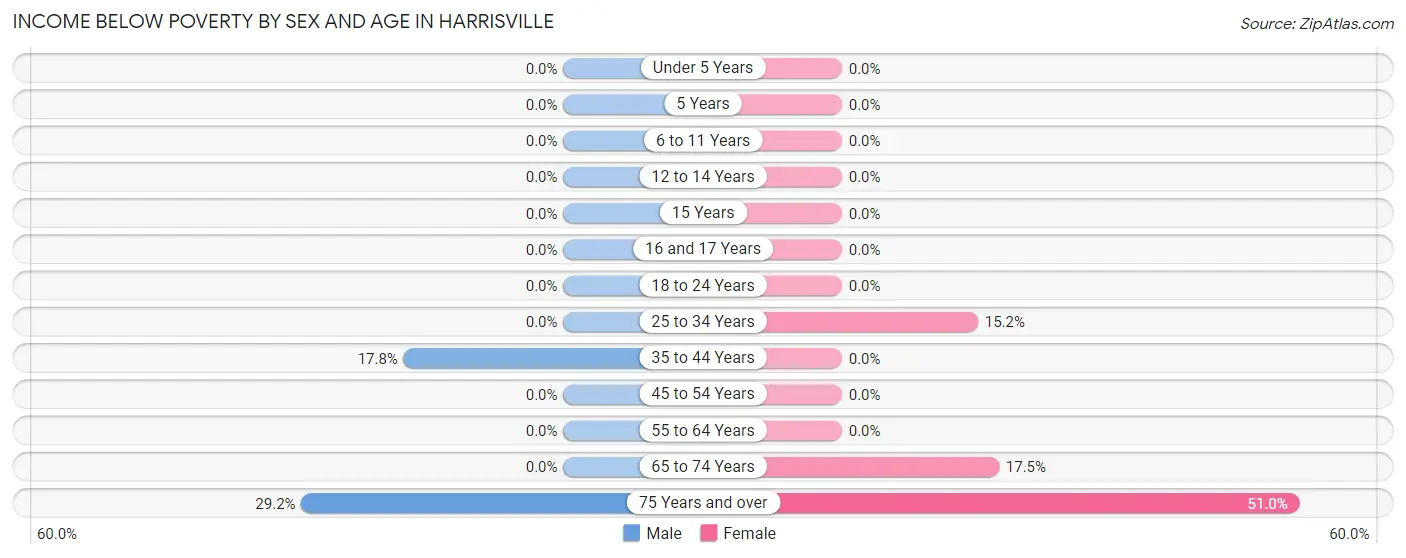
| Age Bracket | Male | Female |
| Under 5 Years | 0 (0.0%) | 0 (0.0%) |
| 5 Years | 0 (0.0%) | 0 (0.0%) |
| 6 to 11 Years | 0 (0.0%) | 0 (0.0%) |
| 12 to 14 Years | 0 (0.0%) | 0 (0.0%) |
| 15 Years | 0 (0.0%) | 0 (0.0%) |
| 16 and 17 Years | 0 (0.0%) | 0 (0.0%) |
| 18 to 24 Years | 0 (0.0%) | 0 (0.0%) |
| 25 to 34 Years | 0 (0.0%) | 20 (15.1%) |
| 35 to 44 Years | 16 (17.8%) | 0 (0.0%) |
| 45 to 54 Years | 0 (0.0%) | 0 (0.0%) |
| 55 to 64 Years | 0 (0.0%) | 0 (0.0%) |
| 65 to 74 Years | 0 (0.0%) | 32 (17.5%) |
| 75 Years and over | 14 (29.2%) | 77 (51.0%) |
| Total | 30 (7.0%) | 129 (11.8%) |
Income Above Poverty by Sex and Age in Harrisville
According to the poverty statistics in Harrisville, males aged 5 years and females aged under 5 years are the age groups that are most secure financially, with 100.0% of males and 100.0% of females in these age groups living above the poverty line.
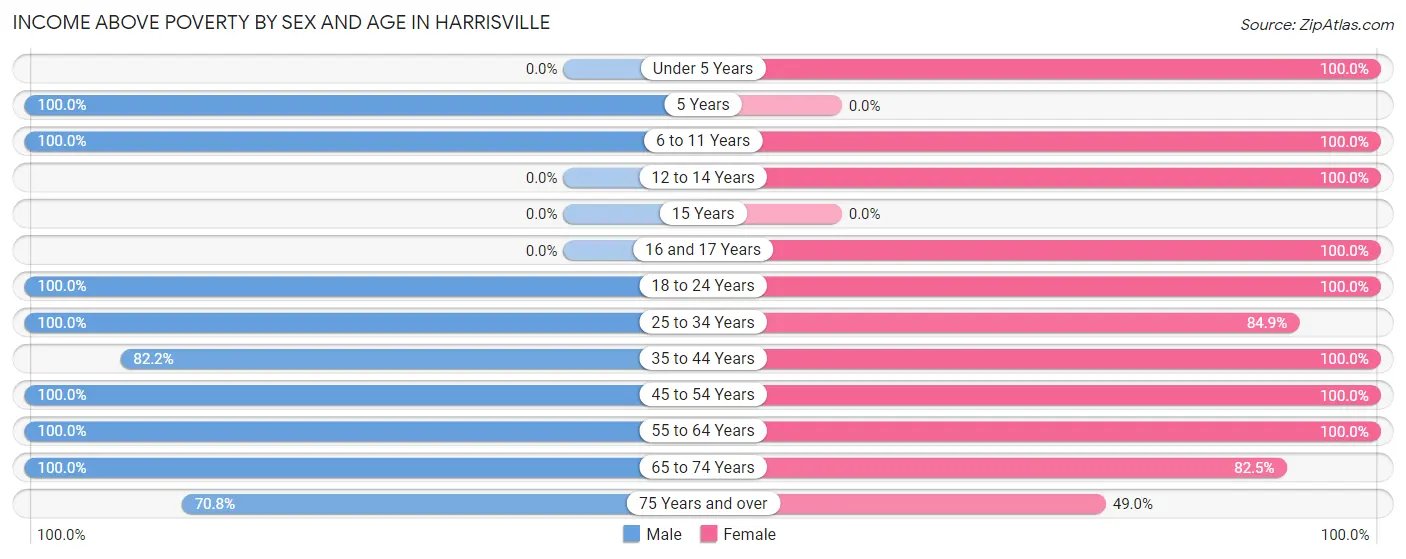
| Age Bracket | Male | Female |
| Under 5 Years | 0 (0.0%) | 61 (100.0%) |
| 5 Years | 14 (100.0%) | 0 (0.0%) |
| 6 to 11 Years | 30 (100.0%) | 109 (100.0%) |
| 12 to 14 Years | 0 (0.0%) | 58 (100.0%) |
| 15 Years | 0 (0.0%) | 0 (0.0%) |
| 16 and 17 Years | 0 (0.0%) | 45 (100.0%) |
| 18 to 24 Years | 16 (100.0%) | 15 (100.0%) |
| 25 to 34 Years | 42 (100.0%) | 112 (84.9%) |
| 35 to 44 Years | 74 (82.2%) | 28 (100.0%) |
| 45 to 54 Years | 112 (100.0%) | 101 (100.0%) |
| 55 to 64 Years | 14 (100.0%) | 206 (100.0%) |
| 65 to 74 Years | 60 (100.0%) | 151 (82.5%) |
| 75 Years and over | 34 (70.8%) | 74 (49.0%) |
| Total | 396 (93.0%) | 960 (88.1%) |
Income Below Poverty Among Married-Couple Families in Harrisville
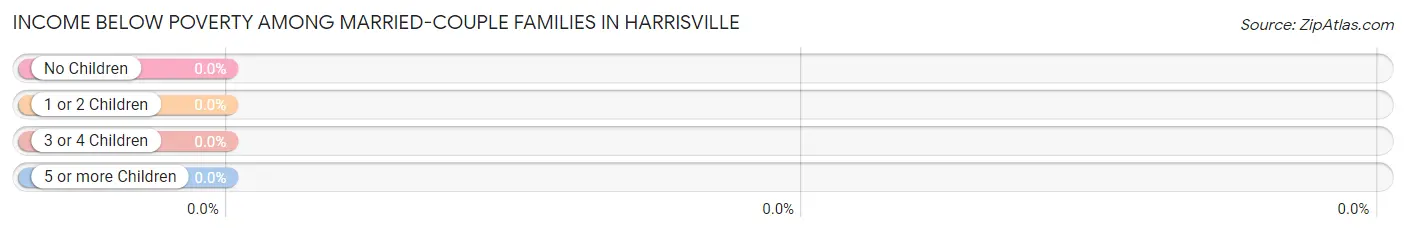
| Children | Above Poverty | Below Poverty |
| No Children | 118 (100.0%) | 0 (0.0%) |
| 1 or 2 Children | 108 (100.0%) | 0 (0.0%) |
| 3 or 4 Children | 38 (100.0%) | 0 (0.0%) |
| 5 or more Children | 0 (0.0%) | 0 (0.0%) |
| Total | 264 (100.0%) | 0 (0.0%) |
Income Below Poverty Among Single-Parent Households in Harrisville
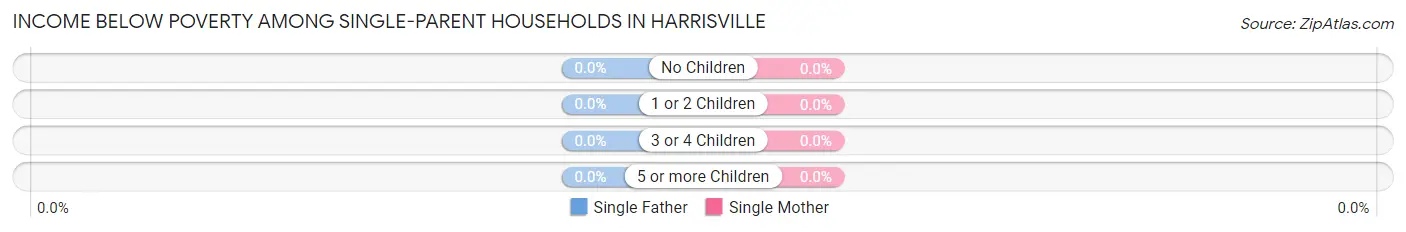
| Children | Single Father | Single Mother |
| No Children | 0 (0.0%) | 0 (0.0%) |
| 1 or 2 Children | 0 (0.0%) | 0 (0.0%) |
| 3 or 4 Children | 0 (0.0%) | 0 (0.0%) |
| 5 or more Children | 0 (0.0%) | 0 (0.0%) |
| Total | 0 (0.0%) | 0 (0.0%) |
Income Below Poverty Among Married-Couple vs Single-Parent Households in Harrisville
| Children | Married-Couple Families | Single-Parent Households |
| No Children | 0 (0.0%) | 0 (0.0%) |
| 1 or 2 Children | 0 (0.0%) | 0 (0.0%) |
| 3 or 4 Children | 0 (0.0%) | 0 (0.0%) |
| 5 or more Children | 0 (0.0%) | 0 (0.0%) |
| Total | 0 (0.0%) | 0 (0.0%) |
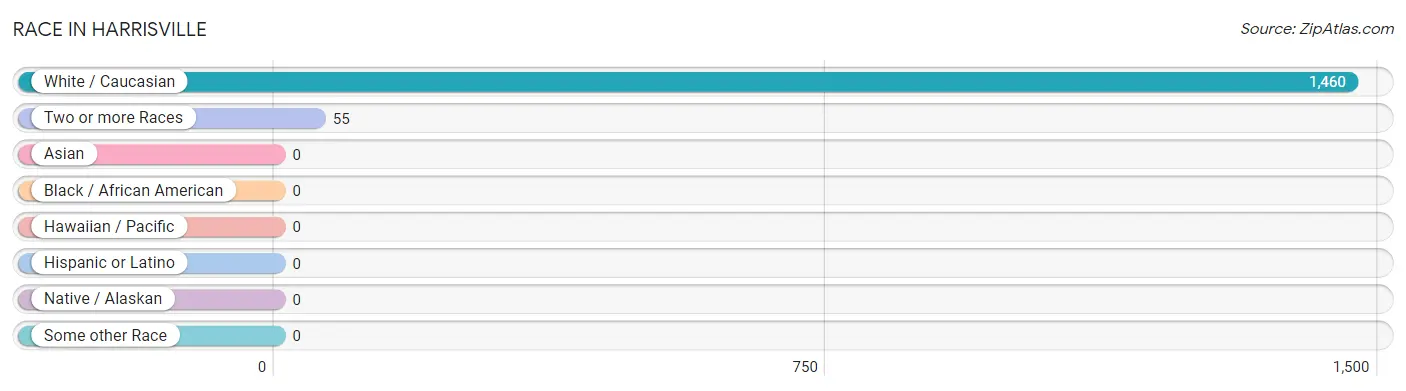
Race in Harrisville
The most populous races in Harrisville are White / Caucasian (1,460 | 96.4%), and Two or more Races (55 | 3.6%).
| Race | # Population | % Population |
| Asian | 0 | 0.0% |
| Black / African American | 0 | 0.0% |
| Hawaiian / Pacific | 0 | 0.0% |
| Hispanic or Latino | 0 | 0.0% |
| Native / Alaskan | 0 | 0.0% |
| White / Caucasian | 1,460 | 96.4% |
| Two or more Races | 55 | 3.6% |
| Some other Race | 0 | 0.0% |
| Total | 1,515 | 100.0% |
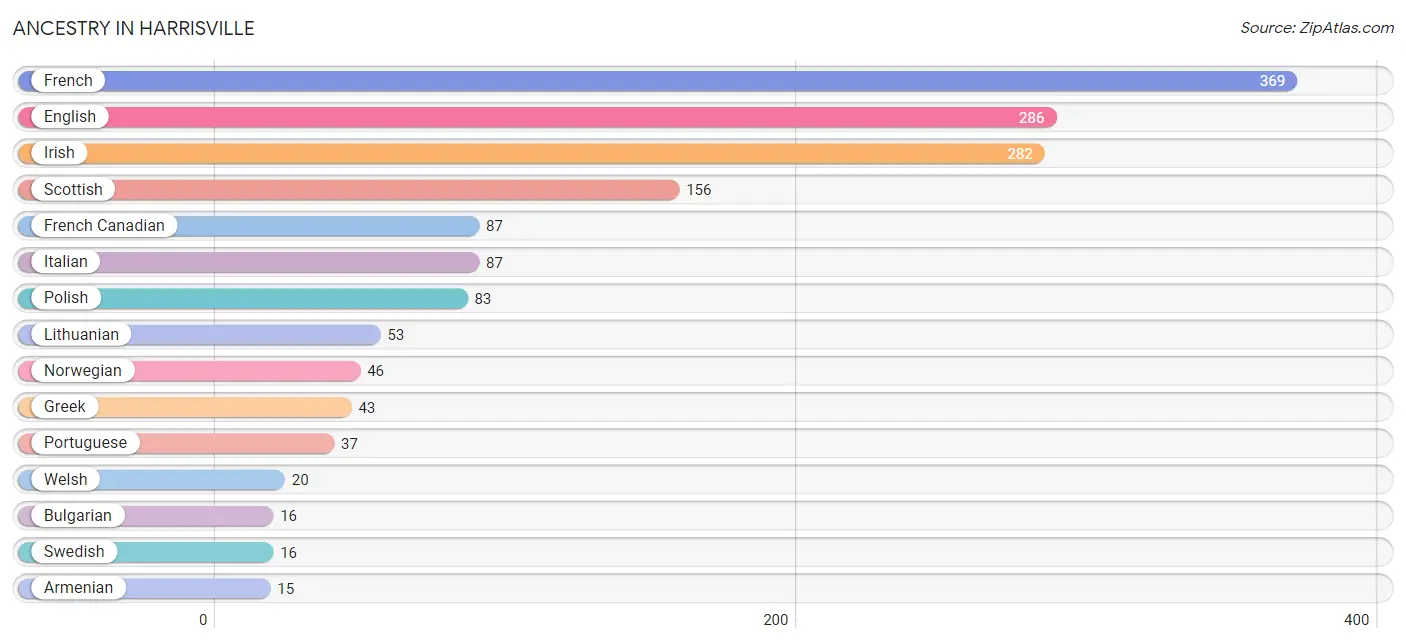
Ancestry in Harrisville
The most populous ancestries reported in Harrisville are French (369 | 24.4%), English (286 | 18.9%), Irish (282 | 18.6%), Scottish (156 | 10.3%), and French Canadian (87 | 5.7%), together accounting for 77.9% of all Harrisville residents.
| Ancestry | # Population | % Population |
| Armenian | 15 | 1.0% |
| Bulgarian | 16 | 1.1% |
| English | 286 | 18.9% |
| French | 369 | 24.4% |
| French Canadian | 87 | 5.7% |
| Greek | 43 | 2.8% |
| Irish | 282 | 18.6% |
| Italian | 87 | 5.7% |
| Korean | 15 | 1.0% |
| Lithuanian | 53 | 3.5% |
| Norwegian | 46 | 3.0% |
| Polish | 83 | 5.5% |
| Portuguese | 37 | 2.4% |
| Russian | 15 | 1.0% |
| Scottish | 156 | 10.3% |
| Swedish | 16 | 1.1% |
| Welsh | 20 | 1.3% | View All 17 Rows |
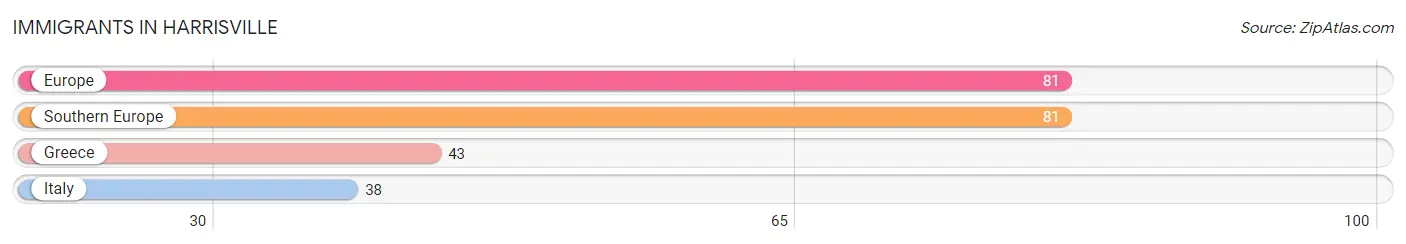
Immigrants in Harrisville
The most numerous immigrant groups reported in Harrisville came from Europe (81 | 5.3%), Southern Europe (81 | 5.3%), Greece (43 | 2.8%), and Italy (38 | 2.5%), together accounting for 16.1% of all Harrisville residents.
| Immigration Origin | # Population | % Population |
| Europe | 81 | 5.3% |
| Greece | 43 | 2.8% |
| Italy | 38 | 2.5% |
| Southern Europe | 81 | 5.3% | View All 4 Rows |
Sex and Age in Harrisville
Sex and Age in Harrisville
The most populous age groups in Harrisville are 35 to 39 Years (75 | 17.6%) for men and 60 to 64 Years (162 | 14.9%) for women.
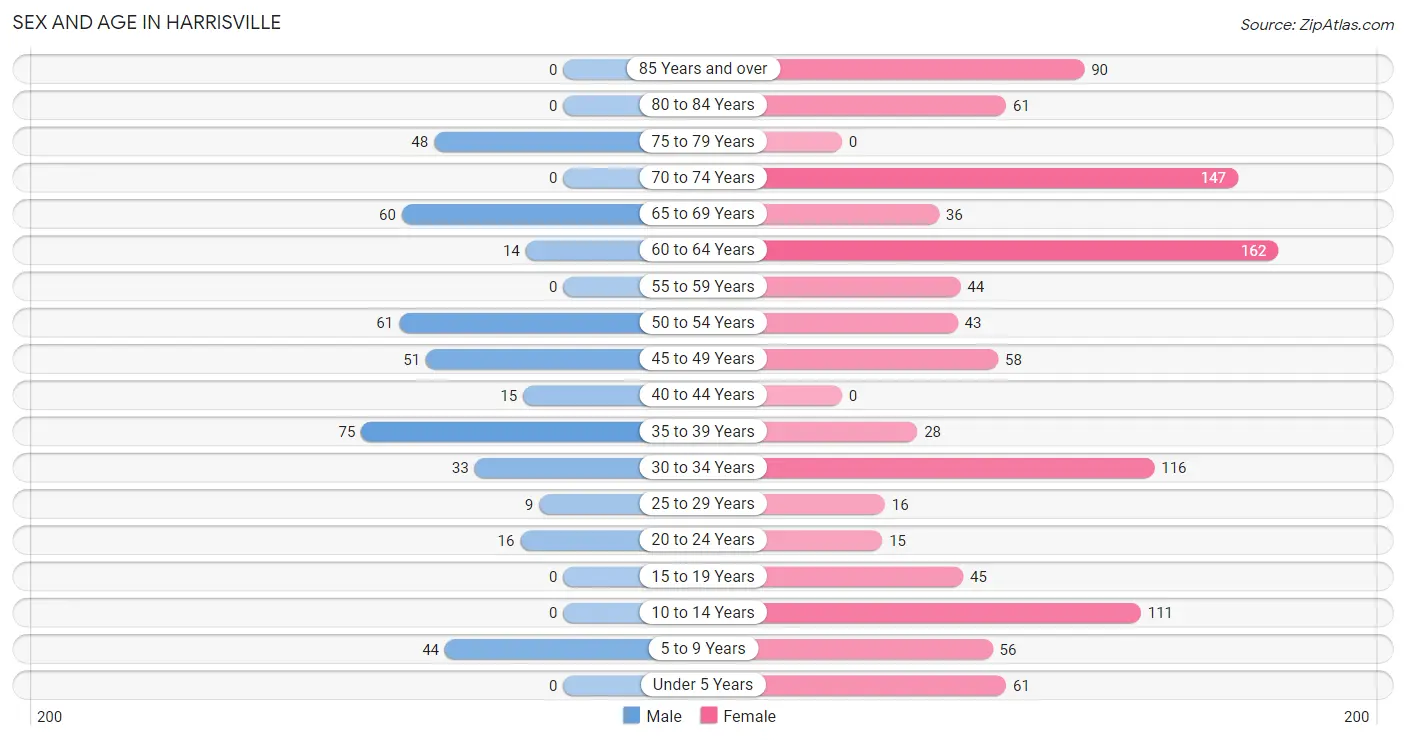
| Age Bracket | Male | Female |
| Under 5 Years | 0 (0.0%) | 61 (5.6%) |
| 5 to 9 Years | 44 (10.3%) | 56 (5.1%) |
| 10 to 14 Years | 0 (0.0%) | 111 (10.2%) |
| 15 to 19 Years | 0 (0.0%) | 45 (4.1%) |
| 20 to 24 Years | 16 (3.8%) | 15 (1.4%) |
| 25 to 29 Years | 9 (2.1%) | 16 (1.5%) |
| 30 to 34 Years | 33 (7.7%) | 116 (10.6%) |
| 35 to 39 Years | 75 (17.6%) | 28 (2.6%) |
| 40 to 44 Years | 15 (3.5%) | 0 (0.0%) |
| 45 to 49 Years | 51 (12.0%) | 58 (5.3%) |
| 50 to 54 Years | 61 (14.3%) | 43 (4.0%) |
| 55 to 59 Years | 0 (0.0%) | 44 (4.0%) |
| 60 to 64 Years | 14 (3.3%) | 162 (14.9%) |
| 65 to 69 Years | 60 (14.1%) | 36 (3.3%) |
| 70 to 74 Years | 0 (0.0%) | 147 (13.5%) |
| 75 to 79 Years | 48 (11.3%) | 0 (0.0%) |
| 80 to 84 Years | 0 (0.0%) | 61 (5.6%) |
| 85 Years and over | 0 (0.0%) | 90 (8.3%) |
| Total | 426 (100.0%) | 1,089 (100.0%) |
Families and Households in Harrisville
Median Family Size in Harrisville
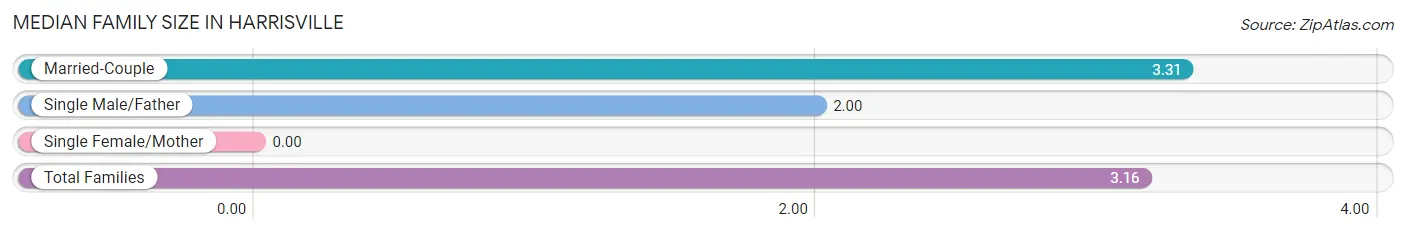
| Family Type | # Families | Family Size |
| Married-Couple | 264 (88.6%) | 3.31 |
| Single Male/Father | 34 (11.4%) | 2.00 |
| Single Female/Mother | 0 (0.0%) | - |
| Total Families | 298 (100.0%) | 3.16 |
Median Household Size in Harrisville
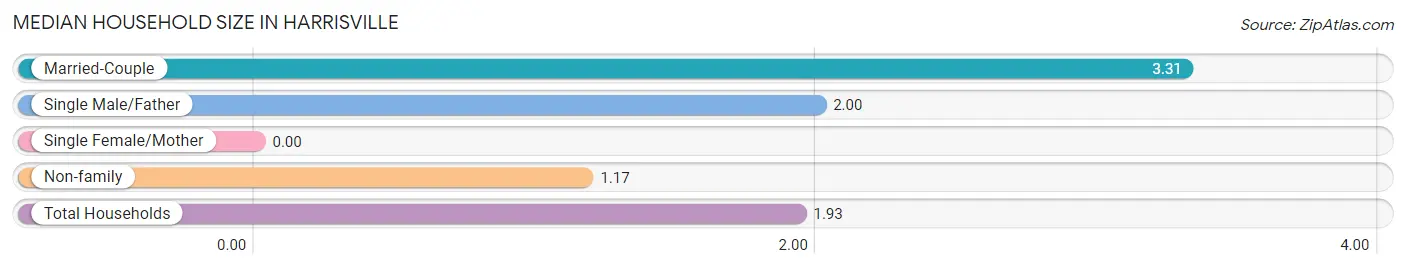
| Household Type | # Households | Household Size |
| Married-Couple | 264 (33.6%) | 3.31 |
| Single Male/Father | 34 (4.3%) | 2.00 |
| Single Female/Mother | 0 (0.0%) | - |
| Non-family | 489 (62.1%) | 1.17 |
| Total Households | 787 (100.0%) | 1.93 |
Household Size by Marriage Status in Harrisville
Out of a total of 787 households in Harrisville, 298 (37.9%) are family households, while 489 (62.1%) are nonfamily households. The most numerous type of family households are 2-person households, comprising 152, and the most common type of nonfamily households are 1-person households, comprising 413.
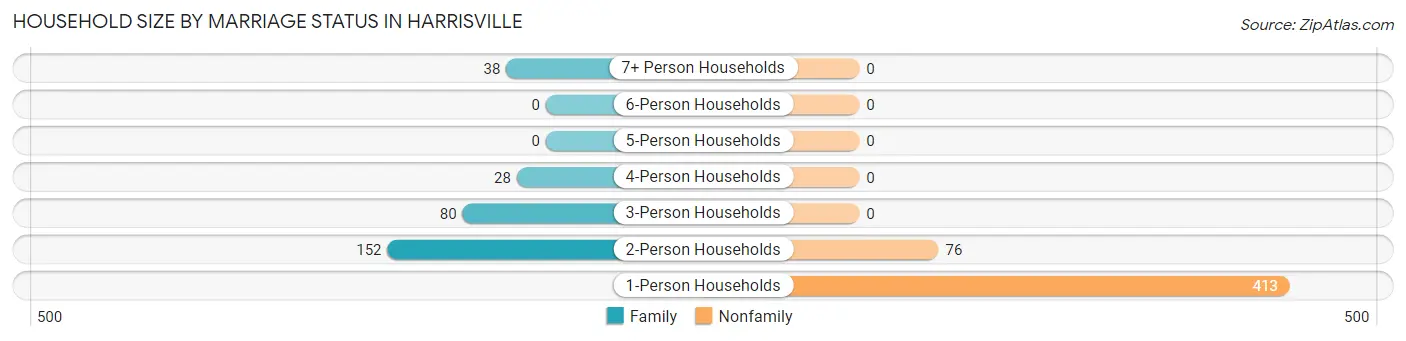
| Household Size | Family Households | Nonfamily Households |
| 1-Person Households | - | 413 (52.5%) |
| 2-Person Households | 152 (19.3%) | 76 (9.7%) |
| 3-Person Households | 80 (10.2%) | 0 (0.0%) |
| 4-Person Households | 28 (3.6%) | 0 (0.0%) |
| 5-Person Households | 0 (0.0%) | 0 (0.0%) |
| 6-Person Households | 0 (0.0%) | 0 (0.0%) |
| 7+ Person Households | 38 (4.8%) | 0 (0.0%) |
| Total | 298 (37.9%) | 489 (62.1%) |
Female Fertility in Harrisville
Fertility by Age in Harrisville
| Age Bracket | Women with Births | Births / 1,000 Women |
| 15 to 19 years | 0 (0.0%) | 0.0 |
| 20 to 34 years | 0 (0.0%) | 0.0 |
| 35 to 50 years | 0 (0.0%) | 0.0 |
| Total | 0 (0.0%) | 0.0 |
Fertility by Age by Marriage Status in Harrisville
| Age Bracket | Married | Unmarried |
| 15 to 19 years | 0 (0.0%) | 0 (0.0%) |
| 20 to 34 years | 0 (0.0%) | 0 (0.0%) |
| 35 to 50 years | 0 (0.0%) | 0 (0.0%) |
| Total | 0 (0.0%) | 0 (0.0%) |
Fertility by Education in Harrisville
| Educational Attainment | Women with Births | Births / 1,000 Women |
| Less than High School | 0 (0.0%) | 0.0 |
| High School Diploma | 0 (0.0%) | 0.0 |
| College or Associate's Degree | 0 (0.0%) | 0.0 |
| Bachelor's Degree | 0 (0.0%) | 0.0 |
| Graduate Degree | 0 (0.0%) | 0.0 |
| Total | 0 (0.0%) | 0.0 |
Fertility by Education by Marriage Status in Harrisville
| Educational Attainment | Married | Unmarried |
| Less than High School | 0 (0.0%) | 0 (0.0%) |
| High School Diploma | 0 (0.0%) | 0 (0.0%) |
| College or Associate's Degree | 0 (0.0%) | 0 (0.0%) |
| Bachelor's Degree | 0 (0.0%) | 0 (0.0%) |
| Graduate Degree | 0 (0.0%) | 0 (0.0%) |
| Total | 0 (0.0%) | 0 (0.0%) |
Employment Characteristics in Harrisville
Employment by Class of Employer in Harrisville
Among the 746 employed individuals in Harrisville, private company employees (506 | 67.8%), federal government employees (76 | 10.2%), and state government employees (61 | 8.2%) make up the most common classes of employment.
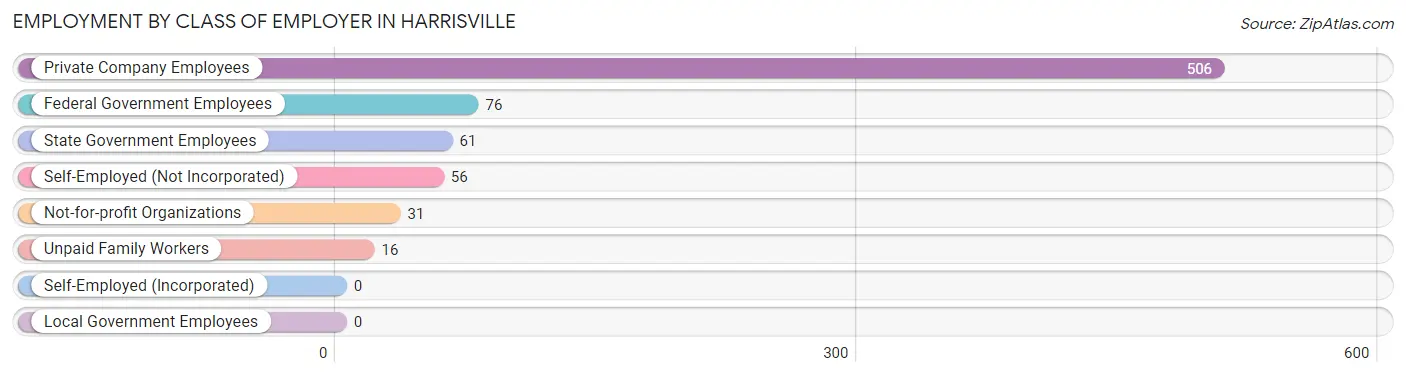
| Employer Class | # Employees | % Employees |
| Private Company Employees | 506 | 67.8% |
| Self-Employed (Incorporated) | 0 | 0.0% |
| Self-Employed (Not Incorporated) | 56 | 7.5% |
| Not-for-profit Organizations | 31 | 4.2% |
| Local Government Employees | 0 | 0.0% |
| State Government Employees | 61 | 8.2% |
| Federal Government Employees | 76 | 10.2% |
| Unpaid Family Workers | 16 | 2.1% |
| Total | 746 | 100.0% |
Employment Status by Age in Harrisville
According to the labor force statistics for Harrisville, out of the total population over 16 years of age (1,243), 63.6% or 791 individuals are in the labor force, with 5.7% or 45 of them unemployed. The age group with the highest labor force participation rate is 16 to 19 years, with 100.0% or 45 individuals in the labor force. Within the labor force, the 16 to 19 years age range has the highest percentage of unemployed individuals, with 100.0% or 45 of them being unemployed.
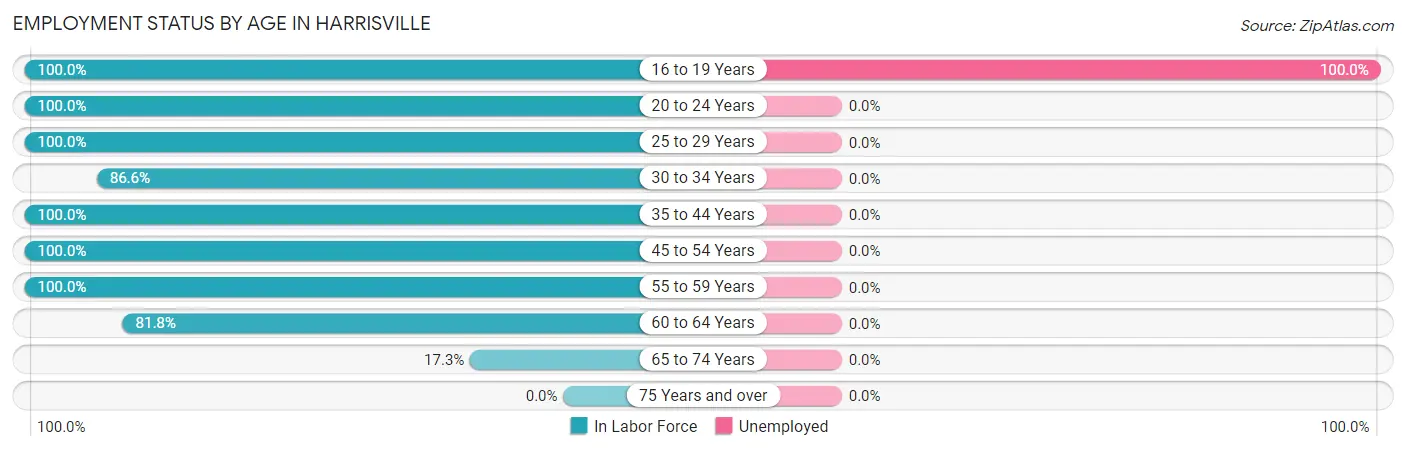
| Age Bracket | In Labor Force | Unemployed |
| 16 to 19 Years | 45 (100.0%) | 45 (100.0%) |
| 20 to 24 Years | 31 (100.0%) | 0 (0.0%) |
| 25 to 29 Years | 25 (100.0%) | 0 (0.0%) |
| 30 to 34 Years | 129 (86.6%) | 0 (0.0%) |
| 35 to 44 Years | 118 (100.0%) | 0 (0.0%) |
| 45 to 54 Years | 213 (100.0%) | 0 (0.0%) |
| 55 to 59 Years | 44 (100.0%) | 0 (0.0%) |
| 60 to 64 Years | 144 (81.8%) | 0 (0.0%) |
| 65 to 74 Years | 42 (17.3%) | 0 (0.0%) |
| 75 Years and over | 0 (0.0%) | 0 (0.0%) |
| Total | 791 (63.6%) | 45 (5.7%) |
Employment Status by Educational Attainment in Harrisville
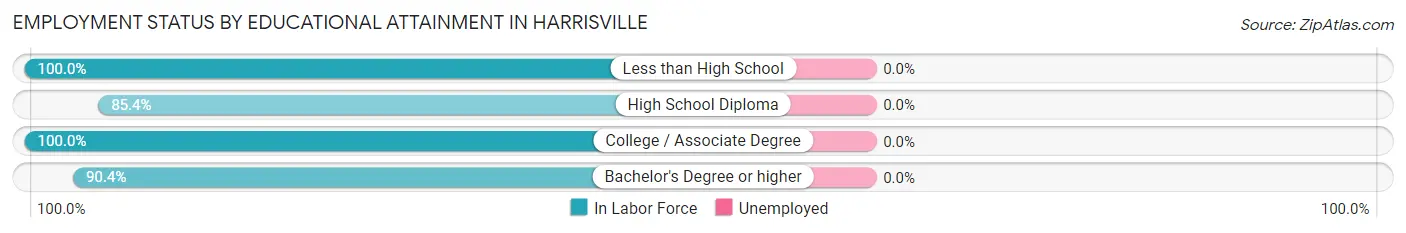
| Educational Attainment | In Labor Force | Unemployed |
| Less than High School | 17 (100.0%) | 0 (0.0%) |
| High School Diploma | 217 (85.4%) | 0 (0.0%) |
| College / Associate Degree | 298 (100.0%) | 0 (0.0%) |
| Bachelor's Degree or higher | 141 (90.4%) | 0 (0.0%) |
| Total | 673 (92.8%) | 0 (0.0%) |
Employment Occupations by Sex in Harrisville
Management, Business, Science and Arts Occupations
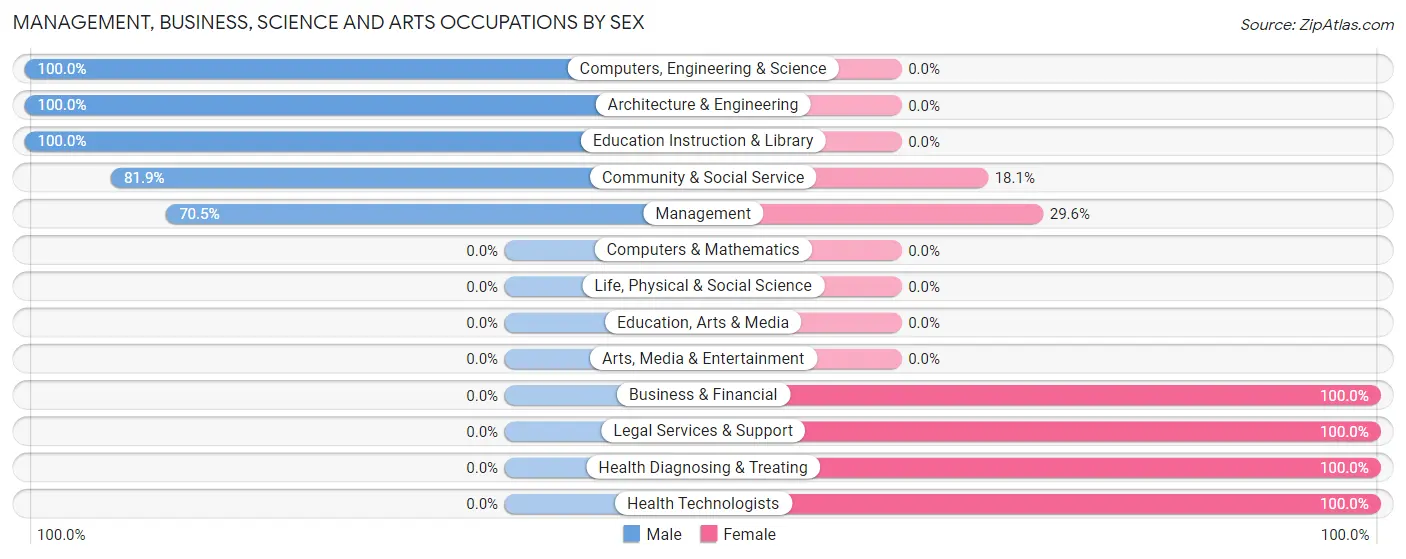
The most common Management, Business, Science and Arts occupations in Harrisville are Community & Social Service (72 | 9.7%), Education Instruction & Library (59 | 7.9%), Management (44 | 5.9%), Health Diagnosing & Treating (30 | 4.0%), and Health Technologists (30 | 4.0%).
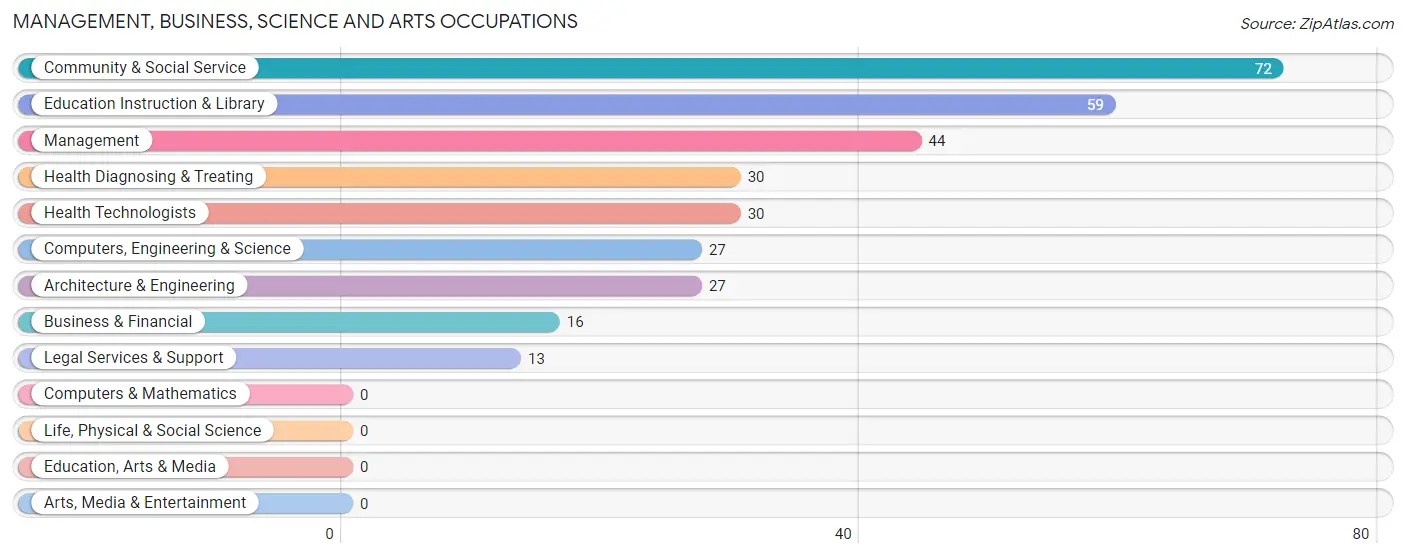
Management, Business, Science and Arts Occupations by Sex
Within the Management, Business, Science and Arts occupations in Harrisville, the most male-oriented occupations are Computers, Engineering & Science (100.0%), Architecture & Engineering (100.0%), and Education Instruction & Library (100.0%), while the most female-oriented occupations are Business & Financial (100.0%), Legal Services & Support (100.0%), and Health Diagnosing & Treating (100.0%).
| Occupation | Male | Female |
| Management | 31 (70.5%) | 13 (29.5%) |
| Business & Financial | 0 (0.0%) | 16 (100.0%) |
| Computers, Engineering & Science | 27 (100.0%) | 0 (0.0%) |
| Computers & Mathematics | 0 (0.0%) | 0 (0.0%) |
| Architecture & Engineering | 27 (100.0%) | 0 (0.0%) |
| Life, Physical & Social Science | 0 (0.0%) | 0 (0.0%) |
| Community & Social Service | 59 (81.9%) | 13 (18.1%) |
| Education, Arts & Media | 0 (0.0%) | 0 (0.0%) |
| Legal Services & Support | 0 (0.0%) | 13 (100.0%) |
| Education Instruction & Library | 59 (100.0%) | 0 (0.0%) |
| Arts, Media & Entertainment | 0 (0.0%) | 0 (0.0%) |
| Health Diagnosing & Treating | 0 (0.0%) | 30 (100.0%) |
| Health Technologists | 0 (0.0%) | 30 (100.0%) |
| Total (Category) | 117 (61.9%) | 72 (38.1%) |
| Total (Overall) | 316 (42.4%) | 430 (57.6%) |
Services Occupations
The most common Services occupations in Harrisville are Personal Care & Service (92 | 12.3%), Healthcare Support (16 | 2.1%), and Cleaning & Maintenance (15 | 2.0%).
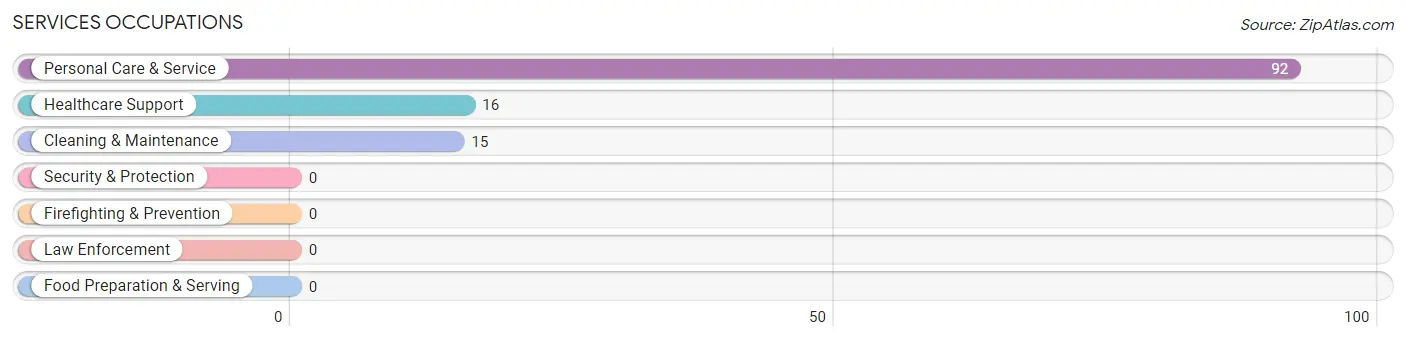
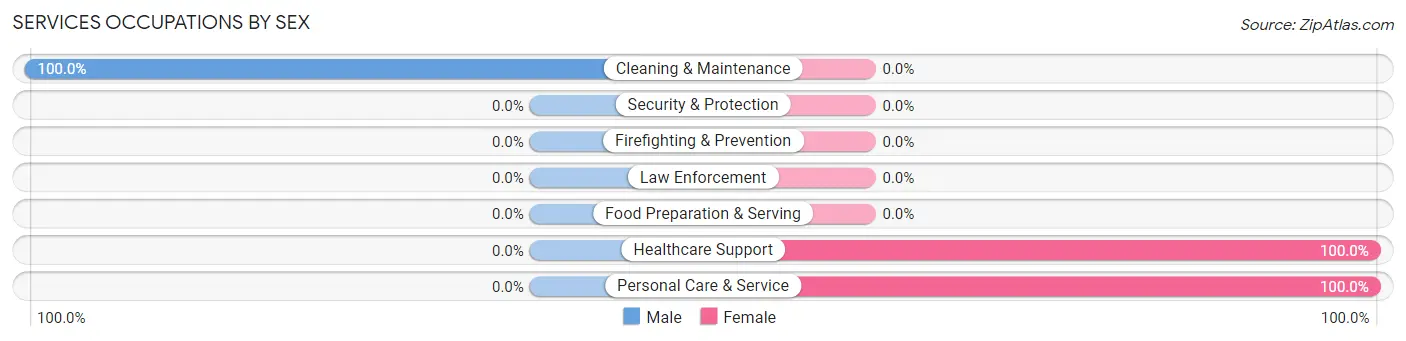
Services Occupations by Sex
| Occupation | Male | Female |
| Healthcare Support | 0 (0.0%) | 16 (100.0%) |
| Security & Protection | 0 (0.0%) | 0 (0.0%) |
| Firefighting & Prevention | 0 (0.0%) | 0 (0.0%) |
| Law Enforcement | 0 (0.0%) | 0 (0.0%) |
| Food Preparation & Serving | 0 (0.0%) | 0 (0.0%) |
| Cleaning & Maintenance | 15 (100.0%) | 0 (0.0%) |
| Personal Care & Service | 0 (0.0%) | 92 (100.0%) |
| Total (Category) | 15 (12.2%) | 108 (87.8%) |
| Total (Overall) | 316 (42.4%) | 430 (57.6%) |
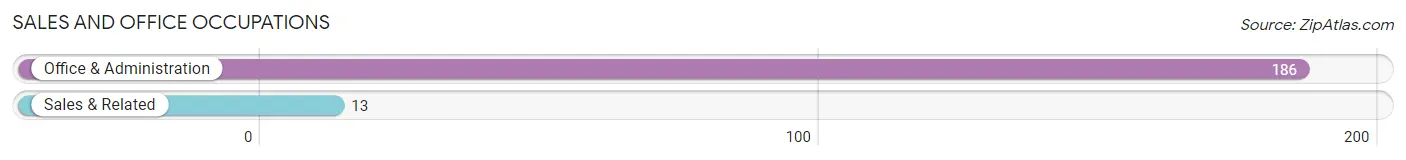
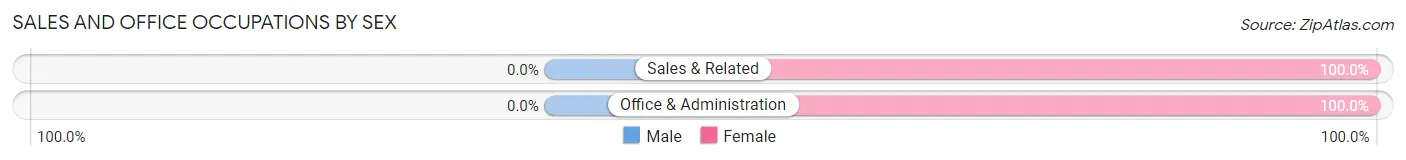
Sales and Office Occupations
The most common Sales and Office occupations in Harrisville are Office & Administration (186 | 24.9%), and Sales & Related (13 | 1.7%).
Sales and Office Occupations by Sex
| Occupation | Male | Female |
| Sales & Related | 0 (0.0%) | 13 (100.0%) |
| Office & Administration | 0 (0.0%) | 186 (100.0%) |
| Total (Category) | 0 (0.0%) | 199 (100.0%) |
| Total (Overall) | 316 (42.4%) | 430 (57.6%) |
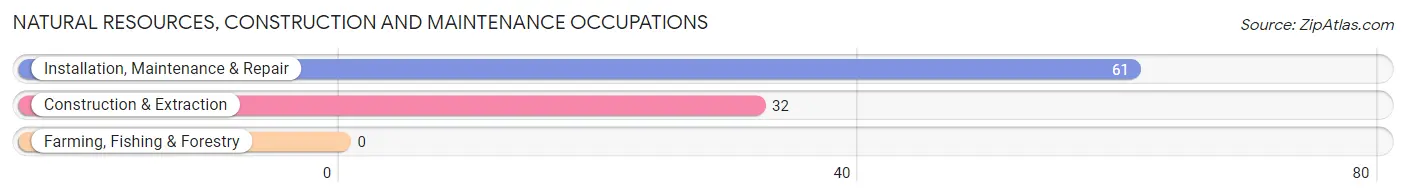
Natural Resources, Construction and Maintenance Occupations
The most common Natural Resources, Construction and Maintenance occupations in Harrisville are Installation, Maintenance & Repair (61 | 8.2%), and Construction & Extraction (32 | 4.3%).
Natural Resources, Construction and Maintenance Occupations by Sex

| Occupation | Male | Female |
| Farming, Fishing & Forestry | 0 (0.0%) | 0 (0.0%) |
| Construction & Extraction | 32 (100.0%) | 0 (0.0%) |
| Installation, Maintenance & Repair | 42 (68.9%) | 19 (31.1%) |
| Total (Category) | 74 (79.6%) | 19 (20.4%) |
| Total (Overall) | 316 (42.4%) | 430 (57.6%) |
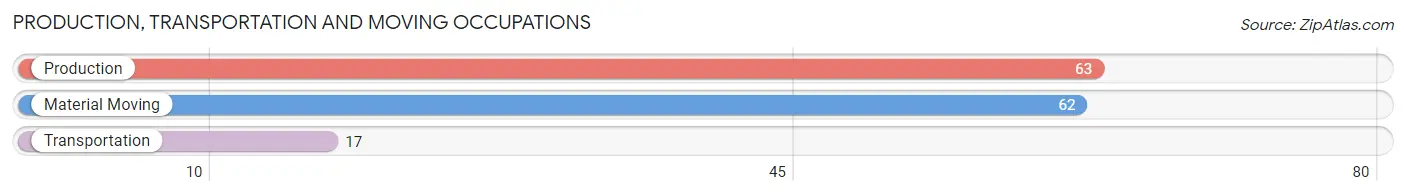
Production, Transportation and Moving Occupations
The most common Production, Transportation and Moving occupations in Harrisville are Production (63 | 8.5%), Material Moving (62 | 8.3%), and Transportation (17 | 2.3%).
Production, Transportation and Moving Occupations by Sex
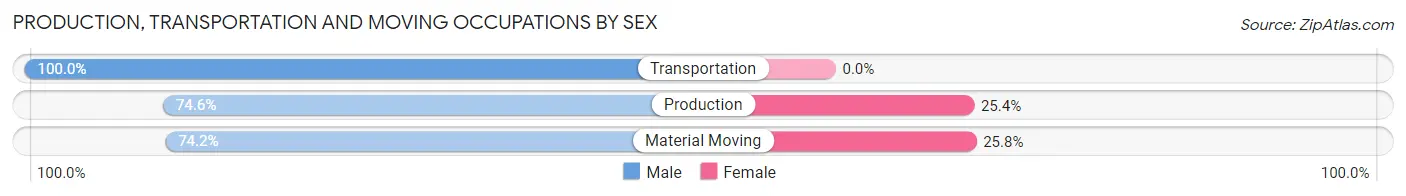
| Occupation | Male | Female |
| Production | 47 (74.6%) | 16 (25.4%) |
| Transportation | 17 (100.0%) | 0 (0.0%) |
| Material Moving | 46 (74.2%) | 16 (25.8%) |
| Total (Category) | 110 (77.5%) | 32 (22.5%) |
| Total (Overall) | 316 (42.4%) | 430 (57.6%) |
Employment Industries by Sex in Harrisville
Employment Industries in Harrisville
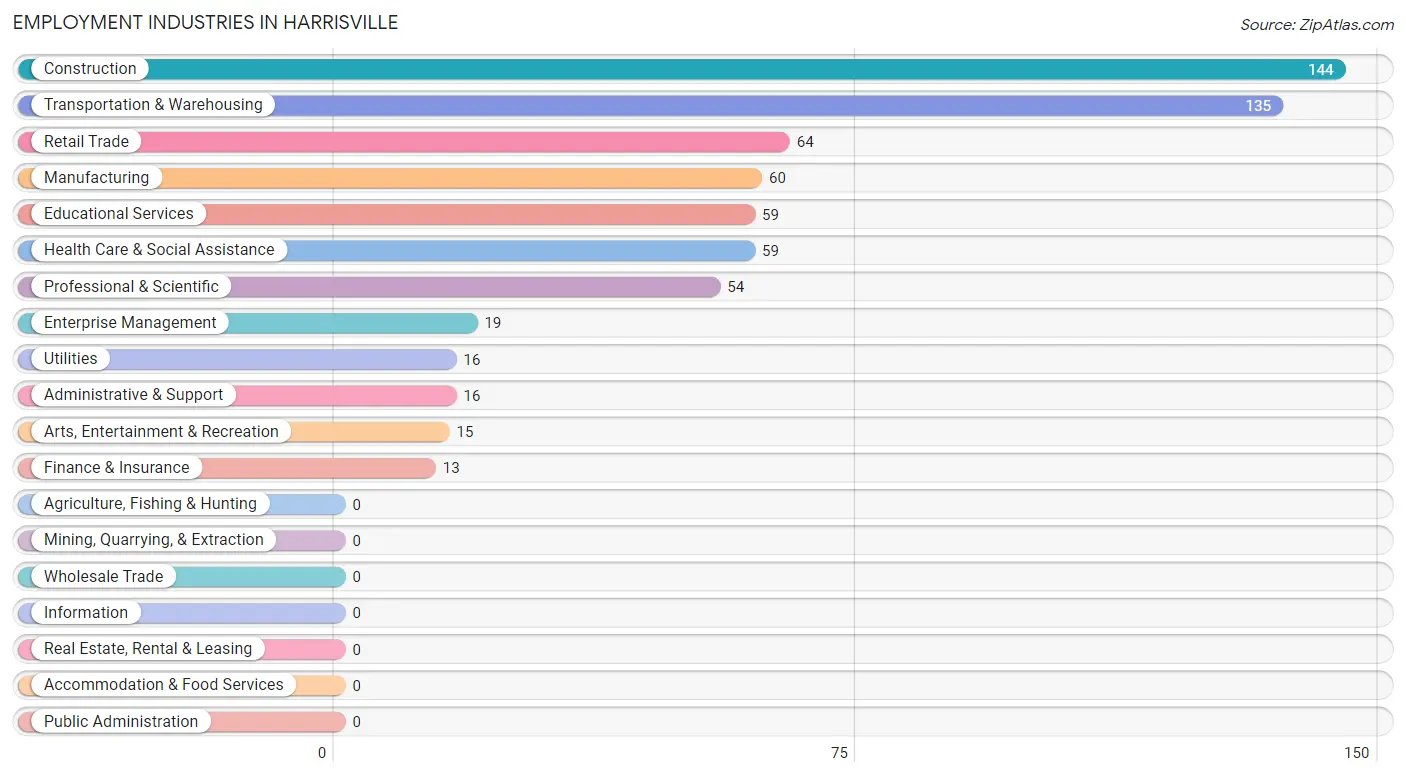
The major employment industries in Harrisville include Construction (144 | 19.3%), Transportation & Warehousing (135 | 18.1%), Retail Trade (64 | 8.6%), Manufacturing (60 | 8.0%), and Educational Services (59 | 7.9%).
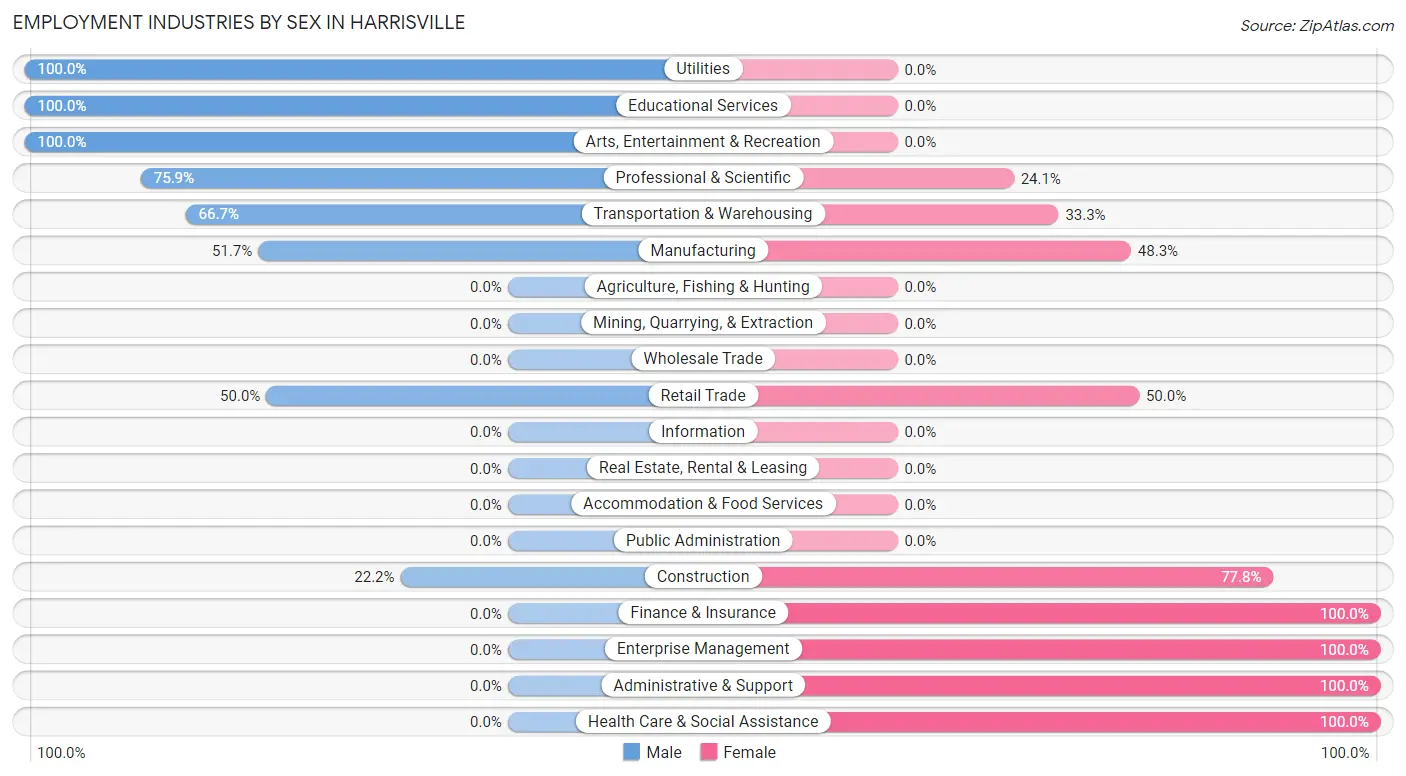
Employment Industries by Sex in Harrisville
The Harrisville industries that see more men than women are Utilities (100.0%), Educational Services (100.0%), and Arts, Entertainment & Recreation (100.0%), whereas the industries that tend to have a higher number of women are Finance & Insurance (100.0%), Enterprise Management (100.0%), and Administrative & Support (100.0%).
| Industry | Male | Female |
| Agriculture, Fishing & Hunting | 0 (0.0%) | 0 (0.0%) |
| Mining, Quarrying, & Extraction | 0 (0.0%) | 0 (0.0%) |
| Construction | 32 (22.2%) | 112 (77.8%) |
| Manufacturing | 31 (51.7%) | 29 (48.3%) |
| Wholesale Trade | 0 (0.0%) | 0 (0.0%) |
| Retail Trade | 32 (50.0%) | 32 (50.0%) |
| Transportation & Warehousing | 90 (66.7%) | 45 (33.3%) |
| Utilities | 16 (100.0%) | 0 (0.0%) |
| Information | 0 (0.0%) | 0 (0.0%) |
| Finance & Insurance | 0 (0.0%) | 13 (100.0%) |
| Real Estate, Rental & Leasing | 0 (0.0%) | 0 (0.0%) |
| Professional & Scientific | 41 (75.9%) | 13 (24.1%) |
| Enterprise Management | 0 (0.0%) | 19 (100.0%) |
| Administrative & Support | 0 (0.0%) | 16 (100.0%) |
| Educational Services | 59 (100.0%) | 0 (0.0%) |
| Health Care & Social Assistance | 0 (0.0%) | 59 (100.0%) |
| Arts, Entertainment & Recreation | 15 (100.0%) | 0 (0.0%) |
| Accommodation & Food Services | 0 (0.0%) | 0 (0.0%) |
| Public Administration | 0 (0.0%) | 0 (0.0%) |
| Total | 316 (42.4%) | 430 (57.6%) |
Education in Harrisville
School Enrollment in Harrisville
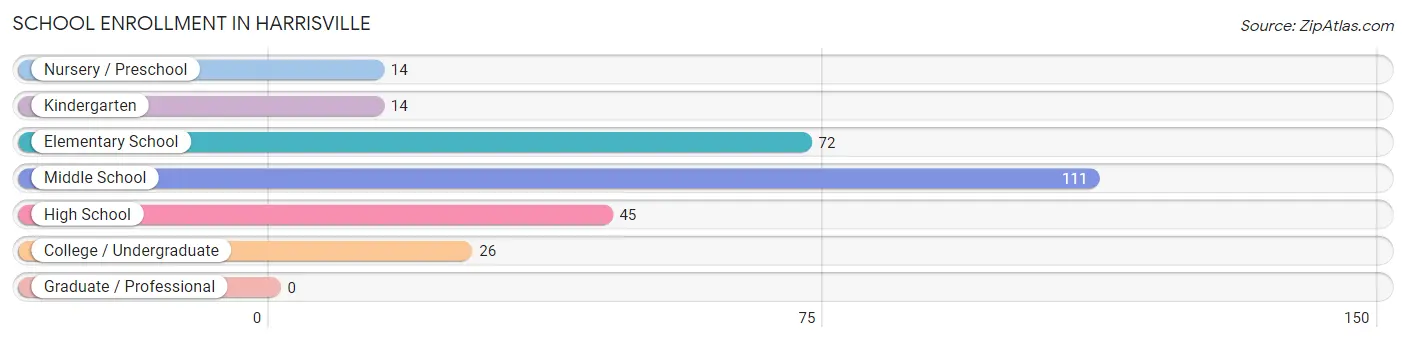
The most common levels of schooling among the 282 students in Harrisville are middle school (111 | 39.4%), elementary school (72 | 25.5%), and high school (45 | 16.0%).
| School Level | # Students | % Students |
| Nursery / Preschool | 14 | 5.0% |
| Kindergarten | 14 | 5.0% |
| Elementary School | 72 | 25.5% |
| Middle School | 111 | 39.4% |
| High School | 45 | 16.0% |
| College / Undergraduate | 26 | 9.2% |
| Graduate / Professional | 0 | 0.0% |
| Total | 282 | 100.0% |
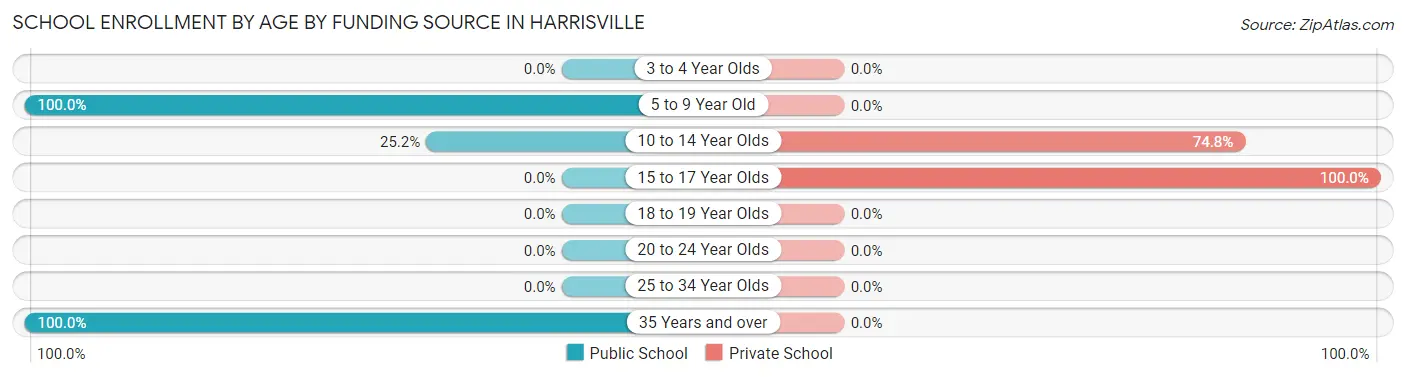
School Enrollment by Age by Funding Source in Harrisville
Out of a total of 282 students who are enrolled in schools in Harrisville, 128 (45.4%) attend a private institution, while the remaining 154 (54.6%) are enrolled in public schools. The age group of 15 to 17 year olds has the highest likelihood of being enrolled in private schools, with 45 (100.0% in the age bracket) enrolled. Conversely, the age group of 5 to 9 year old has the lowest likelihood of being enrolled in a private school, with 100 (100.0% in the age bracket) attending a public institution.
| Age Bracket | Public School | Private School |
| 3 to 4 Year Olds | 0 (0.0%) | 0 (0.0%) |
| 5 to 9 Year Old | 100 (100.0%) | 0 (0.0%) |
| 10 to 14 Year Olds | 28 (25.2%) | 83 (74.8%) |
| 15 to 17 Year Olds | 0 (0.0%) | 45 (100.0%) |
| 18 to 19 Year Olds | 0 (0.0%) | 0 (0.0%) |
| 20 to 24 Year Olds | 0 (0.0%) | 0 (0.0%) |
| 25 to 34 Year Olds | 0 (0.0%) | 0 (0.0%) |
| 35 Years and over | 26 (100.0%) | 0 (0.0%) |
| Total | 154 (54.6%) | 128 (45.4%) |
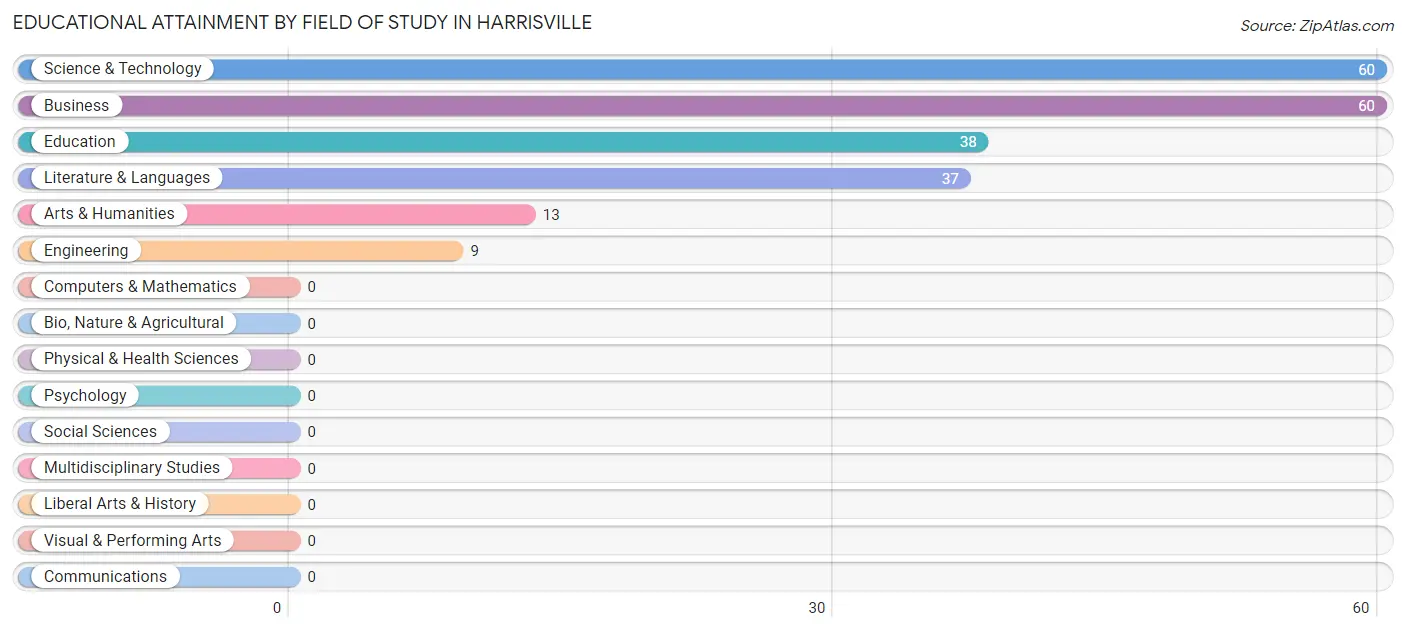
Educational Attainment by Field of Study in Harrisville
Science & technology (60 | 27.7%), business (60 | 27.7%), education (38 | 17.5%), literature & languages (37 | 17.1%), and arts & humanities (13 | 6.0%) are the most common fields of study among 217 individuals in Harrisville who have obtained a bachelor's degree or higher.
| Field of Study | # Graduates | % Graduates |
| Computers & Mathematics | 0 | 0.0% |
| Bio, Nature & Agricultural | 0 | 0.0% |
| Physical & Health Sciences | 0 | 0.0% |
| Psychology | 0 | 0.0% |
| Social Sciences | 0 | 0.0% |
| Engineering | 9 | 4.2% |
| Multidisciplinary Studies | 0 | 0.0% |
| Science & Technology | 60 | 27.7% |
| Business | 60 | 27.7% |
| Education | 38 | 17.5% |
| Literature & Languages | 37 | 17.1% |
| Liberal Arts & History | 0 | 0.0% |
| Visual & Performing Arts | 0 | 0.0% |
| Communications | 0 | 0.0% |
| Arts & Humanities | 13 | 6.0% |
| Total | 217 | 100.0% |
Transportation & Commute in Harrisville
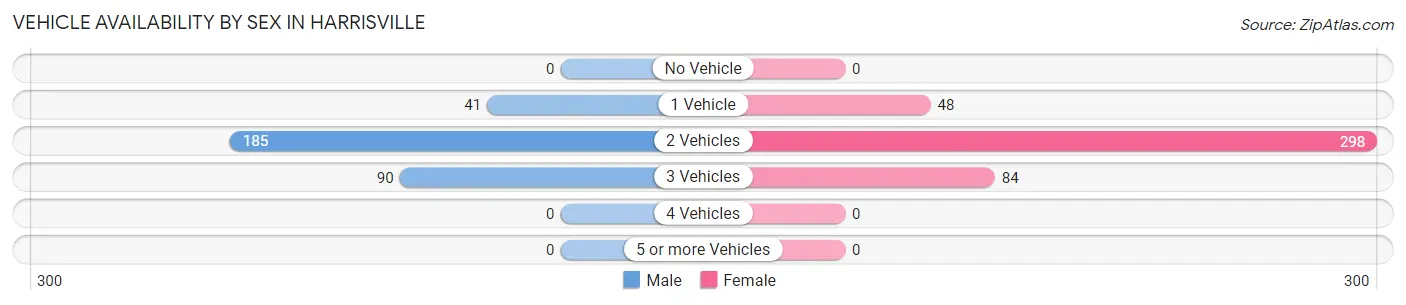
Vehicle Availability by Sex in Harrisville
The most prevalent vehicle ownership categories in Harrisville are males with 2 vehicles (185, accounting for 58.5%) and females with 2 vehicles (298, making up 43.0%).
| Vehicles Available | Male | Female |
| No Vehicle | 0 (0.0%) | 0 (0.0%) |
| 1 Vehicle | 41 (13.0%) | 48 (11.2%) |
| 2 Vehicles | 185 (58.5%) | 298 (69.3%) |
| 3 Vehicles | 90 (28.5%) | 84 (19.5%) |
| 4 Vehicles | 0 (0.0%) | 0 (0.0%) |
| 5 or more Vehicles | 0 (0.0%) | 0 (0.0%) |
| Total | 316 (100.0%) | 430 (100.0%) |
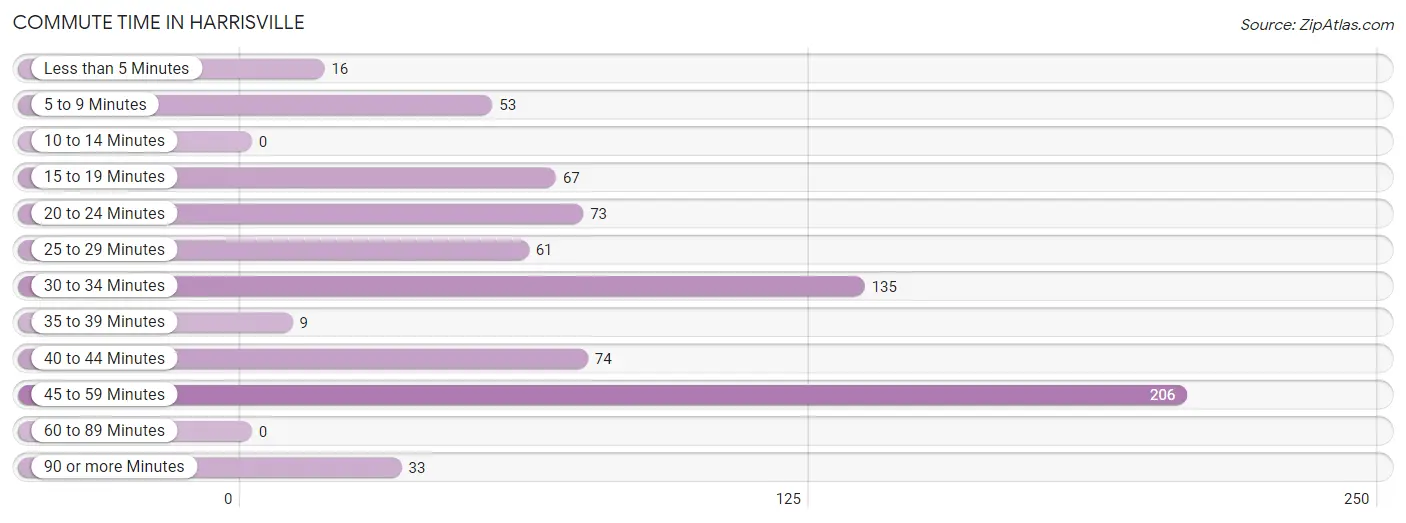
Commute Time in Harrisville
The most frequently occuring commute durations in Harrisville are 45 to 59 minutes (206 commuters, 28.3%), 30 to 34 minutes (135 commuters, 18.6%), and 40 to 44 minutes (74 commuters, 10.2%).
| Commute Time | # Commuters | % Commuters |
| Less than 5 Minutes | 16 | 2.2% |
| 5 to 9 Minutes | 53 | 7.3% |
| 10 to 14 Minutes | 0 | 0.0% |
| 15 to 19 Minutes | 67 | 9.2% |
| 20 to 24 Minutes | 73 | 10.0% |
| 25 to 29 Minutes | 61 | 8.4% |
| 30 to 34 Minutes | 135 | 18.6% |
| 35 to 39 Minutes | 9 | 1.2% |
| 40 to 44 Minutes | 74 | 10.2% |
| 45 to 59 Minutes | 206 | 28.3% |
| 60 to 89 Minutes | 0 | 0.0% |
| 90 or more Minutes | 33 | 4.5% |
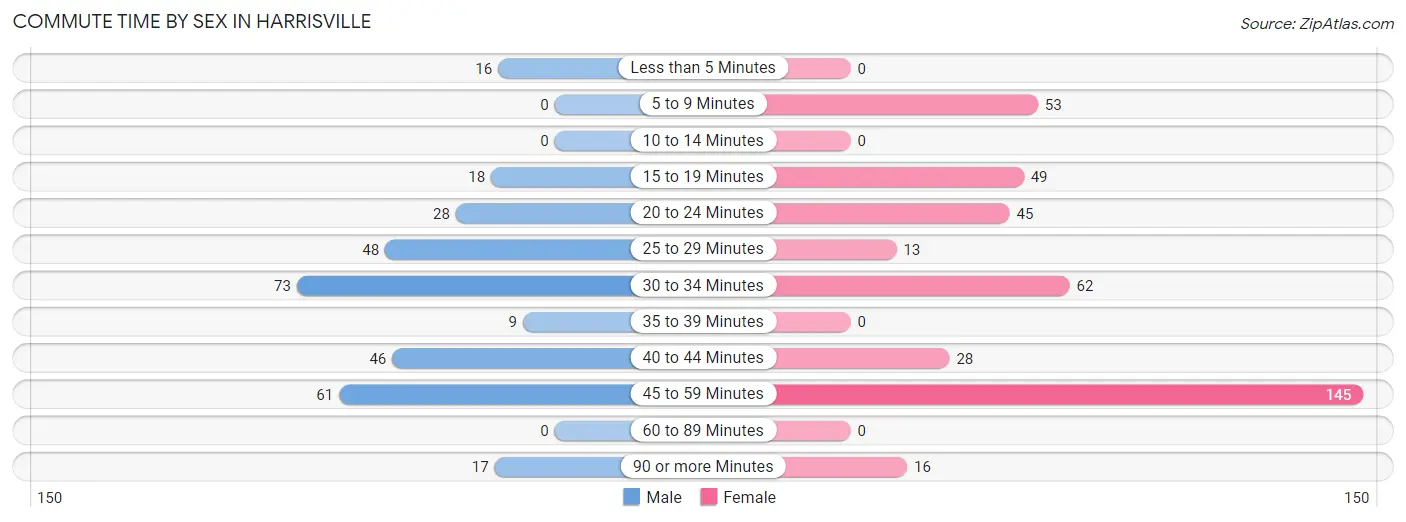
Commute Time by Sex in Harrisville
The most common commute times in Harrisville are 30 to 34 minutes (73 commuters, 23.1%) for males and 45 to 59 minutes (145 commuters, 35.3%) for females.
| Commute Time | Male | Female |
| Less than 5 Minutes | 16 (5.1%) | 0 (0.0%) |
| 5 to 9 Minutes | 0 (0.0%) | 53 (12.9%) |
| 10 to 14 Minutes | 0 (0.0%) | 0 (0.0%) |
| 15 to 19 Minutes | 18 (5.7%) | 49 (11.9%) |
| 20 to 24 Minutes | 28 (8.9%) | 45 (11.0%) |
| 25 to 29 Minutes | 48 (15.2%) | 13 (3.2%) |
| 30 to 34 Minutes | 73 (23.1%) | 62 (15.1%) |
| 35 to 39 Minutes | 9 (2.9%) | 0 (0.0%) |
| 40 to 44 Minutes | 46 (14.6%) | 28 (6.8%) |
| 45 to 59 Minutes | 61 (19.3%) | 145 (35.3%) |
| 60 to 89 Minutes | 0 (0.0%) | 0 (0.0%) |
| 90 or more Minutes | 17 (5.4%) | 16 (3.9%) |
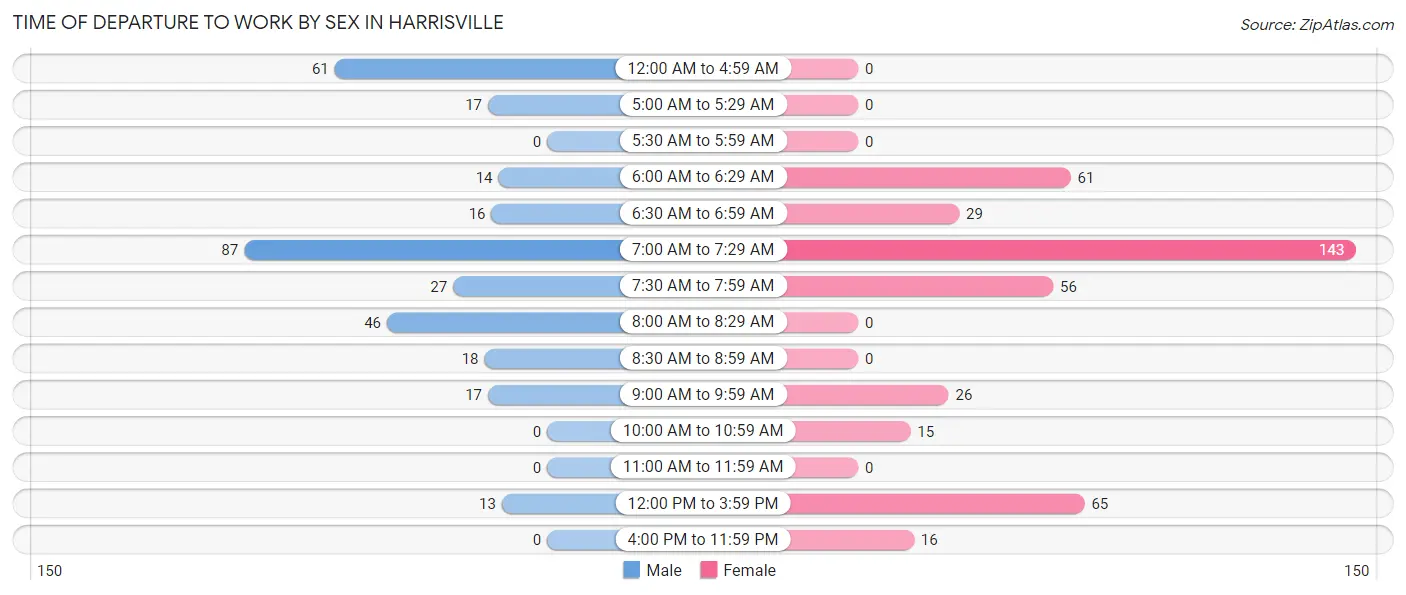
Time of Departure to Work by Sex in Harrisville
The most frequent times of departure to work in Harrisville are 7:00 AM to 7:29 AM (87, 27.5%) for males and 7:00 AM to 7:29 AM (143, 34.8%) for females.
| Time of Departure | Male | Female |
| 12:00 AM to 4:59 AM | 61 (19.3%) | 0 (0.0%) |
| 5:00 AM to 5:29 AM | 17 (5.4%) | 0 (0.0%) |
| 5:30 AM to 5:59 AM | 0 (0.0%) | 0 (0.0%) |
| 6:00 AM to 6:29 AM | 14 (4.4%) | 61 (14.8%) |
| 6:30 AM to 6:59 AM | 16 (5.1%) | 29 (7.1%) |
| 7:00 AM to 7:29 AM | 87 (27.5%) | 143 (34.8%) |
| 7:30 AM to 7:59 AM | 27 (8.5%) | 56 (13.6%) |
| 8:00 AM to 8:29 AM | 46 (14.6%) | 0 (0.0%) |
| 8:30 AM to 8:59 AM | 18 (5.7%) | 0 (0.0%) |
| 9:00 AM to 9:59 AM | 17 (5.4%) | 26 (6.3%) |
| 10:00 AM to 10:59 AM | 0 (0.0%) | 15 (3.6%) |
| 11:00 AM to 11:59 AM | 0 (0.0%) | 0 (0.0%) |
| 12:00 PM to 3:59 PM | 13 (4.1%) | 65 (15.8%) |
| 4:00 PM to 11:59 PM | 0 (0.0%) | 16 (3.9%) |
| Total | 316 (100.0%) | 411 (100.0%) |
Housing Occupancy in Harrisville
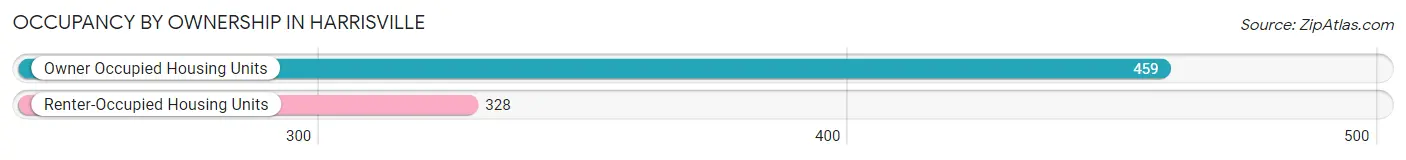
Occupancy by Ownership in Harrisville
Of the total 787 dwellings in Harrisville, owner-occupied units account for 459 (58.3%), while renter-occupied units make up 328 (41.7%).
| Occupancy | # Housing Units | % Housing Units |
| Owner Occupied Housing Units | 459 | 58.3% |
| Renter-Occupied Housing Units | 328 | 41.7% |
| Total Occupied Housing Units | 787 | 100.0% |
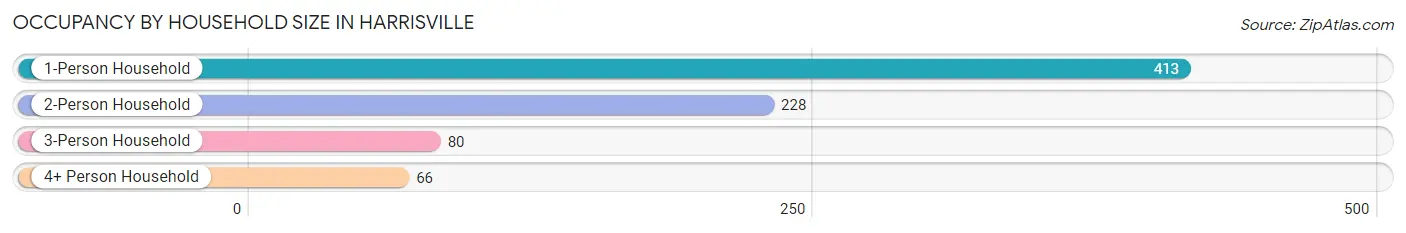
Occupancy by Household Size in Harrisville
| Household Size | # Housing Units | % Housing Units |
| 1-Person Household | 413 | 52.5% |
| 2-Person Household | 228 | 29.0% |
| 3-Person Household | 80 | 10.2% |
| 4+ Person Household | 66 | 8.4% |
| Total Housing Units | 787 | 100.0% |
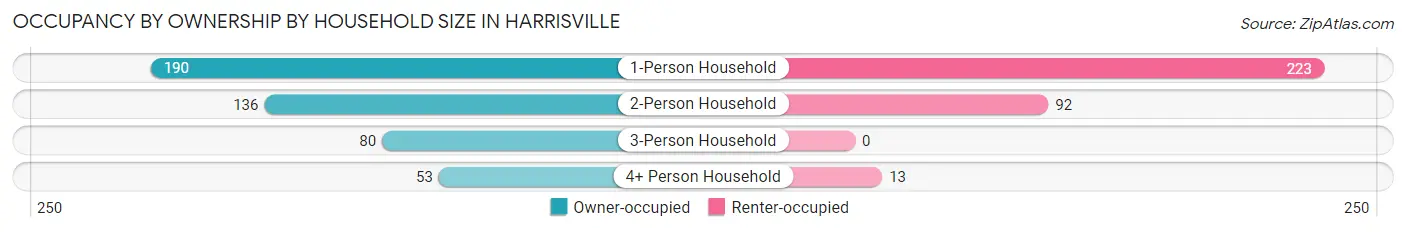
Occupancy by Ownership by Household Size in Harrisville
| Household Size | Owner-occupied | Renter-occupied |
| 1-Person Household | 190 (46.0%) | 223 (54.0%) |
| 2-Person Household | 136 (59.7%) | 92 (40.4%) |
| 3-Person Household | 80 (100.0%) | 0 (0.0%) |
| 4+ Person Household | 53 (80.3%) | 13 (19.7%) |
| Total Housing Units | 459 (58.3%) | 328 (41.7%) |
Occupancy by Educational Attainment in Harrisville
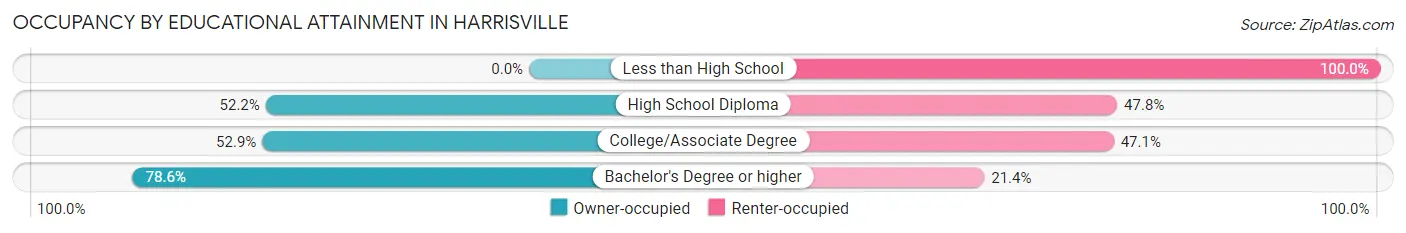
| Household Size | Owner-occupied | Renter-occupied |
| Less than High School | 0 (0.0%) | 16 (100.0%) |
| High School Diploma | 212 (52.2%) | 194 (47.8%) |
| College/Associate Degree | 82 (52.9%) | 73 (47.1%) |
| Bachelor's Degree or higher | 165 (78.6%) | 45 (21.4%) |
Occupancy by Age of Householder in Harrisville
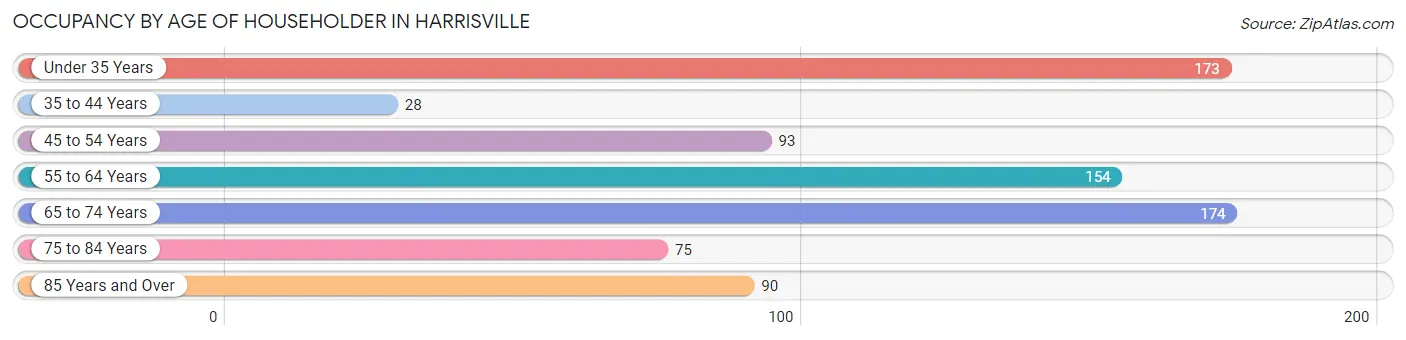
| Age Bracket | # Households | % Households |
| Under 35 Years | 173 | 22.0% |
| 35 to 44 Years | 28 | 3.6% |
| 45 to 54 Years | 93 | 11.8% |
| 55 to 64 Years | 154 | 19.6% |
| 65 to 74 Years | 174 | 22.1% |
| 75 to 84 Years | 75 | 9.5% |
| 85 Years and Over | 90 | 11.4% |
| Total | 787 | 100.0% |
Housing Finances in Harrisville
Median Income by Occupancy in Harrisville
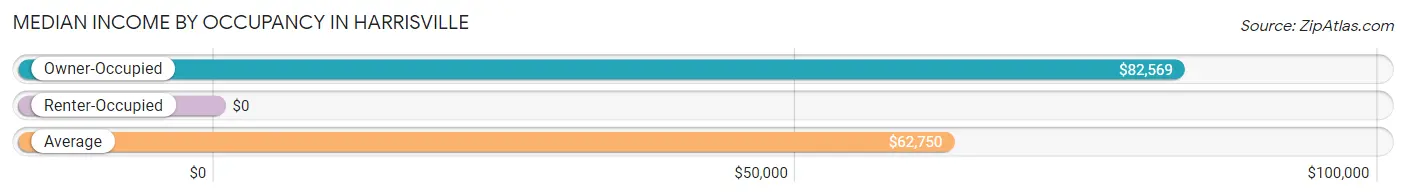
| Occupancy Type | # Households | Median Income |
| Owner-Occupied | 459 (58.3%) | $82,569 |
| Renter-Occupied | 328 (41.7%) | $0 |
| Average | 787 (100.0%) | $62,750 |
Occupancy by Householder Income Bracket in Harrisville
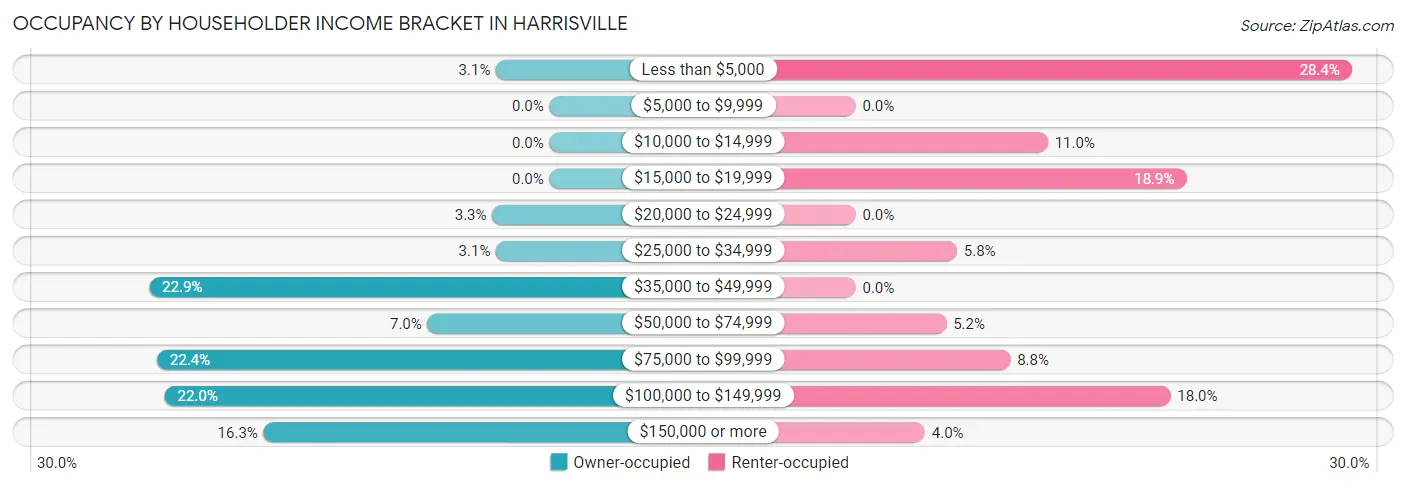
| Income Bracket | Owner-occupied | Renter-occupied |
| Less than $5,000 | 14 (3.0%) | 93 (28.3%) |
| $5,000 to $9,999 | 0 (0.0%) | 0 (0.0%) |
| $10,000 to $14,999 | 0 (0.0%) | 36 (11.0%) |
| $15,000 to $19,999 | 0 (0.0%) | 62 (18.9%) |
| $20,000 to $24,999 | 15 (3.3%) | 0 (0.0%) |
| $25,000 to $34,999 | 14 (3.0%) | 19 (5.8%) |
| $35,000 to $49,999 | 105 (22.9%) | 0 (0.0%) |
| $50,000 to $74,999 | 32 (7.0%) | 17 (5.2%) |
| $75,000 to $99,999 | 103 (22.4%) | 29 (8.8%) |
| $100,000 to $149,999 | 101 (22.0%) | 59 (18.0%) |
| $150,000 or more | 75 (16.3%) | 13 (4.0%) |
| Total | 459 (100.0%) | 328 (100.0%) |
Monthly Housing Cost Tiers in Harrisville
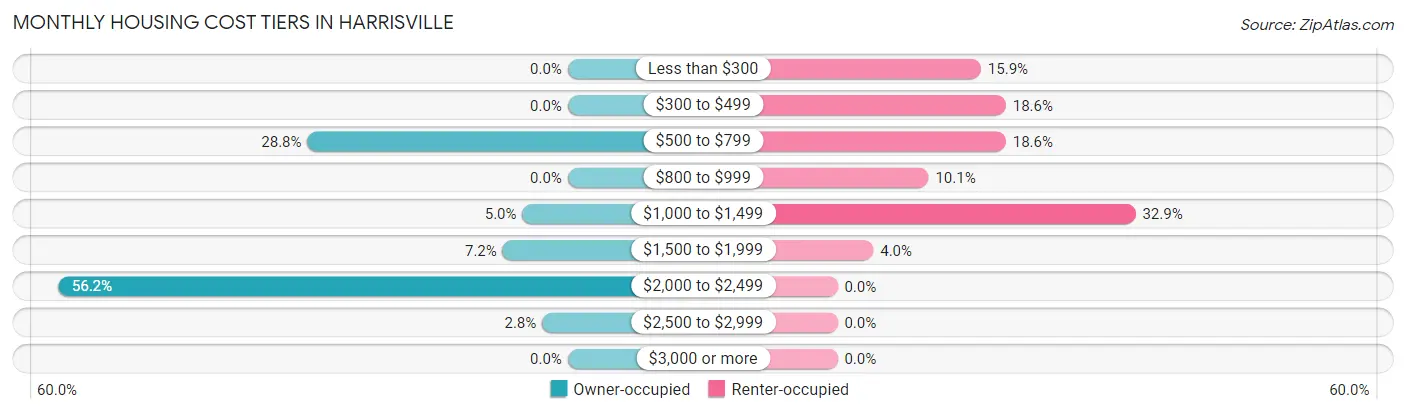
| Monthly Cost | Owner-occupied | Renter-occupied |
| Less than $300 | 0 (0.0%) | 52 (15.9%) |
| $300 to $499 | 0 (0.0%) | 61 (18.6%) |
| $500 to $799 | 132 (28.8%) | 61 (18.6%) |
| $800 to $999 | 0 (0.0%) | 33 (10.1%) |
| $1,000 to $1,499 | 23 (5.0%) | 108 (32.9%) |
| $1,500 to $1,999 | 33 (7.2%) | 13 (4.0%) |
| $2,000 to $2,499 | 258 (56.2%) | 0 (0.0%) |
| $2,500 to $2,999 | 13 (2.8%) | 0 (0.0%) |
| $3,000 or more | 0 (0.0%) | 0 (0.0%) |
| Total | 459 (100.0%) | 328 (100.0%) |
Physical Housing Characteristics in Harrisville
Housing Structures in Harrisville
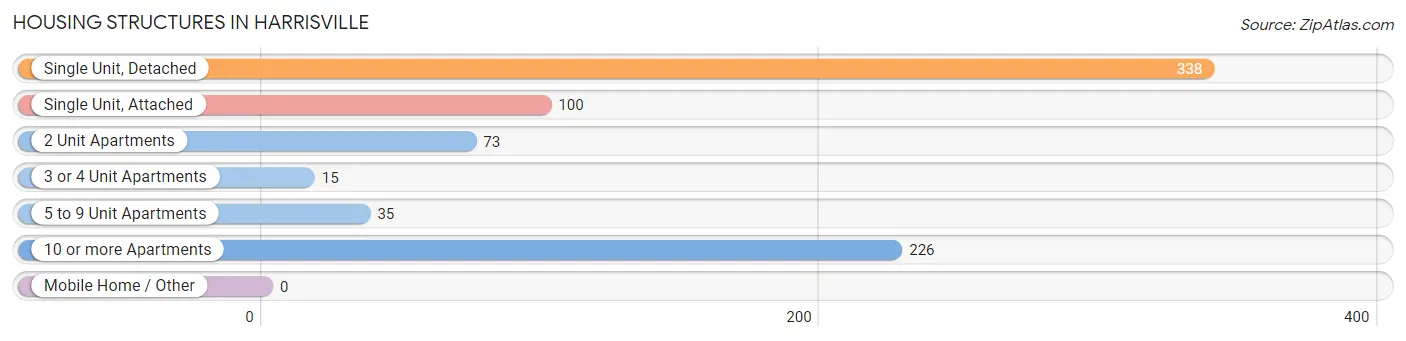
| Structure Type | # Housing Units | % Housing Units |
| Single Unit, Detached | 338 | 42.9% |
| Single Unit, Attached | 100 | 12.7% |
| 2 Unit Apartments | 73 | 9.3% |
| 3 or 4 Unit Apartments | 15 | 1.9% |
| 5 to 9 Unit Apartments | 35 | 4.4% |
| 10 or more Apartments | 226 | 28.7% |
| Mobile Home / Other | 0 | 0.0% |
| Total | 787 | 100.0% |
Housing Structures by Occupancy in Harrisville
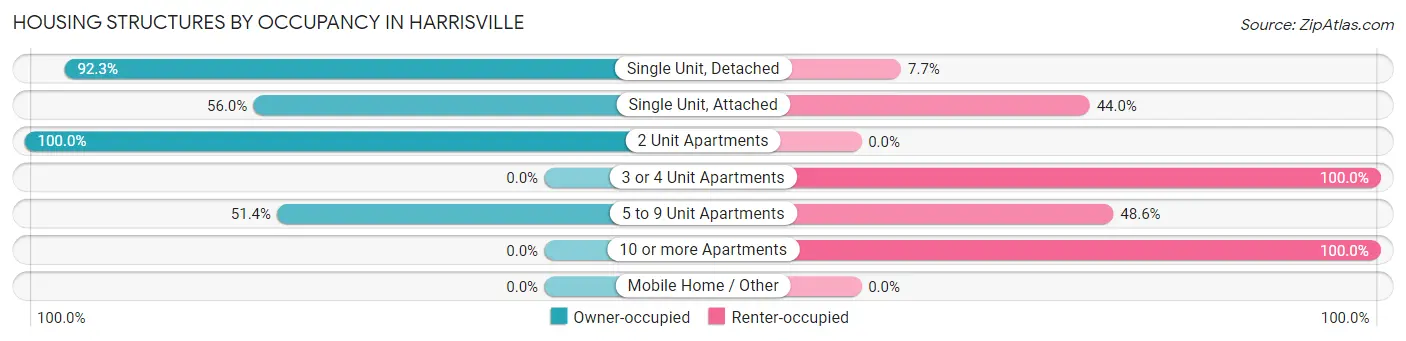
| Structure Type | Owner-occupied | Renter-occupied |
| Single Unit, Detached | 312 (92.3%) | 26 (7.7%) |
| Single Unit, Attached | 56 (56.0%) | 44 (44.0%) |
| 2 Unit Apartments | 73 (100.0%) | 0 (0.0%) |
| 3 or 4 Unit Apartments | 0 (0.0%) | 15 (100.0%) |
| 5 to 9 Unit Apartments | 18 (51.4%) | 17 (48.6%) |
| 10 or more Apartments | 0 (0.0%) | 226 (100.0%) |
| Mobile Home / Other | 0 (0.0%) | 0 (0.0%) |
| Total | 459 (58.3%) | 328 (41.7%) |
Housing Structures by Number of Rooms in Harrisville
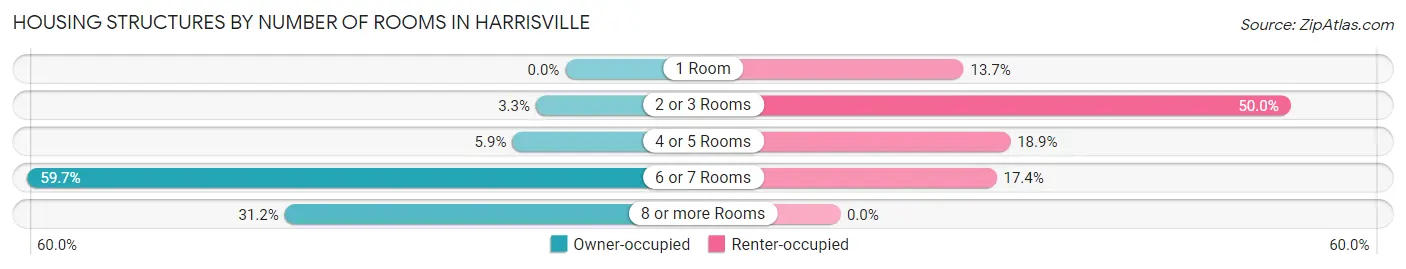
| Number of Rooms | Owner-occupied | Renter-occupied |
| 1 Room | 0 (0.0%) | 45 (13.7%) |
| 2 or 3 Rooms | 15 (3.3%) | 164 (50.0%) |
| 4 or 5 Rooms | 27 (5.9%) | 62 (18.9%) |
| 6 or 7 Rooms | 274 (59.7%) | 57 (17.4%) |
| 8 or more Rooms | 143 (31.1%) | 0 (0.0%) |
| Total | 459 (100.0%) | 328 (100.0%) |
Housing Structure by Heating Type in Harrisville

| Heating Type | Owner-occupied | Renter-occupied |
| Utility Gas | 0 (0.0%) | 61 (18.6%) |
| Bottled, Tank, or LP Gas | 46 (10.0%) | 20 (6.1%) |
| Electricity | 0 (0.0%) | 81 (24.7%) |
| Fuel Oil or Kerosene | 397 (86.5%) | 166 (50.6%) |
| Coal or Coke | 0 (0.0%) | 0 (0.0%) |
| All other Fuels | 16 (3.5%) | 0 (0.0%) |
| No Fuel Used | 0 (0.0%) | 0 (0.0%) |
| Total | 459 (100.0%) | 328 (100.0%) |
Household Vehicle Usage in Harrisville
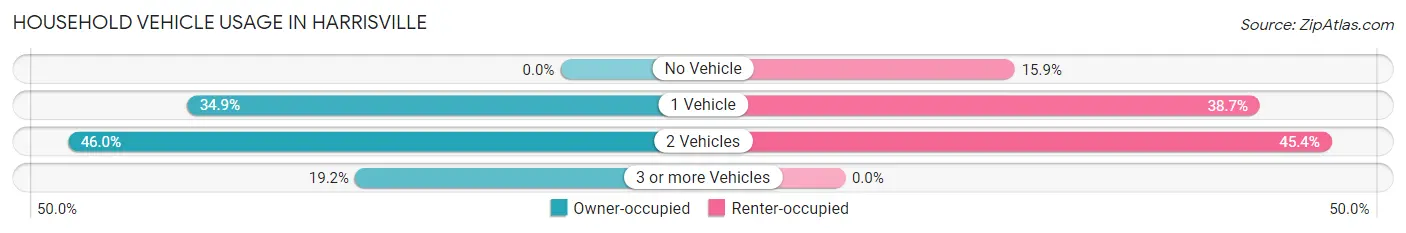
| Vehicles per Household | Owner-occupied | Renter-occupied |
| No Vehicle | 0 (0.0%) | 52 (15.9%) |
| 1 Vehicle | 160 (34.9%) | 127 (38.7%) |
| 2 Vehicles | 211 (46.0%) | 149 (45.4%) |
| 3 or more Vehicles | 88 (19.2%) | 0 (0.0%) |
| Total | 459 (100.0%) | 328 (100.0%) |
Real Estate & Mortgages in Harrisville
Real Estate and Mortgage Overview in Harrisville
| Characteristic | Without Mortgage | With Mortgage |
| Housing Units | 128 | 331 |
| Median Property Value | $315,300 | $352,800 |
| Median Household Income | $49,025 | $61 |
| Monthly Housing Costs | $709 | $0 |
| Real Estate Taxes | $3,122 | $15 |
Property Value by Mortgage Status in Harrisville
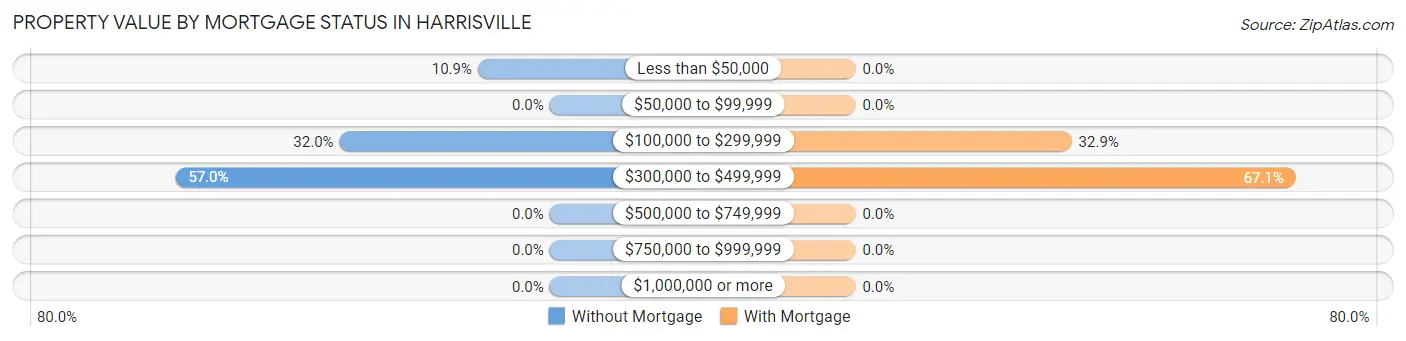
| Property Value | Without Mortgage | With Mortgage |
| Less than $50,000 | 14 (10.9%) | 0 (0.0%) |
| $50,000 to $99,999 | 0 (0.0%) | 0 (0.0%) |
| $100,000 to $299,999 | 41 (32.0%) | 109 (32.9%) |
| $300,000 to $499,999 | 73 (57.0%) | 222 (67.1%) |
| $500,000 to $749,999 | 0 (0.0%) | 0 (0.0%) |
| $750,000 to $999,999 | 0 (0.0%) | 0 (0.0%) |
| $1,000,000 or more | 0 (0.0%) | 0 (0.0%) |
| Total | 128 (100.0%) | 331 (100.0%) |
Household Income by Mortgage Status in Harrisville
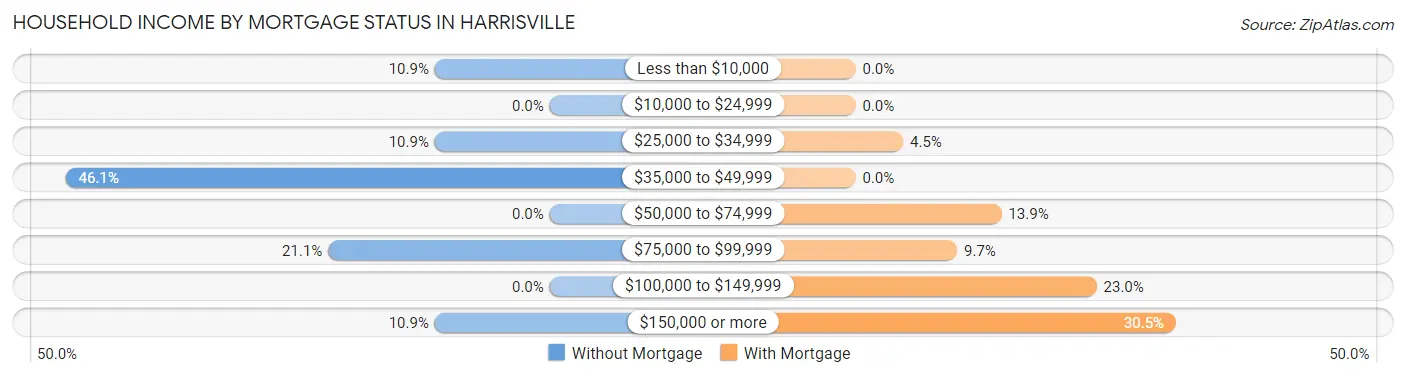
| Household Income | Without Mortgage | With Mortgage |
| Less than $10,000 | 14 (10.9%) | 0 (0.0%) |
| $10,000 to $24,999 | 0 (0.0%) | 0 (0.0%) |
| $25,000 to $34,999 | 14 (10.9%) | 15 (4.5%) |
| $35,000 to $49,999 | 59 (46.1%) | 0 (0.0%) |
| $50,000 to $74,999 | 0 (0.0%) | 46 (13.9%) |
| $75,000 to $99,999 | 27 (21.1%) | 32 (9.7%) |
| $100,000 to $149,999 | 0 (0.0%) | 76 (23.0%) |
| $150,000 or more | 14 (10.9%) | 101 (30.5%) |
| Total | 128 (100.0%) | 331 (100.0%) |
Property Value to Household Income Ratio in Harrisville
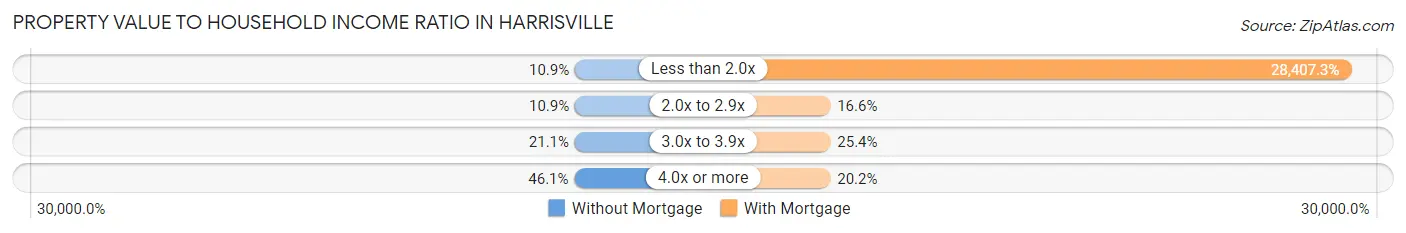
| Value-to-Income Ratio | Without Mortgage | With Mortgage |
| Less than 2.0x | 14 (10.9%) | 94,028 (28,407.2%) |
| 2.0x to 2.9x | 14 (10.9%) | 55 (16.6%) |
| 3.0x to 3.9x | 27 (21.1%) | 84 (25.4%) |
| 4.0x or more | 59 (46.1%) | 67 (20.2%) |
| Total | 128 (100.0%) | 331 (100.0%) |
Real Estate Taxes by Mortgage Status in Harrisville
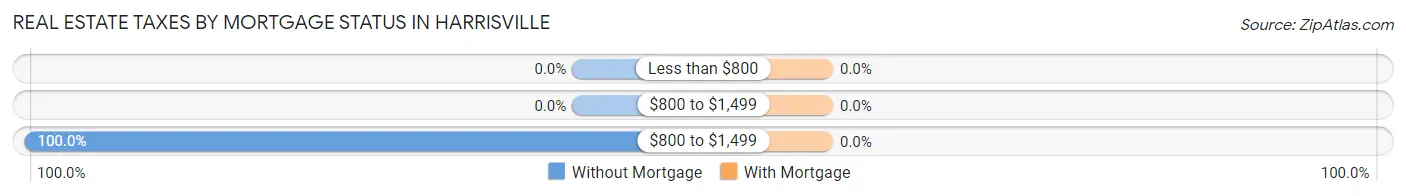
| Property Taxes | Without Mortgage | With Mortgage |
| Less than $800 | 0 (0.0%) | 0 (0.0%) |
| $800 to $1,499 | 0 (0.0%) | 0 (0.0%) |
| $800 to $1,499 | 128 (100.0%) | 0 (0.0%) |
| Total | 128 (100.0%) | 331 (100.0%) |
Health & Disability in Harrisville
Health Insurance Coverage by Age in Harrisville
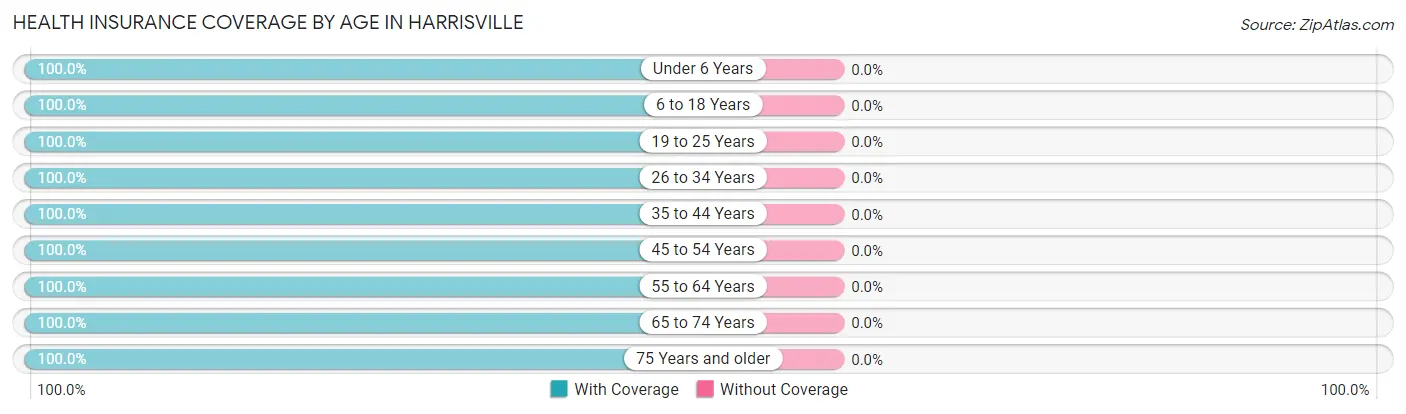
| Age Bracket | With Coverage | Without Coverage |
| Under 6 Years | 75 (100.0%) | 0 (0.0%) |
| 6 to 18 Years | 242 (100.0%) | 0 (0.0%) |
| 19 to 25 Years | 31 (100.0%) | 0 (0.0%) |
| 26 to 34 Years | 174 (100.0%) | 0 (0.0%) |
| 35 to 44 Years | 118 (100.0%) | 0 (0.0%) |
| 45 to 54 Years | 213 (100.0%) | 0 (0.0%) |
| 55 to 64 Years | 220 (100.0%) | 0 (0.0%) |
| 65 to 74 Years | 243 (100.0%) | 0 (0.0%) |
| 75 Years and older | 199 (100.0%) | 0 (0.0%) |
| Total | 1,515 (100.0%) | 0 (0.0%) |
Health Insurance Coverage by Citizenship Status in Harrisville
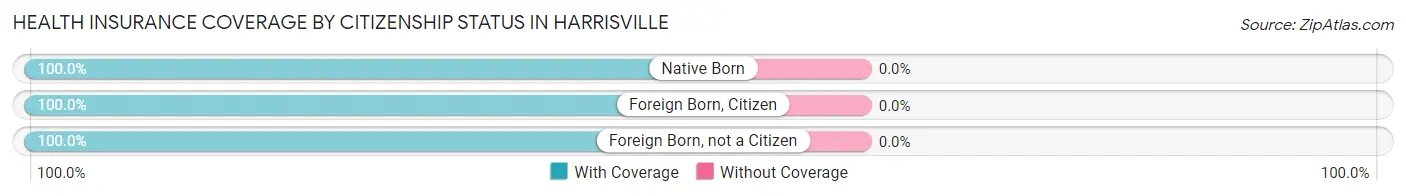
| Citizenship Status | With Coverage | Without Coverage |
| Native Born | 75 (100.0%) | 0 (0.0%) |
| Foreign Born, Citizen | 242 (100.0%) | 0 (0.0%) |
| Foreign Born, not a Citizen | 31 (100.0%) | 0 (0.0%) |
Health Insurance Coverage by Household Income in Harrisville
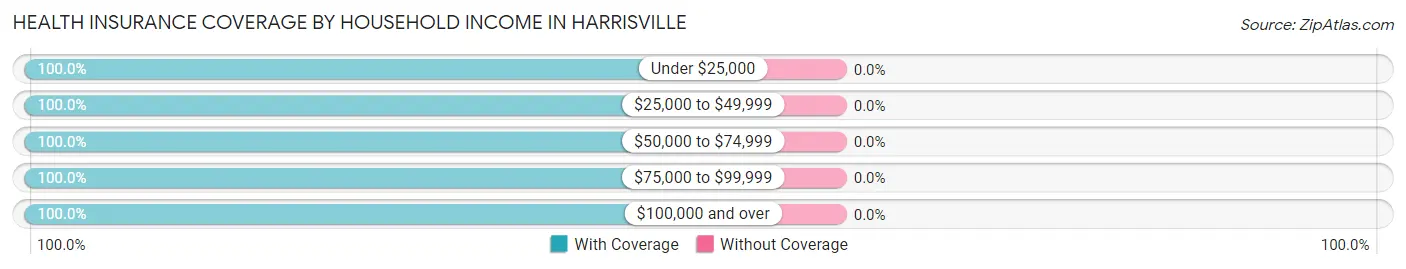
| Household Income | With Coverage | Without Coverage |
| Under $25,000 | 220 (100.0%) | 0 (0.0%) |
| $25,000 to $49,999 | 154 (100.0%) | 0 (0.0%) |
| $50,000 to $74,999 | 83 (100.0%) | 0 (0.0%) |
| $75,000 to $99,999 | 275 (100.0%) | 0 (0.0%) |
| $100,000 and over | 783 (100.0%) | 0 (0.0%) |
Public vs Private Health Insurance Coverage by Age in Harrisville
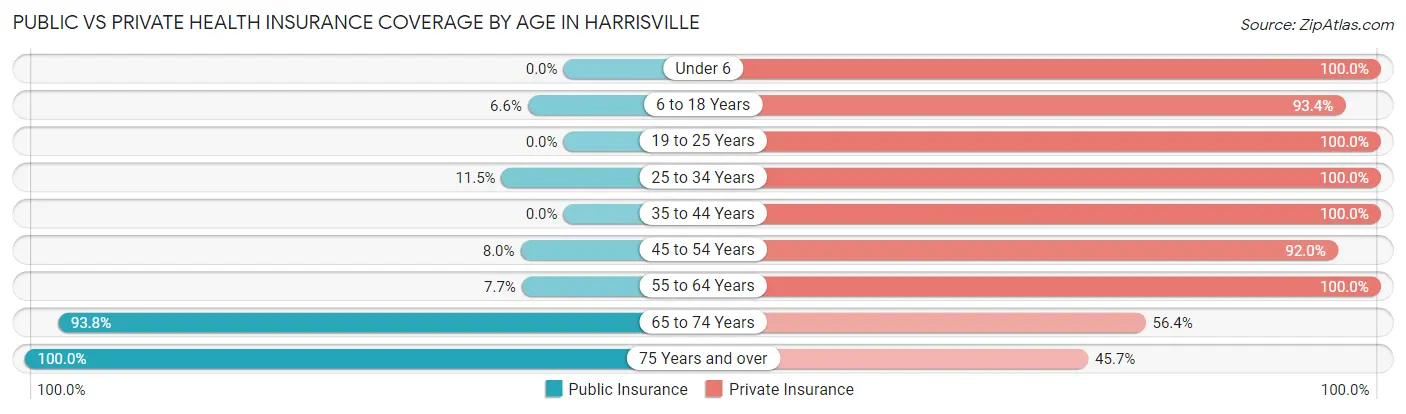
| Age Bracket | Public Insurance | Private Insurance |
| Under 6 | 0 (0.0%) | 75 (100.0%) |
| 6 to 18 Years | 16 (6.6%) | 226 (93.4%) |
| 19 to 25 Years | 0 (0.0%) | 31 (100.0%) |
| 25 to 34 Years | 20 (11.5%) | 174 (100.0%) |
| 35 to 44 Years | 0 (0.0%) | 118 (100.0%) |
| 45 to 54 Years | 17 (8.0%) | 196 (92.0%) |
| 55 to 64 Years | 17 (7.7%) | 220 (100.0%) |
| 65 to 74 Years | 228 (93.8%) | 137 (56.4%) |
| 75 Years and over | 199 (100.0%) | 91 (45.7%) |
| Total | 497 (32.8%) | 1,268 (83.7%) |
Disability Status by Sex by Age in Harrisville
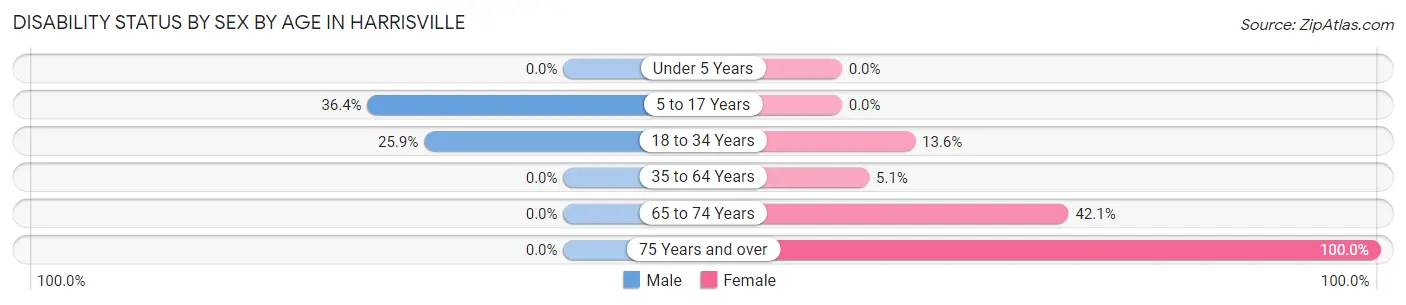
| Age Bracket | Male | Female |
| Under 5 Years | 0 (0.0%) | 0 (0.0%) |
| 5 to 17 Years | 16 (36.4%) | 0 (0.0%) |
| 18 to 34 Years | 15 (25.9%) | 20 (13.6%) |
| 35 to 64 Years | 0 (0.0%) | 17 (5.1%) |
| 65 to 74 Years | 0 (0.0%) | 77 (42.1%) |
| 75 Years and over | 0 (0.0%) | 151 (100.0%) |
Disability Class by Sex by Age in Harrisville
Disability Class: Hearing Difficulty
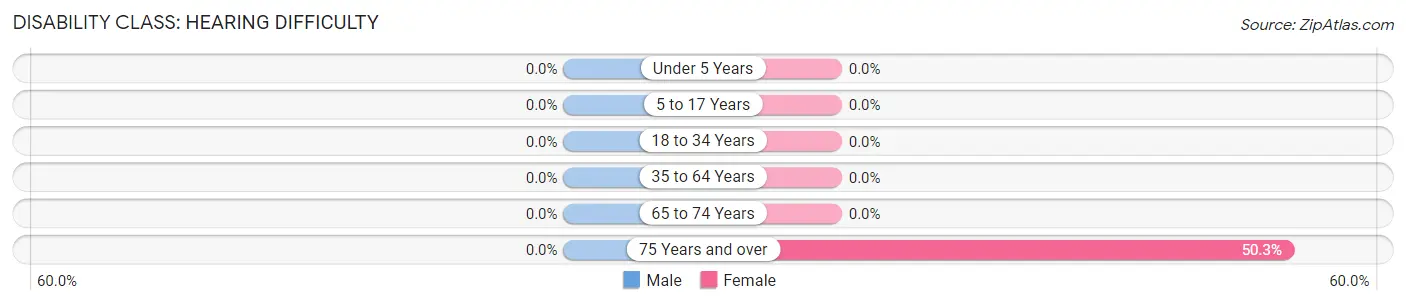
| Age Bracket | Male | Female |
| Under 5 Years | 0 (0.0%) | 0 (0.0%) |
| 5 to 17 Years | 0 (0.0%) | 0 (0.0%) |
| 18 to 34 Years | 0 (0.0%) | 0 (0.0%) |
| 35 to 64 Years | 0 (0.0%) | 0 (0.0%) |
| 65 to 74 Years | 0 (0.0%) | 0 (0.0%) |
| 75 Years and over | 0 (0.0%) | 76 (50.3%) |
Disability Class: Vision Difficulty
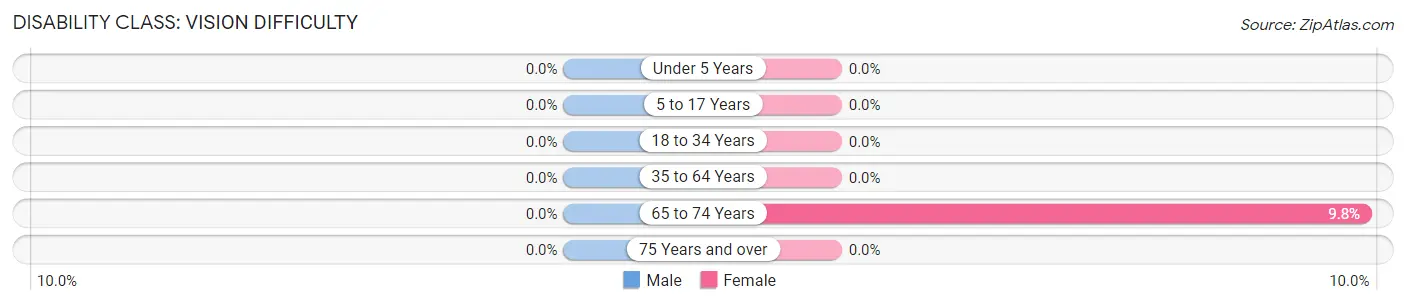
| Age Bracket | Male | Female |
| Under 5 Years | 0 (0.0%) | 0 (0.0%) |
| 5 to 17 Years | 0 (0.0%) | 0 (0.0%) |
| 18 to 34 Years | 0 (0.0%) | 0 (0.0%) |
| 35 to 64 Years | 0 (0.0%) | 0 (0.0%) |
| 65 to 74 Years | 0 (0.0%) | 18 (9.8%) |
| 75 Years and over | 0 (0.0%) | 0 (0.0%) |
Disability Class: Cognitive Difficulty
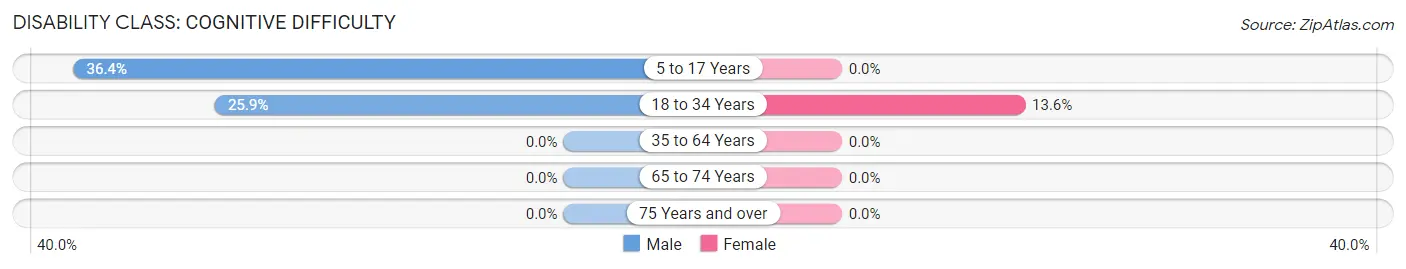
| Age Bracket | Male | Female |
| 5 to 17 Years | 16 (36.4%) | 0 (0.0%) |
| 18 to 34 Years | 15 (25.9%) | 20 (13.6%) |
| 35 to 64 Years | 0 (0.0%) | 0 (0.0%) |
| 65 to 74 Years | 0 (0.0%) | 0 (0.0%) |
| 75 Years and over | 0 (0.0%) | 0 (0.0%) |
Disability Class: Ambulatory Difficulty
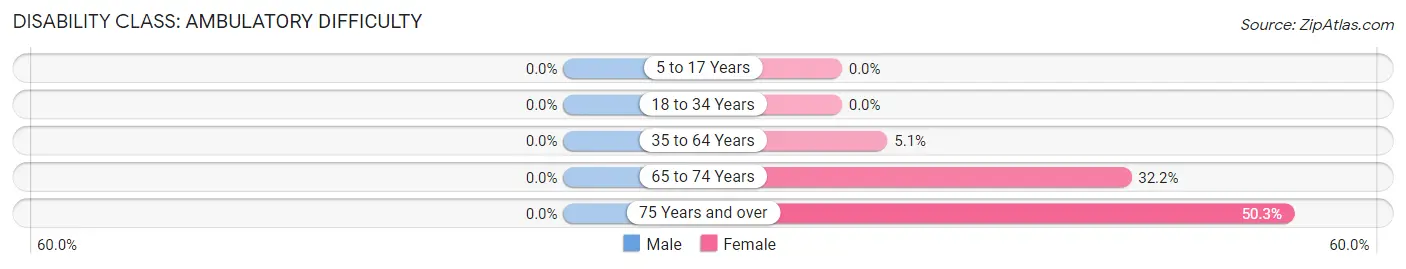
| Age Bracket | Male | Female |
| 5 to 17 Years | 0 (0.0%) | 0 (0.0%) |
| 18 to 34 Years | 0 (0.0%) | 0 (0.0%) |
| 35 to 64 Years | 0 (0.0%) | 17 (5.1%) |
| 65 to 74 Years | 0 (0.0%) | 59 (32.2%) |
| 75 Years and over | 0 (0.0%) | 76 (50.3%) |
Disability Class: Self-Care Difficulty
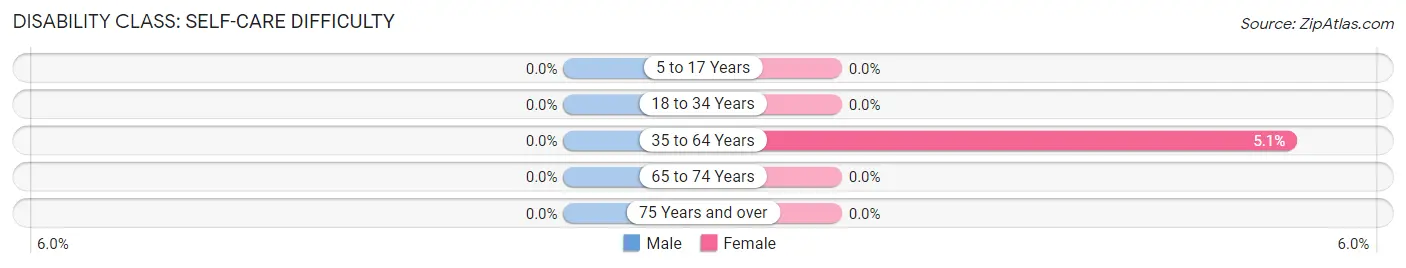
| Age Bracket | Male | Female |
| 5 to 17 Years | 0 (0.0%) | 0 (0.0%) |
| 18 to 34 Years | 0 (0.0%) | 0 (0.0%) |
| 35 to 64 Years | 0 (0.0%) | 17 (5.1%) |
| 65 to 74 Years | 0 (0.0%) | 0 (0.0%) |
| 75 Years and over | 0 (0.0%) | 0 (0.0%) |
Technology Access in Harrisville
Computing Device Access in Harrisville
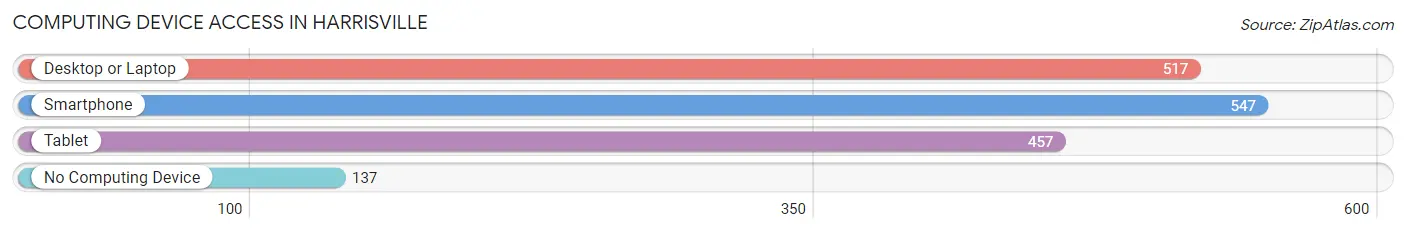
| Device Type | # Households | % Households |
| Desktop or Laptop | 517 | 65.7% |
| Smartphone | 547 | 69.5% |
| Tablet | 457 | 58.1% |
| No Computing Device | 137 | 17.4% |
| Total | 787 | 100.0% |
Internet Access in Harrisville
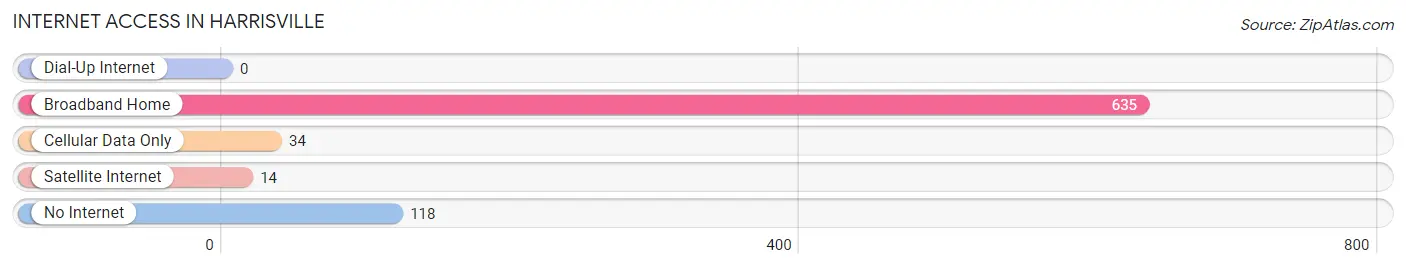
| Internet Type | # Households | % Households |
| Dial-Up Internet | 0 | 0.0% |
| Broadband Home | 635 | 80.7% |
| Cellular Data Only | 34 | 4.3% |
| Satellite Internet | 14 | 1.8% |
| No Internet | 118 | 15.0% |
| Total | 787 | 100.0% |
Harrisville Summary
Harville, Rhode Island is a small town located in the southwestern corner of the state. It is bordered by Connecticut to the west and Massachusetts to the east. The town has a population of just over 1,000 people and is part of the Providence metropolitan area.
History
Harville was first settled in 1686 by a group of English settlers from Massachusetts. The town was originally known as “Harford”, after the first settler, John Harford. The town was officially incorporated in 1730 and changed its name to “Harville” in 1790.
The town was primarily an agricultural community for much of its history. The town was home to several mills, including a grist mill, a saw mill, and a paper mill. The town also had a small fishing industry.
In the late 19th century, the town began to experience a period of growth and development. The town was home to several factories, including a woolen mill, a shoe factory, and a paper mill. The town also had a thriving dairy industry.
Geography
Harville is located in the southwestern corner of Rhode Island. It is bordered by Connecticut to the west and Massachusetts to the east. The town is located in the Blackstone Valley, which is part of the larger Narragansett Bay watershed.
The town is located on the banks of the Blackstone River, which is a major tributary of the Narragansett Bay. The town is also home to several small lakes, including Lake Harford, Lake Nipmuc, and Lake Quinsigamond.
The town is located in a rural area and is surrounded by forests and farmland. The town is located in a hilly region and is home to several small hills, including Mount Tom and Mount Hope.
Economy
Harville’s economy is primarily based on agriculture and tourism. The town is home to several small farms, which produce a variety of crops, including corn, potatoes, and hay. The town is also home to several small businesses, including a few restaurants, a grocery store, and a hardware store.
The town is also home to several tourist attractions, including the Blackstone River Valley National Heritage Corridor, the Blackstone River State Park, and the Blackstone River Bikeway. The town is also home to several historic sites, including the Harford Mill and the Harford House.
Demographics
As of the 2010 census, the town had a population of 1,072 people. The racial makeup of the town was 97.2% White, 0.7% African American, 0.3% Native American, 0.3% Asian, 0.2% from other races, and 1.5% from two or more races. Hispanic or Latino of any race were 1.2% of the population.
The median household income in the town was $50,938, and the median family income was $60,625. The per capita income in the town was $25,945. About 8.2% of families and 10.2% of the population were below the poverty line, including 14.2% of those under age 18 and 5.3% of those age 65 or over.
Common Questions
What is Per Capita Income in Harrisville?
Per Capita income in Harrisville is $38,447.
What is the Median Family Income in Harrisville?
Median Family Income in Harrisville is $123,654.
What is the Median Household income in Harrisville?
Median Household Income in Harrisville is $62,750.
What is Income or Wage Gap in Harrisville?
Income or Wage Gap in Harrisville is 4.8%.
Women in Harrisville earn 95.2 cents for every dollar earned by a man.
What is Inequality or Gini Index in Harrisville?
Inequality or Gini Index in Harrisville is 0.45.
What is the Total Population of Harrisville?
Total Population of Harrisville is 1,515.
What is the Total Male Population of Harrisville?
Total Male Population of Harrisville is 426.
What is the Total Female Population of Harrisville?
Total Female Population of Harrisville is 1,089.
What is the Ratio of Males per 100 Females in Harrisville?
There are 39.12 Males per 100 Females in Harrisville.
What is the Ratio of Females per 100 Males in Harrisville?
There are 255.63 Females per 100 Males in Harrisville.
What is the Median Population Age in Harrisville?
Median Population Age in Harrisville is 52.2 Years.
What is the Average Family Size in Harrisville
Average Family Size in Harrisville is 3.2 People.
What is the Average Household Size in Harrisville
Average Household Size in Harrisville is 1.9 People.
How Large is the Labor Force in Harrisville?
There are 791 People in the Labor Forcein in Harrisville.
What is the Percentage of People in the Labor Force in Harrisville?
63.6% of People are in the Labor Force in Harrisville.
What is the Unemployment Rate in Harrisville?
Unemployment Rate in Harrisville is 5.7%.