Greenville, RI Map & Demographics
Greenville Map
Greenville Overview
$48,602
PER CAPITA INCOME
$124,744
AVG FAMILY INCOME
$92,367
AVG HOUSEHOLD INCOME
15.0%
WAGE / INCOME GAP [ % ]
85.0¢/ $1
WAGE / INCOME GAP [ $ ]
0.41
INEQUALITY / GINI INDEX
8,777
TOTAL POPULATION
4,239
MALE POPULATION
4,538
FEMALE POPULATION
93.41
MALES / 100 FEMALES
107.05
FEMALES / 100 MALES
52.4
MEDIAN AGE
2.8
AVG FAMILY SIZE
2.3
AVG HOUSEHOLD SIZE
4,272
LABOR FORCE [ PEOPLE ]
55.4%
PERCENT IN LABOR FORCE
3.4%
UNEMPLOYMENT RATE
Greenville Zip Codes
Greenville Area Codes
Income in Greenville
Income Overview in Greenville
Per Capita Income in Greenville is $48,602, while median incomes of families and households are $124,744 and $92,367 respectively.
| Characteristic | Number | Measure |
| Per Capita Income | 8,777 | $48,602 |
| Median Family Income | 2,290 | $124,744 |
| Mean Family Income | 2,290 | $140,910 |
| Median Household Income | 3,579 | $92,367 |
| Mean Household Income | 3,579 | $117,110 |
| Income Deficit | 2,290 | $0 |
| Wage / Income Gap (%) | 8,777 | 15.05% |
| Wage / Income Gap ($) | 8,777 | 84.95¢ per $1 |
| Gini / Inequality Index | 8,777 | 0.41 |
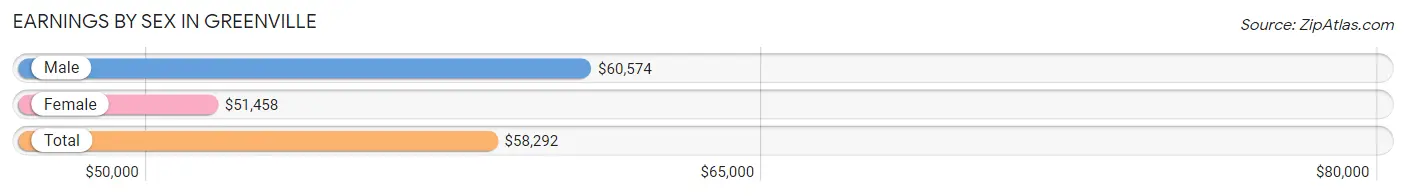
Earnings by Sex in Greenville
Average Earnings in Greenville are $58,292, $60,574 for men and $51,458 for women, a difference of 15.0%.
| Sex | Number | Average Earnings |
| Male | 2,223 (50.1%) | $60,574 |
| Female | 2,217 (49.9%) | $51,458 |
| Total | 4,440 (100.0%) | $58,292 |
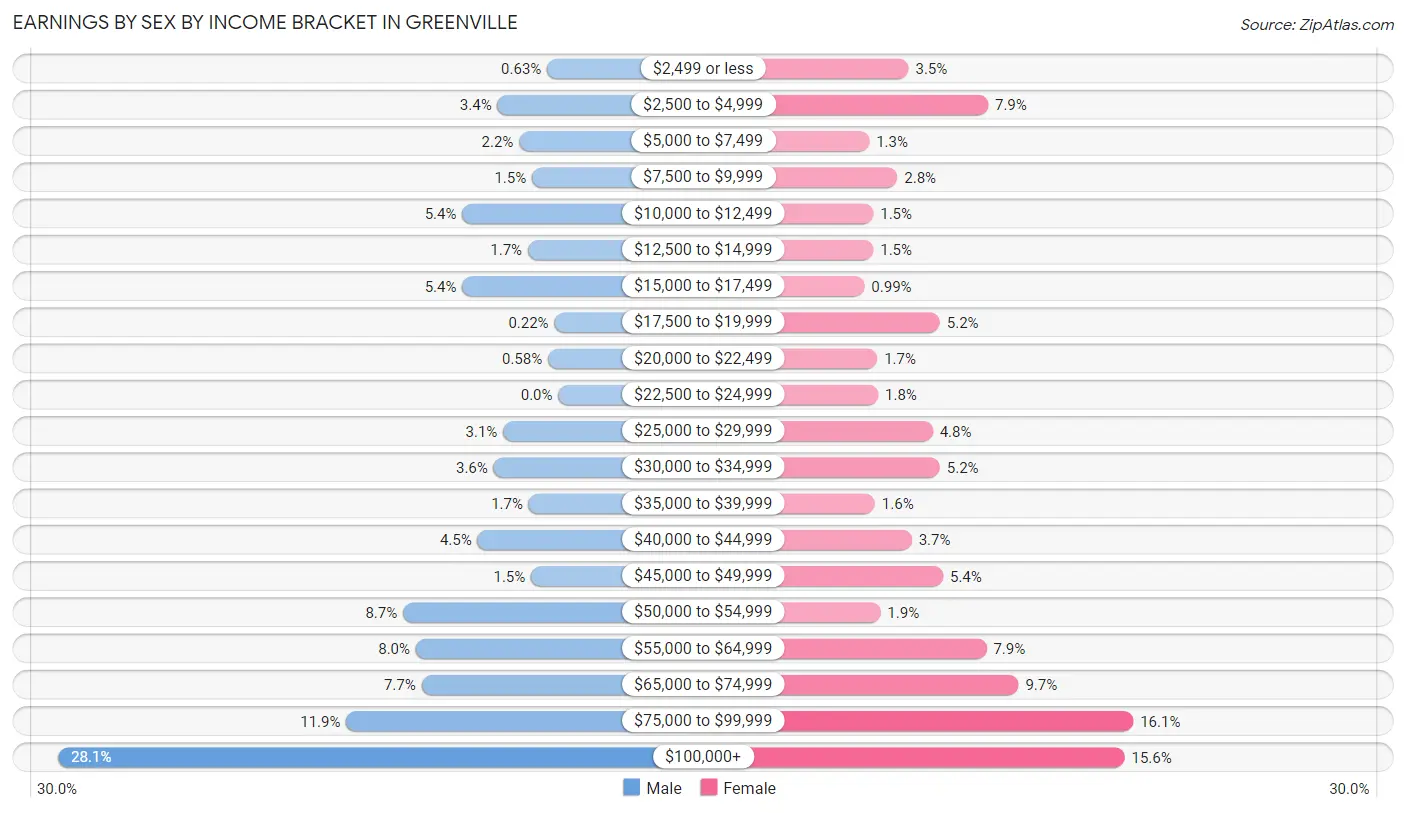
Earnings by Sex by Income Bracket in Greenville
The most common earnings brackets in Greenville are $100,000+ for men (625 | 28.1%) and $75,000 to $99,999 for women (357 | 16.1%).
| Income | Male | Female |
| $2,499 or less | 14 (0.6%) | 77 (3.5%) |
| $2,500 to $4,999 | 76 (3.4%) | 176 (7.9%) |
| $5,000 to $7,499 | 49 (2.2%) | 28 (1.3%) |
| $7,500 to $9,999 | 33 (1.5%) | 63 (2.8%) |
| $10,000 to $12,499 | 120 (5.4%) | 33 (1.5%) |
| $12,500 to $14,999 | 38 (1.7%) | 33 (1.5%) |
| $15,000 to $17,499 | 120 (5.4%) | 22 (1.0%) |
| $17,500 to $19,999 | 5 (0.2%) | 116 (5.2%) |
| $20,000 to $22,499 | 13 (0.6%) | 38 (1.7%) |
| $22,500 to $24,999 | 0 (0.0%) | 39 (1.8%) |
| $25,000 to $29,999 | 69 (3.1%) | 107 (4.8%) |
| $30,000 to $34,999 | 81 (3.6%) | 116 (5.2%) |
| $35,000 to $39,999 | 37 (1.7%) | 35 (1.6%) |
| $40,000 to $44,999 | 101 (4.5%) | 81 (3.6%) |
| $45,000 to $49,999 | 34 (1.5%) | 120 (5.4%) |
| $50,000 to $54,999 | 194 (8.7%) | 42 (1.9%) |
| $55,000 to $64,999 | 178 (8.0%) | 174 (7.9%) |
| $65,000 to $74,999 | 171 (7.7%) | 214 (9.7%) |
| $75,000 to $99,999 | 265 (11.9%) | 357 (16.1%) |
| $100,000+ | 625 (28.1%) | 346 (15.6%) |
| Total | 2,223 (100.0%) | 2,217 (100.0%) |
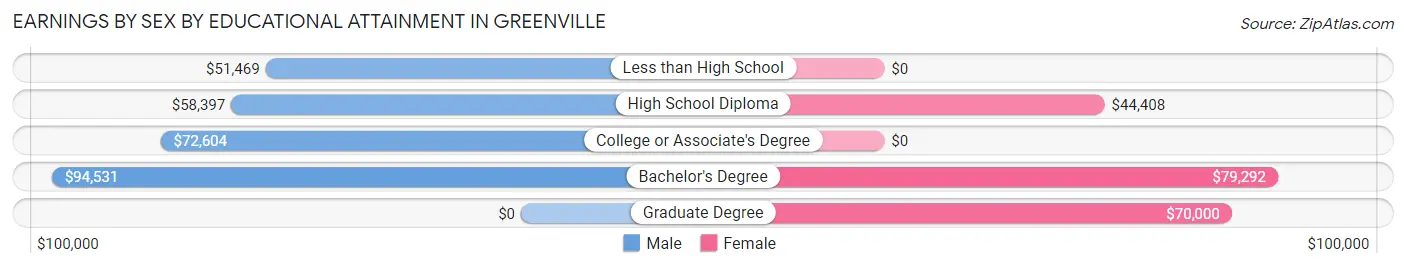
Earnings by Sex by Educational Attainment in Greenville
Average earnings in Greenville are $67,857 for men and $59,802 for women, a difference of 11.9%. Men with an educational attainment of bachelor's degree enjoy the highest average annual earnings of $94,531, while those with less than high school education earn the least with $51,469. Women with an educational attainment of bachelor's degree earn the most with the average annual earnings of $79,292, while those with high school diploma education have the smallest earnings of $44,408.
| Educational Attainment | Male Income | Female Income |
| Less than High School | $51,469 | $0 |
| High School Diploma | $58,397 | $44,408 |
| College or Associate's Degree | $72,604 | $0 |
| Bachelor's Degree | $94,531 | $79,292 |
| Graduate Degree | - | - |
| Total | $67,857 | $59,802 |
Family Income in Greenville
Family Income Brackets in Greenville
According to the Greenville family income data, there are 572 families falling into the $150,000 to $199,999 income range, which is the most common income bracket and makes up 25.0% of all families. Conversely, the $10,000 to $14,999 income bracket is the least frequent group with only 14 families (0.6%) belonging to this category.
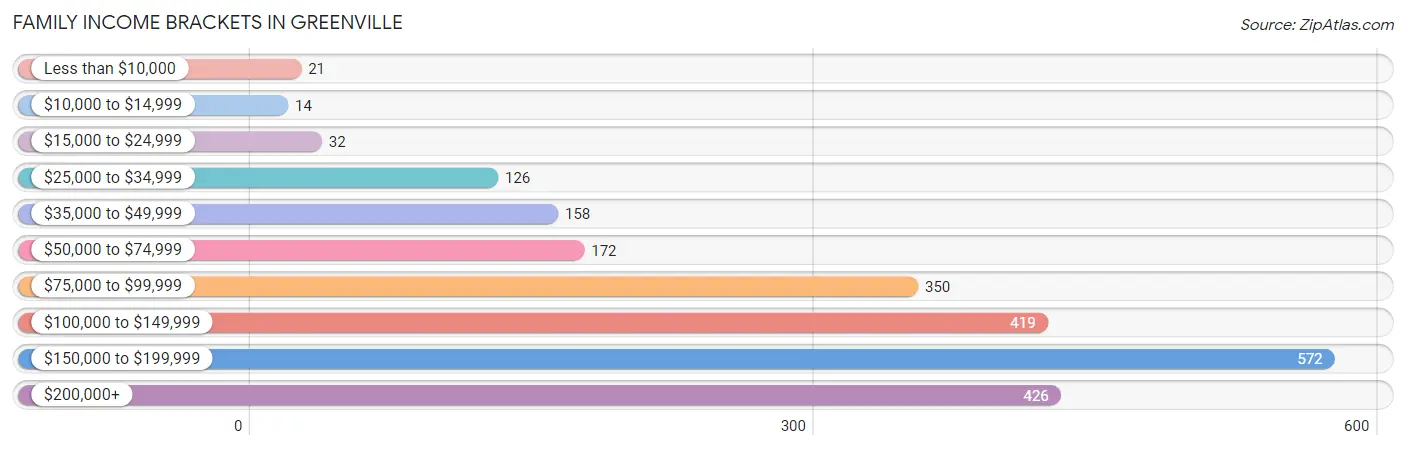
| Income Bracket | # Families | % Families |
| Less than $10,000 | 21 | 0.9% |
| $10,000 to $14,999 | 14 | 0.6% |
| $15,000 to $24,999 | 32 | 1.4% |
| $25,000 to $34,999 | 126 | 5.5% |
| $35,000 to $49,999 | 158 | 6.9% |
| $50,000 to $74,999 | 172 | 7.5% |
| $75,000 to $99,999 | 350 | 15.3% |
| $100,000 to $149,999 | 419 | 18.3% |
| $150,000 to $199,999 | 572 | 25.0% |
| $200,000+ | 426 | 18.6% |
Family Income by Famaliy Size in Greenville
3-person families (465 | 20.3%) account for the highest median family income in Greenville with $190,665 per family, while 3-person families (465 | 20.3%) have the highest median income of $63,555 per family member.
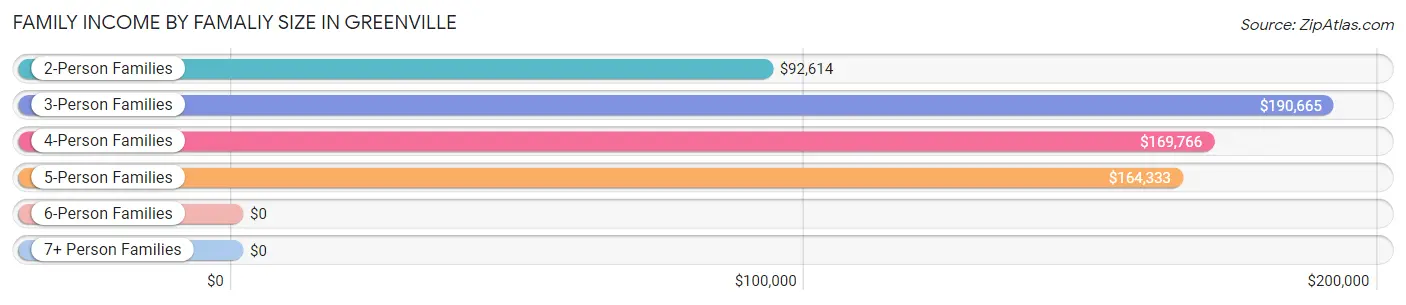
| Income Bracket | # Families | Median Income |
| 2-Person Families | 1,305 (57.0%) | $92,614 |
| 3-Person Families | 465 (20.3%) | $190,665 |
| 4-Person Families | 335 (14.6%) | $169,766 |
| 5-Person Families | 160 (7.0%) | $164,333 |
| 6-Person Families | 7 (0.3%) | $0 |
| 7+ Person Families | 18 (0.8%) | $0 |
| Total | 2,290 (100.0%) | $124,744 |
Family Income by Number of Earners in Greenville
The median family income in Greenville is $124,744, with families comprising 3+ earners (323) having the highest median family income of $193,109, while families with no earners (500) have the lowest median family income of $62,917, accounting for 14.1% and 21.8% of families, respectively.
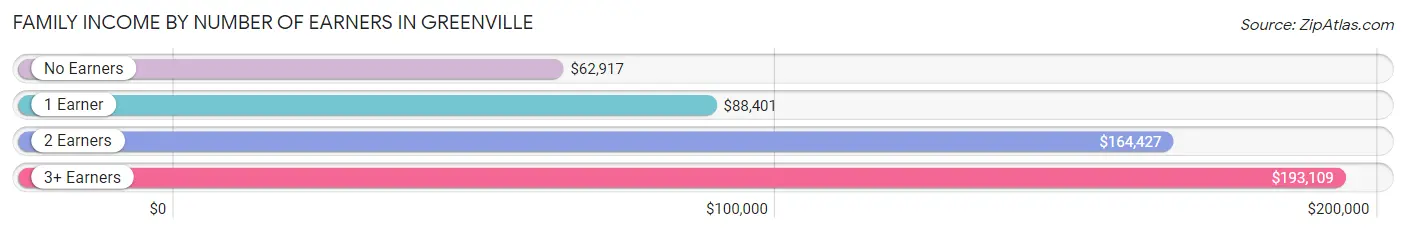
| Number of Earners | # Families | Median Income |
| No Earners | 500 (21.8%) | $62,917 |
| 1 Earner | 568 (24.8%) | $88,401 |
| 2 Earners | 899 (39.3%) | $164,427 |
| 3+ Earners | 323 (14.1%) | $193,109 |
| Total | 2,290 (100.0%) | $124,744 |
Household Income in Greenville
Household Income Brackets in Greenville
With 637 households falling in the category, the $150,000 to $199,999 income range is the most frequent in Greenville, accounting for 17.8% of all households. In contrast, only 57 households (1.6%) fall into the $10,000 to $14,999 income bracket, making it the least populous group.
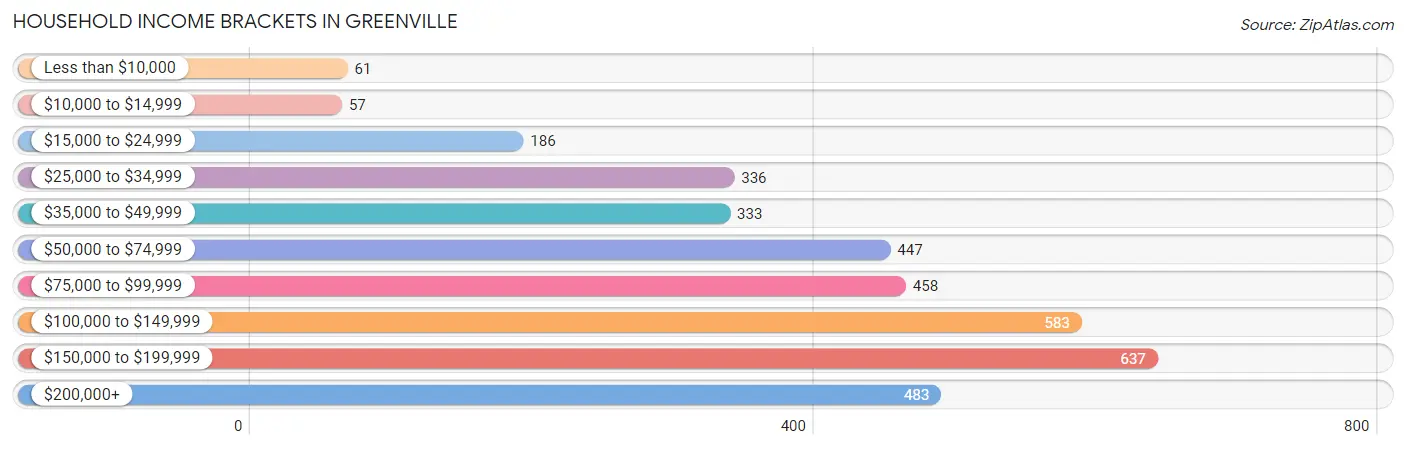
| Income Bracket | # Households | % Households |
| Less than $10,000 | 61 | 1.7% |
| $10,000 to $14,999 | 57 | 1.6% |
| $15,000 to $24,999 | 186 | 5.2% |
| $25,000 to $34,999 | 336 | 9.4% |
| $35,000 to $49,999 | 333 | 9.3% |
| $50,000 to $74,999 | 447 | 12.5% |
| $75,000 to $99,999 | 458 | 12.8% |
| $100,000 to $149,999 | 583 | 16.3% |
| $150,000 to $199,999 | 637 | 17.8% |
| $200,000+ | 483 | 13.5% |
Household Income by Householder Age in Greenville
The median household income in Greenville is $92,367, with the highest median household income of $143,000 found in the 45 to 64 years age bracket for the primary householder. A total of 1,278 households (35.7%) fall into this category. Meanwhile, the 65+ years age bracket for the primary householder has the lowest median household income of $54,839, with 1,522 households (42.5%) in this group.
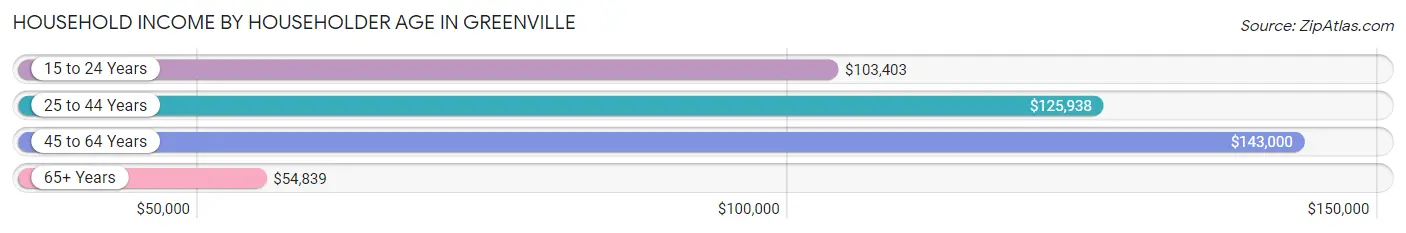
| Income Bracket | # Households | Median Income |
| 15 to 24 Years | 66 (1.8%) | $103,403 |
| 25 to 44 Years | 713 (19.9%) | $125,938 |
| 45 to 64 Years | 1,278 (35.7%) | $143,000 |
| 65+ Years | 1,522 (42.5%) | $54,839 |
| Total | 3,579 (100.0%) | $92,367 |
Poverty in Greenville
Income Below Poverty by Sex and Age in Greenville
With 3.8% poverty level for males and 3.7% for females among the residents of Greenville, 25 to 34 year old males and under 5 year old females are the most vulnerable to poverty, with 53 males (10.1%) and 17 females (11.1%) in their respective age groups living below the poverty level.
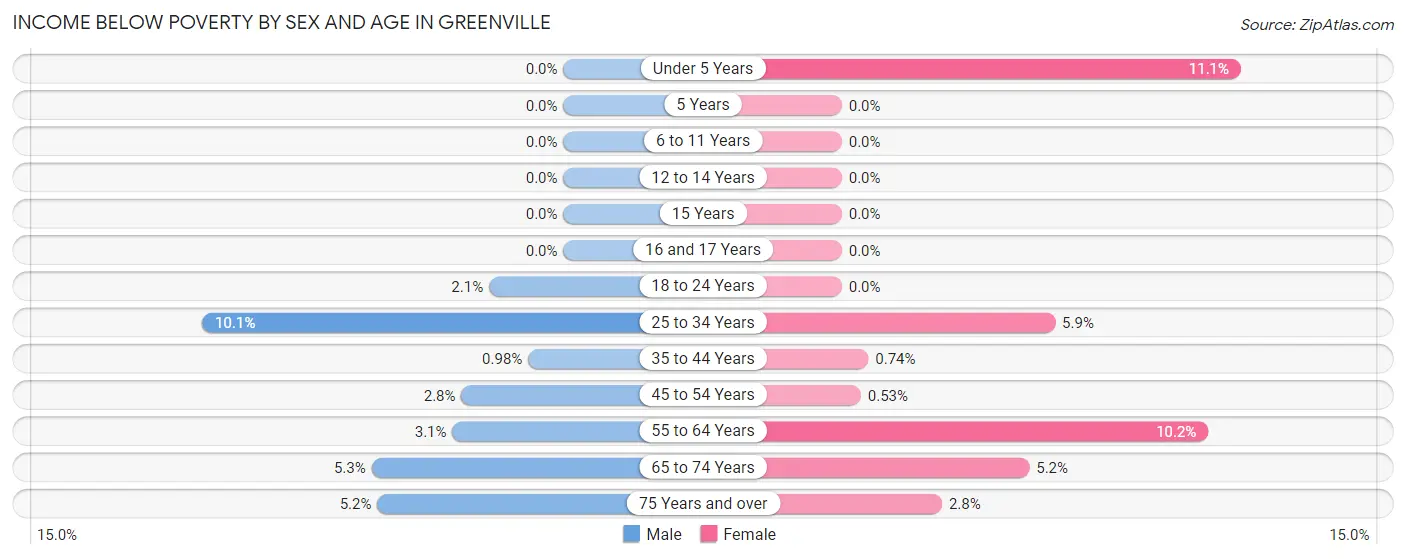
| Age Bracket | Male | Female |
| Under 5 Years | 0 (0.0%) | 17 (11.1%) |
| 5 Years | 0 (0.0%) | 0 (0.0%) |
| 6 to 11 Years | 0 (0.0%) | 0 (0.0%) |
| 12 to 14 Years | 0 (0.0%) | 0 (0.0%) |
| 15 Years | 0 (0.0%) | 0 (0.0%) |
| 16 and 17 Years | 0 (0.0%) | 0 (0.0%) |
| 18 to 24 Years | 8 (2.1%) | 0 (0.0%) |
| 25 to 34 Years | 53 (10.1%) | 26 (5.9%) |
| 35 to 44 Years | 3 (1.0%) | 3 (0.7%) |
| 45 to 54 Years | 13 (2.8%) | 3 (0.5%) |
| 55 to 64 Years | 21 (3.1%) | 57 (10.2%) |
| 65 to 74 Years | 23 (5.3%) | 27 (5.2%) |
| 75 Years and over | 31 (5.2%) | 22 (2.8%) |
| Total | 152 (3.8%) | 155 (3.7%) |
Income Above Poverty by Sex and Age in Greenville
According to the poverty statistics in Greenville, males aged under 5 years and females aged 5 years are the age groups that are most secure financially, with 100.0% of males and 100.0% of females in these age groups living above the poverty line.
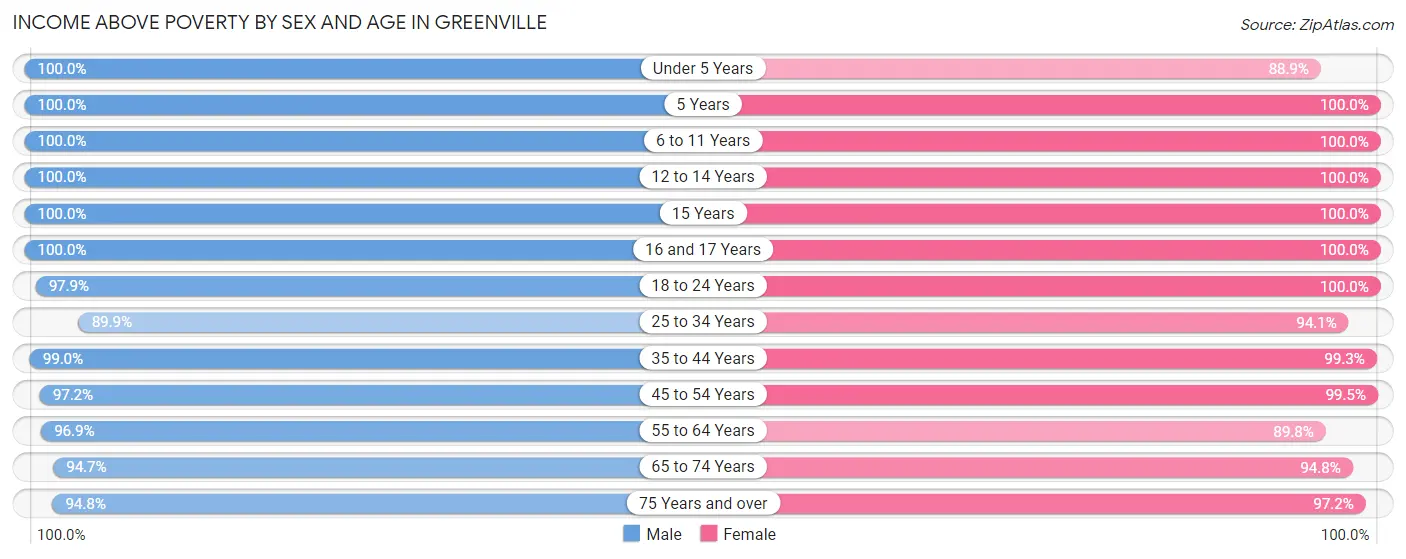
| Age Bracket | Male | Female |
| Under 5 Years | 136 (100.0%) | 136 (88.9%) |
| 5 Years | 15 (100.0%) | 38 (100.0%) |
| 6 to 11 Years | 198 (100.0%) | 200 (100.0%) |
| 12 to 14 Years | 99 (100.0%) | 147 (100.0%) |
| 15 Years | 47 (100.0%) | 21 (100.0%) |
| 16 and 17 Years | 114 (100.0%) | 207 (100.0%) |
| 18 to 24 Years | 379 (97.9%) | 108 (100.0%) |
| 25 to 34 Years | 474 (89.9%) | 412 (94.1%) |
| 35 to 44 Years | 304 (99.0%) | 402 (99.3%) |
| 45 to 54 Years | 444 (97.2%) | 564 (99.5%) |
| 55 to 64 Years | 658 (96.9%) | 502 (89.8%) |
| 65 to 74 Years | 408 (94.7%) | 490 (94.8%) |
| 75 Years and over | 568 (94.8%) | 766 (97.2%) |
| Total | 3,844 (96.2%) | 3,993 (96.3%) |
Income Below Poverty Among Married-Couple Families in Greenville
The poverty statistics for married-couple families in Greenville show that 2.6% or 52 of the total 1,987 families live below the poverty line. Families with no children have the highest poverty rate of 3.9%, comprising of 52 families. On the other hand, families with 1 or 2 children have the lowest poverty rate of 0.0%, which includes 0 families.
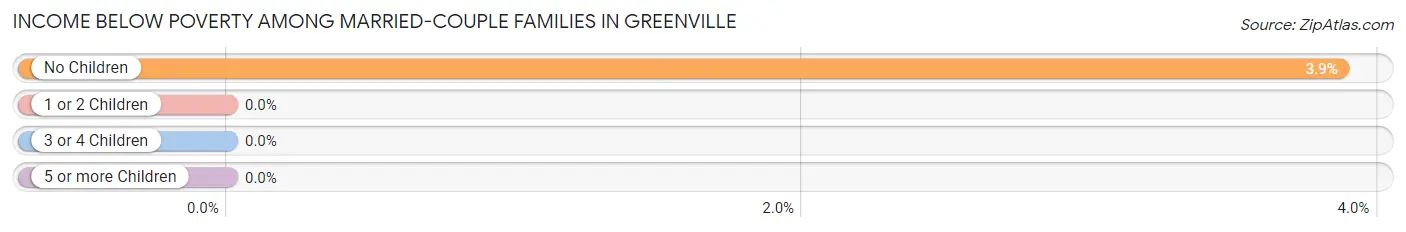
| Children | Above Poverty | Below Poverty |
| No Children | 1,292 (96.1%) | 52 (3.9%) |
| 1 or 2 Children | 600 (100.0%) | 0 (0.0%) |
| 3 or 4 Children | 43 (100.0%) | 0 (0.0%) |
| 5 or more Children | 0 (0.0%) | 0 (0.0%) |
| Total | 1,935 (97.4%) | 52 (2.6%) |
Income Below Poverty Among Single-Parent Households in Greenville
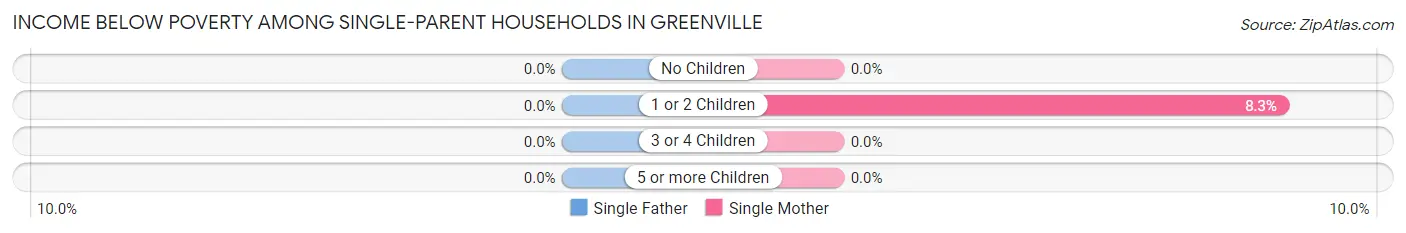
| Children | Single Father | Single Mother |
| No Children | 0 (0.0%) | 0 (0.0%) |
| 1 or 2 Children | 0 (0.0%) | 15 (8.3%) |
| 3 or 4 Children | 0 (0.0%) | 0 (0.0%) |
| 5 or more Children | 0 (0.0%) | 0 (0.0%) |
| Total | 0 (0.0%) | 15 (5.6%) |
Income Below Poverty Among Married-Couple vs Single-Parent Households in Greenville
The poverty data for Greenville shows that 52 of the married-couple family households (2.6%) and 15 of the single-parent households (5.0%) are living below the poverty level. Within the married-couple family households, those with no children have the highest poverty rate, with 52 households (3.9%) falling below the poverty line. Among the single-parent households, those with 1 or 2 children have the highest poverty rate, with 15 household (8.3%) living below poverty.
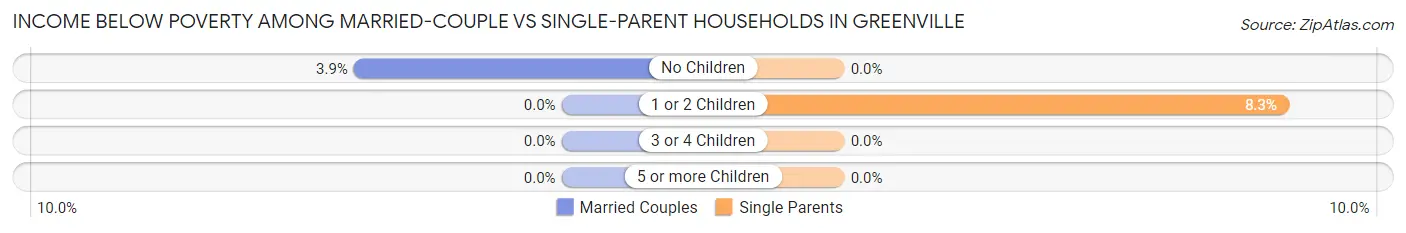
| Children | Married-Couple Families | Single-Parent Households |
| No Children | 52 (3.9%) | 0 (0.0%) |
| 1 or 2 Children | 0 (0.0%) | 15 (8.3%) |
| 3 or 4 Children | 0 (0.0%) | 0 (0.0%) |
| 5 or more Children | 0 (0.0%) | 0 (0.0%) |
| Total | 52 (2.6%) | 15 (5.0%) |
Race in Greenville
The most populous races in Greenville are White / Caucasian (8,162 | 93.0%), Hispanic or Latino (443 | 5.1%), and Two or more Races (263 | 3.0%).
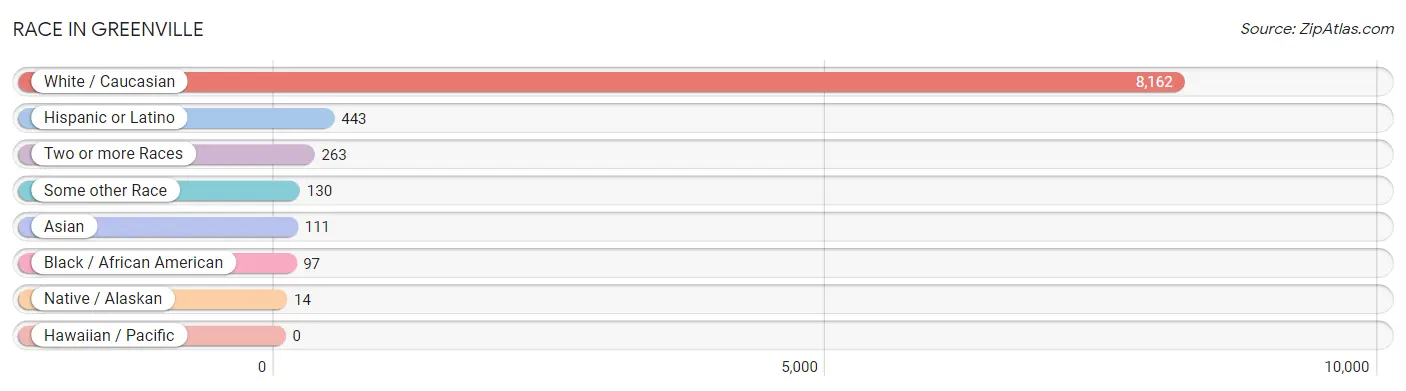
| Race | # Population | % Population |
| Asian | 111 | 1.3% |
| Black / African American | 97 | 1.1% |
| Hawaiian / Pacific | 0 | 0.0% |
| Hispanic or Latino | 443 | 5.1% |
| Native / Alaskan | 14 | 0.2% |
| White / Caucasian | 8,162 | 93.0% |
| Two or more Races | 263 | 3.0% |
| Some other Race | 130 | 1.5% |
| Total | 8,777 | 100.0% |
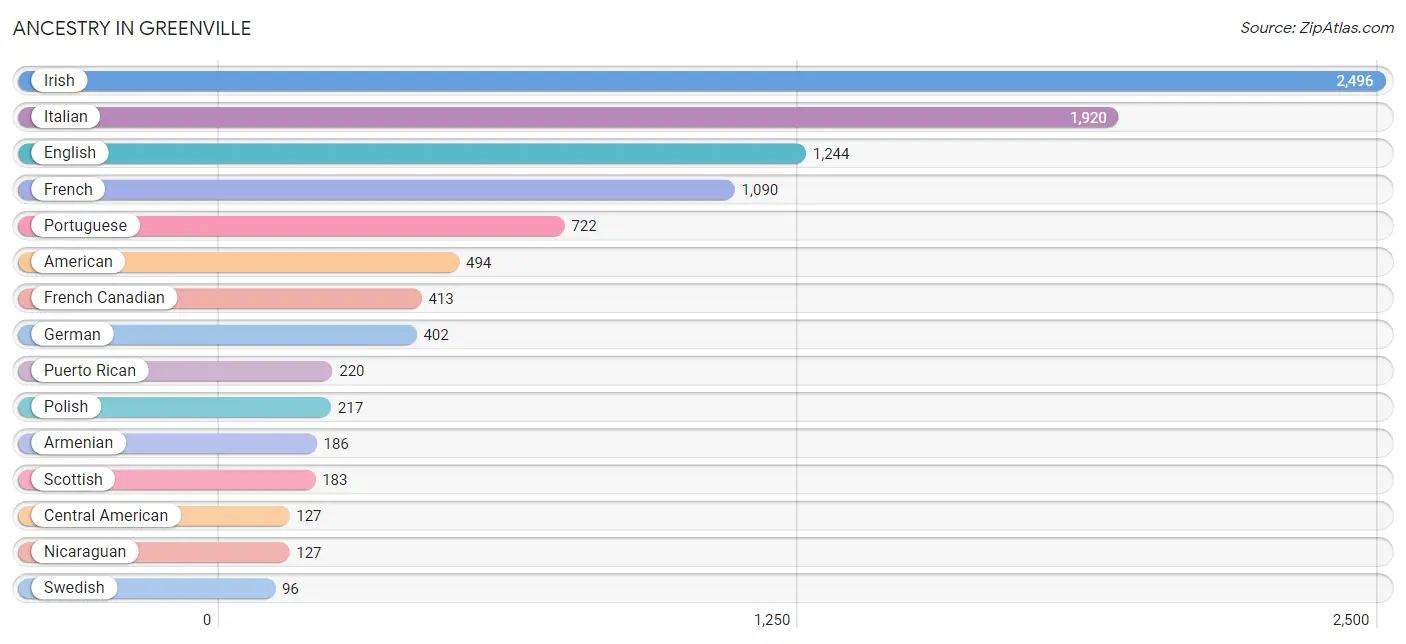
Ancestry in Greenville
The most populous ancestries reported in Greenville are Irish (2,496 | 28.4%), Italian (1,920 | 21.9%), English (1,244 | 14.2%), French (1,090 | 12.4%), and Portuguese (722 | 8.2%), together accounting for 85.1% of all Greenville residents.
| Ancestry | # Population | % Population |
| American | 494 | 5.6% |
| Arab | 89 | 1.0% |
| Armenian | 186 | 2.1% |
| Bolivian | 14 | 0.2% |
| Brazilian | 34 | 0.4% |
| Bulgarian | 7 | 0.1% |
| Canadian | 49 | 0.6% |
| Cape Verdean | 32 | 0.4% |
| Central American | 127 | 1.5% |
| Croatian | 7 | 0.1% |
| Czech | 40 | 0.5% |
| Dutch | 43 | 0.5% |
| Eastern European | 13 | 0.2% |
| English | 1,244 | 14.2% |
| European | 20 | 0.2% |
| Finnish | 9 | 0.1% |
| French | 1,090 | 12.4% |
| French Canadian | 413 | 4.7% |
| German | 402 | 4.6% |
| Greek | 69 | 0.8% |
| Hungarian | 30 | 0.3% |
| Indian (Asian) | 65 | 0.7% |
| Irish | 2,496 | 28.4% |
| Italian | 1,920 | 21.9% |
| Japanese | 10 | 0.1% |
| Korean | 39 | 0.4% |
| Lebanese | 66 | 0.7% |
| Mexican | 31 | 0.4% |
| Nicaraguan | 127 | 1.5% |
| Northern European | 2 | 0.0% |
| Polish | 217 | 2.5% |
| Portuguese | 722 | 8.2% |
| Puerto Rican | 220 | 2.5% |
| Russian | 17 | 0.2% |
| Scandinavian | 7 | 0.1% |
| Scotch-Irish | 17 | 0.2% |
| Scottish | 183 | 2.1% |
| Slovak | 9 | 0.1% |
| South American | 14 | 0.2% |
| Spanish | 16 | 0.2% |
| Subsaharan African | 32 | 0.4% |
| Swedish | 96 | 1.1% |
| Syrian | 23 | 0.3% |
| Thai | 36 | 0.4% |
| Ukrainian | 22 | 0.3% |
| Welsh | 16 | 0.2% | View All 46 Rows |
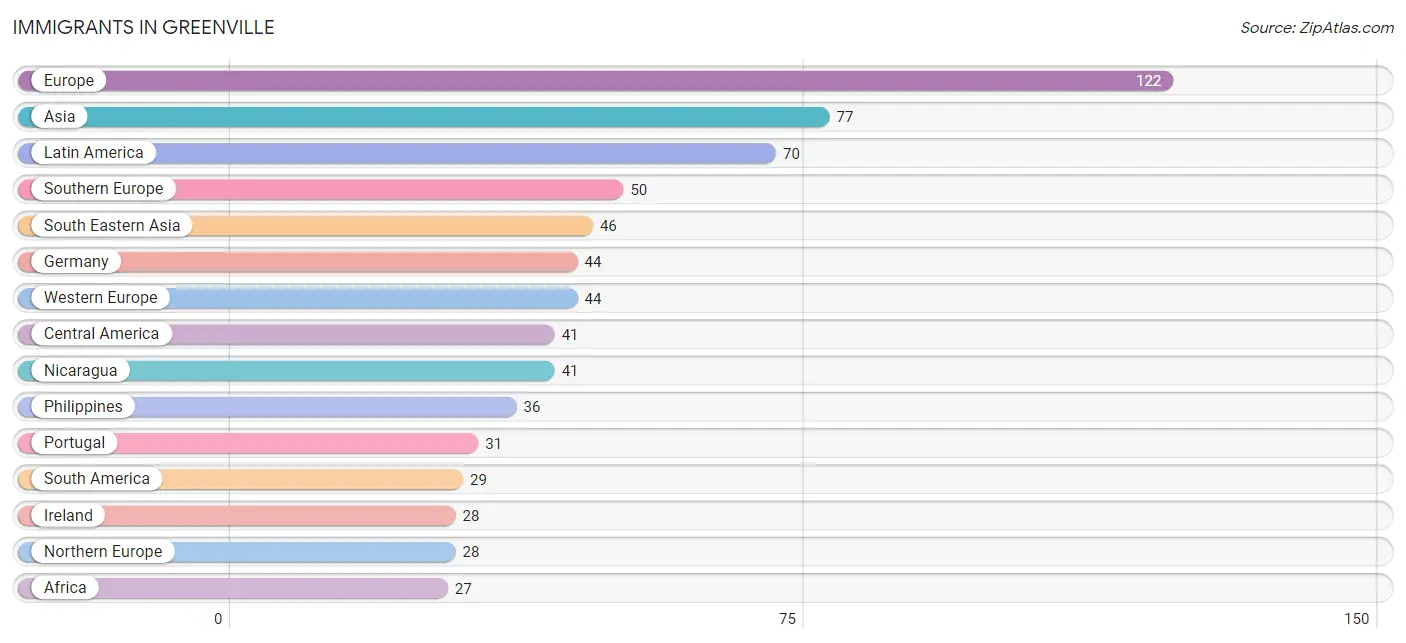
Immigrants in Greenville
The most numerous immigrant groups reported in Greenville came from Europe (122 | 1.4%), Asia (77 | 0.9%), Latin America (70 | 0.8%), Southern Europe (50 | 0.6%), and South Eastern Asia (46 | 0.5%), together accounting for 4.2% of all Greenville residents.
| Immigration Origin | # Population | % Population |
| Africa | 27 | 0.3% |
| Asia | 77 | 0.9% |
| Bolivia | 14 | 0.2% |
| Brazil | 15 | 0.2% |
| Cabo Verde | 27 | 0.3% |
| Cambodia | 10 | 0.1% |
| Central America | 41 | 0.5% |
| China | 15 | 0.2% |
| Eastern Asia | 15 | 0.2% |
| Europe | 122 | 1.4% |
| Germany | 44 | 0.5% |
| Ireland | 28 | 0.3% |
| Italy | 19 | 0.2% |
| Latin America | 70 | 0.8% |
| Nicaragua | 41 | 0.5% |
| Northern Europe | 28 | 0.3% |
| Philippines | 36 | 0.4% |
| Portugal | 31 | 0.4% |
| South America | 29 | 0.3% |
| South Eastern Asia | 46 | 0.5% |
| Southern Europe | 50 | 0.6% |
| Syria | 16 | 0.2% |
| Western Africa | 27 | 0.3% |
| Western Asia | 16 | 0.2% |
| Western Europe | 44 | 0.5% | View All 25 Rows |
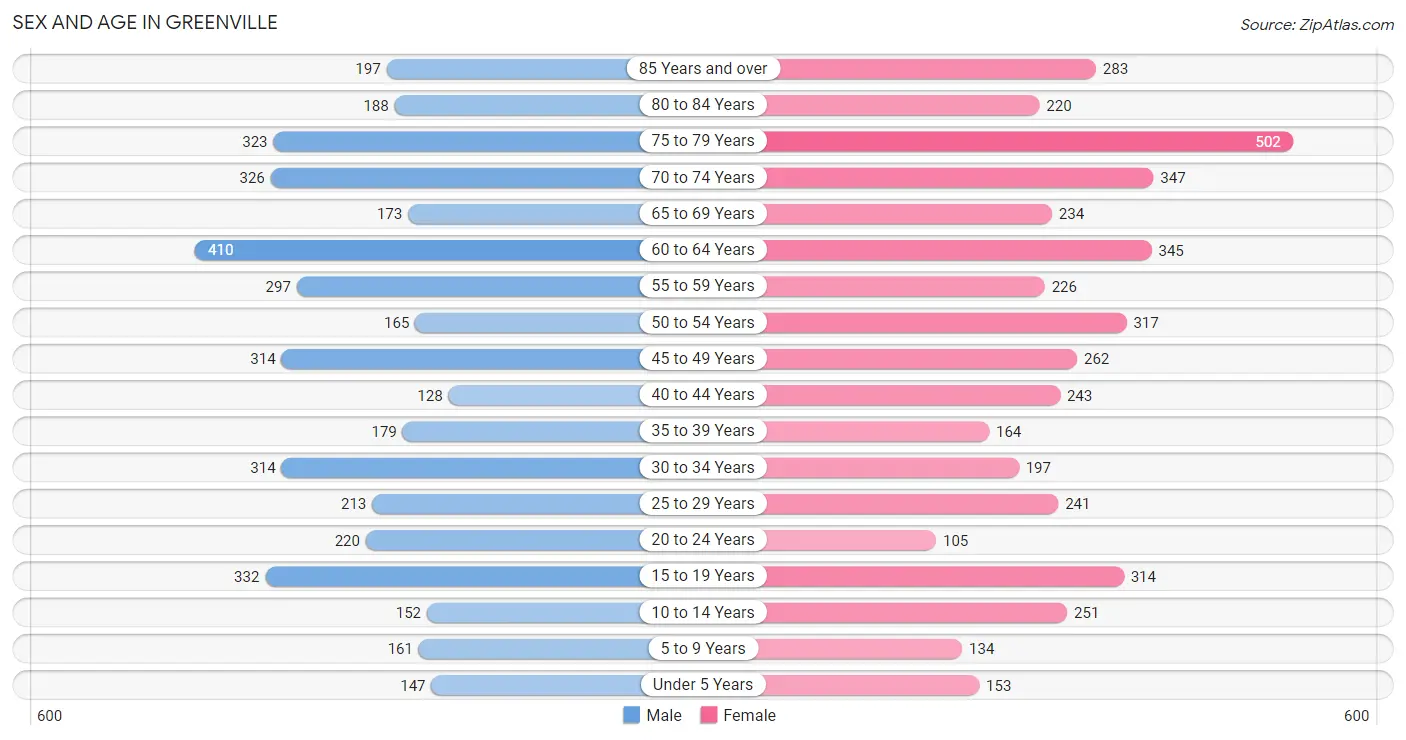
Sex and Age in Greenville
Sex and Age in Greenville
The most populous age groups in Greenville are 60 to 64 Years (410 | 9.7%) for men and 75 to 79 Years (502 | 11.1%) for women.
| Age Bracket | Male | Female |
| Under 5 Years | 147 (3.5%) | 153 (3.4%) |
| 5 to 9 Years | 161 (3.8%) | 134 (2.9%) |
| 10 to 14 Years | 152 (3.6%) | 251 (5.5%) |
| 15 to 19 Years | 332 (7.8%) | 314 (6.9%) |
| 20 to 24 Years | 220 (5.2%) | 105 (2.3%) |
| 25 to 29 Years | 213 (5.0%) | 241 (5.3%) |
| 30 to 34 Years | 314 (7.4%) | 197 (4.3%) |
| 35 to 39 Years | 179 (4.2%) | 164 (3.6%) |
| 40 to 44 Years | 128 (3.0%) | 243 (5.3%) |
| 45 to 49 Years | 314 (7.4%) | 262 (5.8%) |
| 50 to 54 Years | 165 (3.9%) | 317 (7.0%) |
| 55 to 59 Years | 297 (7.0%) | 226 (5.0%) |
| 60 to 64 Years | 410 (9.7%) | 345 (7.6%) |
| 65 to 69 Years | 173 (4.1%) | 234 (5.2%) |
| 70 to 74 Years | 326 (7.7%) | 347 (7.6%) |
| 75 to 79 Years | 323 (7.6%) | 502 (11.1%) |
| 80 to 84 Years | 188 (4.4%) | 220 (4.9%) |
| 85 Years and over | 197 (4.6%) | 283 (6.2%) |
| Total | 4,239 (100.0%) | 4,538 (100.0%) |
Families and Households in Greenville
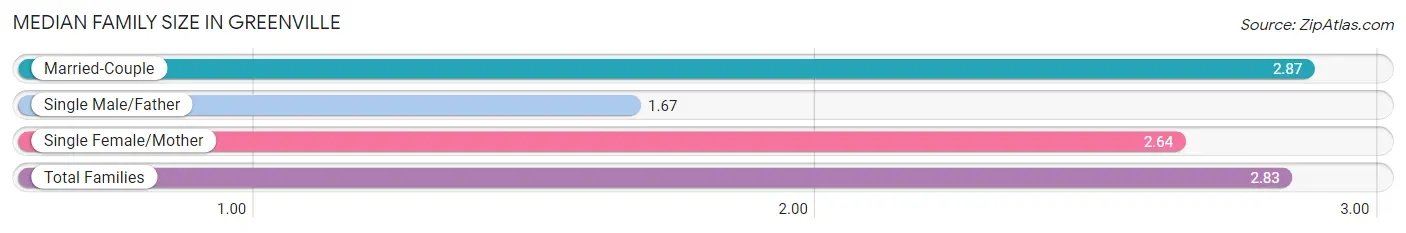
Median Family Size in Greenville
The median family size in Greenville is 2.83 persons per family, with married-couple families (1,987 | 86.8%) accounting for the largest median family size of 2.87 persons per family. On the other hand, single male/father families (36 | 1.6%) represent the smallest median family size with 1.67 persons per family.
| Family Type | # Families | Family Size |
| Married-Couple | 1,987 (86.8%) | 2.87 |
| Single Male/Father | 36 (1.6%) | 1.67 |
| Single Female/Mother | 267 (11.7%) | 2.64 |
| Total Families | 2,290 (100.0%) | 2.83 |
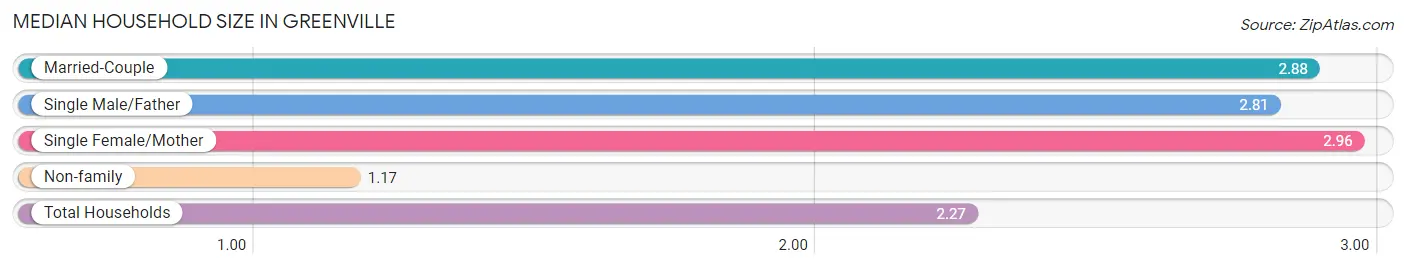
Median Household Size in Greenville
The median household size in Greenville is 2.27 persons per household, with single female/mother households (267 | 7.5%) accounting for the largest median household size of 2.96 persons per household. non-family households (1,289 | 36.0%) represent the smallest median household size with 1.17 persons per household.
| Household Type | # Households | Household Size |
| Married-Couple | 1,987 (55.5%) | 2.88 |
| Single Male/Father | 36 (1.0%) | 2.81 |
| Single Female/Mother | 267 (7.5%) | 2.96 |
| Non-family | 1,289 (36.0%) | 1.17 |
| Total Households | 3,579 (100.0%) | 2.27 |
Household Size by Marriage Status in Greenville
Out of a total of 3,579 households in Greenville, 2,290 (64.0%) are family households, while 1,289 (36.0%) are nonfamily households. The most numerous type of family households are 2-person households, comprising 1,196, and the most common type of nonfamily households are 1-person households, comprising 1,067.
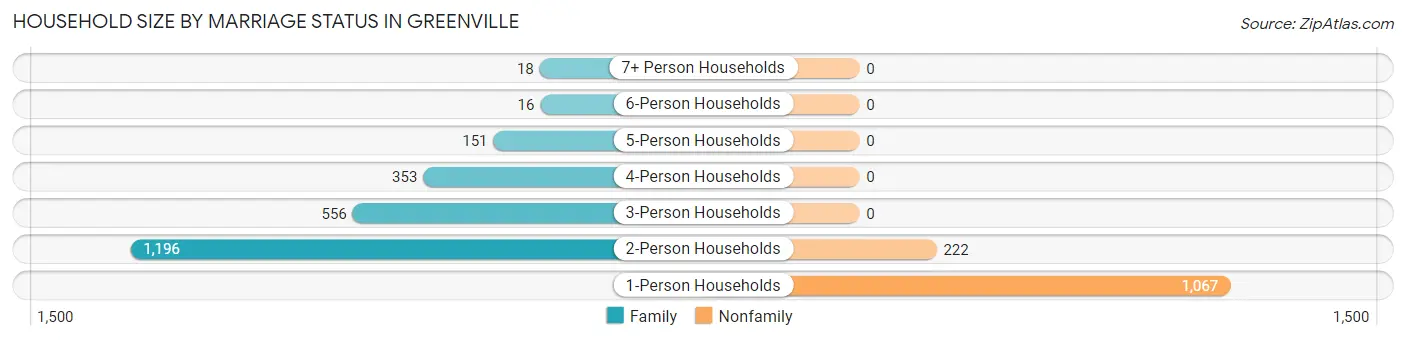
| Household Size | Family Households | Nonfamily Households |
| 1-Person Households | - | 1,067 (29.8%) |
| 2-Person Households | 1,196 (33.4%) | 222 (6.2%) |
| 3-Person Households | 556 (15.5%) | 0 (0.0%) |
| 4-Person Households | 353 (9.9%) | 0 (0.0%) |
| 5-Person Households | 151 (4.2%) | 0 (0.0%) |
| 6-Person Households | 16 (0.4%) | 0 (0.0%) |
| 7+ Person Households | 18 (0.5%) | 0 (0.0%) |
| Total | 2,290 (64.0%) | 1,289 (36.0%) |
Female Fertility in Greenville
Fertility by Age in Greenville
Average fertility rate in Greenville is 23.0 births per 1,000 women. Women in the age bracket of 35 to 50 years have the highest fertility rate with 31.0 births per 1,000 women. Women in the age bracket of 35 to 50 years acount for 61.1% of all women with births.
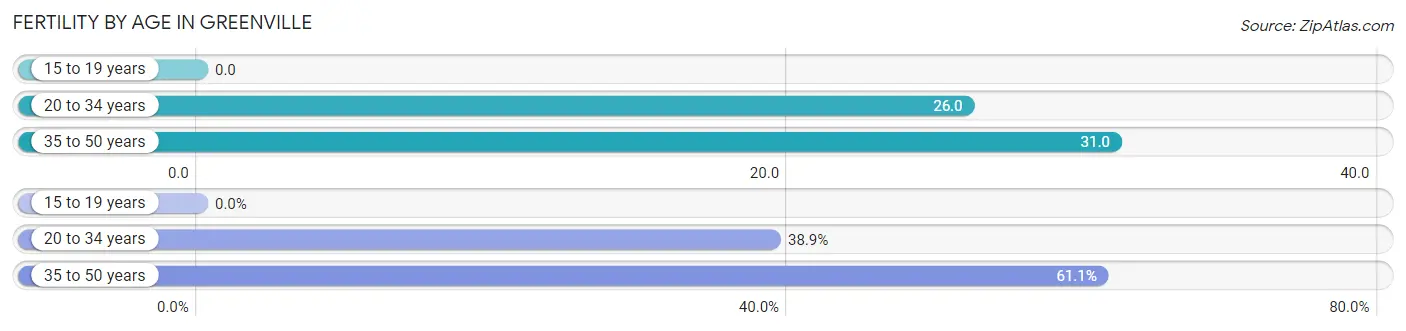
| Age Bracket | Women with Births | Births / 1,000 Women |
| 15 to 19 years | 0 (0.0%) | 0.0 |
| 20 to 34 years | 14 (38.9%) | 26.0 |
| 35 to 50 years | 22 (61.1%) | 31.0 |
| Total | 36 (100.0%) | 23.0 |
Fertility by Age by Marriage Status in Greenville
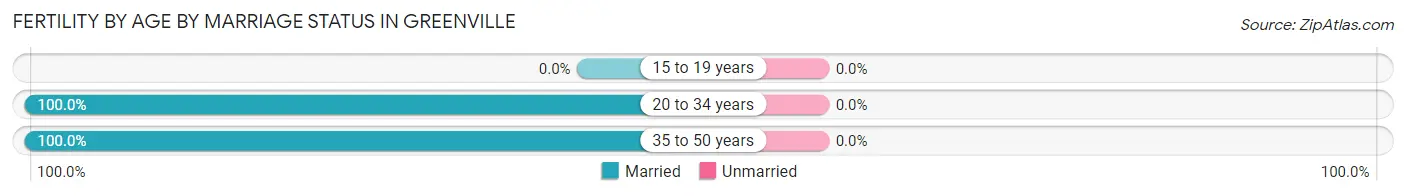
| Age Bracket | Married | Unmarried |
| 15 to 19 years | 0 (0.0%) | 0 (0.0%) |
| 20 to 34 years | 14 (100.0%) | 0 (0.0%) |
| 35 to 50 years | 22 (100.0%) | 0 (0.0%) |
| Total | 36 (100.0%) | 0 (0.0%) |
Fertility by Education in Greenville
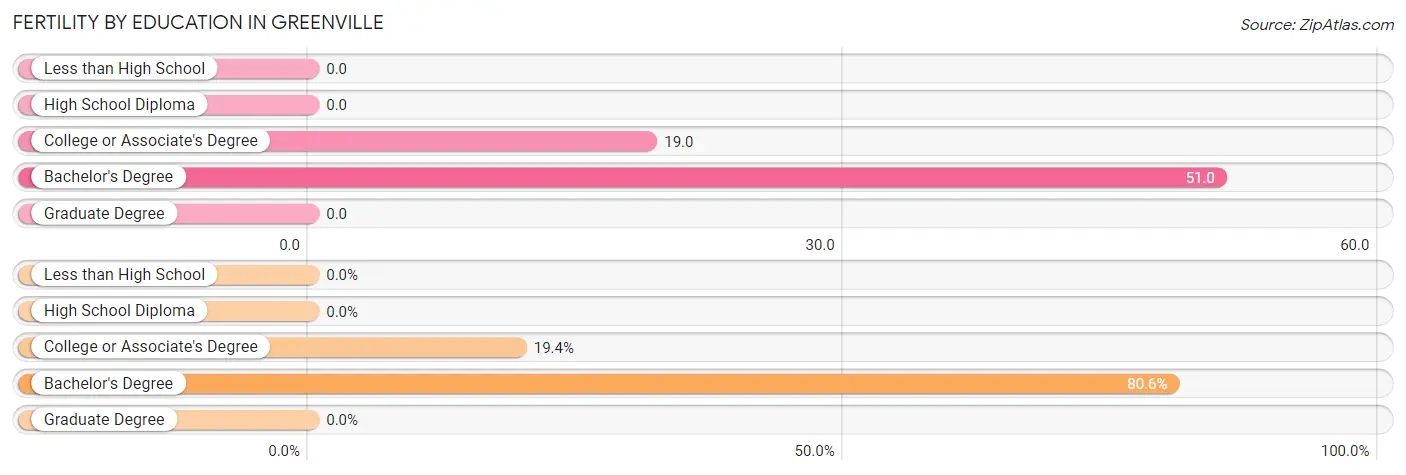
| Educational Attainment | Women with Births | Births / 1,000 Women |
| Less than High School | 0 (0.0%) | 0.0 |
| High School Diploma | 0 (0.0%) | 0.0 |
| College or Associate's Degree | 7 (19.4%) | 19.0 |
| Bachelor's Degree | 29 (80.6%) | 51.0 |
| Graduate Degree | 0 (0.0%) | 0.0 |
| Total | 36 (100.0%) | 23.0 |
Fertility by Education by Marriage Status in Greenville
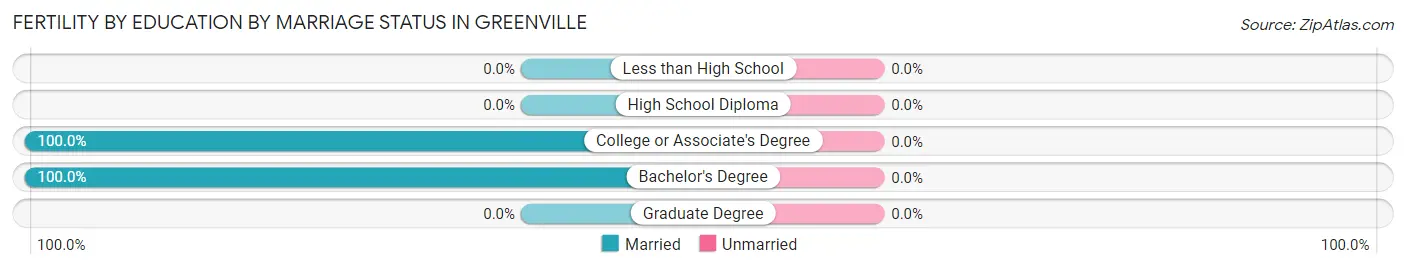
| Educational Attainment | Married | Unmarried |
| Less than High School | 0 (0.0%) | 0 (0.0%) |
| High School Diploma | 0 (0.0%) | 0 (0.0%) |
| College or Associate's Degree | 7 (100.0%) | 0 (0.0%) |
| Bachelor's Degree | 29 (100.0%) | 0 (0.0%) |
| Graduate Degree | 0 (0.0%) | 0 (0.0%) |
| Total | 36 (100.0%) | 0 (0.0%) |
Employment Characteristics in Greenville
Employment by Class of Employer in Greenville
Among the 4,087 employed individuals in Greenville, private company employees (2,668 | 65.3%), not-for-profit organizations (455 | 11.1%), and local government employees (321 | 7.9%) make up the most common classes of employment.
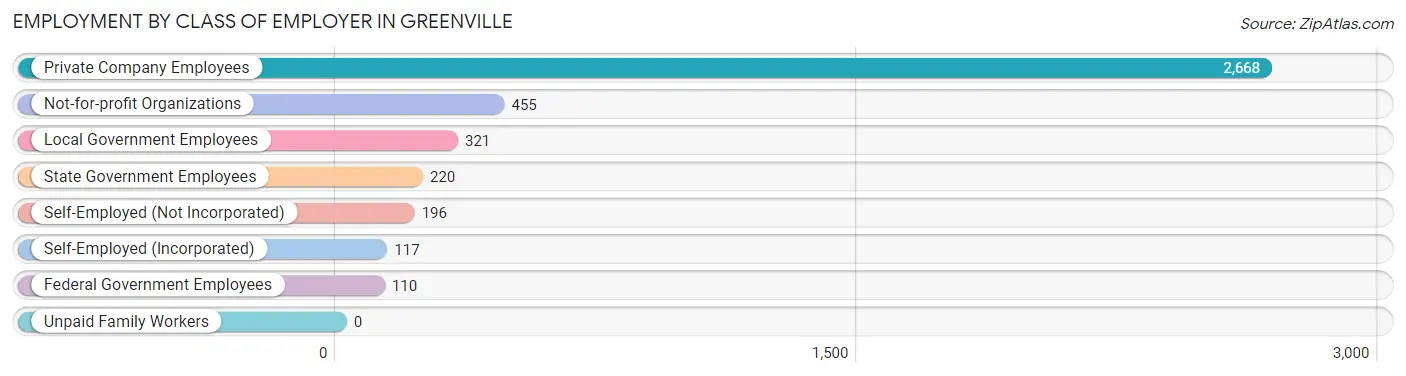
| Employer Class | # Employees | % Employees |
| Private Company Employees | 2,668 | 65.3% |
| Self-Employed (Incorporated) | 117 | 2.9% |
| Self-Employed (Not Incorporated) | 196 | 4.8% |
| Not-for-profit Organizations | 455 | 11.1% |
| Local Government Employees | 321 | 7.9% |
| State Government Employees | 220 | 5.4% |
| Federal Government Employees | 110 | 2.7% |
| Unpaid Family Workers | 0 | 0.0% |
| Total | 4,087 | 100.0% |
Employment Status by Age in Greenville
According to the labor force statistics for Greenville, out of the total population over 16 years of age (7,711), 55.4% or 4,272 individuals are in the labor force, with 3.4% or 145 of them unemployed. The age group with the highest labor force participation rate is 35 to 44 years, with 92.4% or 660 individuals in the labor force. Within the labor force, the 25 to 29 years age range has the highest percentage of unemployed individuals, with 10.6% or 41 of them being unemployed.
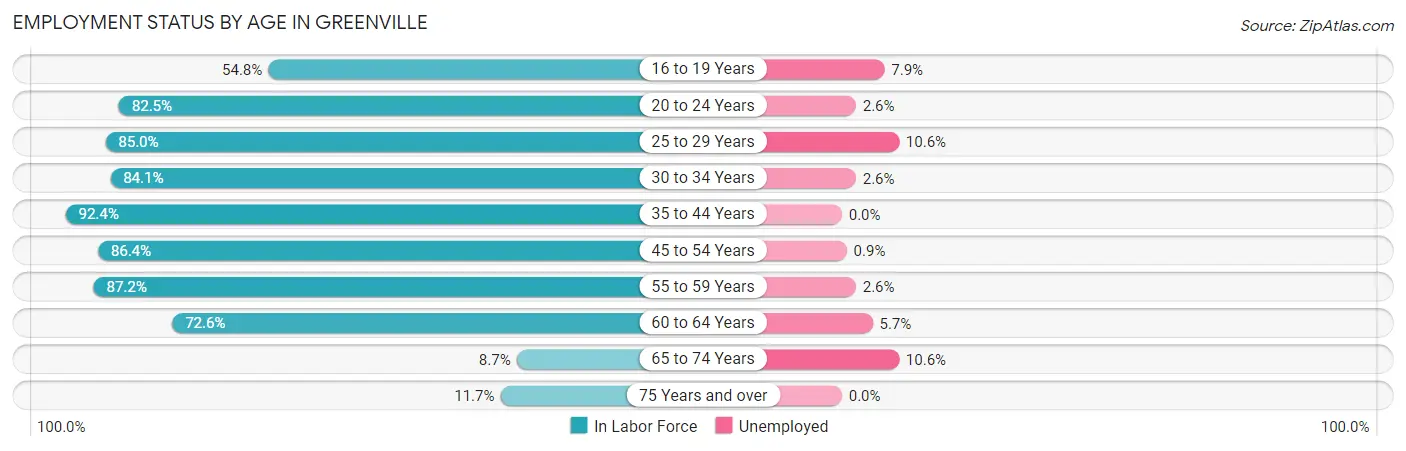
| Age Bracket | In Labor Force | Unemployed |
| 16 to 19 Years | 317 (54.8%) | 25 (7.9%) |
| 20 to 24 Years | 268 (82.5%) | 7 (2.6%) |
| 25 to 29 Years | 386 (85.0%) | 41 (10.6%) |
| 30 to 34 Years | 430 (84.1%) | 11 (2.6%) |
| 35 to 44 Years | 660 (92.4%) | 0 (0.0%) |
| 45 to 54 Years | 914 (86.4%) | 8 (0.9%) |
| 55 to 59 Years | 456 (87.2%) | 12 (2.6%) |
| 60 to 64 Years | 548 (72.6%) | 31 (5.7%) |
| 65 to 74 Years | 94 (8.7%) | 10 (10.6%) |
| 75 Years and over | 200 (11.7%) | 0 (0.0%) |
| Total | 4,272 (55.4%) | 145 (3.4%) |
Employment Status by Educational Attainment in Greenville
According to labor force statistics for Greenville, 84.5% of individuals (3,393) out of the total population between 25 and 64 years of age (4,015) are in the labor force, with 3.0% or 102 of them being unemployed. The group with the highest labor force participation rate are those with the educational attainment of bachelor's degree or higher, with 89.5% or 1,766 individuals in the labor force. Within the labor force, individuals with bachelor's degree or higher education have the highest percentage of unemployment, with 4.6% or 81 of them being unemployed.
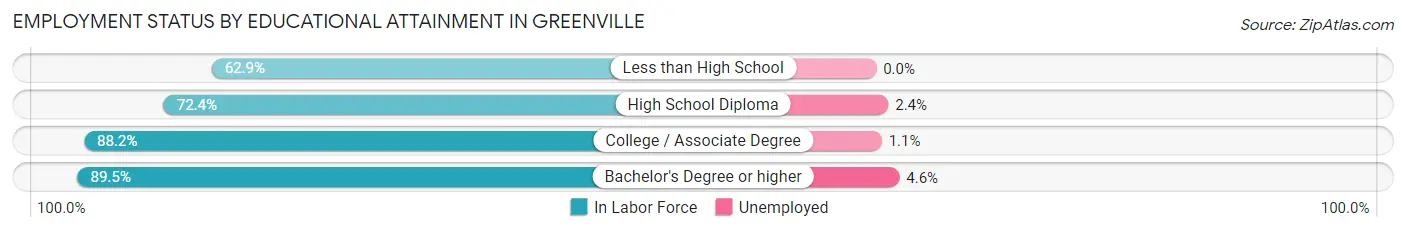
| Educational Attainment | In Labor Force | Unemployed |
| Less than High School | 154 (62.9%) | 0 (0.0%) |
| High School Diploma | 506 (72.4%) | 17 (2.4%) |
| College / Associate Degree | 968 (88.2%) | 12 (1.1%) |
| Bachelor's Degree or higher | 1,766 (89.5%) | 91 (4.6%) |
| Total | 3,393 (84.5%) | 120 (3.0%) |
Employment Occupations by Sex in Greenville
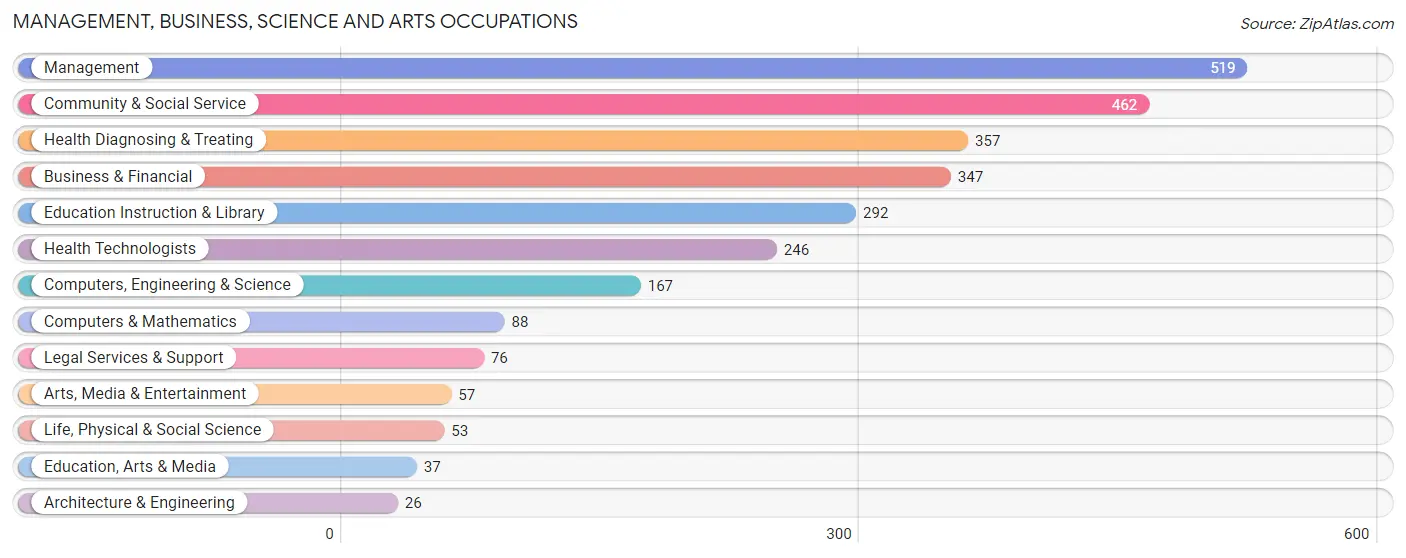
Management, Business, Science and Arts Occupations
The most common Management, Business, Science and Arts occupations in Greenville are Management (519 | 12.6%), Community & Social Service (462 | 11.2%), Health Diagnosing & Treating (357 | 8.7%), Business & Financial (347 | 8.4%), and Education Instruction & Library (292 | 7.1%).
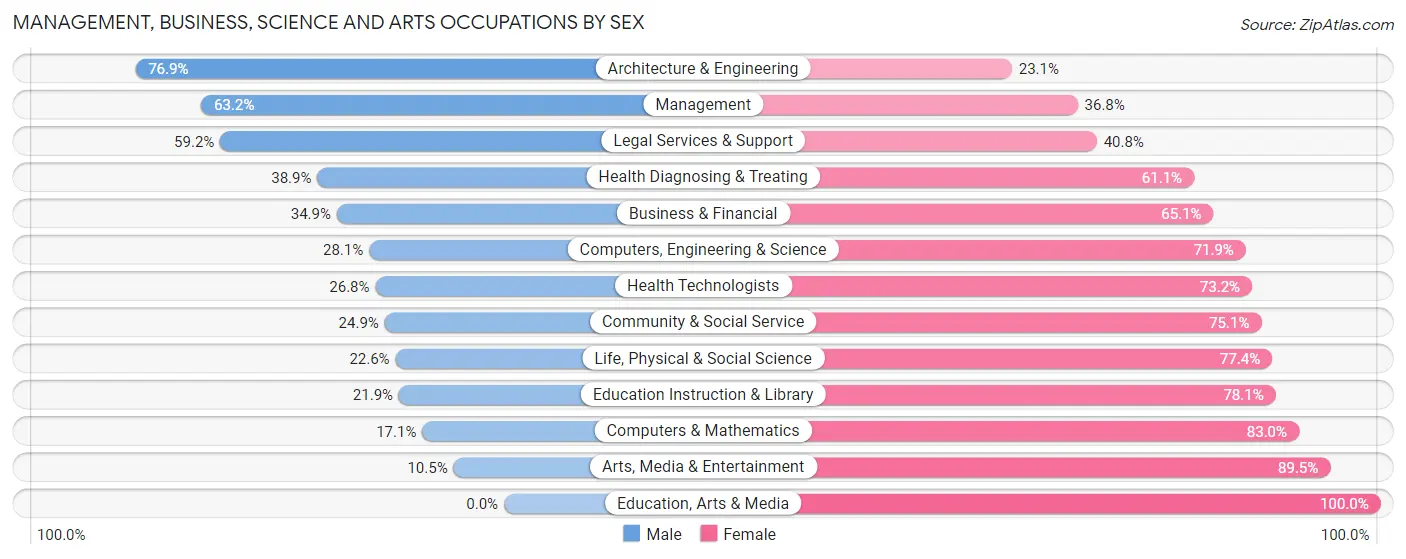
Management, Business, Science and Arts Occupations by Sex
Within the Management, Business, Science and Arts occupations in Greenville, the most male-oriented occupations are Architecture & Engineering (76.9%), Management (63.2%), and Legal Services & Support (59.2%), while the most female-oriented occupations are Education, Arts & Media (100.0%), Arts, Media & Entertainment (89.5%), and Computers & Mathematics (83.0%).
| Occupation | Male | Female |
| Management | 328 (63.2%) | 191 (36.8%) |
| Business & Financial | 121 (34.9%) | 226 (65.1%) |
| Computers, Engineering & Science | 47 (28.1%) | 120 (71.9%) |
| Computers & Mathematics | 15 (17.1%) | 73 (83.0%) |
| Architecture & Engineering | 20 (76.9%) | 6 (23.1%) |
| Life, Physical & Social Science | 12 (22.6%) | 41 (77.4%) |
| Community & Social Service | 115 (24.9%) | 347 (75.1%) |
| Education, Arts & Media | 0 (0.0%) | 37 (100.0%) |
| Legal Services & Support | 45 (59.2%) | 31 (40.8%) |
| Education Instruction & Library | 64 (21.9%) | 228 (78.1%) |
| Arts, Media & Entertainment | 6 (10.5%) | 51 (89.5%) |
| Health Diagnosing & Treating | 139 (38.9%) | 218 (61.1%) |
| Health Technologists | 66 (26.8%) | 180 (73.2%) |
| Total (Category) | 750 (40.5%) | 1,102 (59.5%) |
| Total (Overall) | 2,059 (50.0%) | 2,061 (50.0%) |
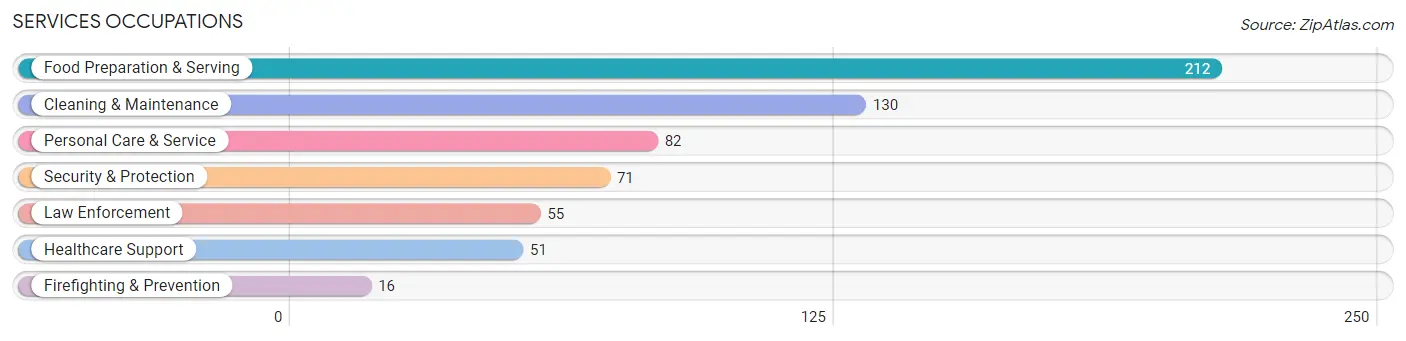
Services Occupations
The most common Services occupations in Greenville are Food Preparation & Serving (212 | 5.1%), Cleaning & Maintenance (130 | 3.2%), Personal Care & Service (82 | 2.0%), Security & Protection (71 | 1.7%), and Law Enforcement (55 | 1.3%).
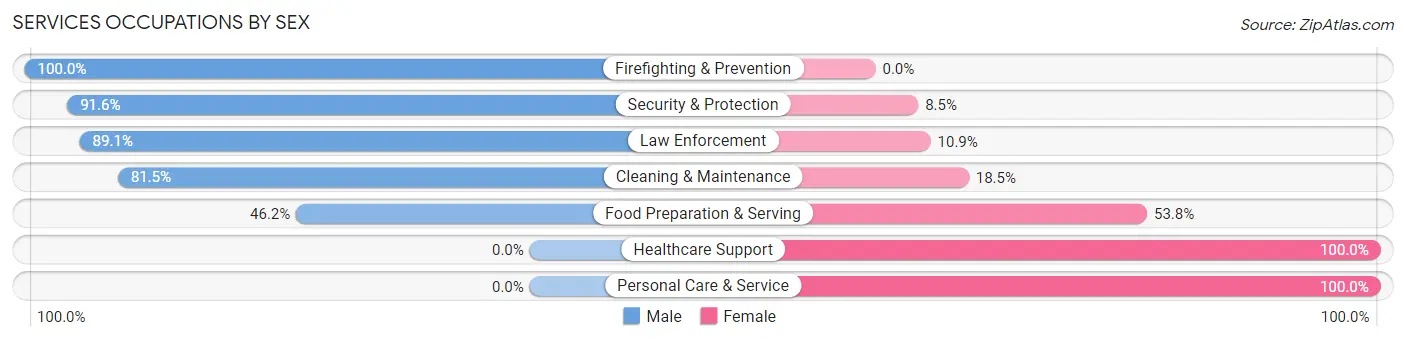
Services Occupations by Sex
Within the Services occupations in Greenville, the most male-oriented occupations are Firefighting & Prevention (100.0%), Security & Protection (91.5%), and Law Enforcement (89.1%), while the most female-oriented occupations are Healthcare Support (100.0%), Personal Care & Service (100.0%), and Food Preparation & Serving (53.8%).
| Occupation | Male | Female |
| Healthcare Support | 0 (0.0%) | 51 (100.0%) |
| Security & Protection | 65 (91.5%) | 6 (8.5%) |
| Firefighting & Prevention | 16 (100.0%) | 0 (0.0%) |
| Law Enforcement | 49 (89.1%) | 6 (10.9%) |
| Food Preparation & Serving | 98 (46.2%) | 114 (53.8%) |
| Cleaning & Maintenance | 106 (81.5%) | 24 (18.5%) |
| Personal Care & Service | 0 (0.0%) | 82 (100.0%) |
| Total (Category) | 269 (49.3%) | 277 (50.7%) |
| Total (Overall) | 2,059 (50.0%) | 2,061 (50.0%) |
Sales and Office Occupations
The most common Sales and Office occupations in Greenville are Office & Administration (749 | 18.2%), and Sales & Related (311 | 7.5%).

Sales and Office Occupations by Sex
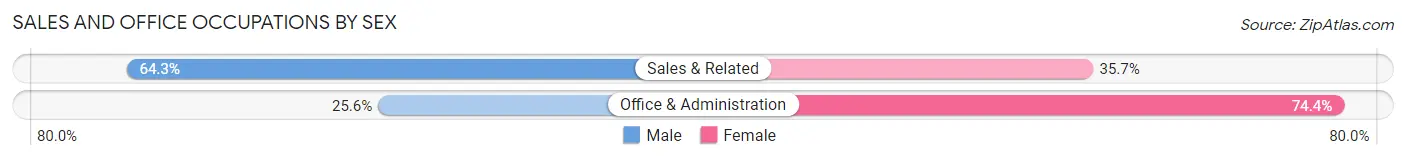
| Occupation | Male | Female |
| Sales & Related | 200 (64.3%) | 111 (35.7%) |
| Office & Administration | 192 (25.6%) | 557 (74.4%) |
| Total (Category) | 392 (37.0%) | 668 (63.0%) |
| Total (Overall) | 2,059 (50.0%) | 2,061 (50.0%) |
Natural Resources, Construction and Maintenance Occupations
The most common Natural Resources, Construction and Maintenance occupations in Greenville are Construction & Extraction (266 | 6.5%), and Installation, Maintenance & Repair (96 | 2.3%).

Natural Resources, Construction and Maintenance Occupations by Sex
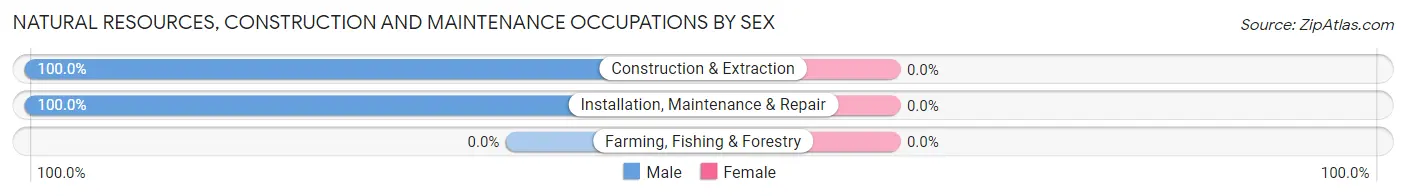
| Occupation | Male | Female |
| Farming, Fishing & Forestry | 0 (0.0%) | 0 (0.0%) |
| Construction & Extraction | 266 (100.0%) | 0 (0.0%) |
| Installation, Maintenance & Repair | 96 (100.0%) | 0 (0.0%) |
| Total (Category) | 362 (100.0%) | 0 (0.0%) |
| Total (Overall) | 2,059 (50.0%) | 2,061 (50.0%) |
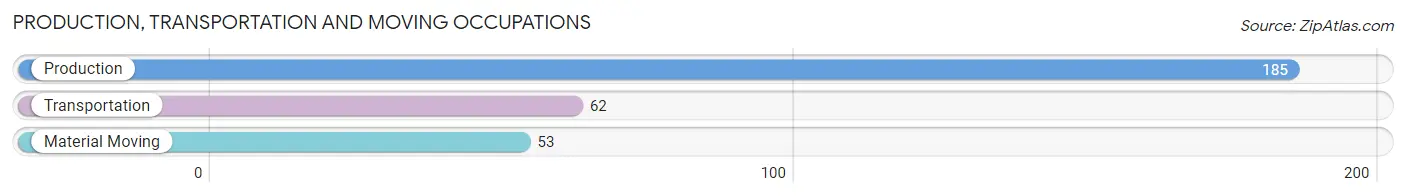
Production, Transportation and Moving Occupations
The most common Production, Transportation and Moving occupations in Greenville are Production (185 | 4.5%), Transportation (62 | 1.5%), and Material Moving (53 | 1.3%).
Production, Transportation and Moving Occupations by Sex
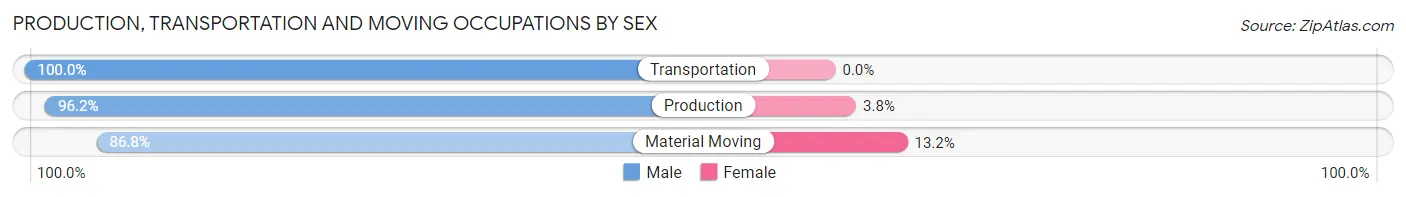
| Occupation | Male | Female |
| Production | 178 (96.2%) | 7 (3.8%) |
| Transportation | 62 (100.0%) | 0 (0.0%) |
| Material Moving | 46 (86.8%) | 7 (13.2%) |
| Total (Category) | 286 (95.3%) | 14 (4.7%) |
| Total (Overall) | 2,059 (50.0%) | 2,061 (50.0%) |
Employment Industries by Sex in Greenville
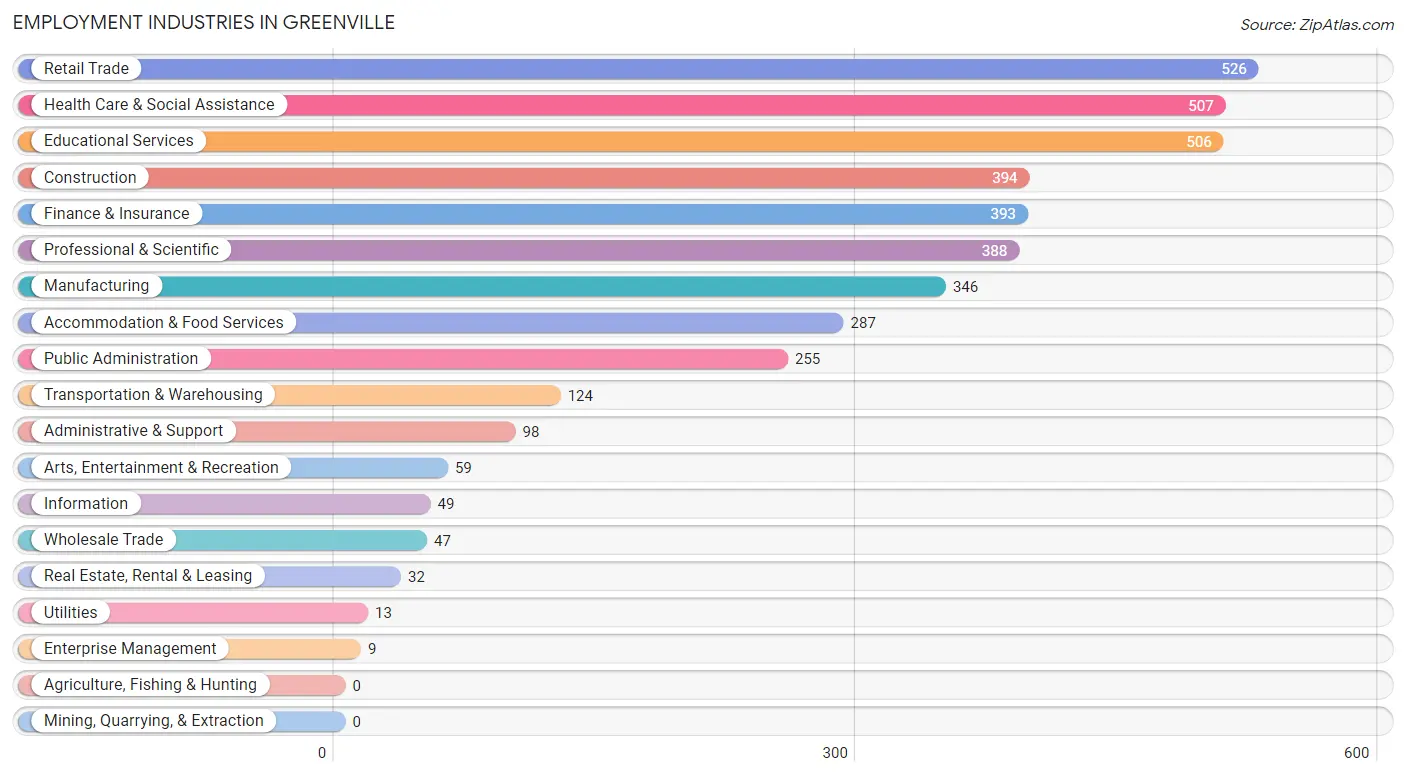
Employment Industries in Greenville
The major employment industries in Greenville include Retail Trade (526 | 12.8%), Health Care & Social Assistance (507 | 12.3%), Educational Services (506 | 12.3%), Construction (394 | 9.6%), and Finance & Insurance (393 | 9.5%).
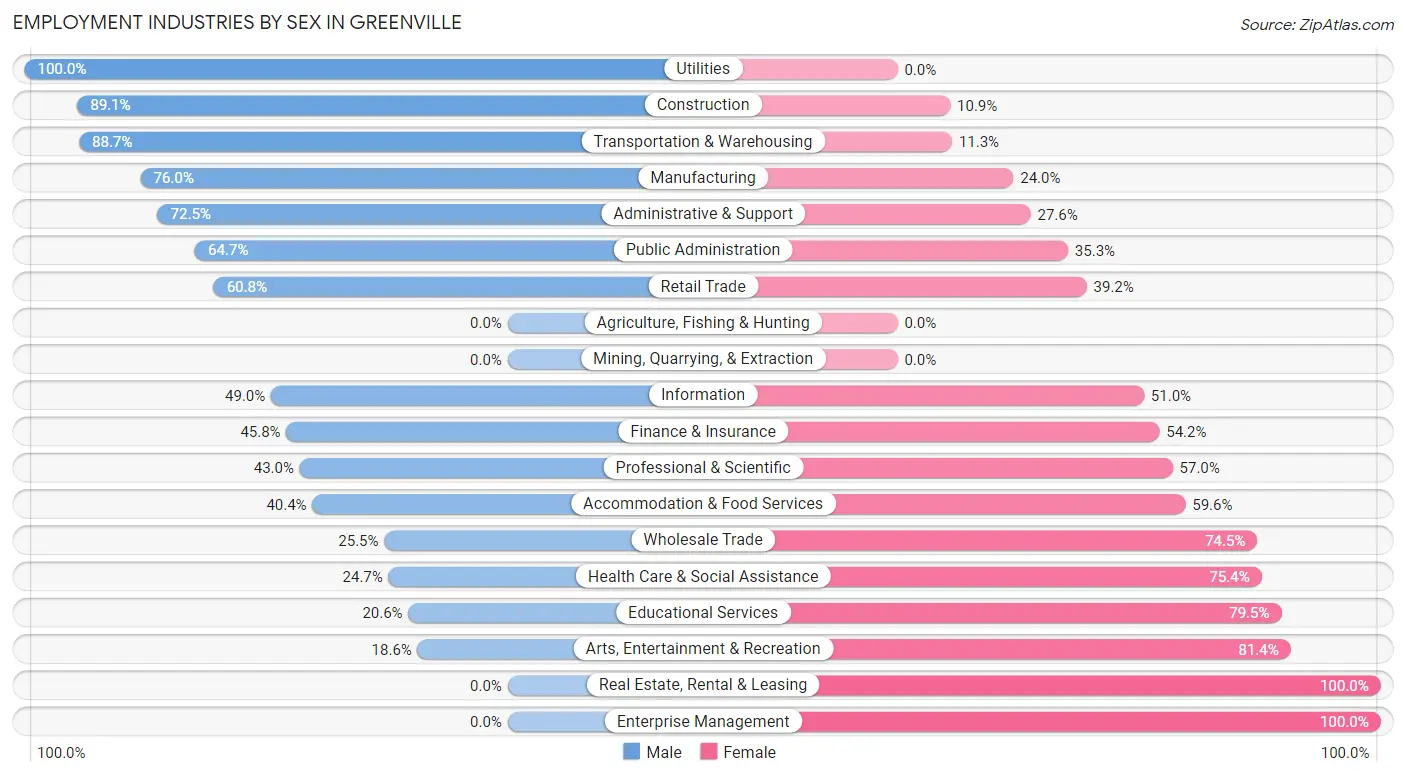
Employment Industries by Sex in Greenville
The Greenville industries that see more men than women are Utilities (100.0%), Construction (89.1%), and Transportation & Warehousing (88.7%), whereas the industries that tend to have a higher number of women are Real Estate, Rental & Leasing (100.0%), Enterprise Management (100.0%), and Arts, Entertainment & Recreation (81.4%).
| Industry | Male | Female |
| Agriculture, Fishing & Hunting | 0 (0.0%) | 0 (0.0%) |
| Mining, Quarrying, & Extraction | 0 (0.0%) | 0 (0.0%) |
| Construction | 351 (89.1%) | 43 (10.9%) |
| Manufacturing | 263 (76.0%) | 83 (24.0%) |
| Wholesale Trade | 12 (25.5%) | 35 (74.5%) |
| Retail Trade | 320 (60.8%) | 206 (39.2%) |
| Transportation & Warehousing | 110 (88.7%) | 14 (11.3%) |
| Utilities | 13 (100.0%) | 0 (0.0%) |
| Information | 24 (49.0%) | 25 (51.0%) |
| Finance & Insurance | 180 (45.8%) | 213 (54.2%) |
| Real Estate, Rental & Leasing | 0 (0.0%) | 32 (100.0%) |
| Professional & Scientific | 167 (43.0%) | 221 (57.0%) |
| Enterprise Management | 0 (0.0%) | 9 (100.0%) |
| Administrative & Support | 71 (72.5%) | 27 (27.6%) |
| Educational Services | 104 (20.5%) | 402 (79.4%) |
| Health Care & Social Assistance | 125 (24.6%) | 382 (75.3%) |
| Arts, Entertainment & Recreation | 11 (18.6%) | 48 (81.4%) |
| Accommodation & Food Services | 116 (40.4%) | 171 (59.6%) |
| Public Administration | 165 (64.7%) | 90 (35.3%) |
| Total | 2,059 (50.0%) | 2,061 (50.0%) |
Education in Greenville
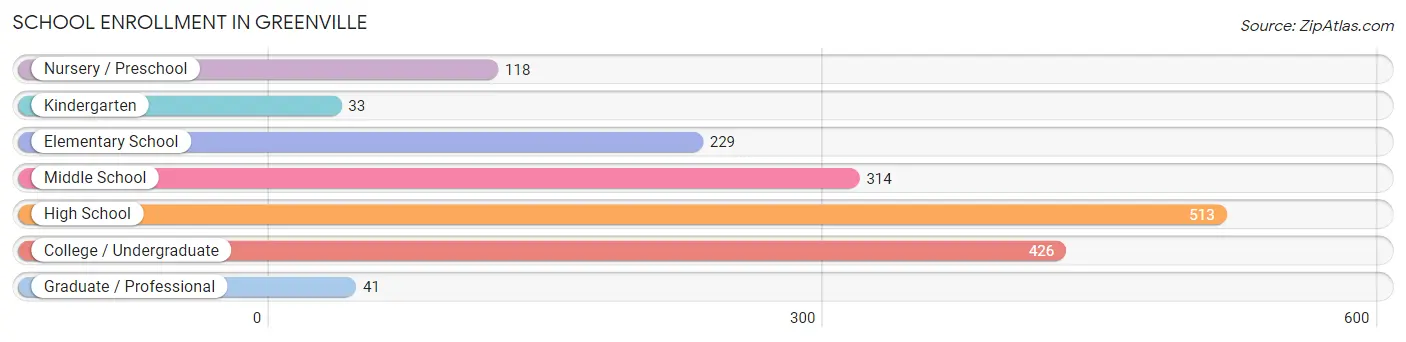
School Enrollment in Greenville
The most common levels of schooling among the 1,674 students in Greenville are high school (513 | 30.6%), college / undergraduate (426 | 25.5%), and middle school (314 | 18.8%).
| School Level | # Students | % Students |
| Nursery / Preschool | 118 | 7.0% |
| Kindergarten | 33 | 2.0% |
| Elementary School | 229 | 13.7% |
| Middle School | 314 | 18.8% |
| High School | 513 | 30.6% |
| College / Undergraduate | 426 | 25.5% |
| Graduate / Professional | 41 | 2.5% |
| Total | 1,674 | 100.0% |
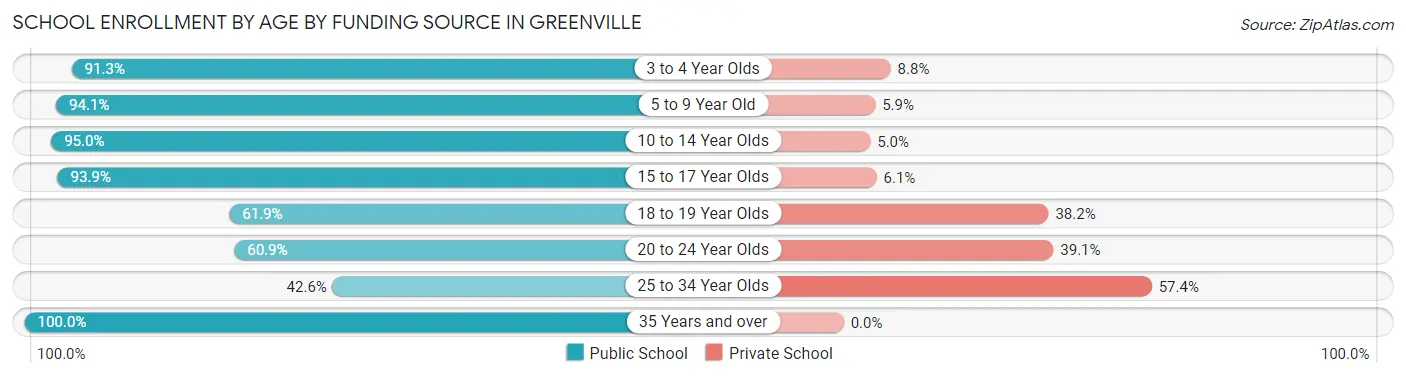
School Enrollment by Age by Funding Source in Greenville
Out of a total of 1,674 students who are enrolled in schools in Greenville, 248 (14.8%) attend a private institution, while the remaining 1,426 (85.2%) are enrolled in public schools. The age group of 25 to 34 year olds has the highest likelihood of being enrolled in private schools, with 35 (57.4% in the age bracket) enrolled. Conversely, the age group of 35 years and over has the lowest likelihood of being enrolled in a private school, with 73 (100.0% in the age bracket) attending a public institution.
| Age Bracket | Public School | Private School |
| 3 to 4 Year Olds | 73 (91.2%) | 7 (8.7%) |
| 5 to 9 Year Old | 272 (94.1%) | 17 (5.9%) |
| 10 to 14 Year Olds | 383 (95.0%) | 20 (5.0%) |
| 15 to 17 Year Olds | 367 (93.9%) | 24 (6.1%) |
| 18 to 19 Year Olds | 154 (61.9%) | 95 (38.2%) |
| 20 to 24 Year Olds | 78 (60.9%) | 50 (39.1%) |
| 25 to 34 Year Olds | 26 (42.6%) | 35 (57.4%) |
| 35 Years and over | 73 (100.0%) | 0 (0.0%) |
| Total | 1,426 (85.2%) | 248 (14.8%) |
Educational Attainment by Field of Study in Greenville
Business (636 | 22.5%), education (327 | 11.6%), science & technology (295 | 10.4%), liberal arts & history (271 | 9.6%), and social sciences (212 | 7.5%) are the most common fields of study among 2,822 individuals in Greenville who have obtained a bachelor's degree or higher.
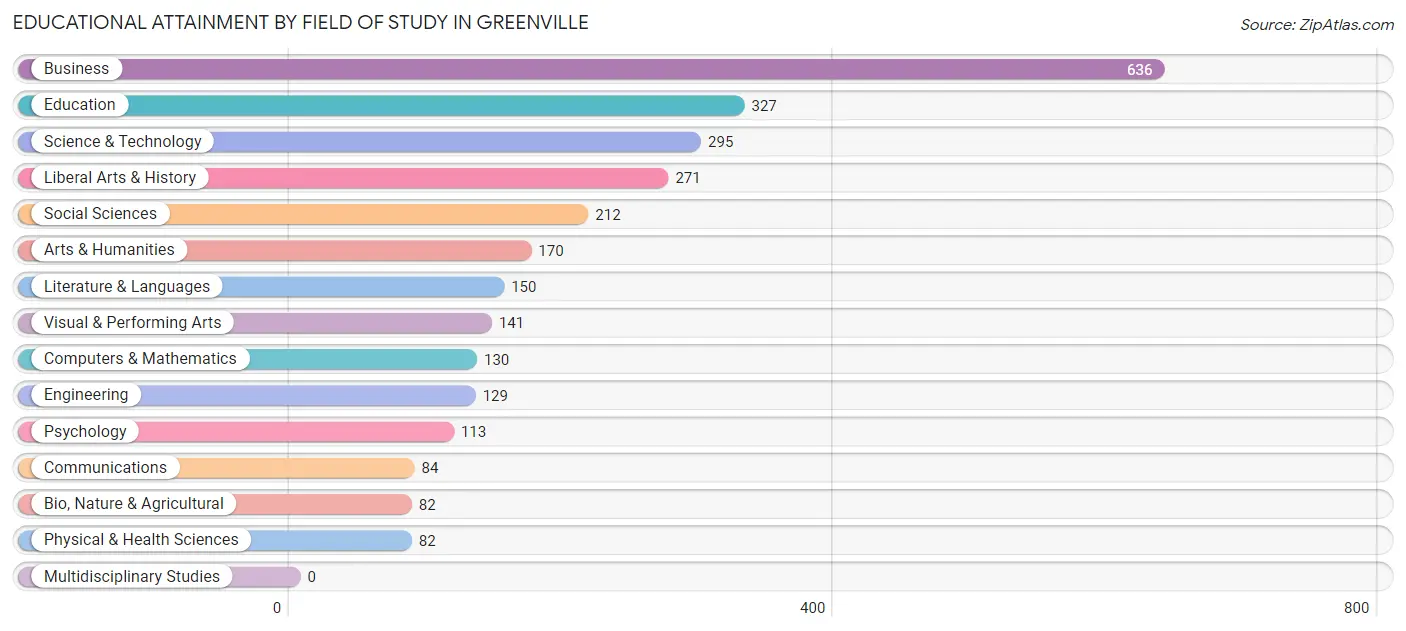
| Field of Study | # Graduates | % Graduates |
| Computers & Mathematics | 130 | 4.6% |
| Bio, Nature & Agricultural | 82 | 2.9% |
| Physical & Health Sciences | 82 | 2.9% |
| Psychology | 113 | 4.0% |
| Social Sciences | 212 | 7.5% |
| Engineering | 129 | 4.6% |
| Multidisciplinary Studies | 0 | 0.0% |
| Science & Technology | 295 | 10.4% |
| Business | 636 | 22.5% |
| Education | 327 | 11.6% |
| Literature & Languages | 150 | 5.3% |
| Liberal Arts & History | 271 | 9.6% |
| Visual & Performing Arts | 141 | 5.0% |
| Communications | 84 | 3.0% |
| Arts & Humanities | 170 | 6.0% |
| Total | 2,822 | 100.0% |
Transportation & Commute in Greenville
Vehicle Availability by Sex in Greenville
The most prevalent vehicle ownership categories in Greenville are males with 2 vehicles (948, accounting for 45.9%) and females with 2 vehicles (946, making up 47.5%).
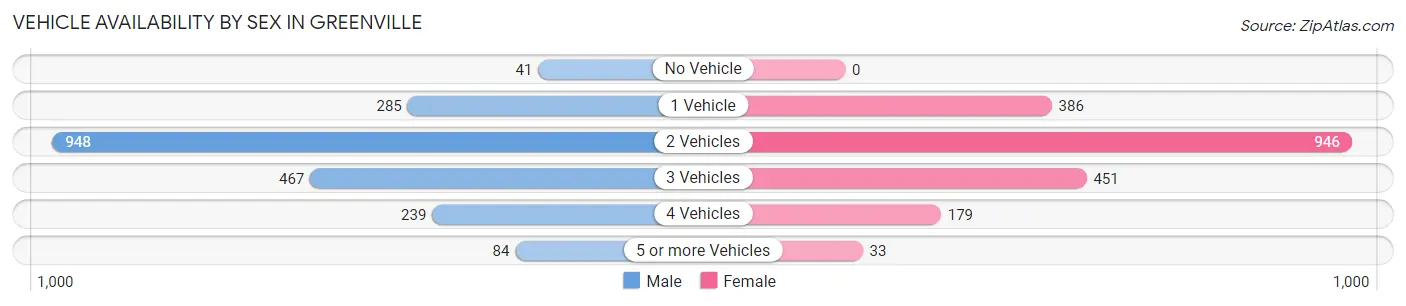
| Vehicles Available | Male | Female |
| No Vehicle | 41 (2.0%) | 0 (0.0%) |
| 1 Vehicle | 285 (13.8%) | 386 (19.4%) |
| 2 Vehicles | 948 (45.9%) | 946 (47.4%) |
| 3 Vehicles | 467 (22.6%) | 451 (22.6%) |
| 4 Vehicles | 239 (11.6%) | 179 (9.0%) |
| 5 or more Vehicles | 84 (4.1%) | 33 (1.7%) |
| Total | 2,064 (100.0%) | 1,995 (100.0%) |
Commute Time in Greenville
The most frequently occuring commute durations in Greenville are 30 to 34 minutes (591 commuters, 16.2%), 15 to 19 minutes (587 commuters, 16.1%), and 20 to 24 minutes (563 commuters, 15.4%).
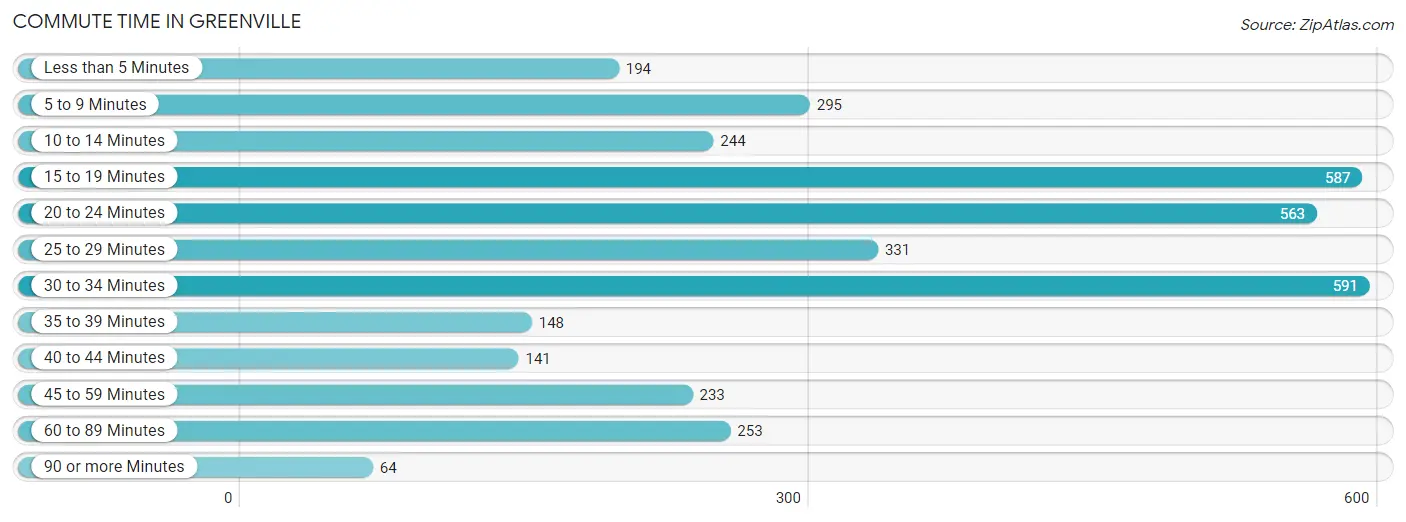
| Commute Time | # Commuters | % Commuters |
| Less than 5 Minutes | 194 | 5.3% |
| 5 to 9 Minutes | 295 | 8.1% |
| 10 to 14 Minutes | 244 | 6.7% |
| 15 to 19 Minutes | 587 | 16.1% |
| 20 to 24 Minutes | 563 | 15.4% |
| 25 to 29 Minutes | 331 | 9.1% |
| 30 to 34 Minutes | 591 | 16.2% |
| 35 to 39 Minutes | 148 | 4.1% |
| 40 to 44 Minutes | 141 | 3.9% |
| 45 to 59 Minutes | 233 | 6.4% |
| 60 to 89 Minutes | 253 | 6.9% |
| 90 or more Minutes | 64 | 1.8% |
Commute Time by Sex in Greenville
The most common commute times in Greenville are 30 to 34 minutes (393 commuters, 20.5%) for males and 15 to 19 minutes (389 commuters, 22.5%) for females.
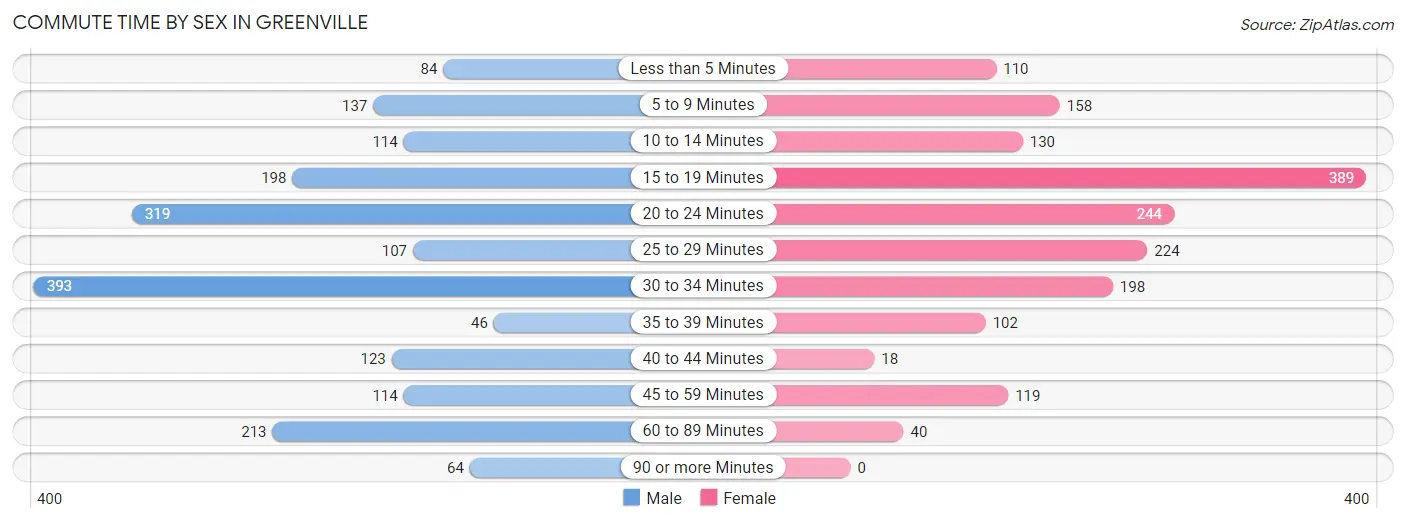
| Commute Time | Male | Female |
| Less than 5 Minutes | 84 (4.4%) | 110 (6.4%) |
| 5 to 9 Minutes | 137 (7.2%) | 158 (9.1%) |
| 10 to 14 Minutes | 114 (6.0%) | 130 (7.5%) |
| 15 to 19 Minutes | 198 (10.4%) | 389 (22.5%) |
| 20 to 24 Minutes | 319 (16.7%) | 244 (14.1%) |
| 25 to 29 Minutes | 107 (5.6%) | 224 (12.9%) |
| 30 to 34 Minutes | 393 (20.5%) | 198 (11.4%) |
| 35 to 39 Minutes | 46 (2.4%) | 102 (5.9%) |
| 40 to 44 Minutes | 123 (6.4%) | 18 (1.0%) |
| 45 to 59 Minutes | 114 (6.0%) | 119 (6.9%) |
| 60 to 89 Minutes | 213 (11.1%) | 40 (2.3%) |
| 90 or more Minutes | 64 (3.4%) | 0 (0.0%) |
Time of Departure to Work by Sex in Greenville
The most frequent times of departure to work in Greenville are 7:00 AM to 7:29 AM (283, 14.8%) for males and 7:30 AM to 7:59 AM (367, 21.2%) for females.
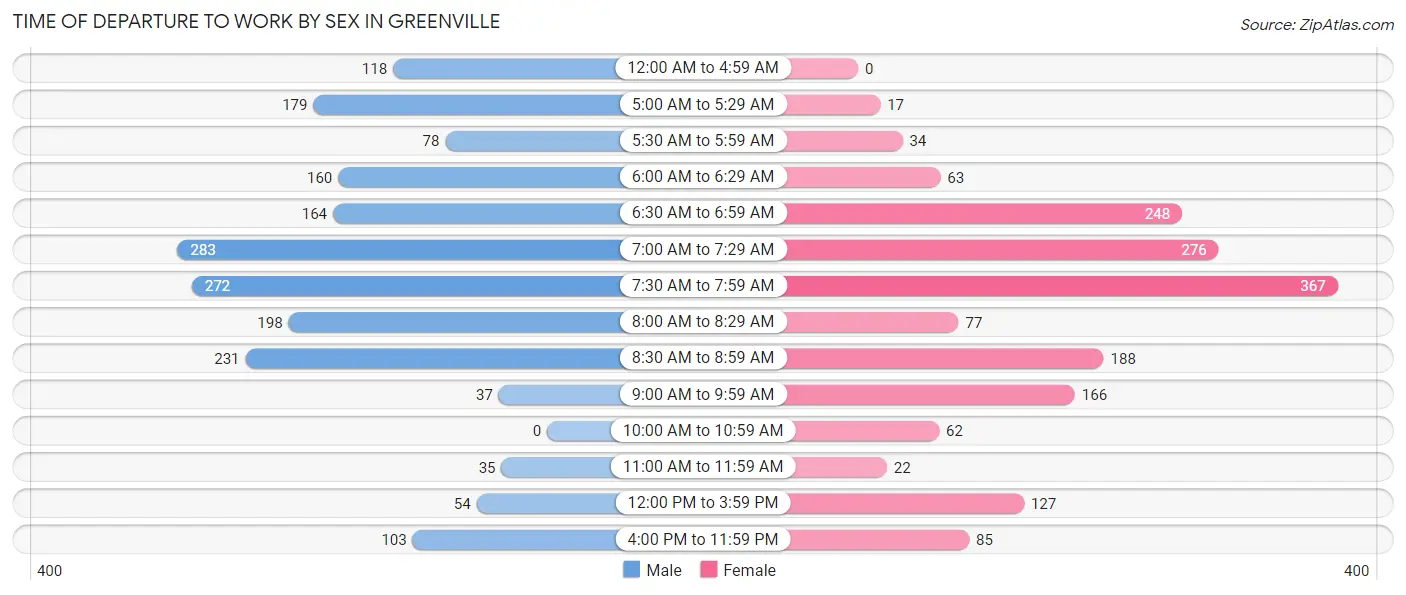
| Time of Departure | Male | Female |
| 12:00 AM to 4:59 AM | 118 (6.2%) | 0 (0.0%) |
| 5:00 AM to 5:29 AM | 179 (9.4%) | 17 (1.0%) |
| 5:30 AM to 5:59 AM | 78 (4.1%) | 34 (2.0%) |
| 6:00 AM to 6:29 AM | 160 (8.4%) | 63 (3.6%) |
| 6:30 AM to 6:59 AM | 164 (8.6%) | 248 (14.3%) |
| 7:00 AM to 7:29 AM | 283 (14.8%) | 276 (15.9%) |
| 7:30 AM to 7:59 AM | 272 (14.2%) | 367 (21.2%) |
| 8:00 AM to 8:29 AM | 198 (10.4%) | 77 (4.4%) |
| 8:30 AM to 8:59 AM | 231 (12.1%) | 188 (10.8%) |
| 9:00 AM to 9:59 AM | 37 (1.9%) | 166 (9.6%) |
| 10:00 AM to 10:59 AM | 0 (0.0%) | 62 (3.6%) |
| 11:00 AM to 11:59 AM | 35 (1.8%) | 22 (1.3%) |
| 12:00 PM to 3:59 PM | 54 (2.8%) | 127 (7.3%) |
| 4:00 PM to 11:59 PM | 103 (5.4%) | 85 (4.9%) |
| Total | 1,912 (100.0%) | 1,732 (100.0%) |
Housing Occupancy in Greenville
Occupancy by Ownership in Greenville
Of the total 3,579 dwellings in Greenville, owner-occupied units account for 3,064 (85.6%), while renter-occupied units make up 515 (14.4%).
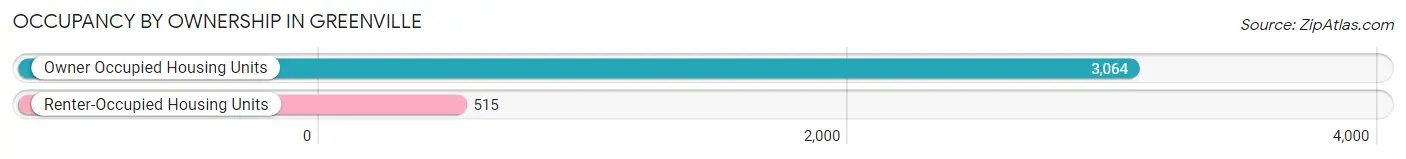
| Occupancy | # Housing Units | % Housing Units |
| Owner Occupied Housing Units | 3,064 | 85.6% |
| Renter-Occupied Housing Units | 515 | 14.4% |
| Total Occupied Housing Units | 3,579 | 100.0% |
Occupancy by Household Size in Greenville
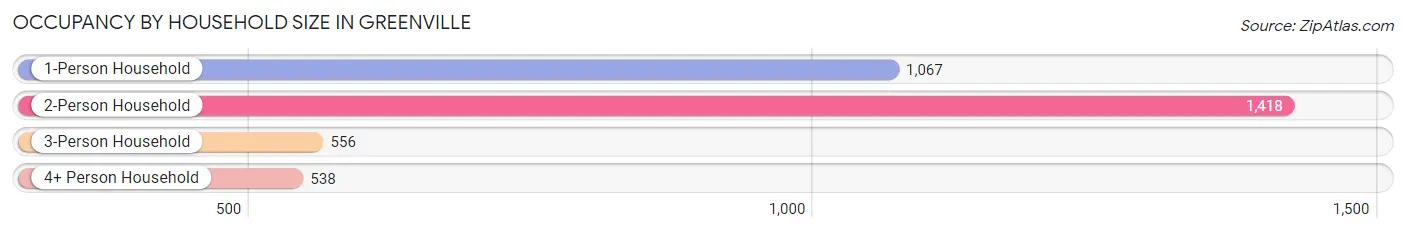
| Household Size | # Housing Units | % Housing Units |
| 1-Person Household | 1,067 | 29.8% |
| 2-Person Household | 1,418 | 39.6% |
| 3-Person Household | 556 | 15.5% |
| 4+ Person Household | 538 | 15.0% |
| Total Housing Units | 3,579 | 100.0% |
Occupancy by Ownership by Household Size in Greenville
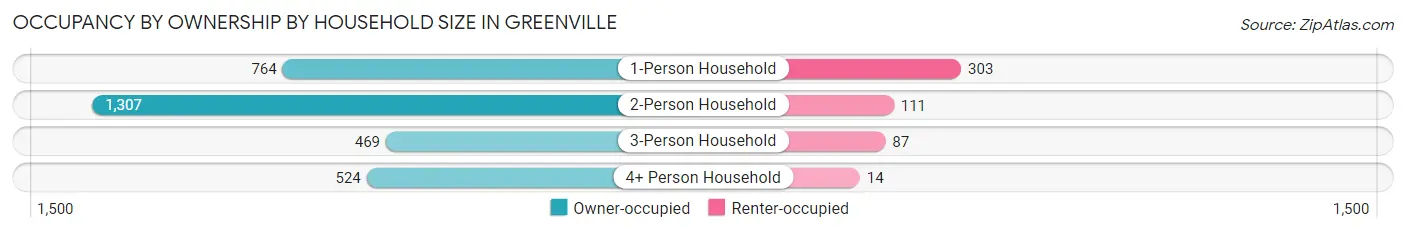
| Household Size | Owner-occupied | Renter-occupied |
| 1-Person Household | 764 (71.6%) | 303 (28.4%) |
| 2-Person Household | 1,307 (92.2%) | 111 (7.8%) |
| 3-Person Household | 469 (84.4%) | 87 (15.7%) |
| 4+ Person Household | 524 (97.4%) | 14 (2.6%) |
| Total Housing Units | 3,064 (85.6%) | 515 (14.4%) |
Occupancy by Educational Attainment in Greenville
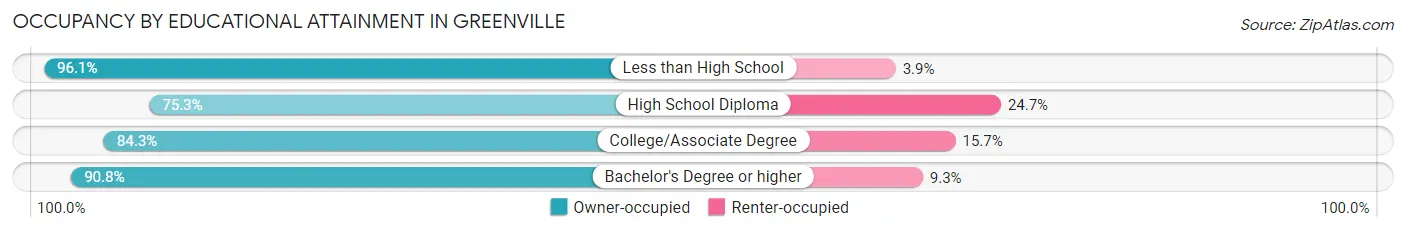
| Household Size | Owner-occupied | Renter-occupied |
| Less than High School | 149 (96.1%) | 6 (3.9%) |
| High School Diploma | 648 (75.3%) | 213 (24.7%) |
| College/Associate Degree | 766 (84.3%) | 143 (15.7%) |
| Bachelor's Degree or higher | 1,501 (90.7%) | 153 (9.2%) |
Occupancy by Age of Householder in Greenville
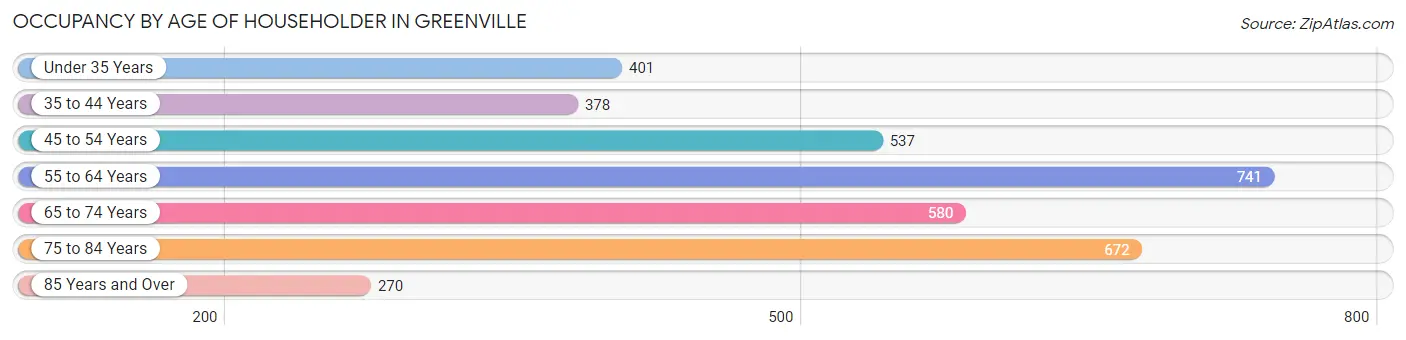
| Age Bracket | # Households | % Households |
| Under 35 Years | 401 | 11.2% |
| 35 to 44 Years | 378 | 10.6% |
| 45 to 54 Years | 537 | 15.0% |
| 55 to 64 Years | 741 | 20.7% |
| 65 to 74 Years | 580 | 16.2% |
| 75 to 84 Years | 672 | 18.8% |
| 85 Years and Over | 270 | 7.5% |
| Total | 3,579 | 100.0% |
Housing Finances in Greenville
Median Income by Occupancy in Greenville
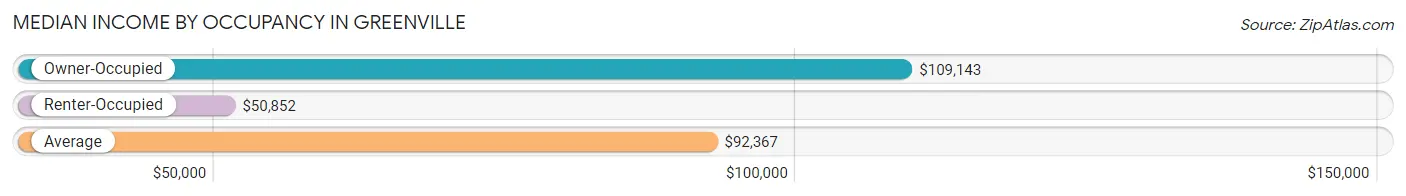
| Occupancy Type | # Households | Median Income |
| Owner-Occupied | 3,064 (85.6%) | $109,143 |
| Renter-Occupied | 515 (14.4%) | $50,852 |
| Average | 3,579 (100.0%) | $92,367 |
Occupancy by Householder Income Bracket in Greenville
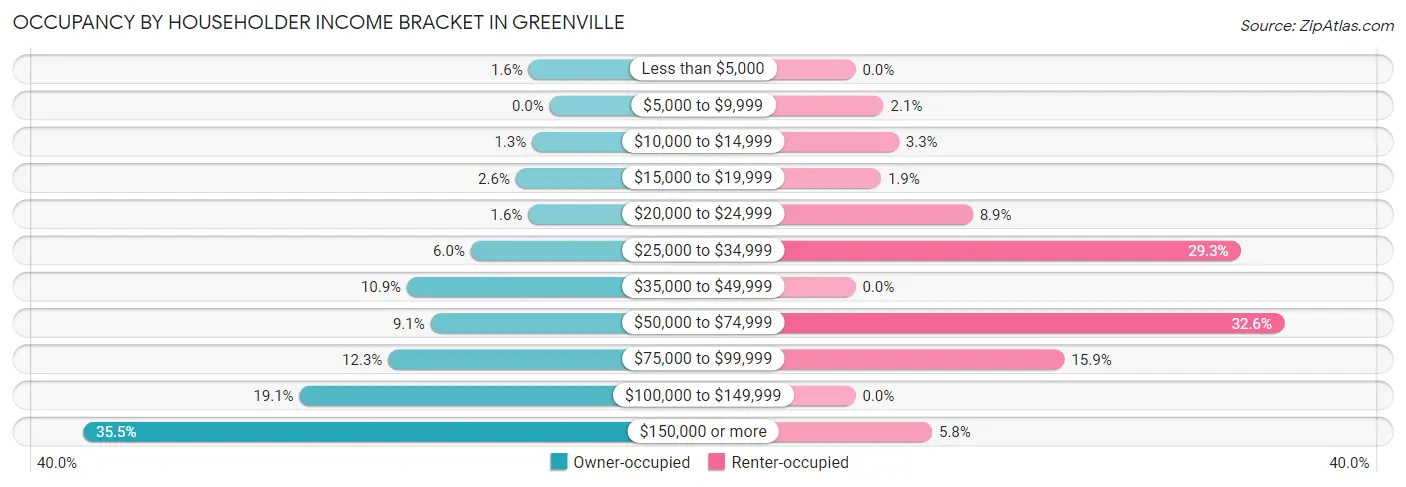
| Income Bracket | Owner-occupied | Renter-occupied |
| Less than $5,000 | 49 (1.6%) | 0 (0.0%) |
| $5,000 to $9,999 | 0 (0.0%) | 11 (2.1%) |
| $10,000 to $14,999 | 41 (1.3%) | 17 (3.3%) |
| $15,000 to $19,999 | 79 (2.6%) | 10 (1.9%) |
| $20,000 to $24,999 | 50 (1.6%) | 46 (8.9%) |
| $25,000 to $34,999 | 184 (6.0%) | 151 (29.3%) |
| $35,000 to $49,999 | 333 (10.9%) | 0 (0.0%) |
| $50,000 to $74,999 | 278 (9.1%) | 168 (32.6%) |
| $75,000 to $99,999 | 377 (12.3%) | 82 (15.9%) |
| $100,000 to $149,999 | 584 (19.1%) | 0 (0.0%) |
| $150,000 or more | 1,089 (35.5%) | 30 (5.8%) |
| Total | 3,064 (100.0%) | 515 (100.0%) |
Monthly Housing Cost Tiers in Greenville
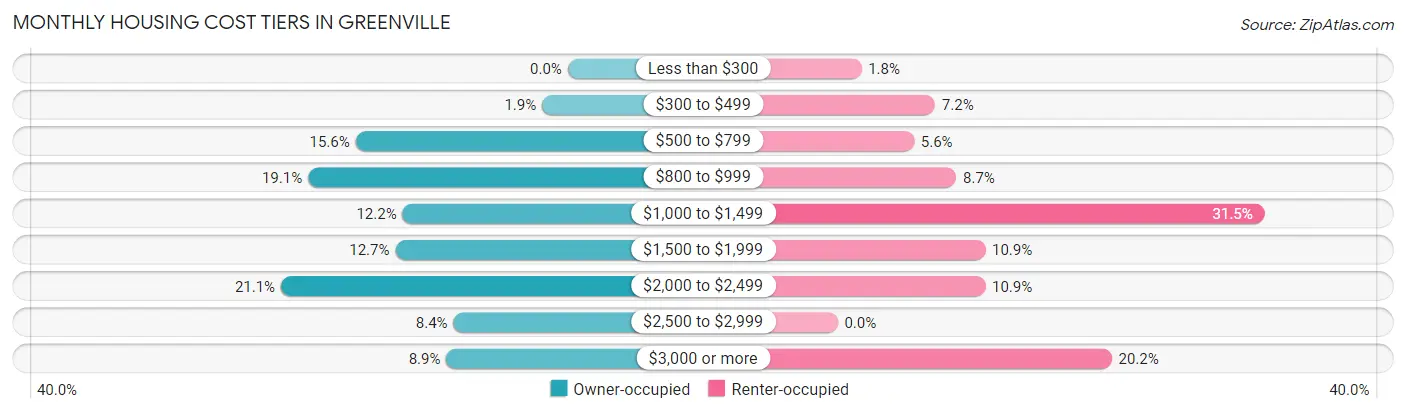
| Monthly Cost | Owner-occupied | Renter-occupied |
| Less than $300 | 0 (0.0%) | 9 (1.8%) |
| $300 to $499 | 58 (1.9%) | 37 (7.2%) |
| $500 to $799 | 479 (15.6%) | 29 (5.6%) |
| $800 to $999 | 586 (19.1%) | 45 (8.7%) |
| $1,000 to $1,499 | 373 (12.2%) | 162 (31.5%) |
| $1,500 to $1,999 | 389 (12.7%) | 56 (10.9%) |
| $2,000 to $2,499 | 647 (21.1%) | 56 (10.9%) |
| $2,500 to $2,999 | 258 (8.4%) | 0 (0.0%) |
| $3,000 or more | 274 (8.9%) | 104 (20.2%) |
| Total | 3,064 (100.0%) | 515 (100.0%) |
Physical Housing Characteristics in Greenville
Housing Structures in Greenville
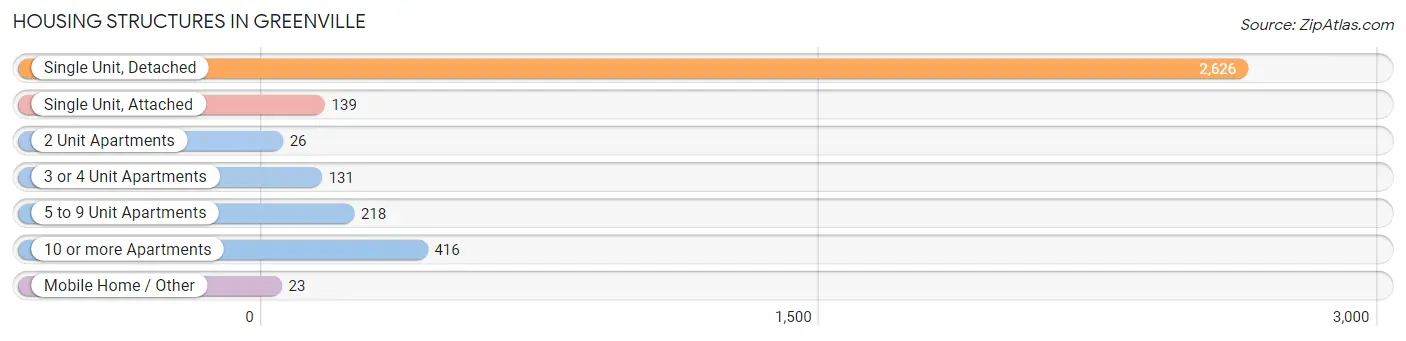
| Structure Type | # Housing Units | % Housing Units |
| Single Unit, Detached | 2,626 | 73.4% |
| Single Unit, Attached | 139 | 3.9% |
| 2 Unit Apartments | 26 | 0.7% |
| 3 or 4 Unit Apartments | 131 | 3.7% |
| 5 to 9 Unit Apartments | 218 | 6.1% |
| 10 or more Apartments | 416 | 11.6% |
| Mobile Home / Other | 23 | 0.6% |
| Total | 3,579 | 100.0% |
Housing Structures by Occupancy in Greenville
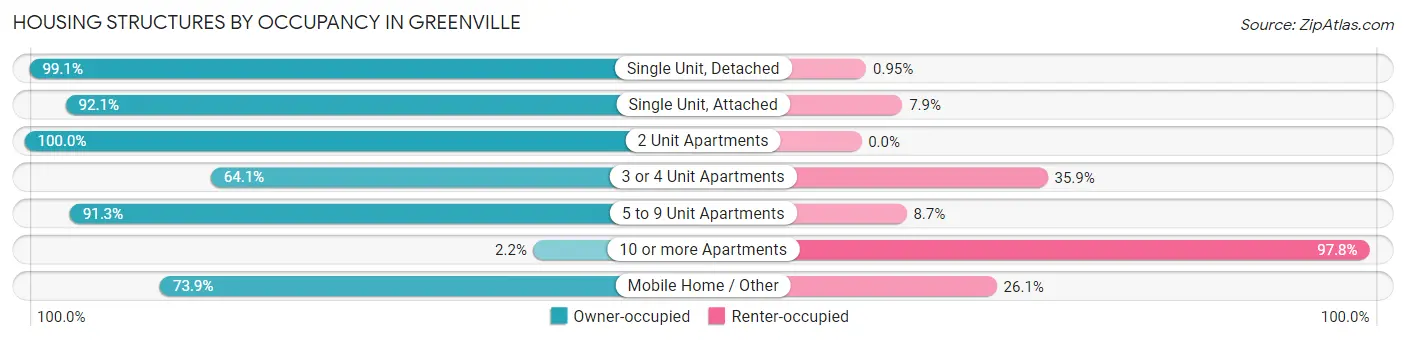
| Structure Type | Owner-occupied | Renter-occupied |
| Single Unit, Detached | 2,601 (99.1%) | 25 (0.9%) |
| Single Unit, Attached | 128 (92.1%) | 11 (7.9%) |
| 2 Unit Apartments | 26 (100.0%) | 0 (0.0%) |
| 3 or 4 Unit Apartments | 84 (64.1%) | 47 (35.9%) |
| 5 to 9 Unit Apartments | 199 (91.3%) | 19 (8.7%) |
| 10 or more Apartments | 9 (2.2%) | 407 (97.8%) |
| Mobile Home / Other | 17 (73.9%) | 6 (26.1%) |
| Total | 3,064 (85.6%) | 515 (14.4%) |
Housing Structures by Number of Rooms in Greenville
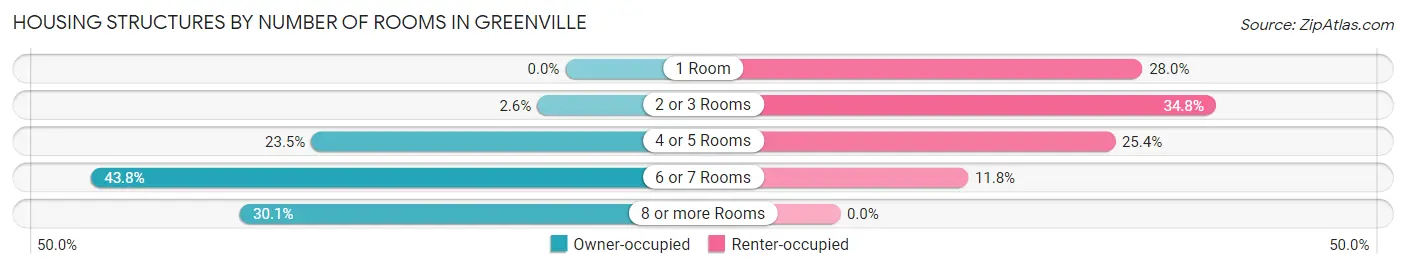
| Number of Rooms | Owner-occupied | Renter-occupied |
| 1 Room | 0 (0.0%) | 144 (28.0%) |
| 2 or 3 Rooms | 80 (2.6%) | 179 (34.8%) |
| 4 or 5 Rooms | 720 (23.5%) | 131 (25.4%) |
| 6 or 7 Rooms | 1,343 (43.8%) | 61 (11.8%) |
| 8 or more Rooms | 921 (30.1%) | 0 (0.0%) |
| Total | 3,064 (100.0%) | 515 (100.0%) |
Housing Structure by Heating Type in Greenville
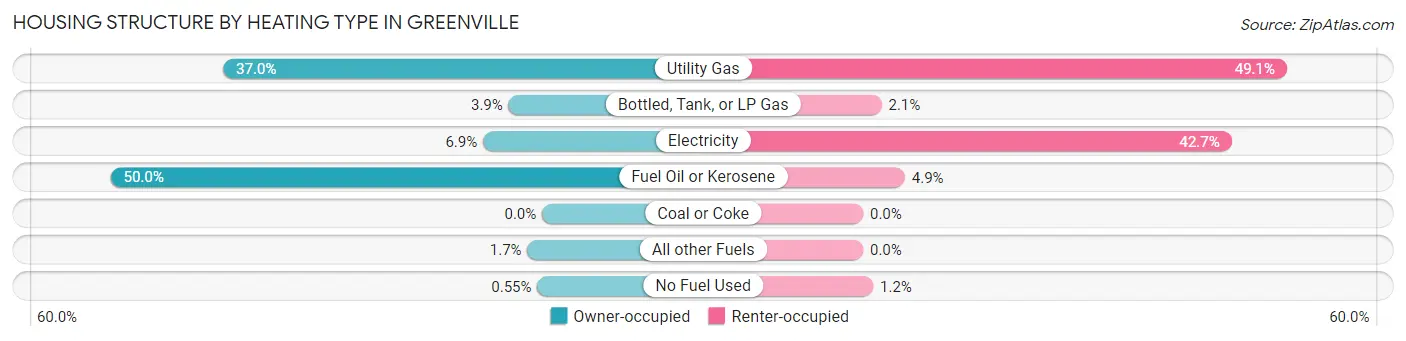
| Heating Type | Owner-occupied | Renter-occupied |
| Utility Gas | 1,133 (37.0%) | 253 (49.1%) |
| Bottled, Tank, or LP Gas | 119 (3.9%) | 11 (2.1%) |
| Electricity | 210 (6.9%) | 220 (42.7%) |
| Fuel Oil or Kerosene | 1,533 (50.0%) | 25 (4.9%) |
| Coal or Coke | 0 (0.0%) | 0 (0.0%) |
| All other Fuels | 52 (1.7%) | 0 (0.0%) |
| No Fuel Used | 17 (0.5%) | 6 (1.2%) |
| Total | 3,064 (100.0%) | 515 (100.0%) |
Household Vehicle Usage in Greenville
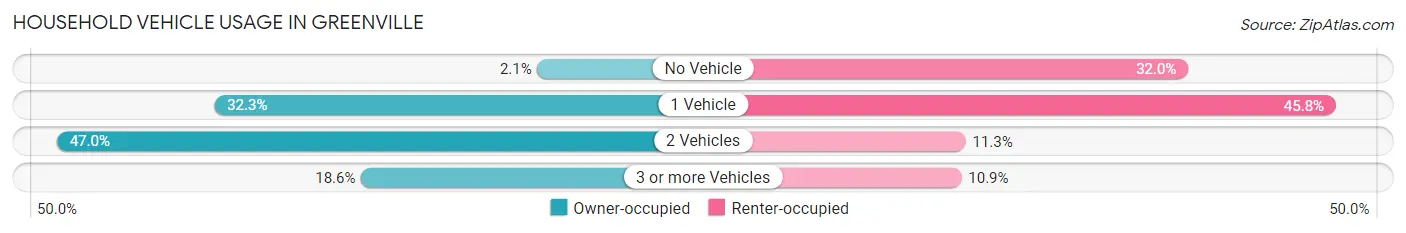
| Vehicles per Household | Owner-occupied | Renter-occupied |
| No Vehicle | 65 (2.1%) | 165 (32.0%) |
| 1 Vehicle | 990 (32.3%) | 236 (45.8%) |
| 2 Vehicles | 1,440 (47.0%) | 58 (11.3%) |
| 3 or more Vehicles | 569 (18.6%) | 56 (10.9%) |
| Total | 3,064 (100.0%) | 515 (100.0%) |
Real Estate & Mortgages in Greenville
Real Estate and Mortgage Overview in Greenville
| Characteristic | Without Mortgage | With Mortgage |
| Housing Units | 1,140 | 1,924 |
| Median Property Value | $388,000 | $371,300 |
| Median Household Income | $79,833 | $795 |
| Monthly Housing Costs | $817 | $274 |
| Real Estate Taxes | $4,543 | $20 |
Property Value by Mortgage Status in Greenville
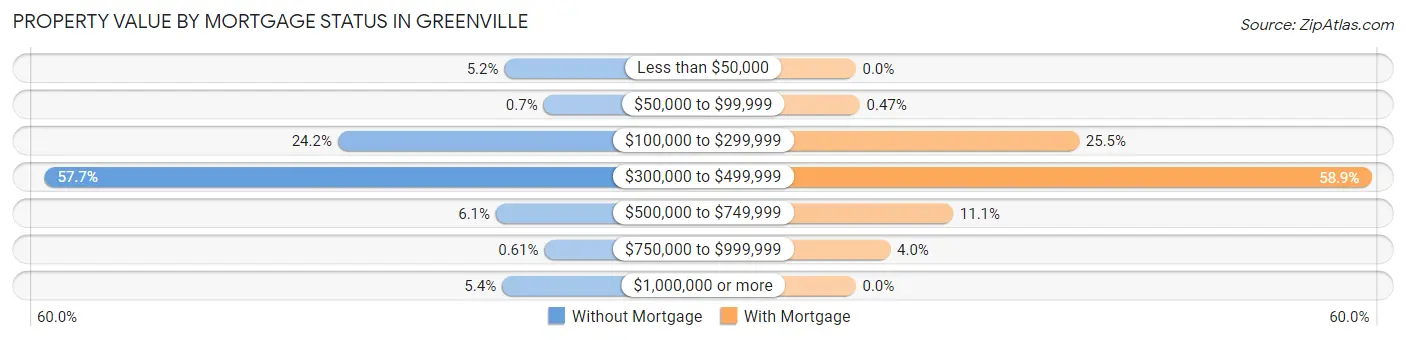
| Property Value | Without Mortgage | With Mortgage |
| Less than $50,000 | 59 (5.2%) | 0 (0.0%) |
| $50,000 to $99,999 | 8 (0.7%) | 9 (0.5%) |
| $100,000 to $299,999 | 276 (24.2%) | 491 (25.5%) |
| $300,000 to $499,999 | 658 (57.7%) | 1,134 (58.9%) |
| $500,000 to $749,999 | 70 (6.1%) | 214 (11.1%) |
| $750,000 to $999,999 | 7 (0.6%) | 76 (4.0%) |
| $1,000,000 or more | 62 (5.4%) | 0 (0.0%) |
| Total | 1,140 (100.0%) | 1,924 (100.0%) |
Household Income by Mortgage Status in Greenville
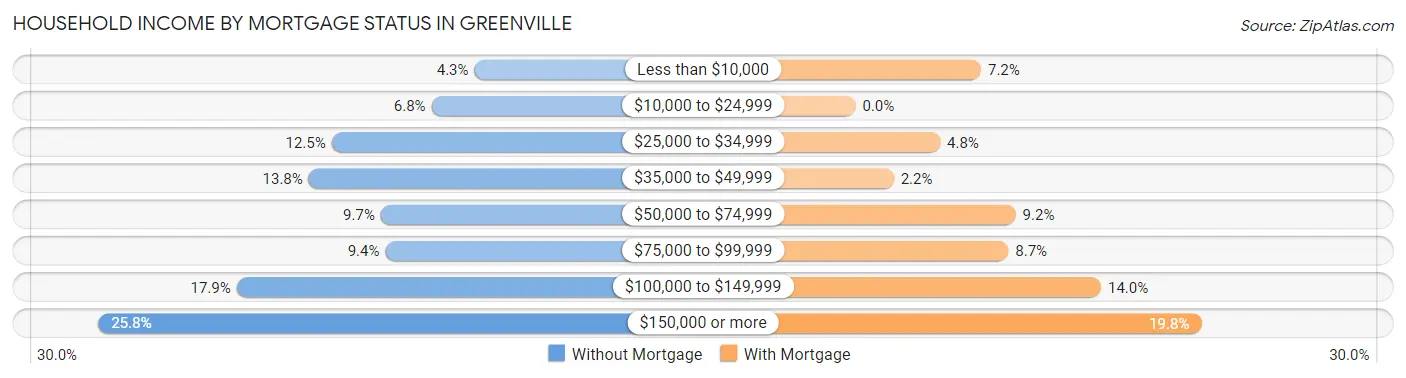
| Household Income | Without Mortgage | With Mortgage |
| Less than $10,000 | 49 (4.3%) | 138 (7.2%) |
| $10,000 to $24,999 | 77 (6.8%) | 0 (0.0%) |
| $25,000 to $34,999 | 142 (12.5%) | 93 (4.8%) |
| $35,000 to $49,999 | 157 (13.8%) | 42 (2.2%) |
| $50,000 to $74,999 | 110 (9.7%) | 176 (9.1%) |
| $75,000 to $99,999 | 107 (9.4%) | 168 (8.7%) |
| $100,000 to $149,999 | 204 (17.9%) | 270 (14.0%) |
| $150,000 or more | 294 (25.8%) | 380 (19.8%) |
| Total | 1,140 (100.0%) | 1,924 (100.0%) |
Property Value to Household Income Ratio in Greenville
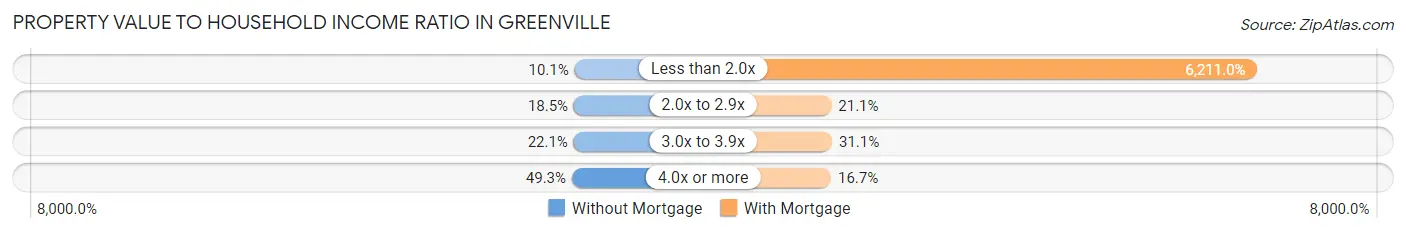
| Value-to-Income Ratio | Without Mortgage | With Mortgage |
| Less than 2.0x | 115 (10.1%) | 119,500 (6,211.0%) |
| 2.0x to 2.9x | 211 (18.5%) | 406 (21.1%) |
| 3.0x to 3.9x | 252 (22.1%) | 599 (31.1%) |
| 4.0x or more | 562 (49.3%) | 322 (16.7%) |
| Total | 1,140 (100.0%) | 1,924 (100.0%) |
Real Estate Taxes by Mortgage Status in Greenville
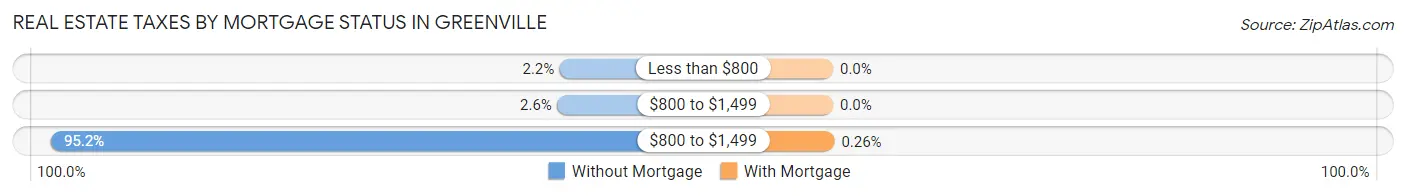
| Property Taxes | Without Mortgage | With Mortgage |
| Less than $800 | 25 (2.2%) | 0 (0.0%) |
| $800 to $1,499 | 30 (2.6%) | 0 (0.0%) |
| $800 to $1,499 | 1,085 (95.2%) | 5 (0.3%) |
| Total | 1,140 (100.0%) | 1,924 (100.0%) |
Health & Disability in Greenville
Health Insurance Coverage by Age in Greenville
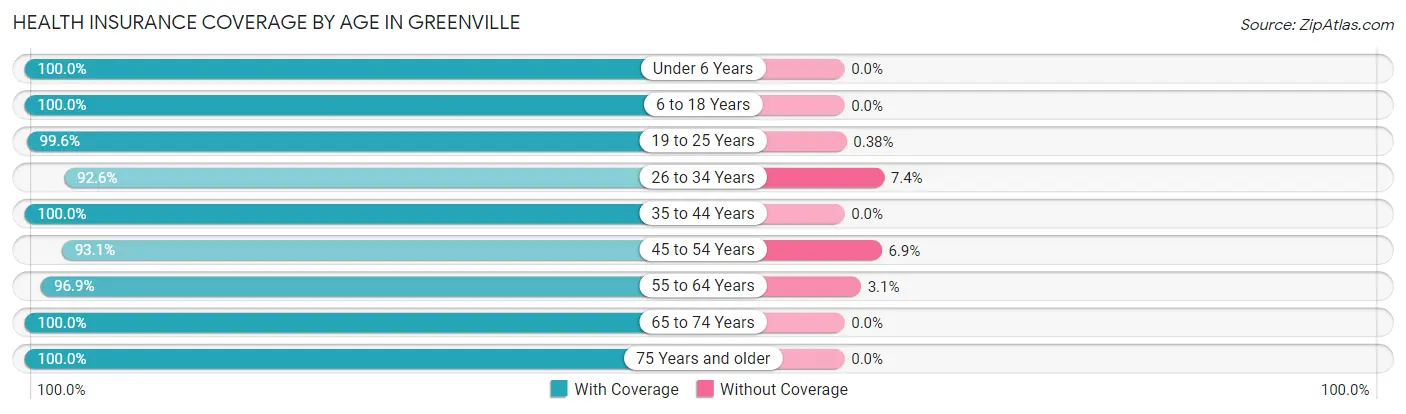
| Age Bracket | With Coverage | Without Coverage |
| Under 6 Years | 353 (100.0%) | 0 (0.0%) |
| 6 to 18 Years | 1,154 (100.0%) | 0 (0.0%) |
| 19 to 25 Years | 524 (99.6%) | 2 (0.4%) |
| 26 to 34 Years | 830 (92.6%) | 66 (7.4%) |
| 35 to 44 Years | 704 (100.0%) | 0 (0.0%) |
| 45 to 54 Years | 953 (93.1%) | 71 (6.9%) |
| 55 to 64 Years | 1,200 (96.9%) | 38 (3.1%) |
| 65 to 74 Years | 948 (100.0%) | 0 (0.0%) |
| 75 Years and older | 1,387 (100.0%) | 0 (0.0%) |
| Total | 8,053 (97.9%) | 177 (2.1%) |
Health Insurance Coverage by Citizenship Status in Greenville
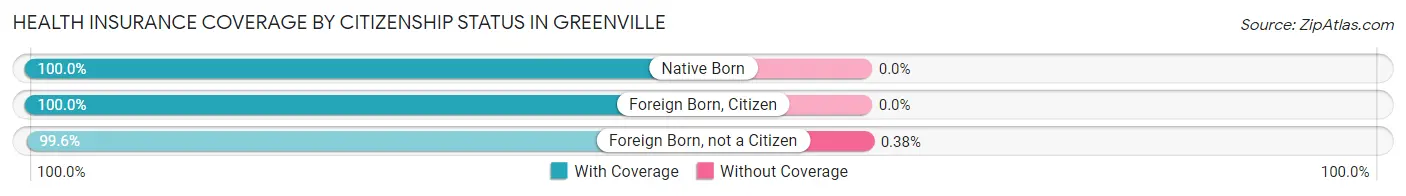
| Citizenship Status | With Coverage | Without Coverage |
| Native Born | 353 (100.0%) | 0 (0.0%) |
| Foreign Born, Citizen | 1,154 (100.0%) | 0 (0.0%) |
| Foreign Born, not a Citizen | 524 (99.6%) | 2 (0.4%) |
Health Insurance Coverage by Household Income in Greenville
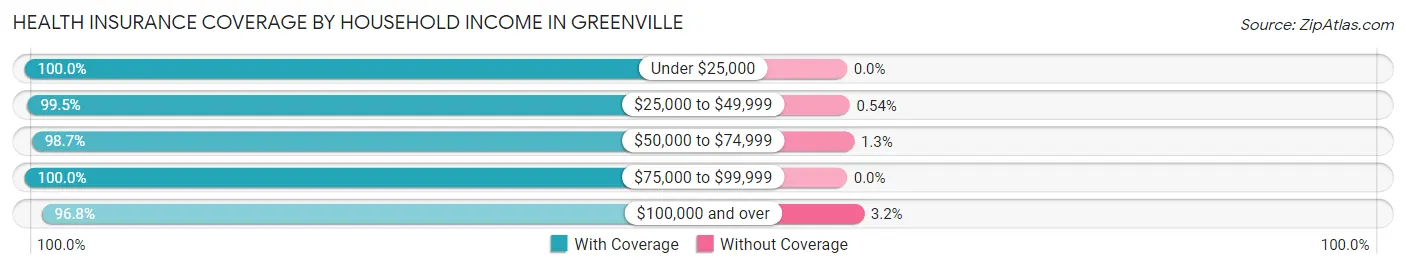
| Household Income | With Coverage | Without Coverage |
| Under $25,000 | 361 (100.0%) | 0 (0.0%) |
| $25,000 to $49,999 | 1,115 (99.5%) | 6 (0.5%) |
| $50,000 to $74,999 | 735 (98.7%) | 10 (1.3%) |
| $75,000 to $99,999 | 910 (100.0%) | 0 (0.0%) |
| $100,000 and over | 4,826 (96.8%) | 159 (3.2%) |
Public vs Private Health Insurance Coverage by Age in Greenville
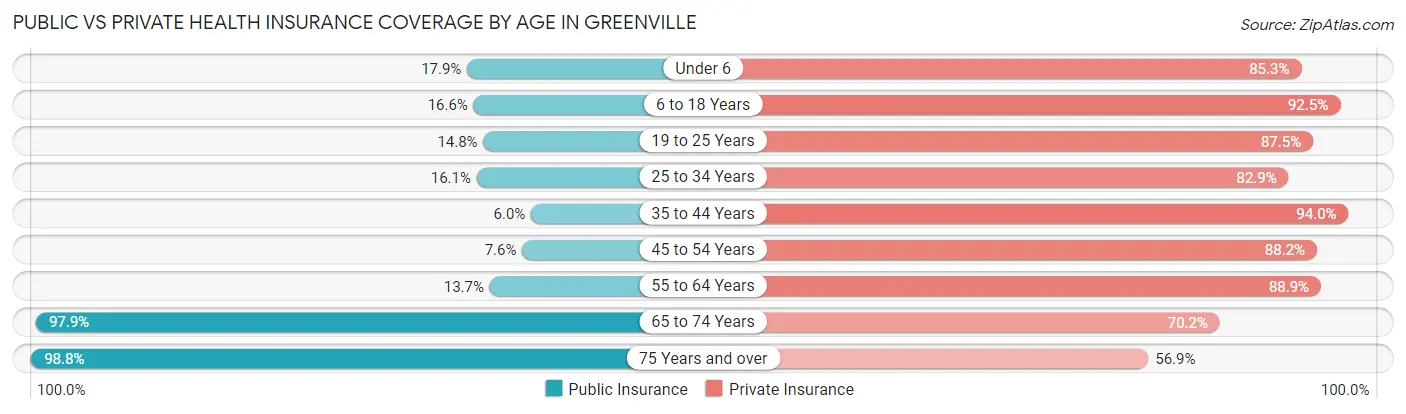
| Age Bracket | Public Insurance | Private Insurance |
| Under 6 | 63 (17.8%) | 301 (85.3%) |
| 6 to 18 Years | 192 (16.6%) | 1,067 (92.5%) |
| 19 to 25 Years | 78 (14.8%) | 460 (87.5%) |
| 25 to 34 Years | 144 (16.1%) | 743 (82.9%) |
| 35 to 44 Years | 42 (6.0%) | 662 (94.0%) |
| 45 to 54 Years | 78 (7.6%) | 903 (88.2%) |
| 55 to 64 Years | 169 (13.7%) | 1,101 (88.9%) |
| 65 to 74 Years | 928 (97.9%) | 665 (70.2%) |
| 75 Years and over | 1,370 (98.8%) | 789 (56.9%) |
| Total | 3,064 (37.2%) | 6,691 (81.3%) |
Disability Status by Sex by Age in Greenville
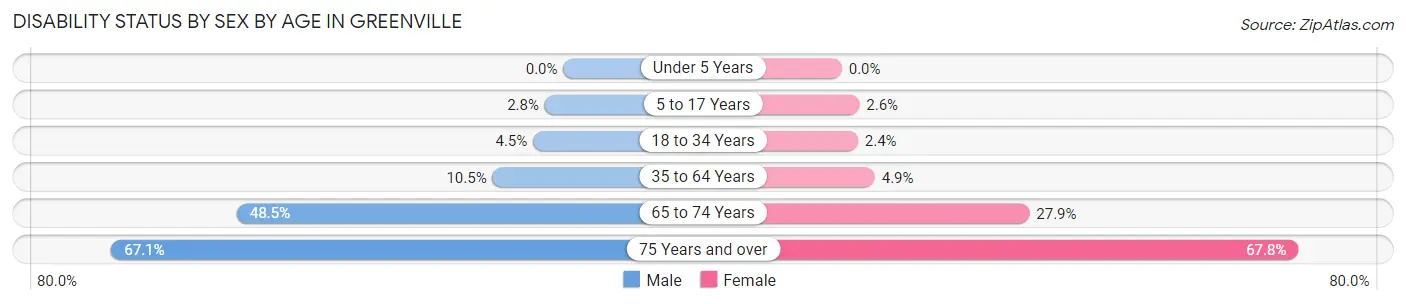
| Age Bracket | Male | Female |
| Under 5 Years | 0 (0.0%) | 0 (0.0%) |
| 5 to 17 Years | 13 (2.8%) | 16 (2.6%) |
| 18 to 34 Years | 41 (4.5%) | 15 (2.4%) |
| 35 to 64 Years | 151 (10.5%) | 75 (4.9%) |
| 65 to 74 Years | 209 (48.5%) | 144 (27.9%) |
| 75 Years and over | 402 (67.1%) | 534 (67.8%) |
Disability Class by Sex by Age in Greenville
Disability Class: Hearing Difficulty
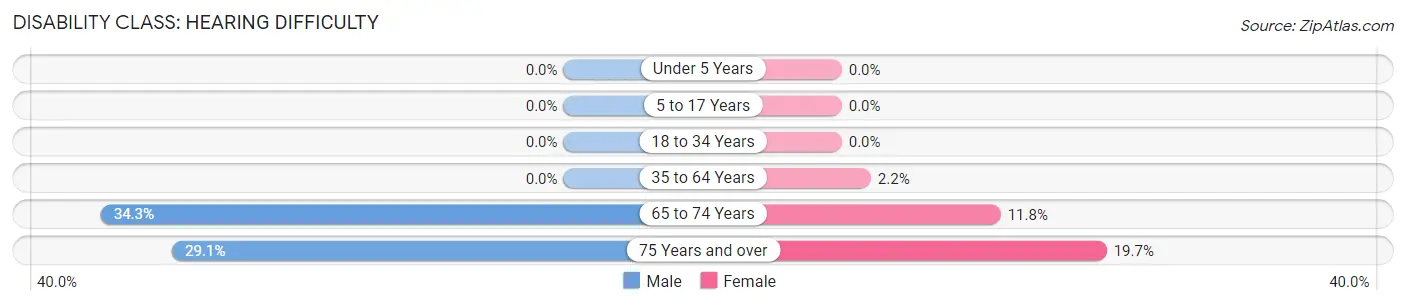
| Age Bracket | Male | Female |
| Under 5 Years | 0 (0.0%) | 0 (0.0%) |
| 5 to 17 Years | 0 (0.0%) | 0 (0.0%) |
| 18 to 34 Years | 0 (0.0%) | 0 (0.0%) |
| 35 to 64 Years | 0 (0.0%) | 33 (2.2%) |
| 65 to 74 Years | 148 (34.3%) | 61 (11.8%) |
| 75 Years and over | 174 (29.0%) | 155 (19.7%) |
Disability Class: Vision Difficulty
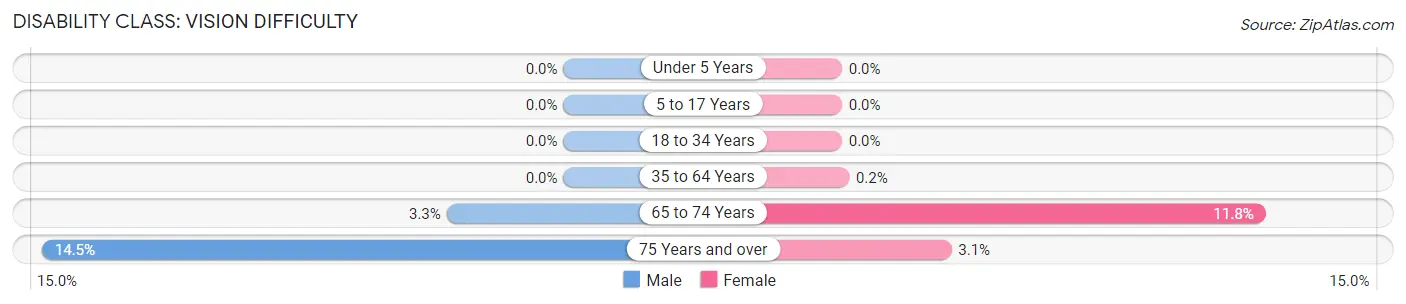
| Age Bracket | Male | Female |
| Under 5 Years | 0 (0.0%) | 0 (0.0%) |
| 5 to 17 Years | 0 (0.0%) | 0 (0.0%) |
| 18 to 34 Years | 0 (0.0%) | 0 (0.0%) |
| 35 to 64 Years | 0 (0.0%) | 3 (0.2%) |
| 65 to 74 Years | 14 (3.3%) | 61 (11.8%) |
| 75 Years and over | 87 (14.5%) | 24 (3.0%) |
Disability Class: Cognitive Difficulty
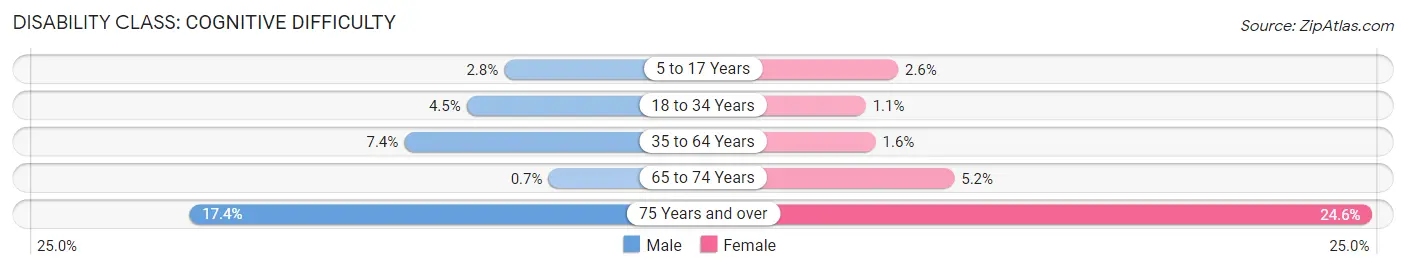
| Age Bracket | Male | Female |
| 5 to 17 Years | 13 (2.8%) | 16 (2.6%) |
| 18 to 34 Years | 41 (4.5%) | 7 (1.1%) |
| 35 to 64 Years | 106 (7.4%) | 24 (1.6%) |
| 65 to 74 Years | 3 (0.7%) | 27 (5.2%) |
| 75 Years and over | 104 (17.4%) | 194 (24.6%) |
Disability Class: Ambulatory Difficulty
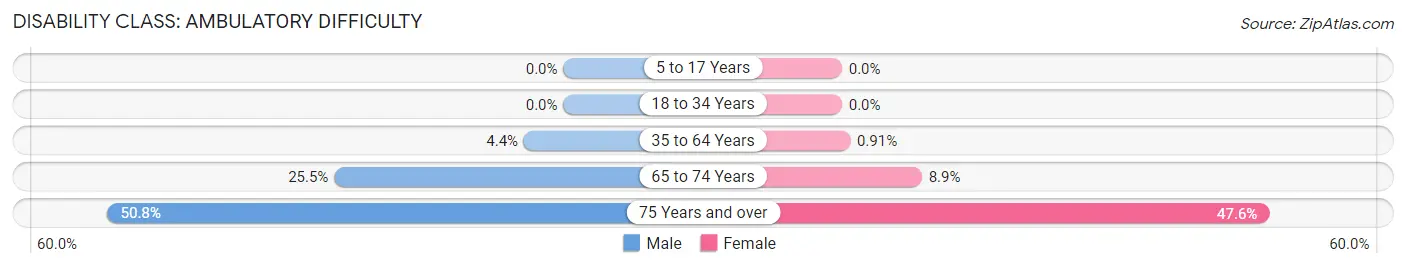
| Age Bracket | Male | Female |
| 5 to 17 Years | 0 (0.0%) | 0 (0.0%) |
| 18 to 34 Years | 0 (0.0%) | 0 (0.0%) |
| 35 to 64 Years | 63 (4.4%) | 14 (0.9%) |
| 65 to 74 Years | 110 (25.5%) | 46 (8.9%) |
| 75 Years and over | 304 (50.7%) | 375 (47.6%) |
Disability Class: Self-Care Difficulty
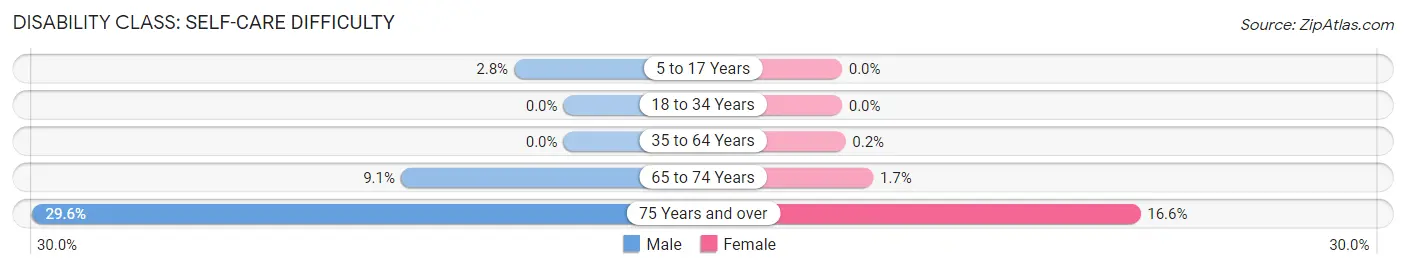
| Age Bracket | Male | Female |
| 5 to 17 Years | 13 (2.8%) | 0 (0.0%) |
| 18 to 34 Years | 0 (0.0%) | 0 (0.0%) |
| 35 to 64 Years | 0 (0.0%) | 3 (0.2%) |
| 65 to 74 Years | 39 (9.0%) | 9 (1.7%) |
| 75 Years and over | 177 (29.5%) | 131 (16.6%) |
Technology Access in Greenville
Computing Device Access in Greenville
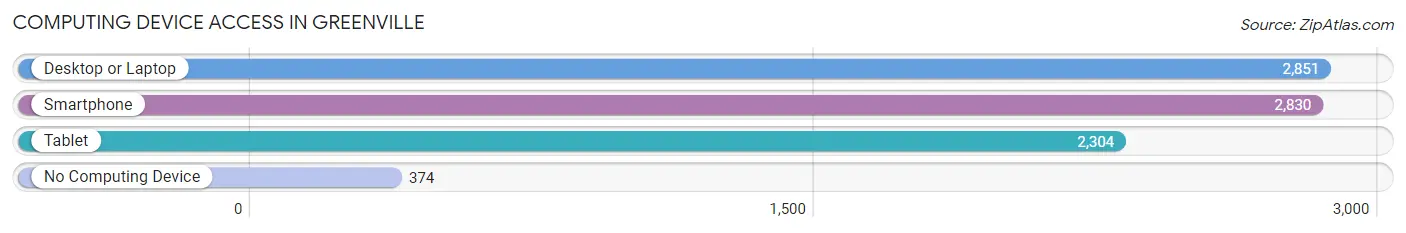
| Device Type | # Households | % Households |
| Desktop or Laptop | 2,851 | 79.7% |
| Smartphone | 2,830 | 79.1% |
| Tablet | 2,304 | 64.4% |
| No Computing Device | 374 | 10.4% |
| Total | 3,579 | 100.0% |
Internet Access in Greenville
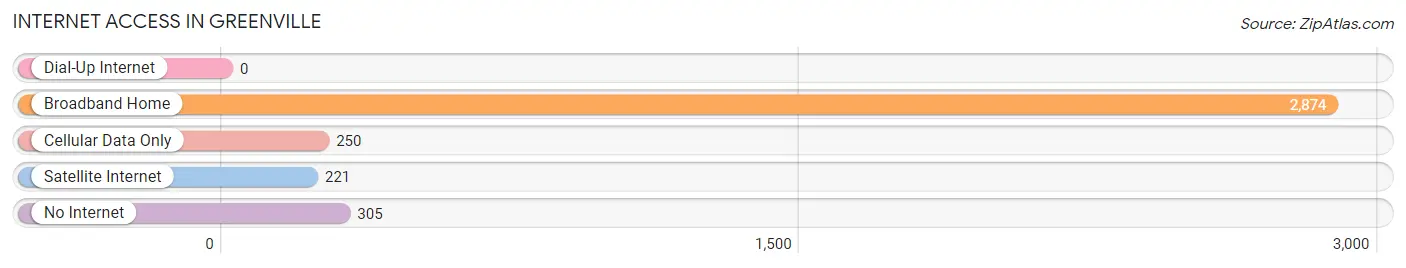
| Internet Type | # Households | % Households |
| Dial-Up Internet | 0 | 0.0% |
| Broadband Home | 2,874 | 80.3% |
| Cellular Data Only | 250 | 7.0% |
| Satellite Internet | 221 | 6.2% |
| No Internet | 305 | 8.5% |
| Total | 3,579 | 100.0% |
Greenville Summary
Greenville, Rhode Island is a small town located in the southwestern part of the state. It is part of the Providence metropolitan area and is bordered by the towns of Smithfield, Johnston, and North Providence. The town has a population of approximately 15,000 people and is home to a variety of businesses, schools, and recreational activities.
Geography
Greenville is located in the southwestern part of Rhode Island, approximately 10 miles from the state capital of Providence. The town is bordered by the towns of Smithfield, Johnston, and North Providence. The town is situated on the banks of the Woonasquatucket River, which flows through the center of town. The town is also home to several ponds, including the Greenville Pond, which is the largest body of water in the town. The town is mostly flat, with some hills in the northern part of town.
Economy
Greenville is home to a variety of businesses, including manufacturing, retail, and service industries. The town is home to several large employers, including the Greenville Industrial Park, which is home to several manufacturing companies. The town is also home to several retail stores, including a Walmart Supercenter, a Lowe’s Home Improvement store, and a Target. The town is also home to several restaurants, including the popular Greenville Diner.
Demographics
As of the 2010 census, Greenville had a population of 15,000 people. The town is predominantly white, with a small percentage of African Americans, Hispanics, and Asians. The median household income in the town is $50,000, and the median home value is $200,000. The town has a high rate of homeownership, with approximately 75% of the population owning their own homes.
Education
Greenville is home to several public schools, including the Greenville Elementary School, the Greenville Middle School, and the Greenville High School. The town is also home to several private schools, including the St. Mary’s Academy and the St. John’s Preparatory School. The town is also home to the Community College of Rhode Island, which offers a variety of degree and certificate programs.
Conclusion
Greenville, Rhode Island is a small town located in the southwestern part of the state. It is part of the Providence metropolitan area and is bordered by the towns of Smithfield, Johnston, and North Providence. The town has a population of approximately 15,000 people and is home to a variety of businesses, schools, and recreational activities. The town is predominantly white, with a small percentage of African Americans, Hispanics, and Asians. The town has a high rate of homeownership, with approximately 75% of the population owning their own homes. Greenville is home to several public and private schools, as well as the Community College of Rhode Island. The town is also home to a variety of businesses, including manufacturing, retail, and service industries.
Common Questions
What is Per Capita Income in Greenville?
Per Capita income in Greenville is $48,602.
What is the Median Family Income in Greenville?
Median Family Income in Greenville is $124,744.
What is the Median Household income in Greenville?
Median Household Income in Greenville is $92,367.
What is Income or Wage Gap in Greenville?
Income or Wage Gap in Greenville is 15.0%.
Women in Greenville earn 85.0 cents for every dollar earned by a man.
What is Inequality or Gini Index in Greenville?
Inequality or Gini Index in Greenville is 0.41.
What is the Total Population of Greenville?
Total Population of Greenville is 8,777.
What is the Total Male Population of Greenville?
Total Male Population of Greenville is 4,239.
What is the Total Female Population of Greenville?
Total Female Population of Greenville is 4,538.
What is the Ratio of Males per 100 Females in Greenville?
There are 93.41 Males per 100 Females in Greenville.
What is the Ratio of Females per 100 Males in Greenville?
There are 107.05 Females per 100 Males in Greenville.
What is the Median Population Age in Greenville?
Median Population Age in Greenville is 52.4 Years.
What is the Average Family Size in Greenville
Average Family Size in Greenville is 2.8 People.
What is the Average Household Size in Greenville
Average Household Size in Greenville is 2.3 People.
How Large is the Labor Force in Greenville?
There are 4,272 People in the Labor Forcein in Greenville.
What is the Percentage of People in the Labor Force in Greenville?
55.4% of People are in the Labor Force in Greenville.
What is the Unemployment Rate in Greenville?
Unemployment Rate in Greenville is 3.4%.