Charlestown, RI Map & Demographics
Charlestown Map
Charlestown Overview
$84,017
PER CAPITA INCOME
$127,292
AVG FAMILY INCOME
$109,563
AVG HOUSEHOLD INCOME
47.3%
WAGE / INCOME GAP [ % ]
52.7¢/ $1
WAGE / INCOME GAP [ $ ]
0.53
INEQUALITY / GINI INDEX
1,702
TOTAL POPULATION
806
MALE POPULATION
896
FEMALE POPULATION
89.96
MALES / 100 FEMALES
111.17
FEMALES / 100 MALES
63.2
MEDIAN AGE
2.5
AVG FAMILY SIZE
2.0
AVG HOUSEHOLD SIZE
847
LABOR FORCE [ PEOPLE ]
51.5%
PERCENT IN LABOR FORCE
9.2%
UNEMPLOYMENT RATE
Charlestown Zip Codes
Charlestown Area Codes
Income in Charlestown
Income Overview in Charlestown
Per Capita Income in Charlestown is $84,017, while median incomes of families and households are $127,292 and $109,563 respectively.
| Characteristic | Number | Measure |
| Per Capita Income | 1,702 | $84,017 |
| Median Family Income | 514 | $127,292 |
| Mean Family Income | 514 | $204,905 |
| Median Household Income | 849 | $109,563 |
| Mean Household Income | 849 | $165,663 |
| Income Deficit | 514 | $0 |
| Wage / Income Gap (%) | 1,702 | 47.28% |
| Wage / Income Gap ($) | 1,702 | 52.72¢ per $1 |
| Gini / Inequality Index | 1,702 | 0.53 |
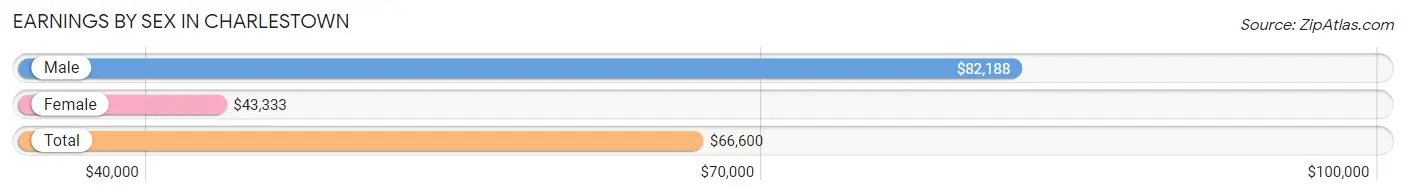
Earnings by Sex in Charlestown
Average Earnings in Charlestown are $66,600, $82,188 for men and $43,333 for women, a difference of 47.3%.
| Sex | Number | Average Earnings |
| Male | 396 (46.1%) | $82,188 |
| Female | 464 (53.9%) | $43,333 |
| Total | 860 (100.0%) | $66,600 |
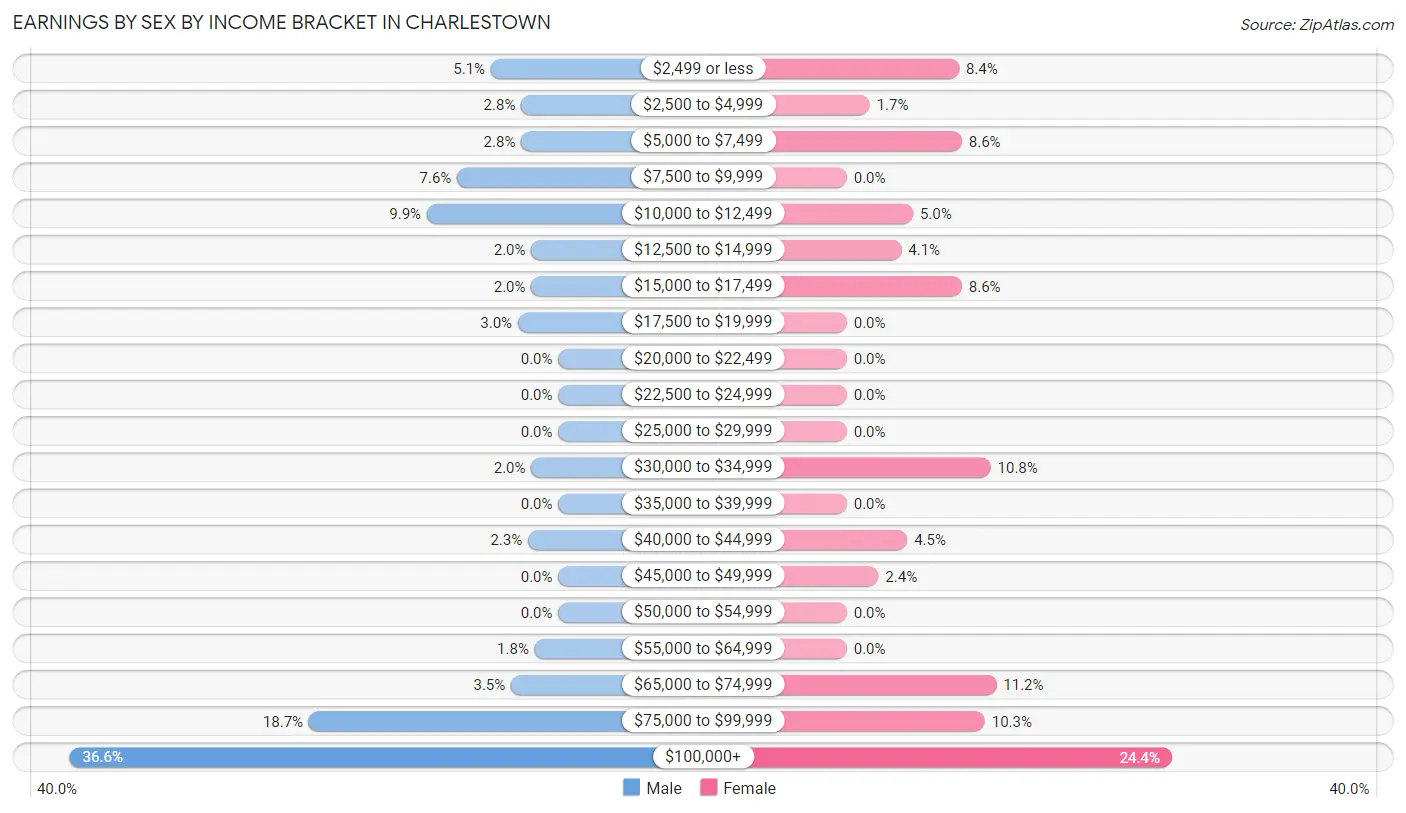
Earnings by Sex by Income Bracket in Charlestown
The most common earnings brackets in Charlestown are $100,000+ for men (145 | 36.6%) and $100,000+ for women (113 | 24.3%).
| Income | Male | Female |
| $2,499 or less | 20 (5.1%) | 39 (8.4%) |
| $2,500 to $4,999 | 11 (2.8%) | 8 (1.7%) |
| $5,000 to $7,499 | 11 (2.8%) | 40 (8.6%) |
| $7,500 to $9,999 | 30 (7.6%) | 0 (0.0%) |
| $10,000 to $12,499 | 39 (9.9%) | 23 (5.0%) |
| $12,500 to $14,999 | 8 (2.0%) | 19 (4.1%) |
| $15,000 to $17,499 | 8 (2.0%) | 40 (8.6%) |
| $17,500 to $19,999 | 12 (3.0%) | 0 (0.0%) |
| $20,000 to $22,499 | 0 (0.0%) | 0 (0.0%) |
| $22,500 to $24,999 | 0 (0.0%) | 0 (0.0%) |
| $25,000 to $29,999 | 0 (0.0%) | 0 (0.0%) |
| $30,000 to $34,999 | 8 (2.0%) | 50 (10.8%) |
| $35,000 to $39,999 | 0 (0.0%) | 0 (0.0%) |
| $40,000 to $44,999 | 9 (2.3%) | 21 (4.5%) |
| $45,000 to $49,999 | 0 (0.0%) | 11 (2.4%) |
| $50,000 to $54,999 | 0 (0.0%) | 0 (0.0%) |
| $55,000 to $64,999 | 7 (1.8%) | 0 (0.0%) |
| $65,000 to $74,999 | 14 (3.5%) | 52 (11.2%) |
| $75,000 to $99,999 | 74 (18.7%) | 48 (10.3%) |
| $100,000+ | 145 (36.6%) | 113 (24.3%) |
| Total | 396 (100.0%) | 464 (100.0%) |
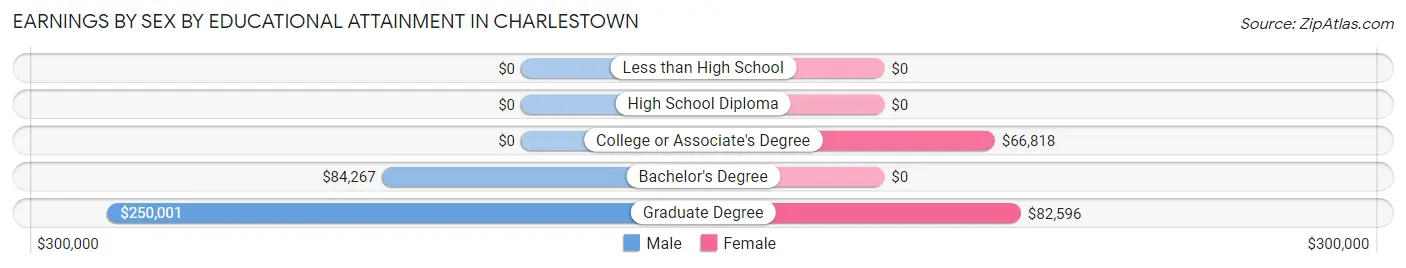
Earnings by Sex by Educational Attainment in Charlestown
Average earnings in Charlestown are $83,147 for men and $68,942 for women, a difference of 17.1%. Men with an educational attainment of graduate degree enjoy the highest average annual earnings of $250,001, while those with bachelor's degree education earn the least with $84,267. Women with an educational attainment of graduate degree earn the most with the average annual earnings of $82,596, while those with college or associate's degree education have the smallest earnings of $66,818.
| Educational Attainment | Male Income | Female Income |
| Less than High School | - | - |
| High School Diploma | - | - |
| College or Associate's Degree | - | - |
| Bachelor's Degree | $84,267 | $0 |
| Graduate Degree | $250,001 | $82,596 |
| Total | $83,147 | $68,942 |
Family Income in Charlestown
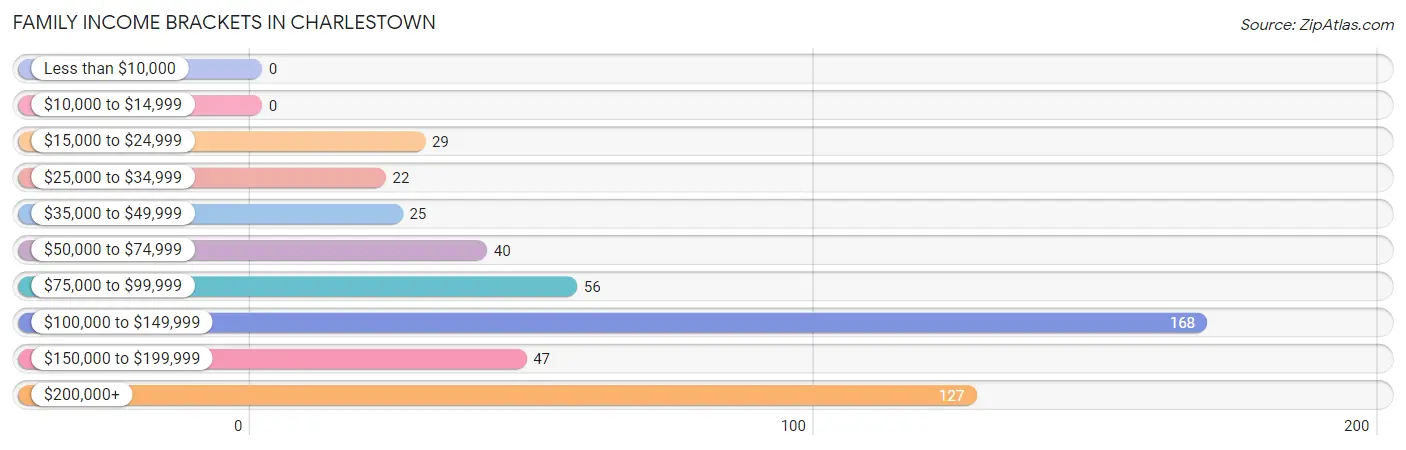
Family Income Brackets in Charlestown
According to the Charlestown family income data, there are 168 families falling into the $100,000 to $149,999 income range, which is the most common income bracket and makes up 32.7% of all families.
| Income Bracket | # Families | % Families |
| Less than $10,000 | 0 | 0.0% |
| $10,000 to $14,999 | 0 | 0.0% |
| $15,000 to $24,999 | 29 | 5.6% |
| $25,000 to $34,999 | 22 | 4.3% |
| $35,000 to $49,999 | 25 | 4.9% |
| $50,000 to $74,999 | 40 | 7.8% |
| $75,000 to $99,999 | 56 | 10.9% |
| $100,000 to $149,999 | 168 | 32.7% |
| $150,000 to $199,999 | 47 | 9.1% |
| $200,000+ | 127 | 24.7% |
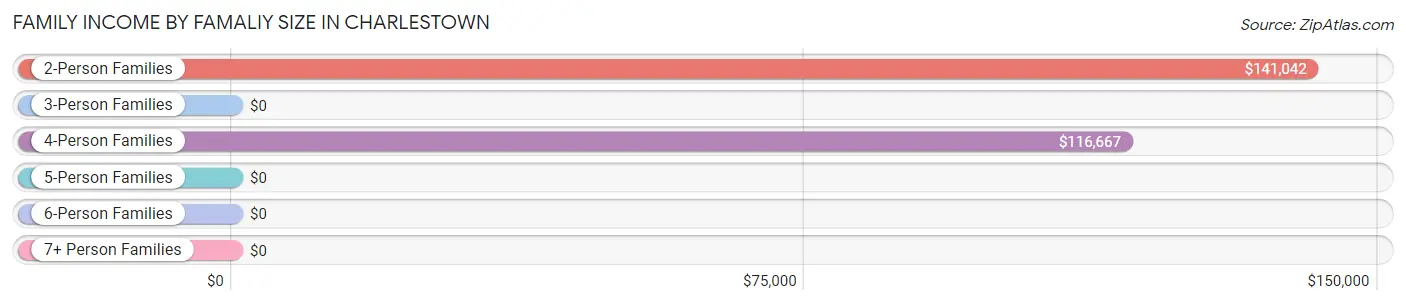
Family Income by Famaliy Size in Charlestown
2-person families (417 | 81.1%) account for the highest median family income in Charlestown with $141,042 per family, while 2-person families (417 | 81.1%) have the highest median income of $70,521 per family member.
| Income Bracket | # Families | Median Income |
| 2-Person Families | 417 (81.1%) | $141,042 |
| 3-Person Families | 41 (8.0%) | $0 |
| 4-Person Families | 50 (9.7%) | $116,667 |
| 5-Person Families | 6 (1.2%) | $0 |
| 6-Person Families | 0 (0.0%) | $0 |
| 7+ Person Families | 0 (0.0%) | $0 |
| Total | 514 (100.0%) | $127,292 |
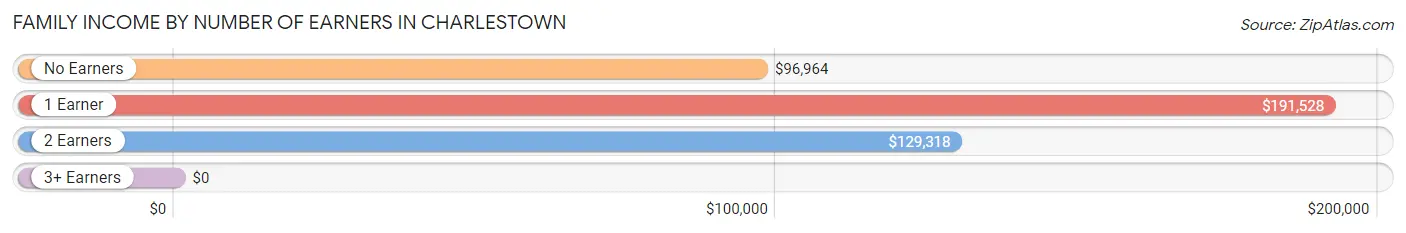
Family Income by Number of Earners in Charlestown
| Number of Earners | # Families | Median Income |
| No Earners | 177 (34.4%) | $96,964 |
| 1 Earner | 176 (34.2%) | $191,528 |
| 2 Earners | 146 (28.4%) | $129,318 |
| 3+ Earners | 15 (2.9%) | $0 |
| Total | 514 (100.0%) | $127,292 |
Household Income in Charlestown
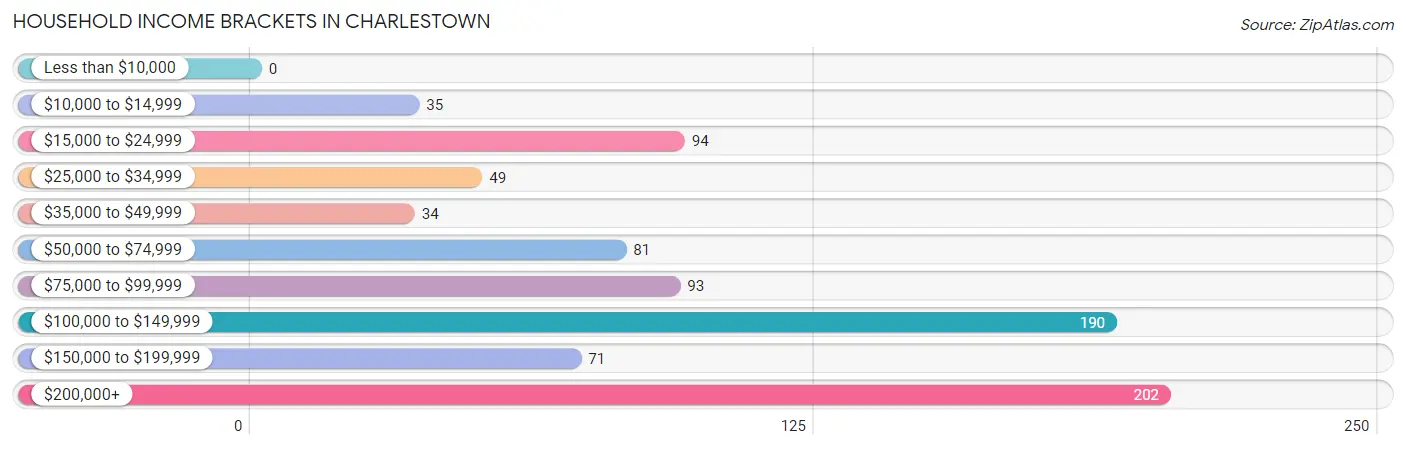
Household Income Brackets in Charlestown
With 202 households falling in the category, the $200,000+ income range is the most frequent in Charlestown, accounting for 23.8% of all households.
| Income Bracket | # Households | % Households |
| Less than $10,000 | 0 | 0.0% |
| $10,000 to $14,999 | 35 | 4.1% |
| $15,000 to $24,999 | 94 | 11.1% |
| $25,000 to $34,999 | 49 | 5.8% |
| $35,000 to $49,999 | 34 | 4.0% |
| $50,000 to $74,999 | 81 | 9.5% |
| $75,000 to $99,999 | 93 | 11.0% |
| $100,000 to $149,999 | 190 | 22.4% |
| $150,000 to $199,999 | 71 | 8.4% |
| $200,000+ | 202 | 23.8% |
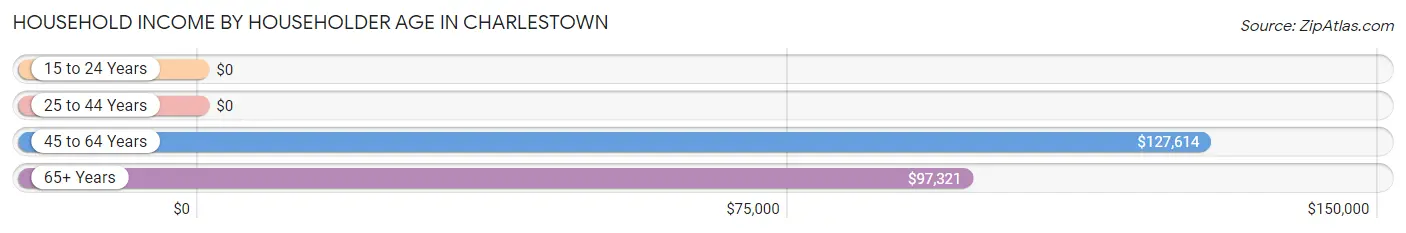
Household Income by Householder Age in Charlestown
The median household income in Charlestown is $109,563, with the highest median household income of $127,614 found in the 45 to 64 years age bracket for the primary householder. A total of 309 households (36.4%) fall into this category.
| Income Bracket | # Households | Median Income |
| 15 to 24 Years | 0 (0.0%) | $0 |
| 25 to 44 Years | 73 (8.6%) | $0 |
| 45 to 64 Years | 309 (36.4%) | $127,614 |
| 65+ Years | 467 (55.0%) | $97,321 |
| Total | 849 (100.0%) | $109,563 |
Poverty in Charlestown
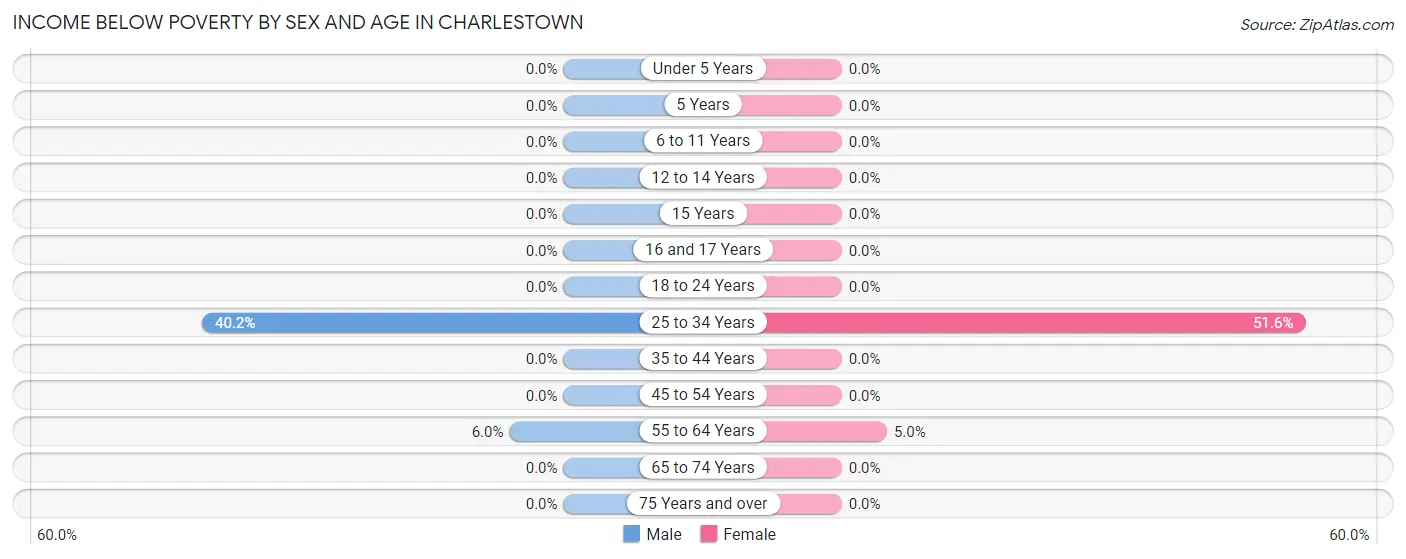
Income Below Poverty by Sex and Age in Charlestown
With 5.6% poverty level for males and 4.7% for females among the residents of Charlestown, 25 to 34 year old males and 25 to 34 year old females are the most vulnerable to poverty, with 35 males (40.2%) and 32 females (51.6%) in their respective age groups living below the poverty level.
| Age Bracket | Male | Female |
| Under 5 Years | 0 (0.0%) | 0 (0.0%) |
| 5 Years | 0 (0.0%) | 0 (0.0%) |
| 6 to 11 Years | 0 (0.0%) | 0 (0.0%) |
| 12 to 14 Years | 0 (0.0%) | 0 (0.0%) |
| 15 Years | 0 (0.0%) | 0 (0.0%) |
| 16 and 17 Years | 0 (0.0%) | 0 (0.0%) |
| 18 to 24 Years | 0 (0.0%) | 0 (0.0%) |
| 25 to 34 Years | 35 (40.2%) | 32 (51.6%) |
| 35 to 44 Years | 0 (0.0%) | 0 (0.0%) |
| 45 to 54 Years | 0 (0.0%) | 0 (0.0%) |
| 55 to 64 Years | 10 (6.0%) | 10 (5.0%) |
| 65 to 74 Years | 0 (0.0%) | 0 (0.0%) |
| 75 Years and over | 0 (0.0%) | 0 (0.0%) |
| Total | 45 (5.6%) | 42 (4.7%) |
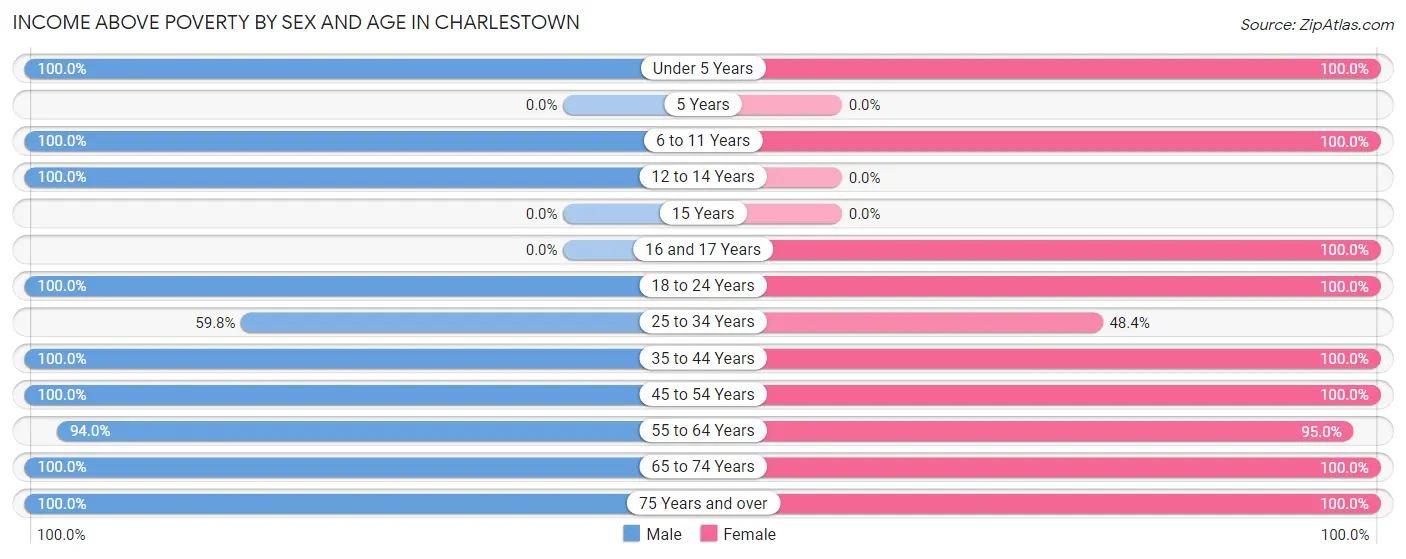
Income Above Poverty by Sex and Age in Charlestown
According to the poverty statistics in Charlestown, males aged under 5 years and females aged under 5 years are the age groups that are most secure financially, with 100.0% of males and 100.0% of females in these age groups living above the poverty line.
| Age Bracket | Male | Female |
| Under 5 Years | 8 (100.0%) | 17 (100.0%) |
| 5 Years | 0 (0.0%) | 0 (0.0%) |
| 6 to 11 Years | 11 (100.0%) | 9 (100.0%) |
| 12 to 14 Years | 13 (100.0%) | 0 (0.0%) |
| 15 Years | 0 (0.0%) | 0 (0.0%) |
| 16 and 17 Years | 0 (0.0%) | 11 (100.0%) |
| 18 to 24 Years | 19 (100.0%) | 79 (100.0%) |
| 25 to 34 Years | 52 (59.8%) | 30 (48.4%) |
| 35 to 44 Years | 49 (100.0%) | 30 (100.0%) |
| 45 to 54 Years | 98 (100.0%) | 97 (100.0%) |
| 55 to 64 Years | 156 (94.0%) | 189 (95.0%) |
| 65 to 74 Years | 230 (100.0%) | 227 (100.0%) |
| 75 Years and over | 125 (100.0%) | 165 (100.0%) |
| Total | 761 (94.4%) | 854 (95.3%) |
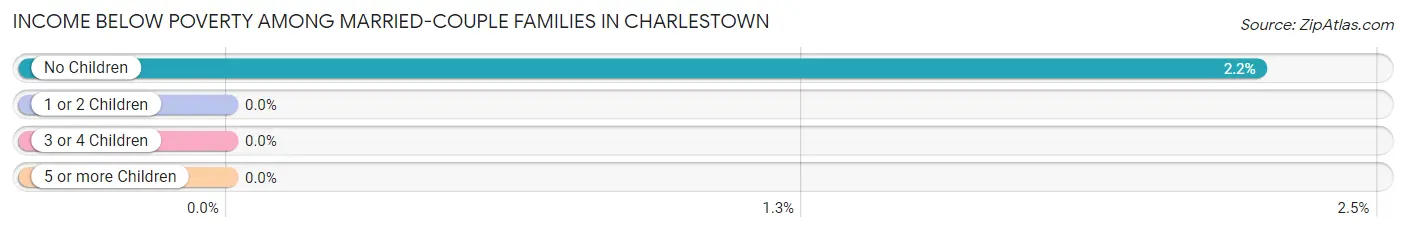
Income Below Poverty Among Married-Couple Families in Charlestown
The poverty statistics for married-couple families in Charlestown show that 2.1% or 10 of the total 481 families live below the poverty line. Families with no children have the highest poverty rate of 2.2%, comprising of 10 families. On the other hand, families with 1 or 2 children have the lowest poverty rate of 0.0%, which includes 0 families.
| Children | Above Poverty | Below Poverty |
| No Children | 436 (97.8%) | 10 (2.2%) |
| 1 or 2 Children | 35 (100.0%) | 0 (0.0%) |
| 3 or 4 Children | 0 (0.0%) | 0 (0.0%) |
| 5 or more Children | 0 (0.0%) | 0 (0.0%) |
| Total | 471 (97.9%) | 10 (2.1%) |
Income Below Poverty Among Single-Parent Households in Charlestown
| Children | Single Father | Single Mother |
| No Children | 0 (0.0%) | 0 (0.0%) |
| 1 or 2 Children | 0 (0.0%) | 0 (0.0%) |
| 3 or 4 Children | 0 (0.0%) | 0 (0.0%) |
| 5 or more Children | 0 (0.0%) | 0 (0.0%) |
| Total | 0 (0.0%) | 0 (0.0%) |
Income Below Poverty Among Married-Couple vs Single-Parent Households in Charlestown
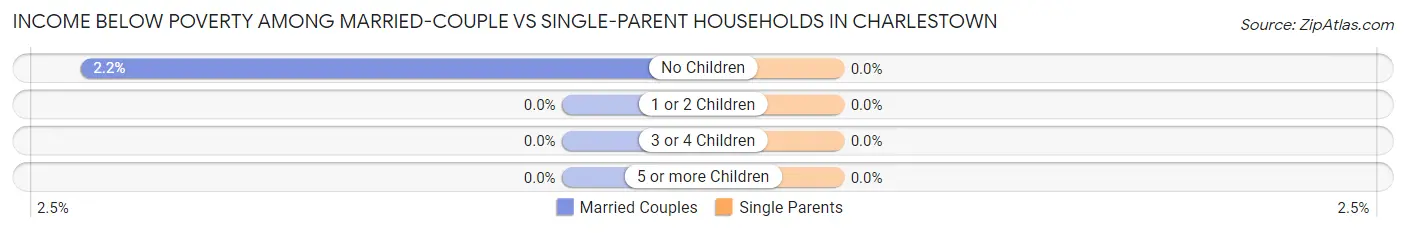
| Children | Married-Couple Families | Single-Parent Households |
| No Children | 10 (2.2%) | 0 (0.0%) |
| 1 or 2 Children | 0 (0.0%) | 0 (0.0%) |
| 3 or 4 Children | 0 (0.0%) | 0 (0.0%) |
| 5 or more Children | 0 (0.0%) | 0 (0.0%) |
| Total | 10 (2.1%) | 0 (0.0%) |
Race in Charlestown
The most populous races in Charlestown are White / Caucasian (1,593 | 93.6%), Two or more Races (73 | 4.3%), and Black / African American (36 | 2.1%).
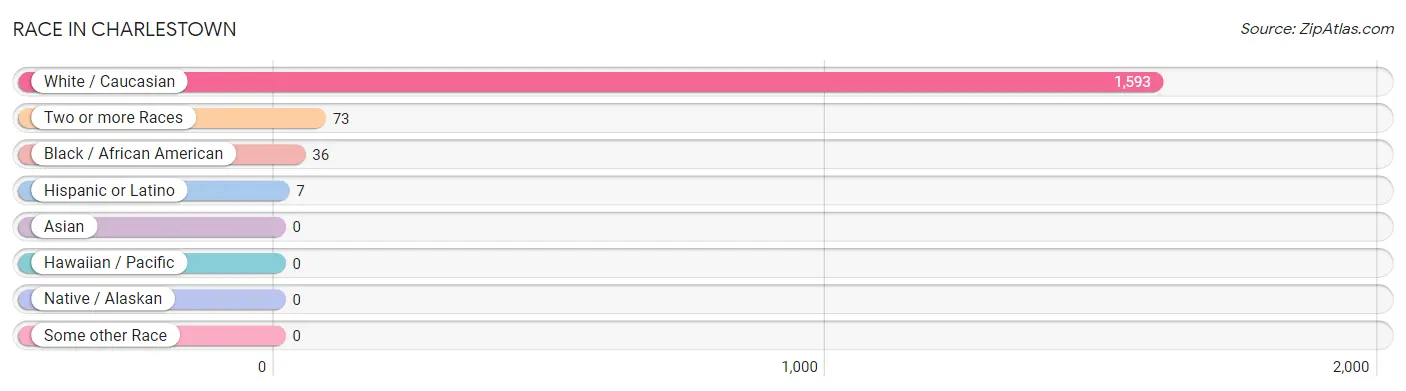
| Race | # Population | % Population |
| Asian | 0 | 0.0% |
| Black / African American | 36 | 2.1% |
| Hawaiian / Pacific | 0 | 0.0% |
| Hispanic or Latino | 7 | 0.4% |
| Native / Alaskan | 0 | 0.0% |
| White / Caucasian | 1,593 | 93.6% |
| Two or more Races | 73 | 4.3% |
| Some other Race | 0 | 0.0% |
| Total | 1,702 | 100.0% |
Ancestry in Charlestown
The most populous ancestries reported in Charlestown are Italian (420 | 24.7%), Irish (391 | 23.0%), English (243 | 14.3%), French (149 | 8.7%), and German (135 | 7.9%), together accounting for 78.6% of all Charlestown residents.
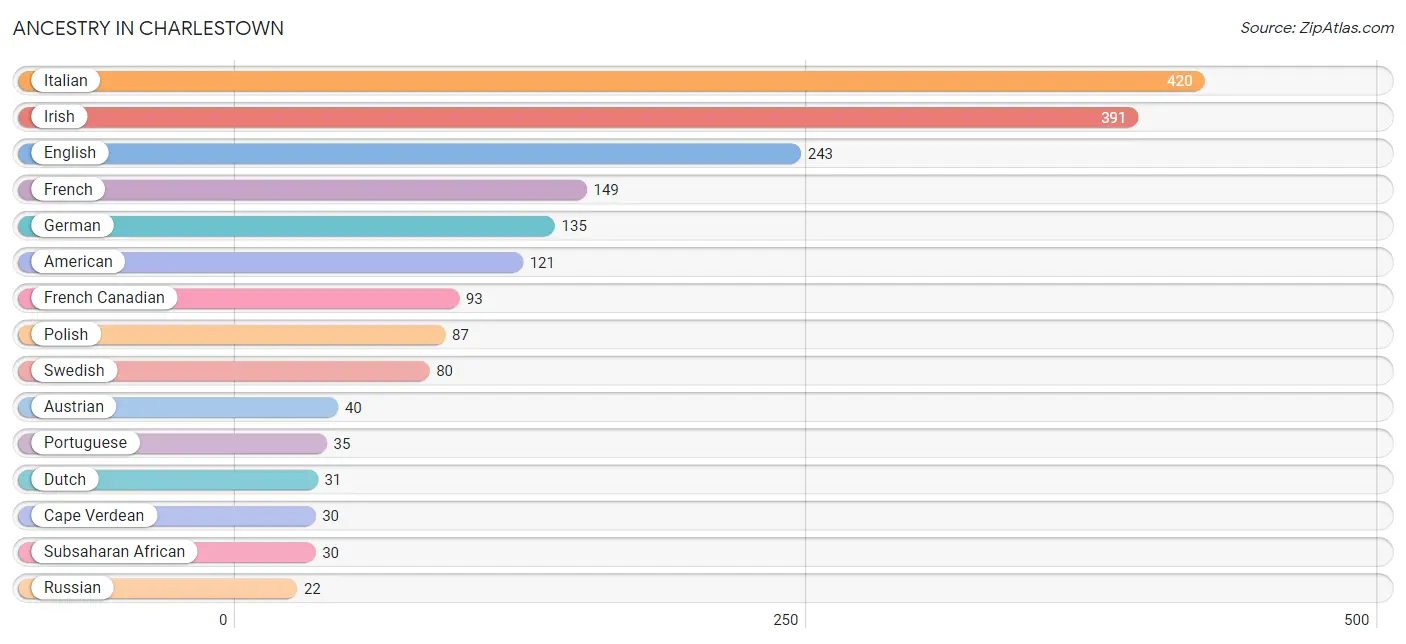
| Ancestry | # Population | % Population |
| American | 121 | 7.1% |
| Arab | 8 | 0.5% |
| Austrian | 40 | 2.4% |
| British | 19 | 1.1% |
| Cape Verdean | 30 | 1.8% |
| Czechoslovakian | 8 | 0.5% |
| Dutch | 31 | 1.8% |
| Eastern European | 16 | 0.9% |
| English | 243 | 14.3% |
| European | 9 | 0.5% |
| French | 149 | 8.7% |
| French Canadian | 93 | 5.5% |
| German | 135 | 7.9% |
| Irish | 391 | 23.0% |
| Italian | 420 | 24.7% |
| Lithuanian | 10 | 0.6% |
| Norwegian | 9 | 0.5% |
| Polish | 87 | 5.1% |
| Portuguese | 35 | 2.1% |
| Russian | 22 | 1.3% |
| Scandinavian | 19 | 1.1% |
| Scotch-Irish | 10 | 0.6% |
| Scottish | 18 | 1.1% |
| South American | 7 | 0.4% |
| Subsaharan African | 30 | 1.8% |
| Swedish | 80 | 4.7% |
| Syrian | 8 | 0.5% |
| Turkish | 14 | 0.8% |
| Venezuelan | 7 | 0.4% |
| Welsh | 17 | 1.0% |
| Yugoslavian | 9 | 0.5% | View All 31 Rows |
Immigrants in Charlestown
The most numerous immigrant groups reported in Charlestown came from Europe (16 | 0.9%), Eastern Europe (10 | 0.6%), Poland (10 | 0.6%), Australia (9 | 0.5%), and Oceania (9 | 0.5%), together accounting for 3.2% of all Charlestown residents.
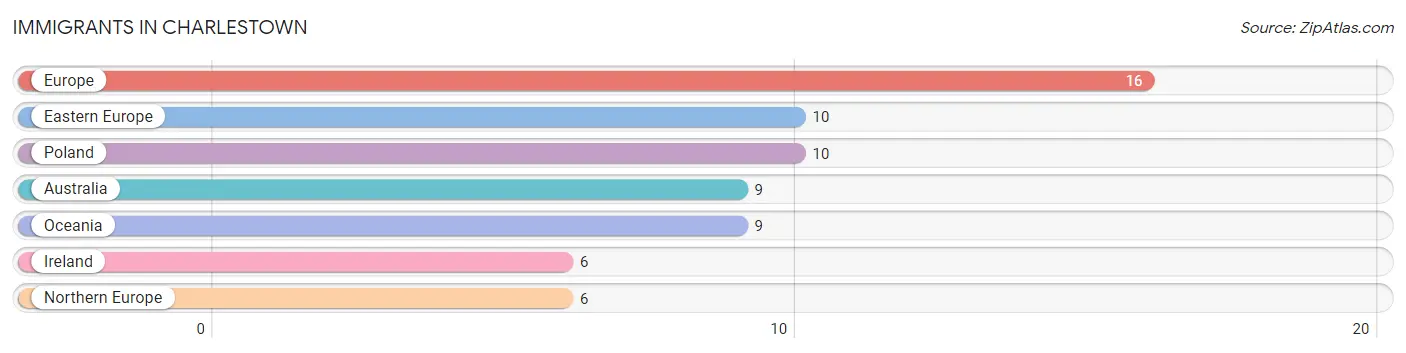
| Immigration Origin | # Population | % Population |
| Australia | 9 | 0.5% |
| Eastern Europe | 10 | 0.6% |
| Europe | 16 | 0.9% |
| Ireland | 6 | 0.4% |
| Northern Europe | 6 | 0.4% |
| Oceania | 9 | 0.5% |
| Poland | 10 | 0.6% | View All 7 Rows |
Sex and Age in Charlestown
Sex and Age in Charlestown
The most populous age groups in Charlestown are 70 to 74 Years (142 | 17.6%) for men and 60 to 64 Years (135 | 15.1%) for women.
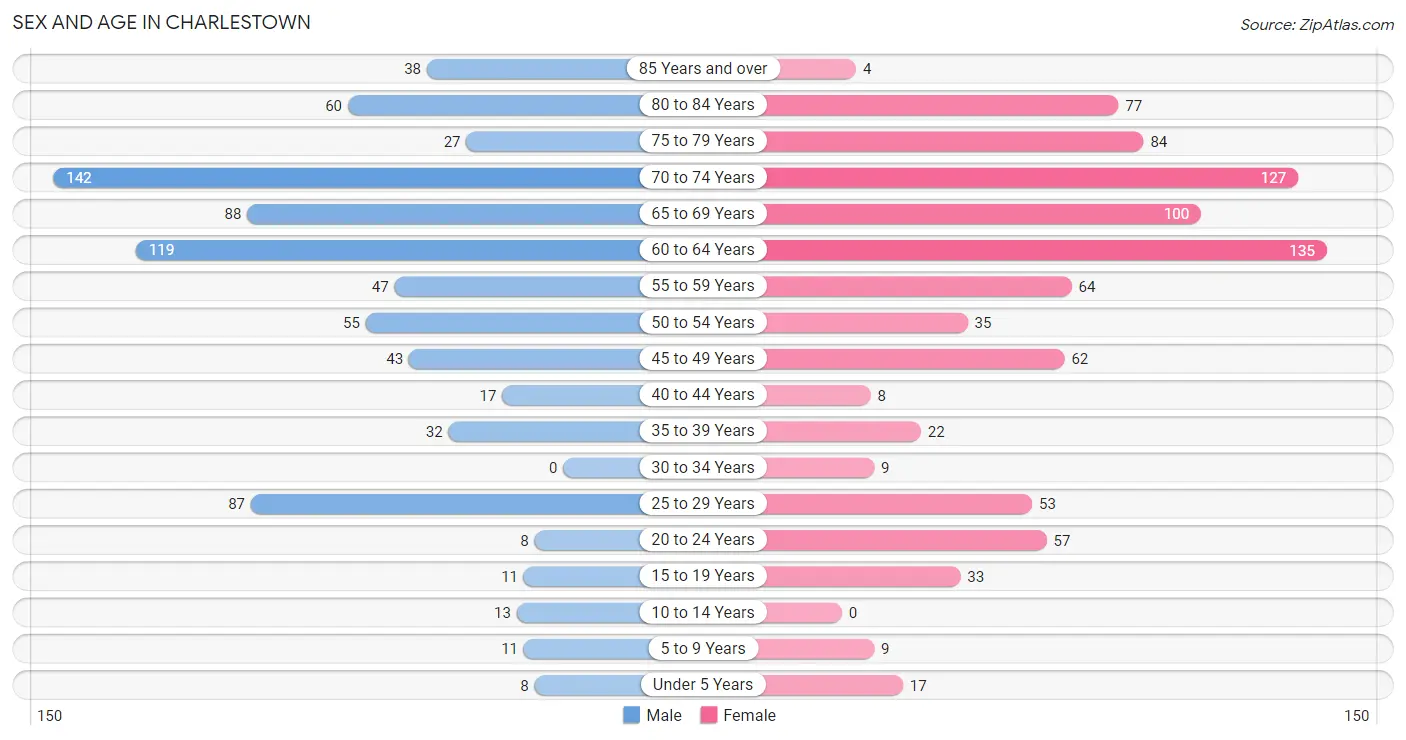
| Age Bracket | Male | Female |
| Under 5 Years | 8 (1.0%) | 17 (1.9%) |
| 5 to 9 Years | 11 (1.4%) | 9 (1.0%) |
| 10 to 14 Years | 13 (1.6%) | 0 (0.0%) |
| 15 to 19 Years | 11 (1.4%) | 33 (3.7%) |
| 20 to 24 Years | 8 (1.0%) | 57 (6.4%) |
| 25 to 29 Years | 87 (10.8%) | 53 (5.9%) |
| 30 to 34 Years | 0 (0.0%) | 9 (1.0%) |
| 35 to 39 Years | 32 (4.0%) | 22 (2.5%) |
| 40 to 44 Years | 17 (2.1%) | 8 (0.9%) |
| 45 to 49 Years | 43 (5.3%) | 62 (6.9%) |
| 50 to 54 Years | 55 (6.8%) | 35 (3.9%) |
| 55 to 59 Years | 47 (5.8%) | 64 (7.1%) |
| 60 to 64 Years | 119 (14.8%) | 135 (15.1%) |
| 65 to 69 Years | 88 (10.9%) | 100 (11.2%) |
| 70 to 74 Years | 142 (17.6%) | 127 (14.2%) |
| 75 to 79 Years | 27 (3.4%) | 84 (9.4%) |
| 80 to 84 Years | 60 (7.4%) | 77 (8.6%) |
| 85 Years and over | 38 (4.7%) | 4 (0.4%) |
| Total | 806 (100.0%) | 896 (100.0%) |
Families and Households in Charlestown
Median Family Size in Charlestown
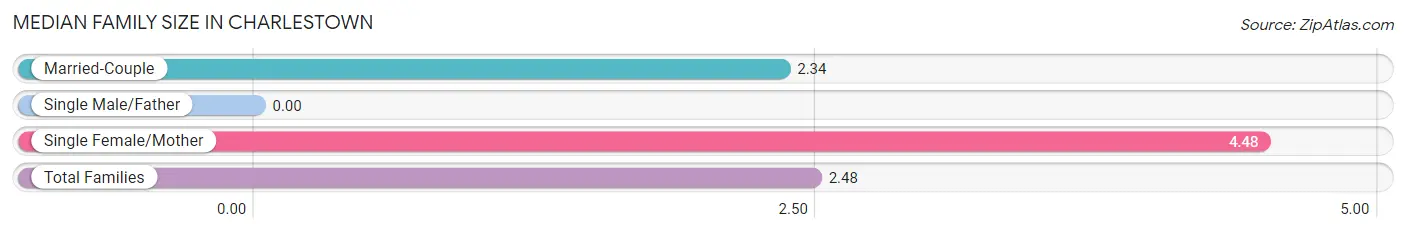
| Family Type | # Families | Family Size |
| Married-Couple | 481 (93.6%) | 2.34 |
| Single Male/Father | 0 (0.0%) | - |
| Single Female/Mother | 33 (6.4%) | 4.48 |
| Total Families | 514 (100.0%) | 2.48 |
Median Household Size in Charlestown
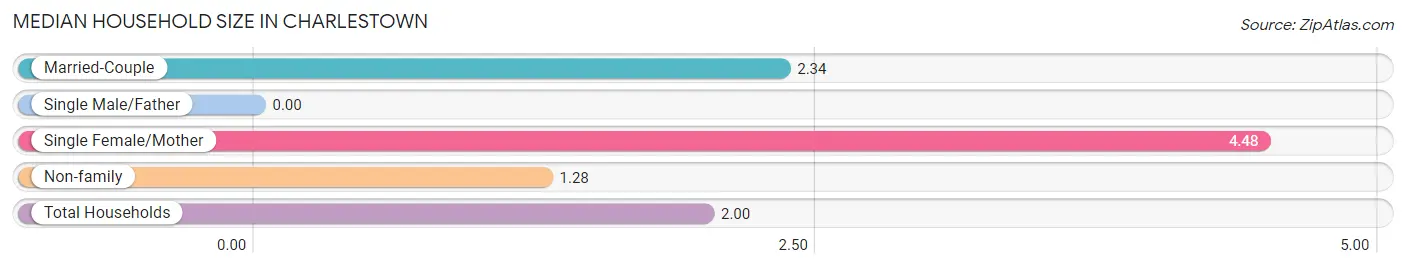
| Household Type | # Households | Household Size |
| Married-Couple | 481 (56.7%) | 2.34 |
| Single Male/Father | 0 (0.0%) | - |
| Single Female/Mother | 33 (3.9%) | 4.48 |
| Non-family | 335 (39.5%) | 1.28 |
| Total Households | 849 (100.0%) | 2.00 |
Household Size by Marriage Status in Charlestown
Out of a total of 849 households in Charlestown, 514 (60.5%) are family households, while 335 (39.5%) are nonfamily households. The most numerous type of family households are 2-person households, comprising 417, and the most common type of nonfamily households are 1-person households, comprising 248.
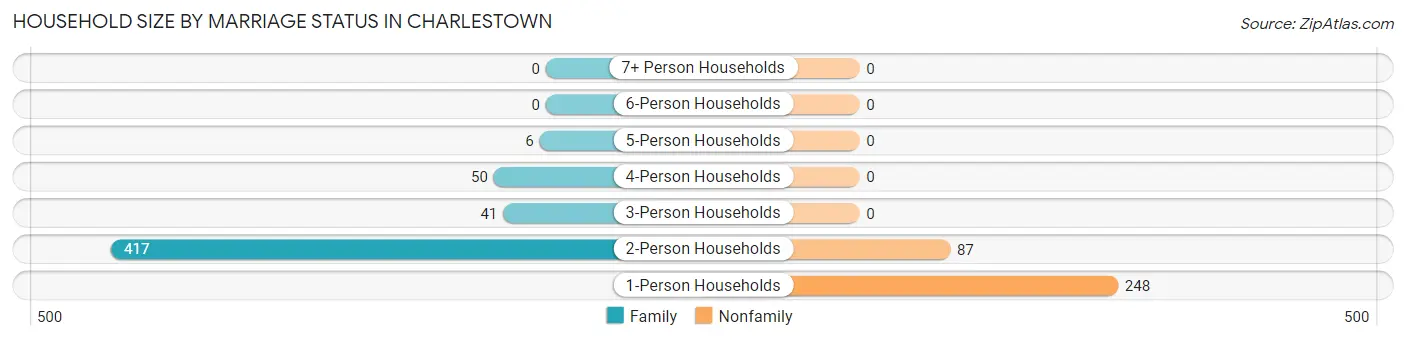
| Household Size | Family Households | Nonfamily Households |
| 1-Person Households | - | 248 (29.2%) |
| 2-Person Households | 417 (49.1%) | 87 (10.2%) |
| 3-Person Households | 41 (4.8%) | 0 (0.0%) |
| 4-Person Households | 50 (5.9%) | 0 (0.0%) |
| 5-Person Households | 6 (0.7%) | 0 (0.0%) |
| 6-Person Households | 0 (0.0%) | 0 (0.0%) |
| 7+ Person Households | 0 (0.0%) | 0 (0.0%) |
| Total | 514 (60.5%) | 335 (39.5%) |
Female Fertility in Charlestown
Fertility by Age in Charlestown
Average fertility rate in Charlestown is 107.0 births per 1,000 women. Women in the age bracket of 35 to 50 years have the highest fertility rate with 174.0 births per 1,000 women. Women in the age bracket of 35 to 50 years acount for 67.9% of all women with births.
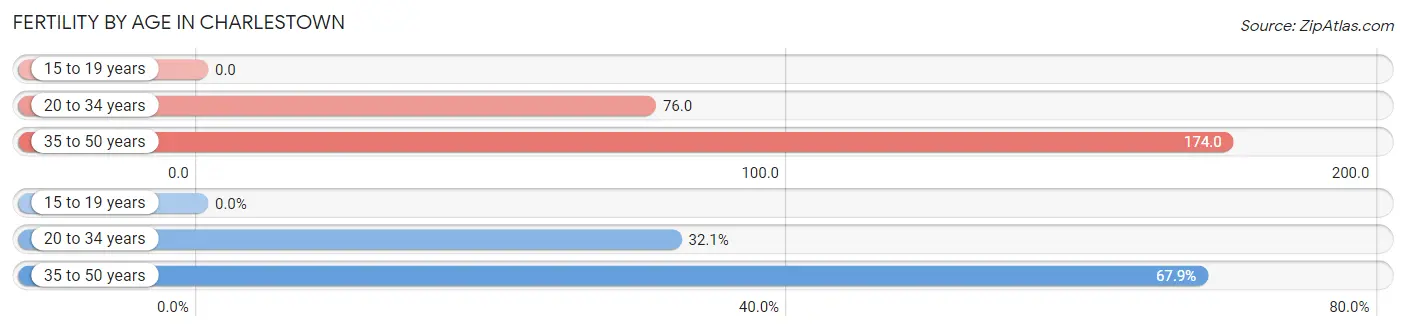
| Age Bracket | Women with Births | Births / 1,000 Women |
| 15 to 19 years | 0 (0.0%) | 0.0 |
| 20 to 34 years | 9 (32.1%) | 76.0 |
| 35 to 50 years | 19 (67.9%) | 174.0 |
| Total | 28 (100.0%) | 107.0 |
Fertility by Age by Marriage Status in Charlestown
60.7% of women with births (28) in Charlestown are married. The highest percentage of unmarried women with births falls into 35 to 50 years age bracket with 57.9% of them unmarried at the time of birth, while the lowest percentage of unmarried women with births belong to 20 to 34 years age bracket with 0.0% of them unmarried.
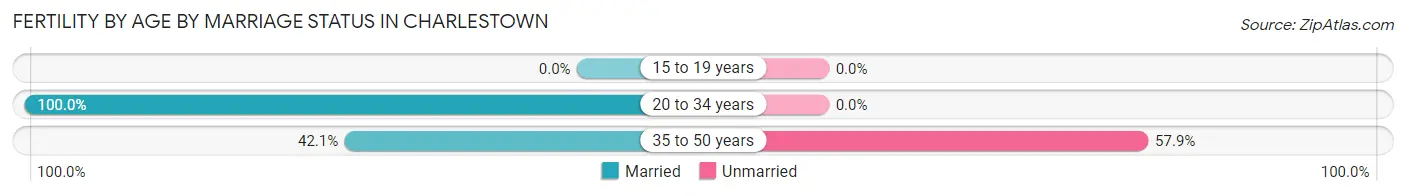
| Age Bracket | Married | Unmarried |
| 15 to 19 years | 0 (0.0%) | 0 (0.0%) |
| 20 to 34 years | 9 (100.0%) | 0 (0.0%) |
| 35 to 50 years | 8 (42.1%) | 11 (57.9%) |
| Total | 17 (60.7%) | 11 (39.3%) |
Fertility by Education in Charlestown
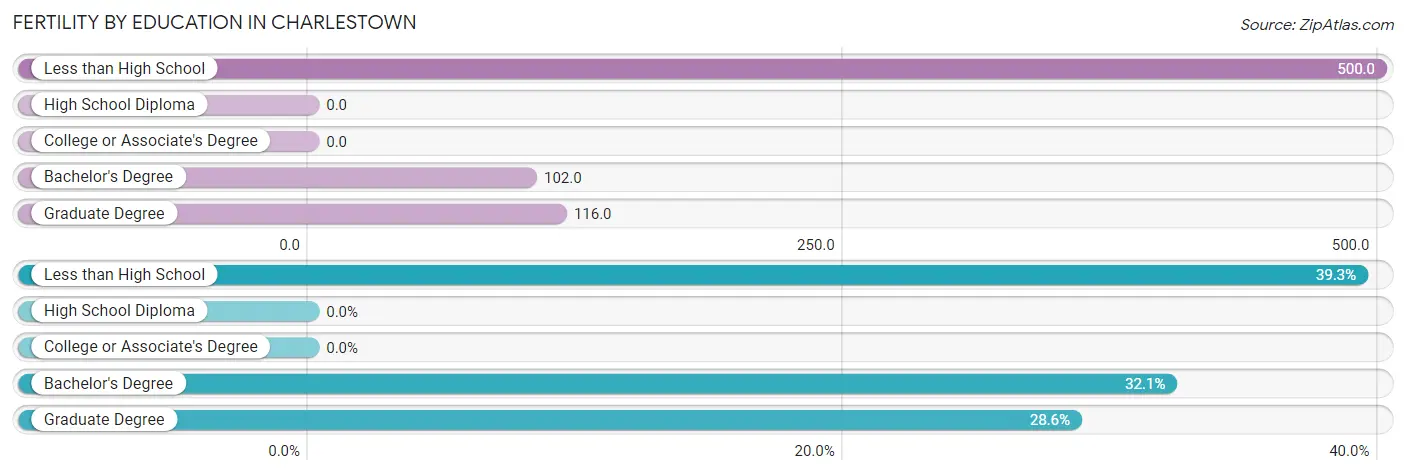
| Educational Attainment | Women with Births | Births / 1,000 Women |
| Less than High School | 11 (39.3%) | 500.0 |
| High School Diploma | 0 (0.0%) | 0.0 |
| College or Associate's Degree | 0 (0.0%) | 0.0 |
| Bachelor's Degree | 9 (32.1%) | 102.0 |
| Graduate Degree | 8 (28.6%) | 116.0 |
| Total | 28 (100.0%) | 107.0 |
Fertility by Education by Marriage Status in Charlestown
39.3% of women with births in Charlestown are unmarried. Women with the educational attainment of bachelor's degree are most likely to be married with 100.0% of them married at childbirth, while women with the educational attainment of less than high school are least likely to be married with 100.0% of them unmarried at childbirth.
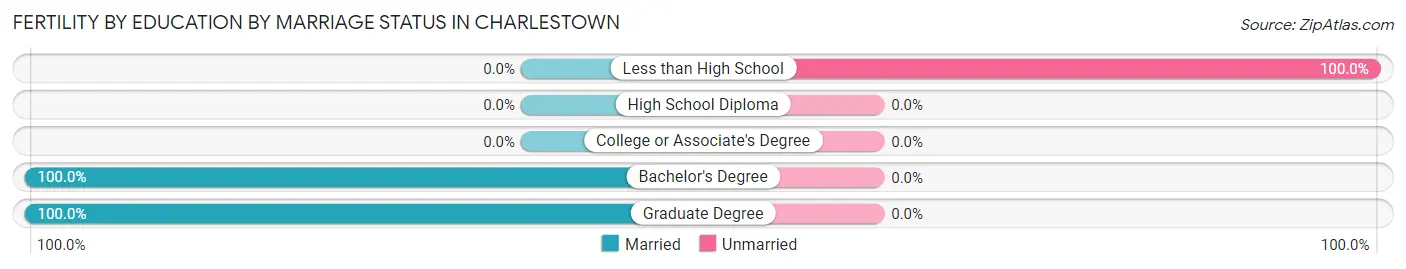
| Educational Attainment | Married | Unmarried |
| Less than High School | 0 (0.0%) | 11 (100.0%) |
| High School Diploma | 0 (0.0%) | 0 (0.0%) |
| College or Associate's Degree | 0 (0.0%) | 0 (0.0%) |
| Bachelor's Degree | 9 (100.0%) | 0 (0.0%) |
| Graduate Degree | 8 (100.0%) | 0 (0.0%) |
| Total | 17 (60.7%) | 11 (39.3%) |
Employment Characteristics in Charlestown
Employment by Class of Employer in Charlestown
Among the 740 employed individuals in Charlestown, private company employees (417 | 56.4%), not-for-profit organizations (93 | 12.6%), and self-employed (not incorporated) (72 | 9.7%) make up the most common classes of employment.
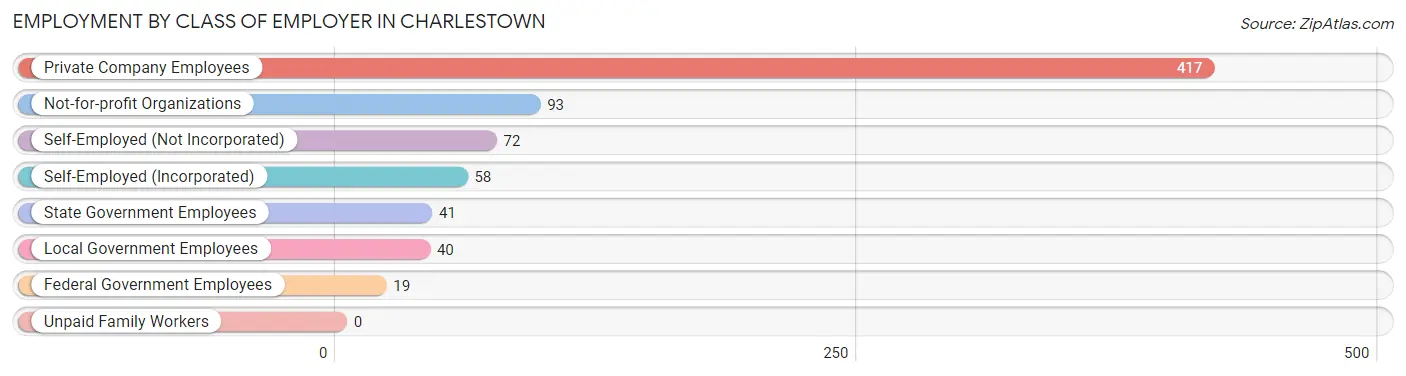
| Employer Class | # Employees | % Employees |
| Private Company Employees | 417 | 56.4% |
| Self-Employed (Incorporated) | 58 | 7.8% |
| Self-Employed (Not Incorporated) | 72 | 9.7% |
| Not-for-profit Organizations | 93 | 12.6% |
| Local Government Employees | 40 | 5.4% |
| State Government Employees | 41 | 5.5% |
| Federal Government Employees | 19 | 2.6% |
| Unpaid Family Workers | 0 | 0.0% |
| Total | 740 | 100.0% |
Employment Status by Age in Charlestown
According to the labor force statistics for Charlestown, out of the total population over 16 years of age (1,644), 51.5% or 847 individuals are in the labor force, with 9.2% or 78 of them unemployed. The age group with the highest labor force participation rate is 16 to 19 years, with 100.0% or 44 individuals in the labor force. Within the labor force, the 25 to 29 years age range has the highest percentage of unemployed individuals, with 30.0% or 9 of them being unemployed.
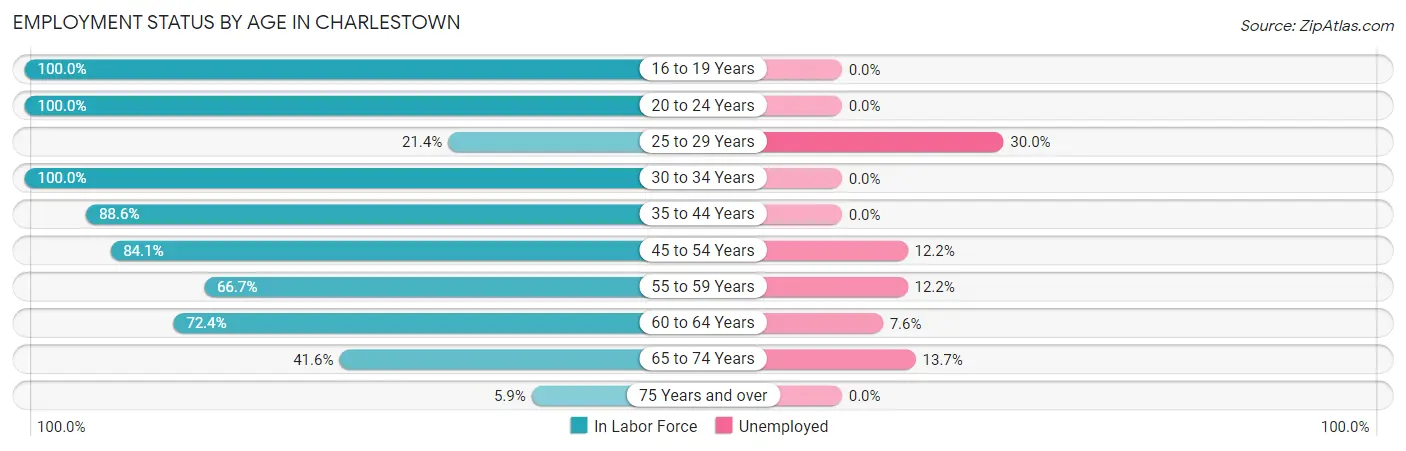
| Age Bracket | In Labor Force | Unemployed |
| 16 to 19 Years | 44 (100.0%) | 0 (0.0%) |
| 20 to 24 Years | 65 (100.0%) | 0 (0.0%) |
| 25 to 29 Years | 30 (21.4%) | 9 (30.0%) |
| 30 to 34 Years | 9 (100.0%) | 0 (0.0%) |
| 35 to 44 Years | 70 (88.6%) | 0 (0.0%) |
| 45 to 54 Years | 164 (84.1%) | 20 (12.2%) |
| 55 to 59 Years | 74 (66.7%) | 9 (12.2%) |
| 60 to 64 Years | 184 (72.4%) | 14 (7.6%) |
| 65 to 74 Years | 190 (41.6%) | 26 (13.7%) |
| 75 Years and over | 17 (5.9%) | 0 (0.0%) |
| Total | 847 (51.5%) | 78 (9.2%) |
Employment Status by Educational Attainment in Charlestown
According to labor force statistics for Charlestown, 67.4% of individuals (531) out of the total population between 25 and 64 years of age (788) are in the labor force, with 9.8% or 52 of them being unemployed. The group with the highest labor force participation rate are those with the educational attainment of less than high school, with 100.0% or 11 individuals in the labor force. Within the labor force, individuals with high school diploma education have the highest percentage of unemployment, with 11.4% or 8 of them being unemployed.
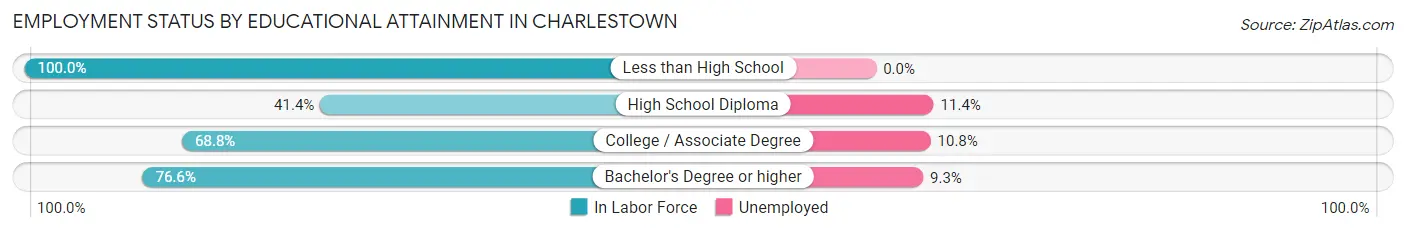
| Educational Attainment | In Labor Force | Unemployed |
| Less than High School | 11 (100.0%) | 0 (0.0%) |
| High School Diploma | 70 (41.4%) | 19 (11.4%) |
| College / Associate Degree | 139 (68.8%) | 22 (10.8%) |
| Bachelor's Degree or higher | 311 (76.6%) | 38 (9.3%) |
| Total | 531 (67.4%) | 77 (9.8%) |
Employment Occupations by Sex in Charlestown
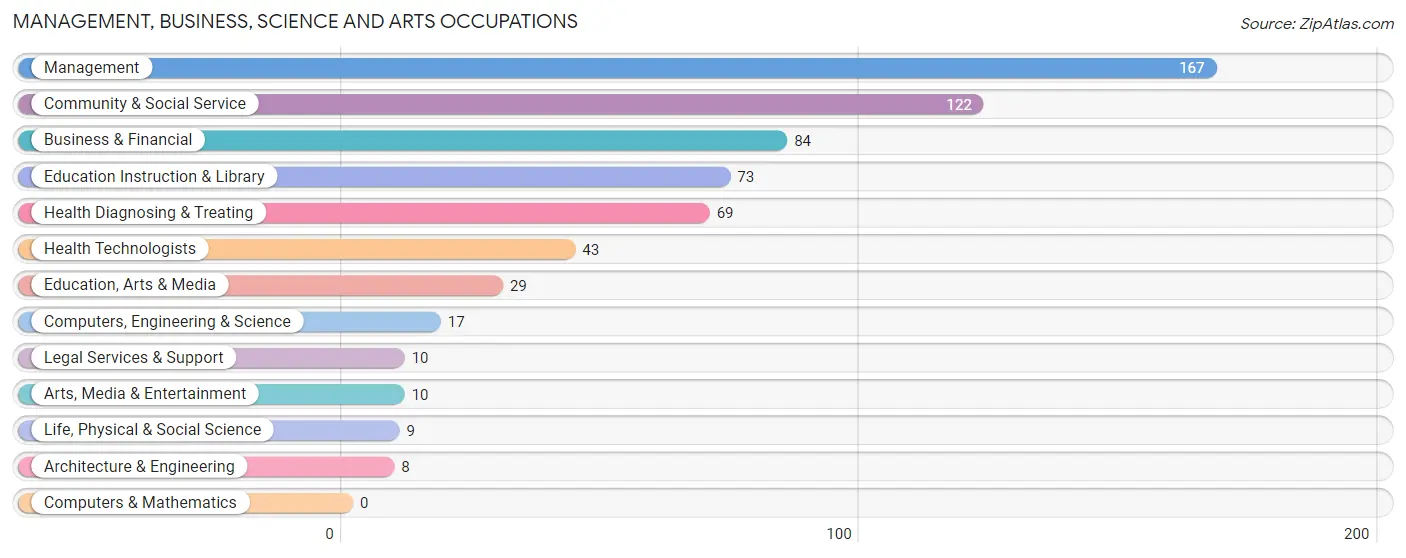
Management, Business, Science and Arts Occupations
The most common Management, Business, Science and Arts occupations in Charlestown are Management (167 | 21.7%), Community & Social Service (122 | 15.9%), Business & Financial (84 | 10.9%), Education Instruction & Library (73 | 9.5%), and Health Diagnosing & Treating (69 | 9.0%).
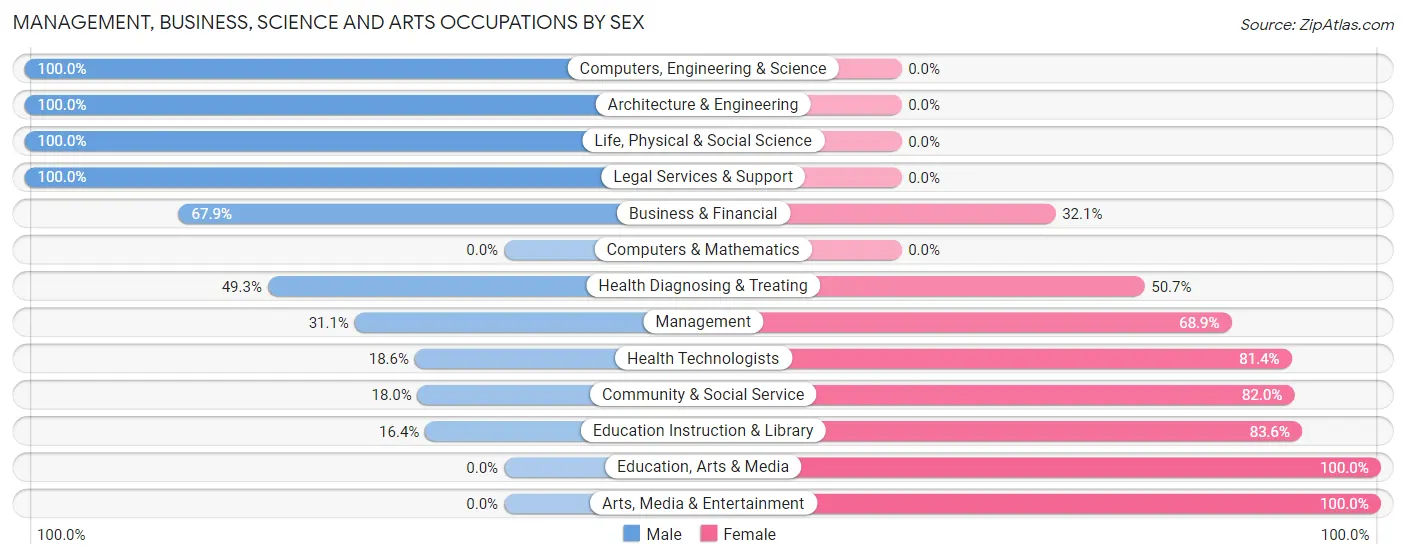
Management, Business, Science and Arts Occupations by Sex
Within the Management, Business, Science and Arts occupations in Charlestown, the most male-oriented occupations are Computers, Engineering & Science (100.0%), Architecture & Engineering (100.0%), and Life, Physical & Social Science (100.0%), while the most female-oriented occupations are Education, Arts & Media (100.0%), Arts, Media & Entertainment (100.0%), and Education Instruction & Library (83.6%).
| Occupation | Male | Female |
| Management | 52 (31.1%) | 115 (68.9%) |
| Business & Financial | 57 (67.9%) | 27 (32.1%) |
| Computers, Engineering & Science | 17 (100.0%) | 0 (0.0%) |
| Computers & Mathematics | 0 (0.0%) | 0 (0.0%) |
| Architecture & Engineering | 8 (100.0%) | 0 (0.0%) |
| Life, Physical & Social Science | 9 (100.0%) | 0 (0.0%) |
| Community & Social Service | 22 (18.0%) | 100 (82.0%) |
| Education, Arts & Media | 0 (0.0%) | 29 (100.0%) |
| Legal Services & Support | 10 (100.0%) | 0 (0.0%) |
| Education Instruction & Library | 12 (16.4%) | 61 (83.6%) |
| Arts, Media & Entertainment | 0 (0.0%) | 10 (100.0%) |
| Health Diagnosing & Treating | 34 (49.3%) | 35 (50.7%) |
| Health Technologists | 8 (18.6%) | 35 (81.4%) |
| Total (Category) | 182 (39.7%) | 277 (60.4%) |
| Total (Overall) | 338 (44.0%) | 431 (56.0%) |
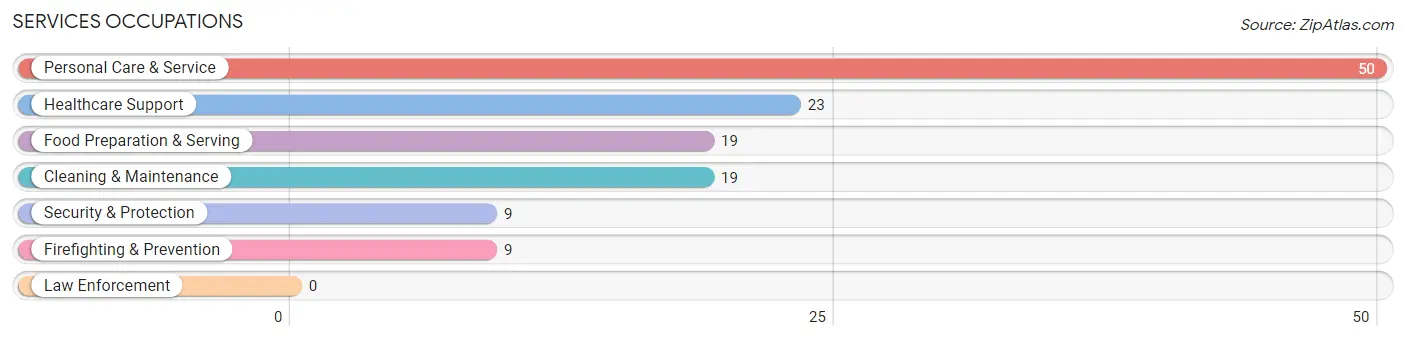
Services Occupations
The most common Services occupations in Charlestown are Personal Care & Service (50 | 6.5%), Healthcare Support (23 | 3.0%), Food Preparation & Serving (19 | 2.5%), Cleaning & Maintenance (19 | 2.5%), and Security & Protection (9 | 1.2%).
Services Occupations by Sex
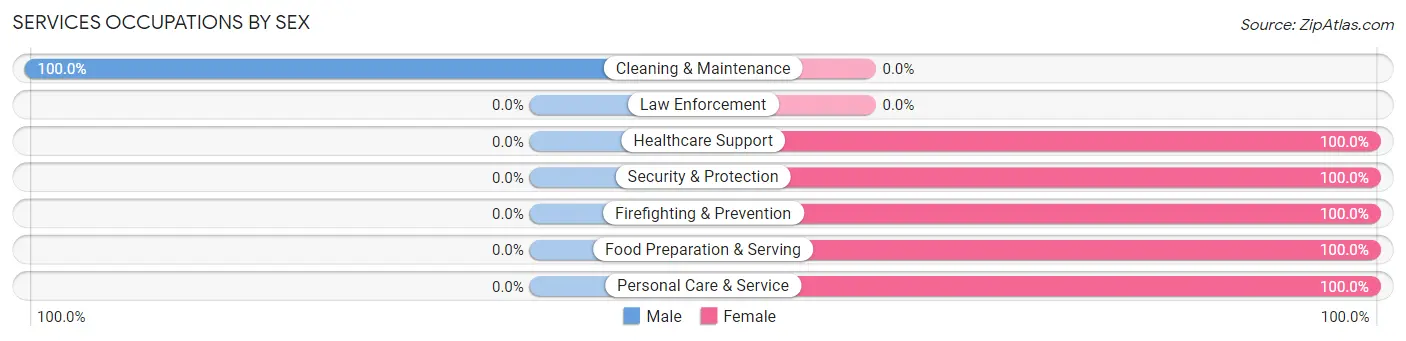
| Occupation | Male | Female |
| Healthcare Support | 0 (0.0%) | 23 (100.0%) |
| Security & Protection | 0 (0.0%) | 9 (100.0%) |
| Firefighting & Prevention | 0 (0.0%) | 9 (100.0%) |
| Law Enforcement | 0 (0.0%) | 0 (0.0%) |
| Food Preparation & Serving | 0 (0.0%) | 19 (100.0%) |
| Cleaning & Maintenance | 19 (100.0%) | 0 (0.0%) |
| Personal Care & Service | 0 (0.0%) | 50 (100.0%) |
| Total (Category) | 19 (15.8%) | 101 (84.2%) |
| Total (Overall) | 338 (44.0%) | 431 (56.0%) |
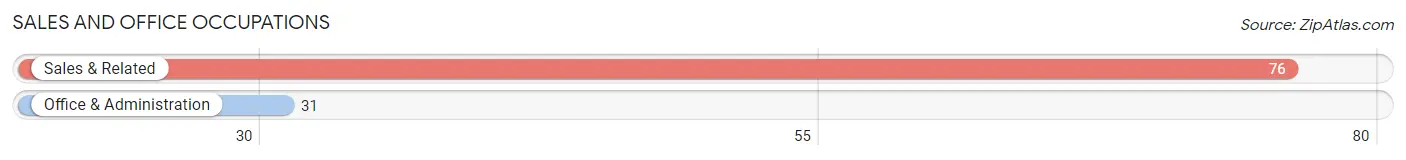
Sales and Office Occupations
The most common Sales and Office occupations in Charlestown are Sales & Related (76 | 9.9%), and Office & Administration (31 | 4.0%).
Sales and Office Occupations by Sex
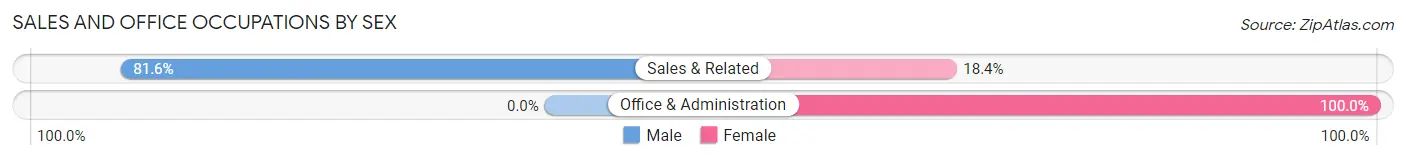
| Occupation | Male | Female |
| Sales & Related | 62 (81.6%) | 14 (18.4%) |
| Office & Administration | 0 (0.0%) | 31 (100.0%) |
| Total (Category) | 62 (57.9%) | 45 (42.1%) |
| Total (Overall) | 338 (44.0%) | 431 (56.0%) |
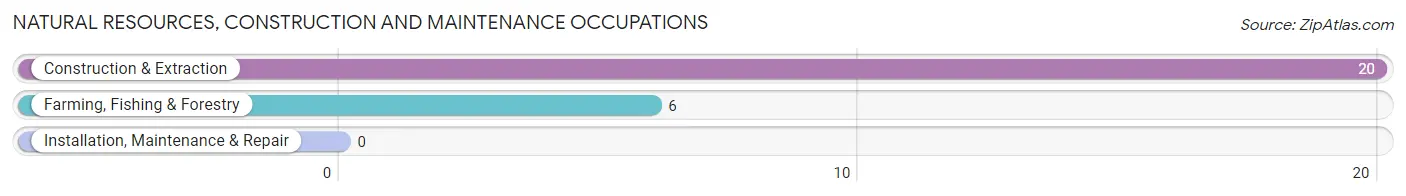
Natural Resources, Construction and Maintenance Occupations
The most common Natural Resources, Construction and Maintenance occupations in Charlestown are Construction & Extraction (20 | 2.6%), and Farming, Fishing & Forestry (6 | 0.8%).
Natural Resources, Construction and Maintenance Occupations by Sex
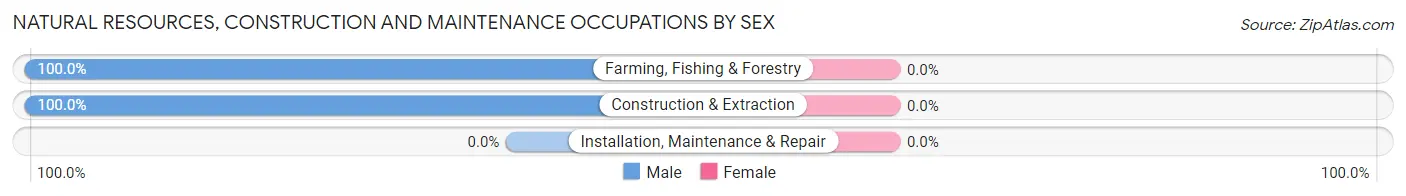
| Occupation | Male | Female |
| Farming, Fishing & Forestry | 6 (100.0%) | 0 (0.0%) |
| Construction & Extraction | 20 (100.0%) | 0 (0.0%) |
| Installation, Maintenance & Repair | 0 (0.0%) | 0 (0.0%) |
| Total (Category) | 26 (100.0%) | 0 (0.0%) |
| Total (Overall) | 338 (44.0%) | 431 (56.0%) |
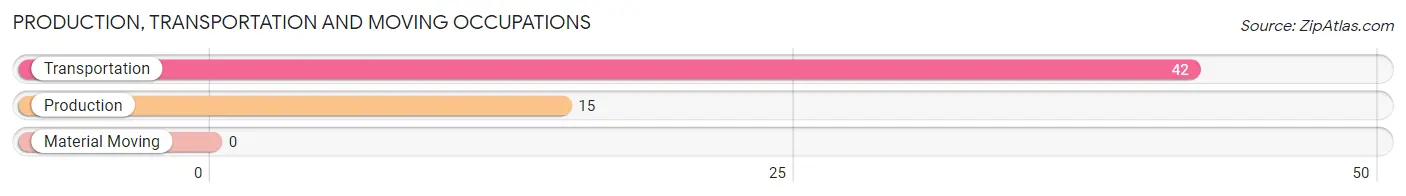
Production, Transportation and Moving Occupations
The most common Production, Transportation and Moving occupations in Charlestown are Transportation (42 | 5.5%), and Production (15 | 1.9%).
Production, Transportation and Moving Occupations by Sex
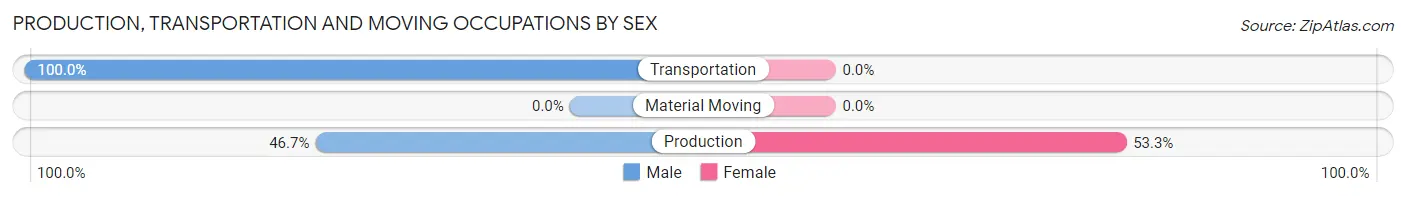
| Occupation | Male | Female |
| Production | 7 (46.7%) | 8 (53.3%) |
| Transportation | 42 (100.0%) | 0 (0.0%) |
| Material Moving | 0 (0.0%) | 0 (0.0%) |
| Total (Category) | 49 (86.0%) | 8 (14.0%) |
| Total (Overall) | 338 (44.0%) | 431 (56.0%) |
Employment Industries by Sex in Charlestown
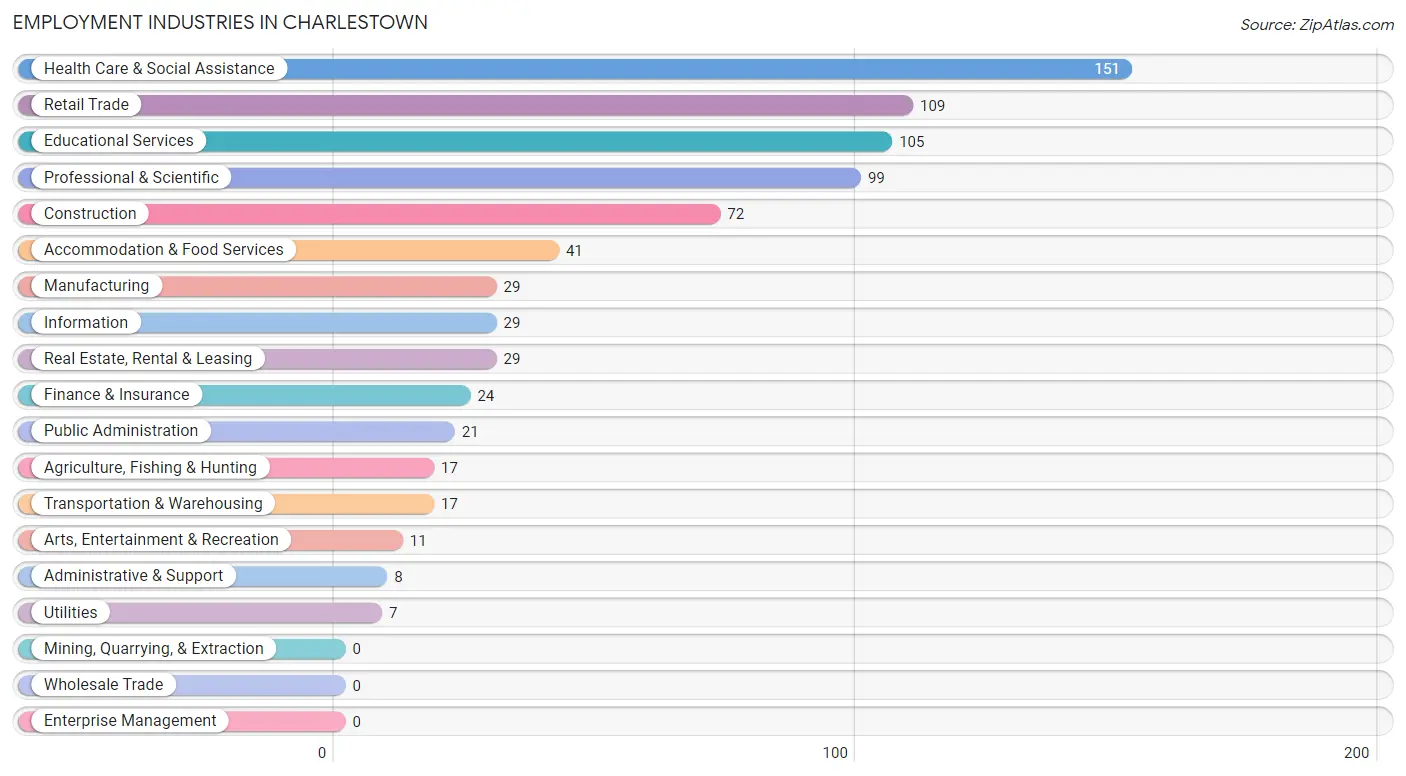
Employment Industries in Charlestown
The major employment industries in Charlestown include Health Care & Social Assistance (151 | 19.6%), Retail Trade (109 | 14.2%), Educational Services (105 | 13.7%), Professional & Scientific (99 | 12.9%), and Construction (72 | 9.4%).
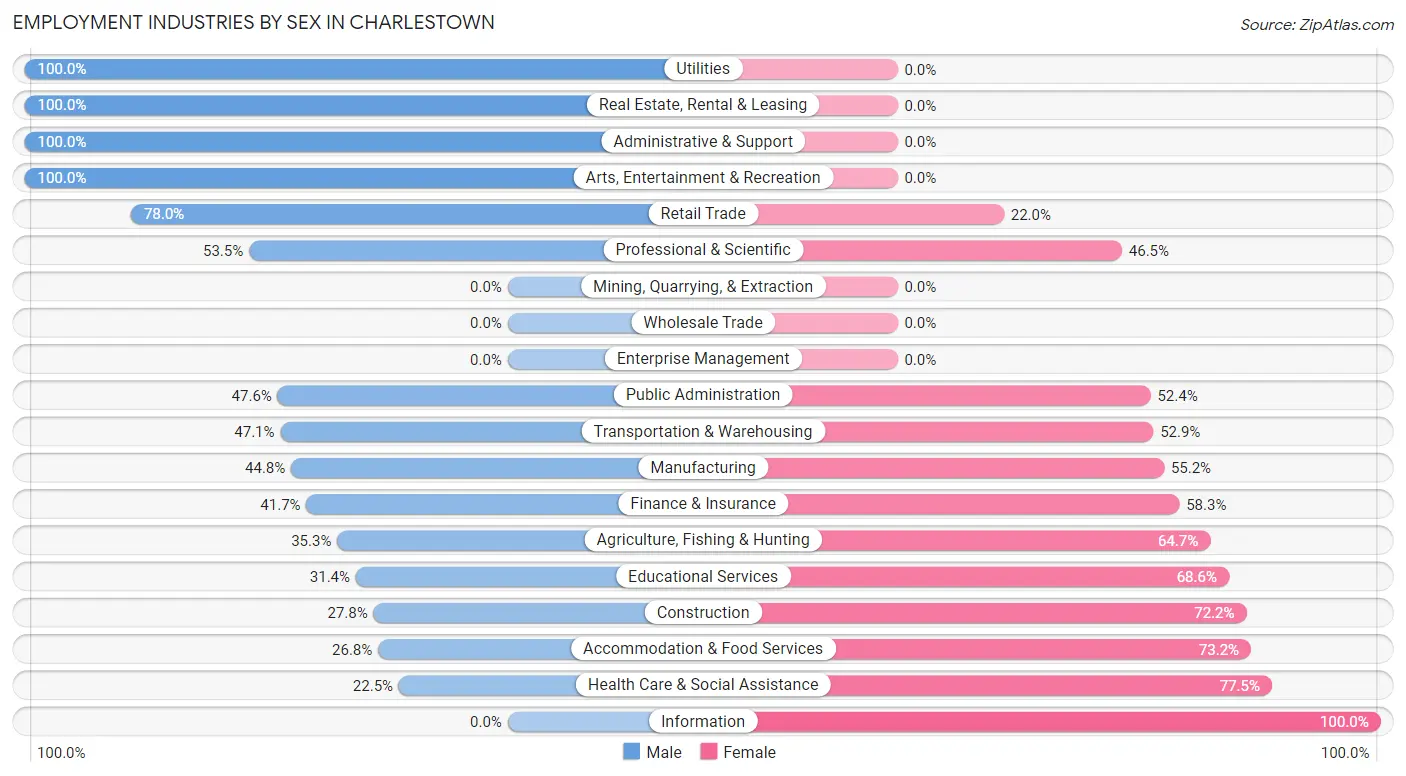
Employment Industries by Sex in Charlestown
The Charlestown industries that see more men than women are Utilities (100.0%), Real Estate, Rental & Leasing (100.0%), and Administrative & Support (100.0%), whereas the industries that tend to have a higher number of women are Information (100.0%), Health Care & Social Assistance (77.5%), and Accommodation & Food Services (73.2%).
| Industry | Male | Female |
| Agriculture, Fishing & Hunting | 6 (35.3%) | 11 (64.7%) |
| Mining, Quarrying, & Extraction | 0 (0.0%) | 0 (0.0%) |
| Construction | 20 (27.8%) | 52 (72.2%) |
| Manufacturing | 13 (44.8%) | 16 (55.2%) |
| Wholesale Trade | 0 (0.0%) | 0 (0.0%) |
| Retail Trade | 85 (78.0%) | 24 (22.0%) |
| Transportation & Warehousing | 8 (47.1%) | 9 (52.9%) |
| Utilities | 7 (100.0%) | 0 (0.0%) |
| Information | 0 (0.0%) | 29 (100.0%) |
| Finance & Insurance | 10 (41.7%) | 14 (58.3%) |
| Real Estate, Rental & Leasing | 29 (100.0%) | 0 (0.0%) |
| Professional & Scientific | 53 (53.5%) | 46 (46.5%) |
| Enterprise Management | 0 (0.0%) | 0 (0.0%) |
| Administrative & Support | 8 (100.0%) | 0 (0.0%) |
| Educational Services | 33 (31.4%) | 72 (68.6%) |
| Health Care & Social Assistance | 34 (22.5%) | 117 (77.5%) |
| Arts, Entertainment & Recreation | 11 (100.0%) | 0 (0.0%) |
| Accommodation & Food Services | 11 (26.8%) | 30 (73.2%) |
| Public Administration | 10 (47.6%) | 11 (52.4%) |
| Total | 338 (44.0%) | 431 (56.0%) |
Education in Charlestown
School Enrollment in Charlestown
The most common levels of schooling among the 208 students in Charlestown are college / undergraduate (105 | 50.5%), graduate / professional (49 | 23.6%), and elementary school (20 | 9.6%).
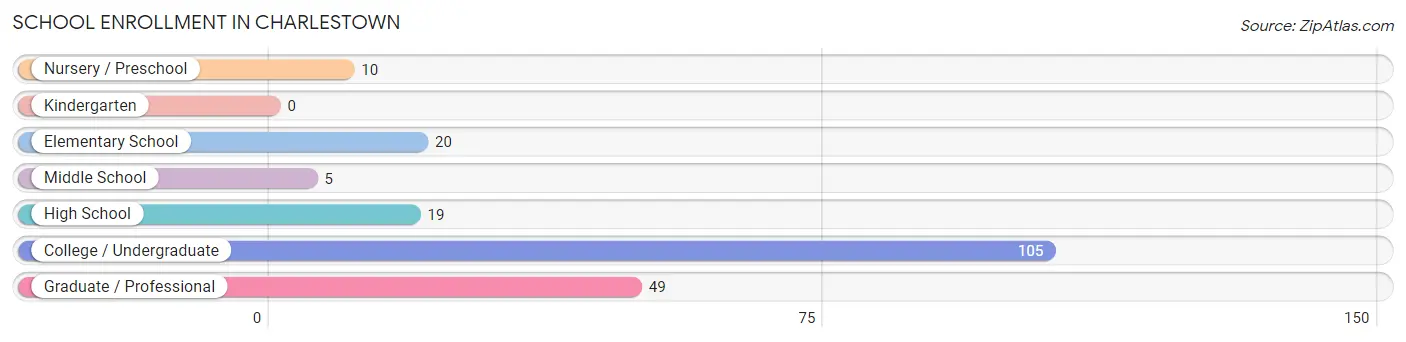
| School Level | # Students | % Students |
| Nursery / Preschool | 10 | 4.8% |
| Kindergarten | 0 | 0.0% |
| Elementary School | 20 | 9.6% |
| Middle School | 5 | 2.4% |
| High School | 19 | 9.1% |
| College / Undergraduate | 105 | 50.5% |
| Graduate / Professional | 49 | 23.6% |
| Total | 208 | 100.0% |
School Enrollment by Age by Funding Source in Charlestown
Out of a total of 208 students who are enrolled in schools in Charlestown, 63 (30.3%) attend a private institution, while the remaining 145 (69.7%) are enrolled in public schools. The age group of 3 to 4 year olds has the highest likelihood of being enrolled in private schools, with 10 (100.0% in the age bracket) enrolled. Conversely, the age group of 10 to 14 year olds has the lowest likelihood of being enrolled in a private school, with 13 (100.0% in the age bracket) attending a public institution.
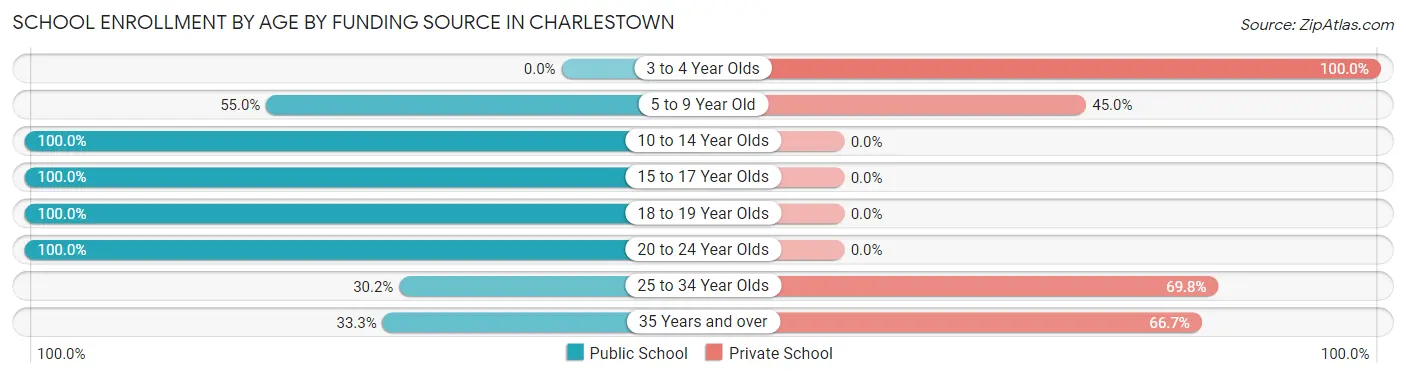
| Age Bracket | Public School | Private School |
| 3 to 4 Year Olds | 0 (0.0%) | 10 (100.0%) |
| 5 to 9 Year Old | 11 (55.0%) | 9 (45.0%) |
| 10 to 14 Year Olds | 13 (100.0%) | 0 (0.0%) |
| 15 to 17 Year Olds | 11 (100.0%) | 0 (0.0%) |
| 18 to 19 Year Olds | 33 (100.0%) | 0 (0.0%) |
| 20 to 24 Year Olds | 57 (100.0%) | 0 (0.0%) |
| 25 to 34 Year Olds | 13 (30.2%) | 30 (69.8%) |
| 35 Years and over | 7 (33.3%) | 14 (66.7%) |
| Total | 145 (69.7%) | 63 (30.3%) |
Educational Attainment by Field of Study in Charlestown
Science & technology (108 | 12.2%), literature & languages (95 | 10.8%), visual & performing arts (90 | 10.2%), social sciences (86 | 9.8%), and education (73 | 8.3%) are the most common fields of study among 882 individuals in Charlestown who have obtained a bachelor's degree or higher.
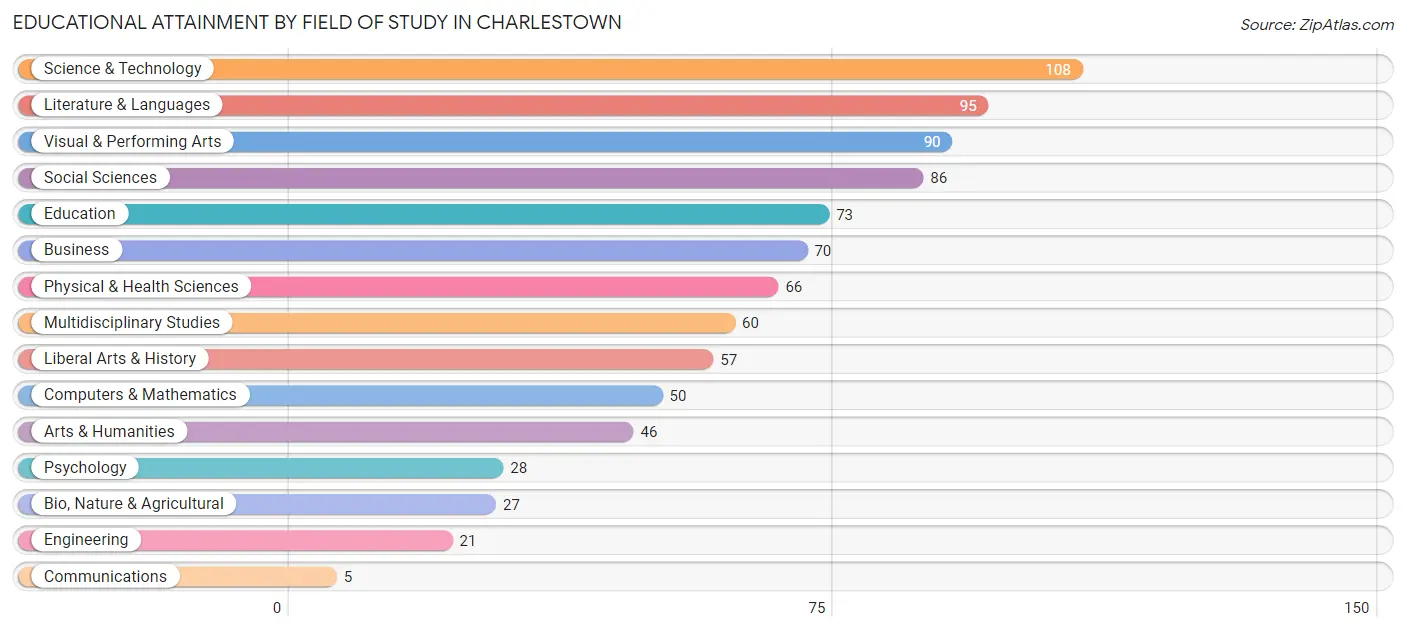
| Field of Study | # Graduates | % Graduates |
| Computers & Mathematics | 50 | 5.7% |
| Bio, Nature & Agricultural | 27 | 3.1% |
| Physical & Health Sciences | 66 | 7.5% |
| Psychology | 28 | 3.2% |
| Social Sciences | 86 | 9.8% |
| Engineering | 21 | 2.4% |
| Multidisciplinary Studies | 60 | 6.8% |
| Science & Technology | 108 | 12.2% |
| Business | 70 | 7.9% |
| Education | 73 | 8.3% |
| Literature & Languages | 95 | 10.8% |
| Liberal Arts & History | 57 | 6.5% |
| Visual & Performing Arts | 90 | 10.2% |
| Communications | 5 | 0.6% |
| Arts & Humanities | 46 | 5.2% |
| Total | 882 | 100.0% |
Transportation & Commute in Charlestown
Vehicle Availability by Sex in Charlestown
The most prevalent vehicle ownership categories in Charlestown are males with 2 vehicles (205, accounting for 64.3%) and females with 2 vehicles (263, making up 48.7%).
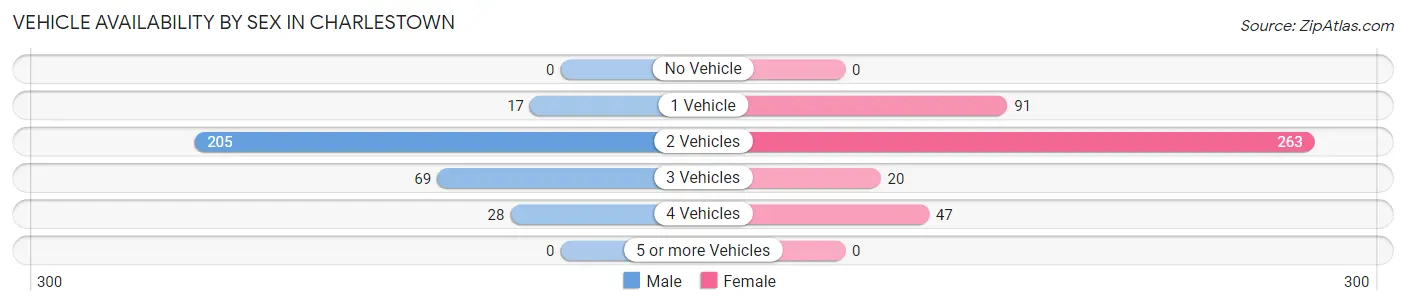
| Vehicles Available | Male | Female |
| No Vehicle | 0 (0.0%) | 0 (0.0%) |
| 1 Vehicle | 17 (5.3%) | 91 (21.6%) |
| 2 Vehicles | 205 (64.3%) | 263 (62.5%) |
| 3 Vehicles | 69 (21.6%) | 20 (4.8%) |
| 4 Vehicles | 28 (8.8%) | 47 (11.2%) |
| 5 or more Vehicles | 0 (0.0%) | 0 (0.0%) |
| Total | 319 (100.0%) | 421 (100.0%) |
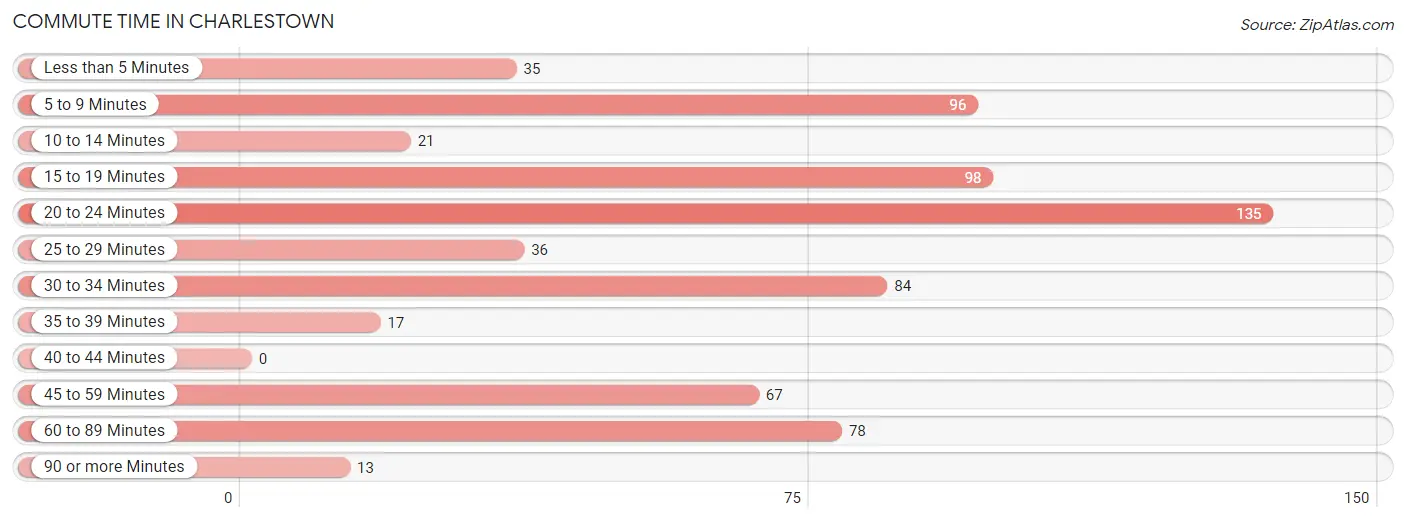
Commute Time in Charlestown
The most frequently occuring commute durations in Charlestown are 20 to 24 minutes (135 commuters, 19.9%), 15 to 19 minutes (98 commuters, 14.4%), and 5 to 9 minutes (96 commuters, 14.1%).
| Commute Time | # Commuters | % Commuters |
| Less than 5 Minutes | 35 | 5.1% |
| 5 to 9 Minutes | 96 | 14.1% |
| 10 to 14 Minutes | 21 | 3.1% |
| 15 to 19 Minutes | 98 | 14.4% |
| 20 to 24 Minutes | 135 | 19.9% |
| 25 to 29 Minutes | 36 | 5.3% |
| 30 to 34 Minutes | 84 | 12.3% |
| 35 to 39 Minutes | 17 | 2.5% |
| 40 to 44 Minutes | 0 | 0.0% |
| 45 to 59 Minutes | 67 | 9.9% |
| 60 to 89 Minutes | 78 | 11.5% |
| 90 or more Minutes | 13 | 1.9% |
Commute Time by Sex in Charlestown
The most common commute times in Charlestown are 20 to 24 minutes (76 commuters, 24.4%) for males and 15 to 19 minutes (79 commuters, 21.4%) for females.
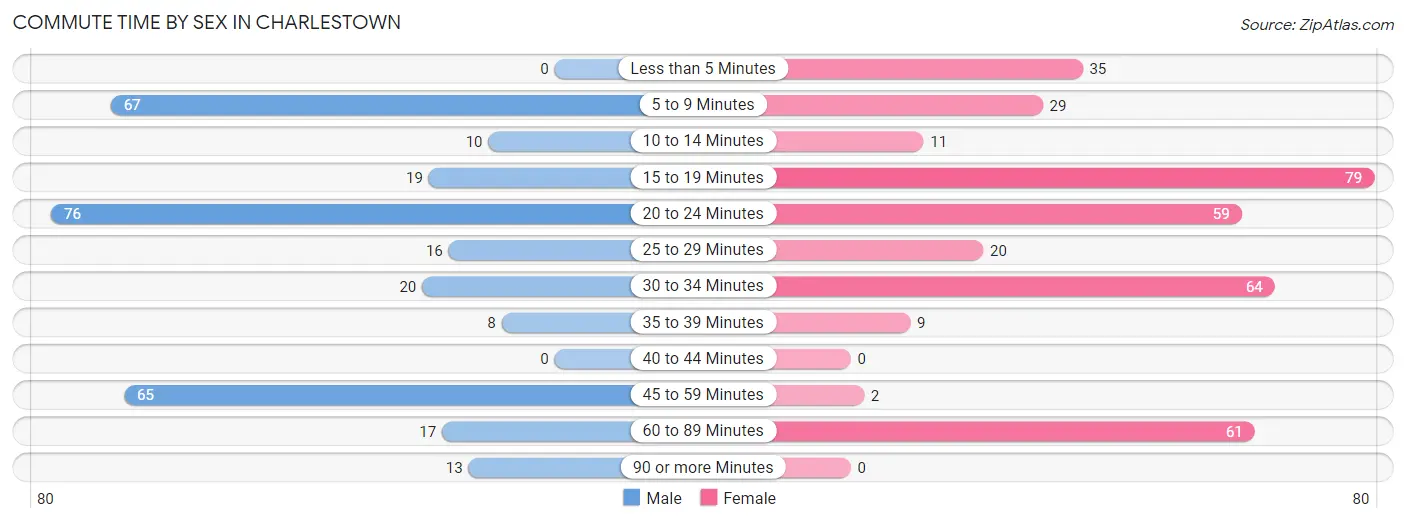
| Commute Time | Male | Female |
| Less than 5 Minutes | 0 (0.0%) | 35 (9.5%) |
| 5 to 9 Minutes | 67 (21.5%) | 29 (7.9%) |
| 10 to 14 Minutes | 10 (3.2%) | 11 (3.0%) |
| 15 to 19 Minutes | 19 (6.1%) | 79 (21.4%) |
| 20 to 24 Minutes | 76 (24.4%) | 59 (16.0%) |
| 25 to 29 Minutes | 16 (5.1%) | 20 (5.4%) |
| 30 to 34 Minutes | 20 (6.4%) | 64 (17.3%) |
| 35 to 39 Minutes | 8 (2.6%) | 9 (2.4%) |
| 40 to 44 Minutes | 0 (0.0%) | 0 (0.0%) |
| 45 to 59 Minutes | 65 (20.9%) | 2 (0.5%) |
| 60 to 89 Minutes | 17 (5.5%) | 61 (16.5%) |
| 90 or more Minutes | 13 (4.2%) | 0 (0.0%) |
Time of Departure to Work by Sex in Charlestown
The most frequent times of departure to work in Charlestown are 5:30 AM to 5:59 AM (62, 19.9%) for males and 9:00 AM to 9:59 AM (71, 19.2%) for females.
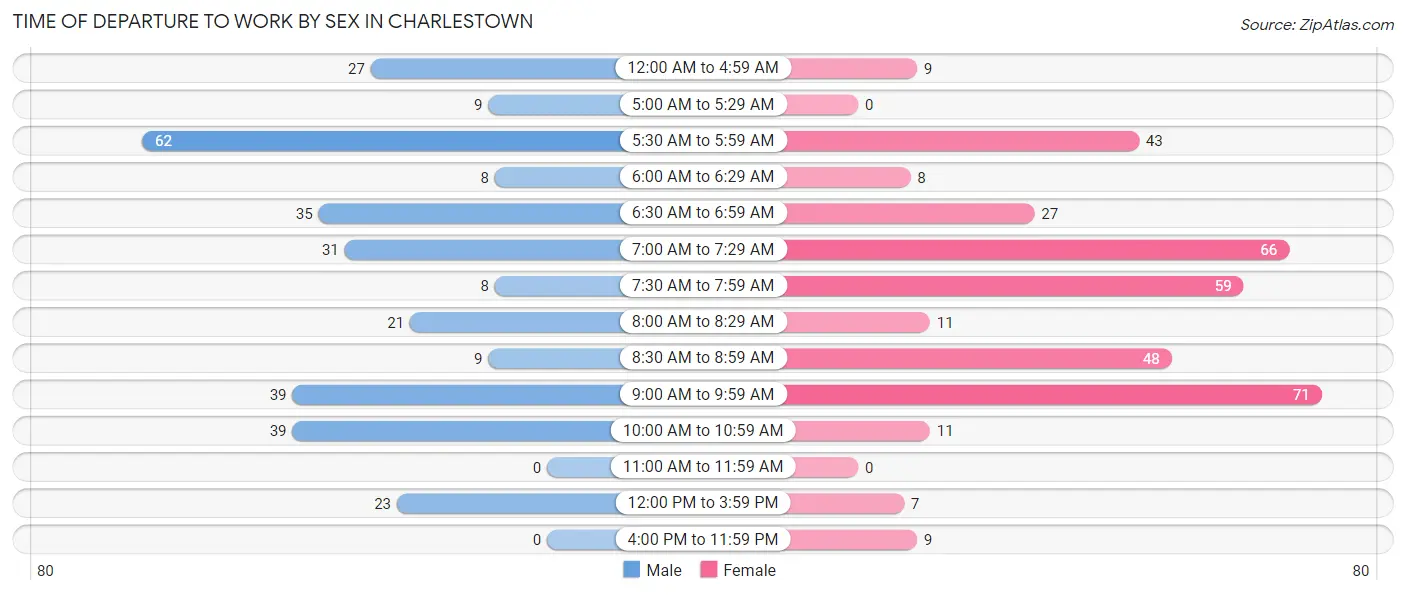
| Time of Departure | Male | Female |
| 12:00 AM to 4:59 AM | 27 (8.7%) | 9 (2.4%) |
| 5:00 AM to 5:29 AM | 9 (2.9%) | 0 (0.0%) |
| 5:30 AM to 5:59 AM | 62 (19.9%) | 43 (11.7%) |
| 6:00 AM to 6:29 AM | 8 (2.6%) | 8 (2.2%) |
| 6:30 AM to 6:59 AM | 35 (11.3%) | 27 (7.3%) |
| 7:00 AM to 7:29 AM | 31 (10.0%) | 66 (17.9%) |
| 7:30 AM to 7:59 AM | 8 (2.6%) | 59 (16.0%) |
| 8:00 AM to 8:29 AM | 21 (6.8%) | 11 (3.0%) |
| 8:30 AM to 8:59 AM | 9 (2.9%) | 48 (13.0%) |
| 9:00 AM to 9:59 AM | 39 (12.5%) | 71 (19.2%) |
| 10:00 AM to 10:59 AM | 39 (12.5%) | 11 (3.0%) |
| 11:00 AM to 11:59 AM | 0 (0.0%) | 0 (0.0%) |
| 12:00 PM to 3:59 PM | 23 (7.4%) | 7 (1.9%) |
| 4:00 PM to 11:59 PM | 0 (0.0%) | 9 (2.4%) |
| Total | 311 (100.0%) | 369 (100.0%) |
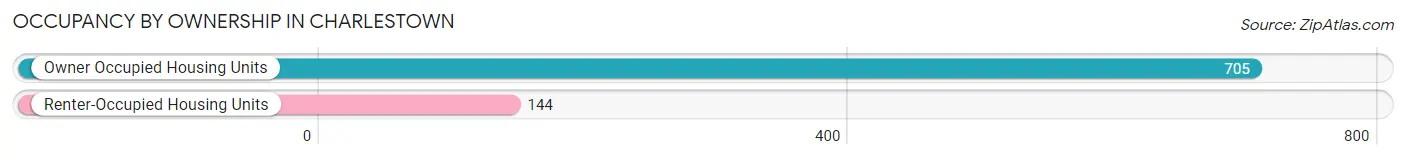
Housing Occupancy in Charlestown
Occupancy by Ownership in Charlestown
Of the total 849 dwellings in Charlestown, owner-occupied units account for 705 (83.0%), while renter-occupied units make up 144 (17.0%).
| Occupancy | # Housing Units | % Housing Units |
| Owner Occupied Housing Units | 705 | 83.0% |
| Renter-Occupied Housing Units | 144 | 17.0% |
| Total Occupied Housing Units | 849 | 100.0% |
Occupancy by Household Size in Charlestown
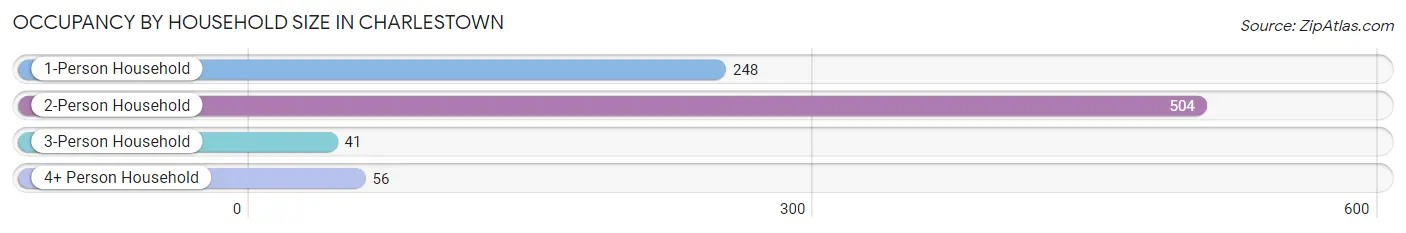
| Household Size | # Housing Units | % Housing Units |
| 1-Person Household | 248 | 29.2% |
| 2-Person Household | 504 | 59.4% |
| 3-Person Household | 41 | 4.8% |
| 4+ Person Household | 56 | 6.6% |
| Total Housing Units | 849 | 100.0% |
Occupancy by Ownership by Household Size in Charlestown
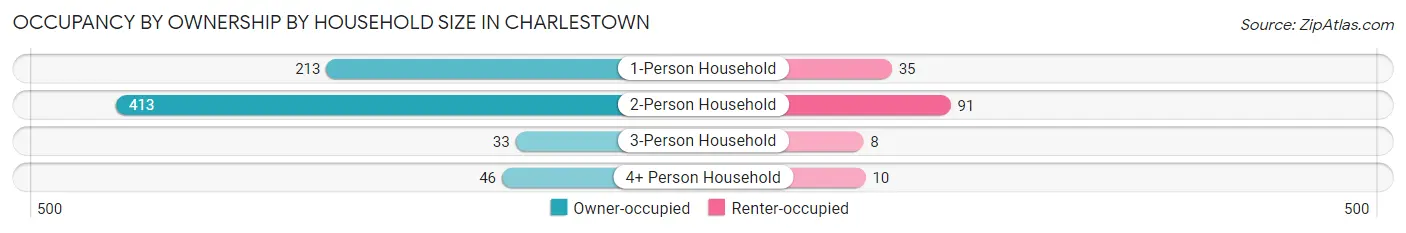
| Household Size | Owner-occupied | Renter-occupied |
| 1-Person Household | 213 (85.9%) | 35 (14.1%) |
| 2-Person Household | 413 (81.9%) | 91 (18.1%) |
| 3-Person Household | 33 (80.5%) | 8 (19.5%) |
| 4+ Person Household | 46 (82.1%) | 10 (17.9%) |
| Total Housing Units | 705 (83.0%) | 144 (17.0%) |
Occupancy by Educational Attainment in Charlestown
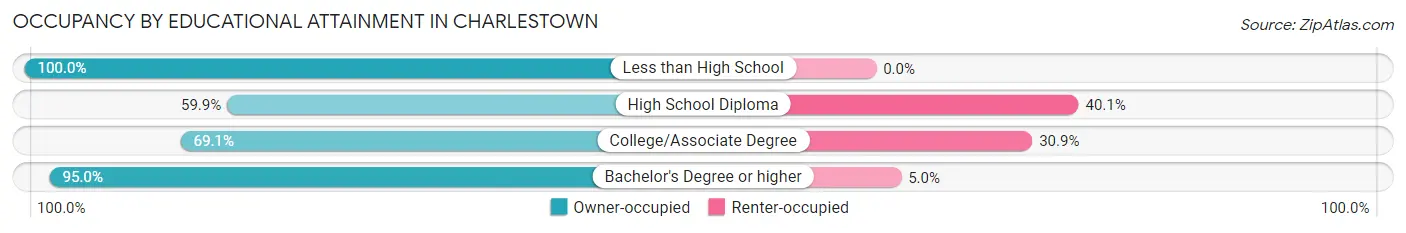
| Household Size | Owner-occupied | Renter-occupied |
| Less than High School | 7 (100.0%) | 0 (0.0%) |
| High School Diploma | 94 (59.9%) | 63 (40.1%) |
| College/Associate Degree | 125 (69.1%) | 56 (30.9%) |
| Bachelor's Degree or higher | 479 (95.0%) | 25 (5.0%) |
Occupancy by Age of Householder in Charlestown
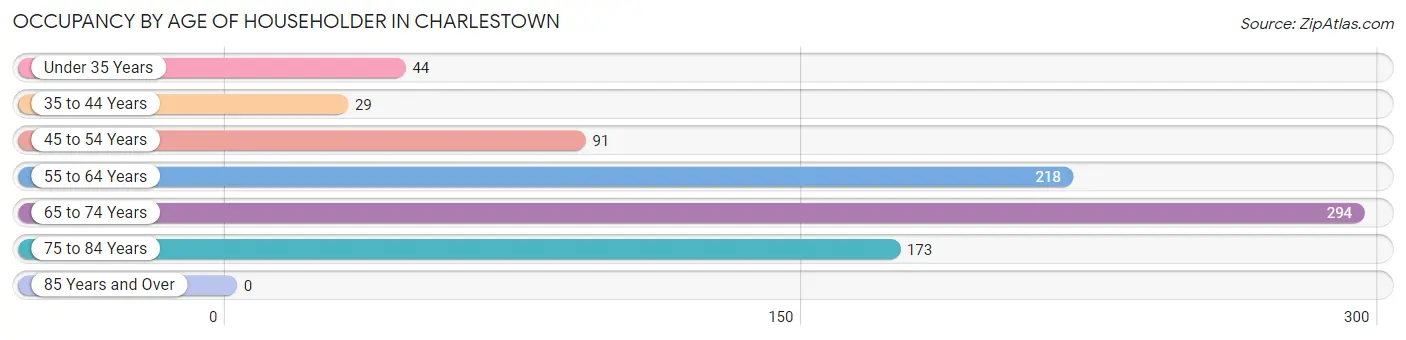
| Age Bracket | # Households | % Households |
| Under 35 Years | 44 | 5.2% |
| 35 to 44 Years | 29 | 3.4% |
| 45 to 54 Years | 91 | 10.7% |
| 55 to 64 Years | 218 | 25.7% |
| 65 to 74 Years | 294 | 34.6% |
| 75 to 84 Years | 173 | 20.4% |
| 85 Years and Over | 0 | 0.0% |
| Total | 849 | 100.0% |
Housing Finances in Charlestown
Median Income by Occupancy in Charlestown
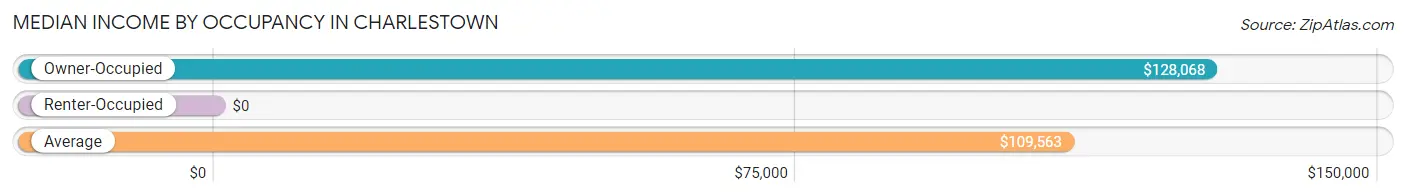
| Occupancy Type | # Households | Median Income |
| Owner-Occupied | 705 (83.0%) | $128,068 |
| Renter-Occupied | 144 (17.0%) | $0 |
| Average | 849 (100.0%) | $109,563 |
Occupancy by Householder Income Bracket in Charlestown
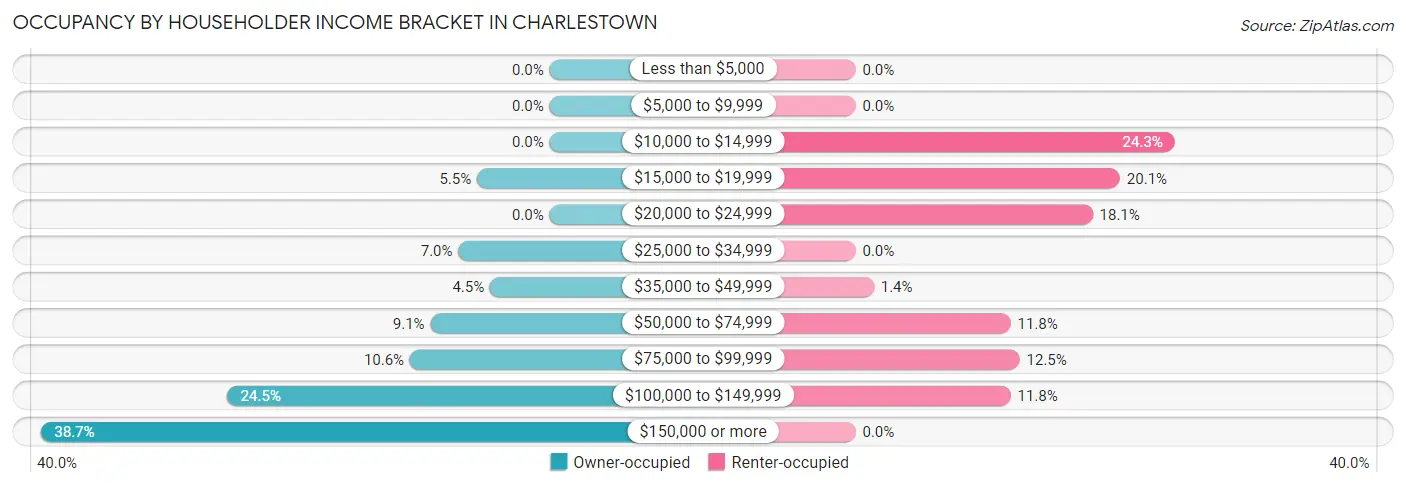
| Income Bracket | Owner-occupied | Renter-occupied |
| Less than $5,000 | 0 (0.0%) | 0 (0.0%) |
| $5,000 to $9,999 | 0 (0.0%) | 0 (0.0%) |
| $10,000 to $14,999 | 0 (0.0%) | 35 (24.3%) |
| $15,000 to $19,999 | 39 (5.5%) | 29 (20.1%) |
| $20,000 to $24,999 | 0 (0.0%) | 26 (18.1%) |
| $25,000 to $34,999 | 49 (7.0%) | 0 (0.0%) |
| $35,000 to $49,999 | 32 (4.5%) | 2 (1.4%) |
| $50,000 to $74,999 | 64 (9.1%) | 17 (11.8%) |
| $75,000 to $99,999 | 75 (10.6%) | 18 (12.5%) |
| $100,000 to $149,999 | 173 (24.5%) | 17 (11.8%) |
| $150,000 or more | 273 (38.7%) | 0 (0.0%) |
| Total | 705 (100.0%) | 144 (100.0%) |
Monthly Housing Cost Tiers in Charlestown
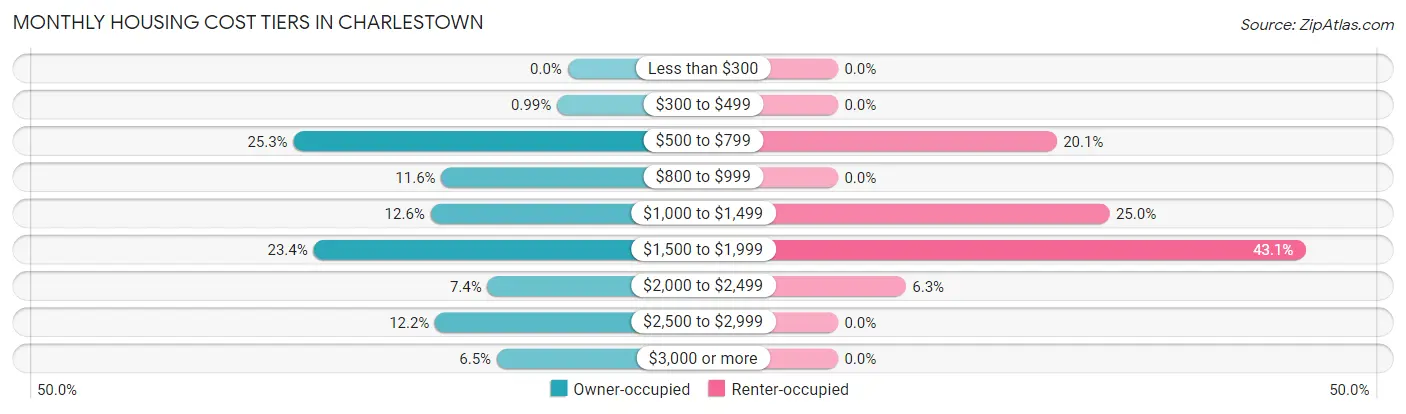
| Monthly Cost | Owner-occupied | Renter-occupied |
| Less than $300 | 0 (0.0%) | 0 (0.0%) |
| $300 to $499 | 7 (1.0%) | 0 (0.0%) |
| $500 to $799 | 178 (25.3%) | 29 (20.1%) |
| $800 to $999 | 82 (11.6%) | 0 (0.0%) |
| $1,000 to $1,499 | 89 (12.6%) | 36 (25.0%) |
| $1,500 to $1,999 | 165 (23.4%) | 62 (43.1%) |
| $2,000 to $2,499 | 52 (7.4%) | 9 (6.2%) |
| $2,500 to $2,999 | 86 (12.2%) | 0 (0.0%) |
| $3,000 or more | 46 (6.5%) | 0 (0.0%) |
| Total | 705 (100.0%) | 144 (100.0%) |
Physical Housing Characteristics in Charlestown
Housing Structures in Charlestown
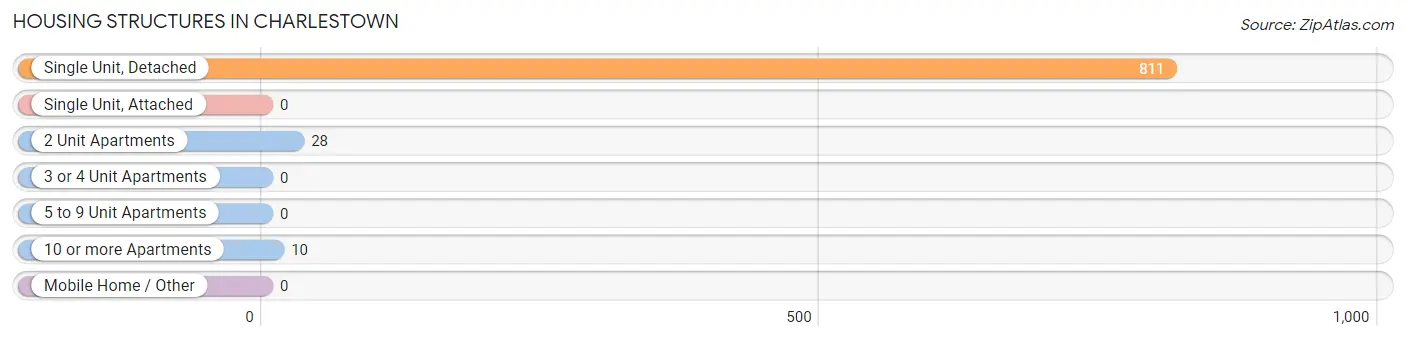
| Structure Type | # Housing Units | % Housing Units |
| Single Unit, Detached | 811 | 95.5% |
| Single Unit, Attached | 0 | 0.0% |
| 2 Unit Apartments | 28 | 3.3% |
| 3 or 4 Unit Apartments | 0 | 0.0% |
| 5 to 9 Unit Apartments | 0 | 0.0% |
| 10 or more Apartments | 10 | 1.2% |
| Mobile Home / Other | 0 | 0.0% |
| Total | 849 | 100.0% |
Housing Structures by Occupancy in Charlestown
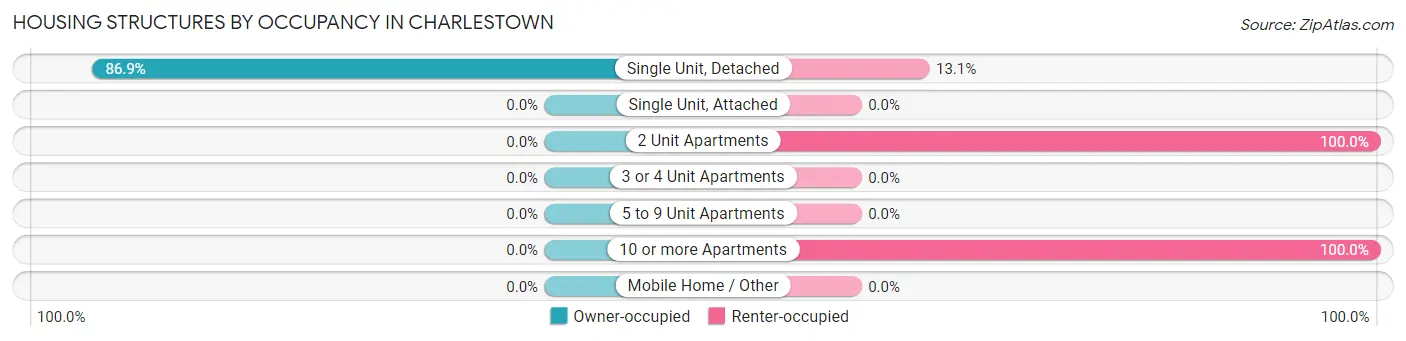
| Structure Type | Owner-occupied | Renter-occupied |
| Single Unit, Detached | 705 (86.9%) | 106 (13.1%) |
| Single Unit, Attached | 0 (0.0%) | 0 (0.0%) |
| 2 Unit Apartments | 0 (0.0%) | 28 (100.0%) |
| 3 or 4 Unit Apartments | 0 (0.0%) | 0 (0.0%) |
| 5 to 9 Unit Apartments | 0 (0.0%) | 0 (0.0%) |
| 10 or more Apartments | 0 (0.0%) | 10 (100.0%) |
| Mobile Home / Other | 0 (0.0%) | 0 (0.0%) |
| Total | 705 (83.0%) | 144 (17.0%) |
Housing Structures by Number of Rooms in Charlestown
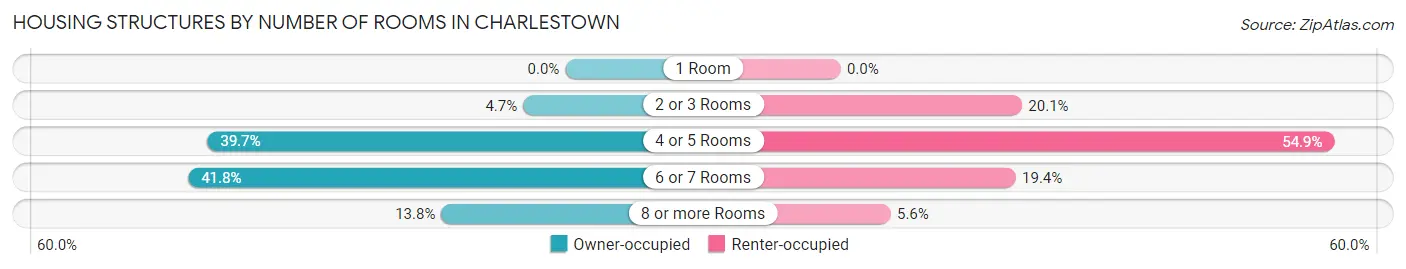
| Number of Rooms | Owner-occupied | Renter-occupied |
| 1 Room | 0 (0.0%) | 0 (0.0%) |
| 2 or 3 Rooms | 33 (4.7%) | 29 (20.1%) |
| 4 or 5 Rooms | 280 (39.7%) | 79 (54.9%) |
| 6 or 7 Rooms | 295 (41.8%) | 28 (19.4%) |
| 8 or more Rooms | 97 (13.8%) | 8 (5.6%) |
| Total | 705 (100.0%) | 144 (100.0%) |
Housing Structure by Heating Type in Charlestown
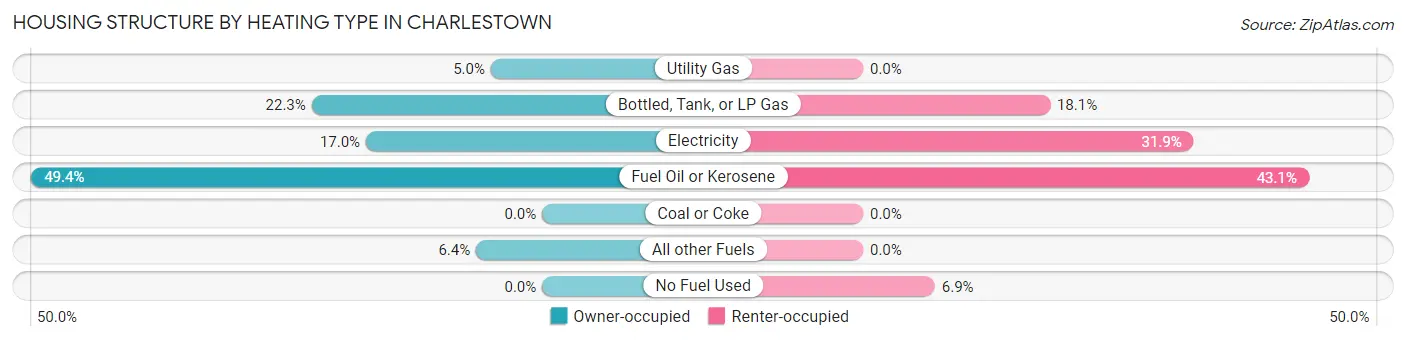
| Heating Type | Owner-occupied | Renter-occupied |
| Utility Gas | 35 (5.0%) | 0 (0.0%) |
| Bottled, Tank, or LP Gas | 157 (22.3%) | 26 (18.1%) |
| Electricity | 120 (17.0%) | 46 (31.9%) |
| Fuel Oil or Kerosene | 348 (49.4%) | 62 (43.1%) |
| Coal or Coke | 0 (0.0%) | 0 (0.0%) |
| All other Fuels | 45 (6.4%) | 0 (0.0%) |
| No Fuel Used | 0 (0.0%) | 10 (6.9%) |
| Total | 705 (100.0%) | 144 (100.0%) |
Household Vehicle Usage in Charlestown
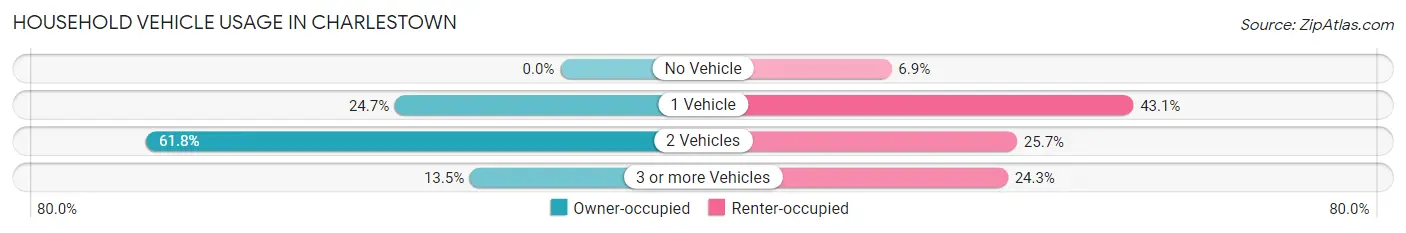
| Vehicles per Household | Owner-occupied | Renter-occupied |
| No Vehicle | 0 (0.0%) | 10 (6.9%) |
| 1 Vehicle | 174 (24.7%) | 62 (43.1%) |
| 2 Vehicles | 436 (61.8%) | 37 (25.7%) |
| 3 or more Vehicles | 95 (13.5%) | 35 (24.3%) |
| Total | 705 (100.0%) | 144 (100.0%) |
Real Estate & Mortgages in Charlestown
Real Estate and Mortgage Overview in Charlestown
| Characteristic | Without Mortgage | With Mortgage |
| Housing Units | 364 | 341 |
| Median Property Value | $466,700 | $532,700 |
| Median Household Income | $120,179 | $191 |
| Monthly Housing Costs | $792 | $46 |
| Real Estate Taxes | $4,279 | $0 |
Property Value by Mortgage Status in Charlestown
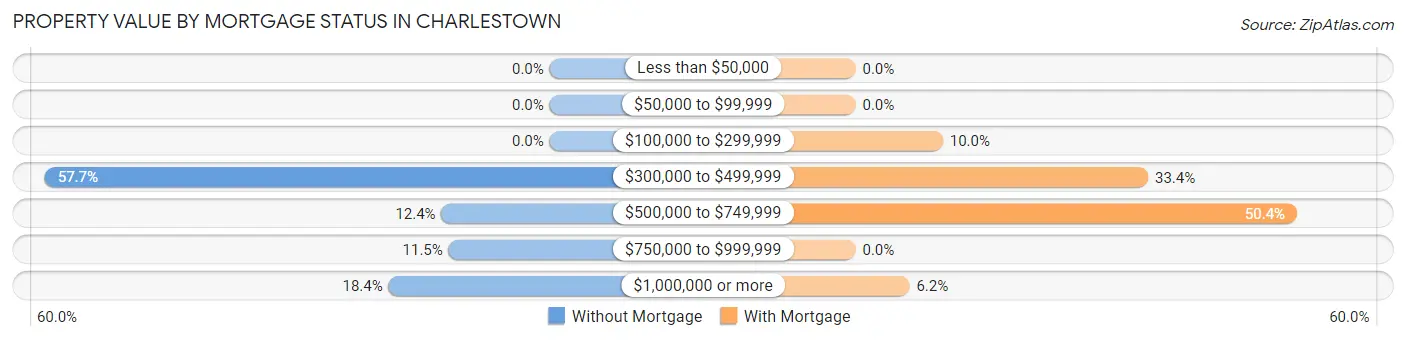
| Property Value | Without Mortgage | With Mortgage |
| Less than $50,000 | 0 (0.0%) | 0 (0.0%) |
| $50,000 to $99,999 | 0 (0.0%) | 0 (0.0%) |
| $100,000 to $299,999 | 0 (0.0%) | 34 (10.0%) |
| $300,000 to $499,999 | 210 (57.7%) | 114 (33.4%) |
| $500,000 to $749,999 | 45 (12.4%) | 172 (50.4%) |
| $750,000 to $999,999 | 42 (11.5%) | 0 (0.0%) |
| $1,000,000 or more | 67 (18.4%) | 21 (6.2%) |
| Total | 364 (100.0%) | 341 (100.0%) |
Household Income by Mortgage Status in Charlestown
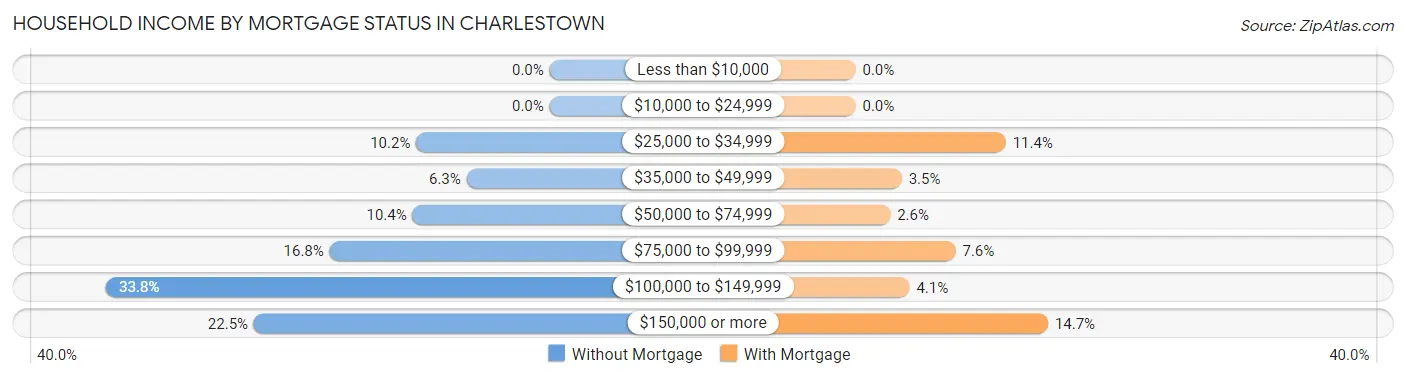
| Household Income | Without Mortgage | With Mortgage |
| Less than $10,000 | 0 (0.0%) | 0 (0.0%) |
| $10,000 to $24,999 | 0 (0.0%) | 0 (0.0%) |
| $25,000 to $34,999 | 37 (10.2%) | 39 (11.4%) |
| $35,000 to $49,999 | 23 (6.3%) | 12 (3.5%) |
| $50,000 to $74,999 | 38 (10.4%) | 9 (2.6%) |
| $75,000 to $99,999 | 61 (16.8%) | 26 (7.6%) |
| $100,000 to $149,999 | 123 (33.8%) | 14 (4.1%) |
| $150,000 or more | 82 (22.5%) | 50 (14.7%) |
| Total | 364 (100.0%) | 341 (100.0%) |
Property Value to Household Income Ratio in Charlestown
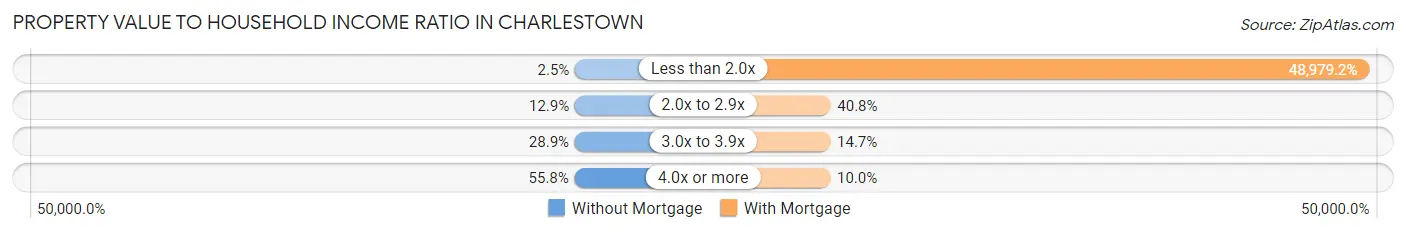
| Value-to-Income Ratio | Without Mortgage | With Mortgage |
| Less than 2.0x | 9 (2.5%) | 167,019 (48,979.2%) |
| 2.0x to 2.9x | 47 (12.9%) | 139 (40.8%) |
| 3.0x to 3.9x | 105 (28.8%) | 50 (14.7%) |
| 4.0x or more | 203 (55.8%) | 34 (10.0%) |
| Total | 364 (100.0%) | 341 (100.0%) |
Real Estate Taxes by Mortgage Status in Charlestown
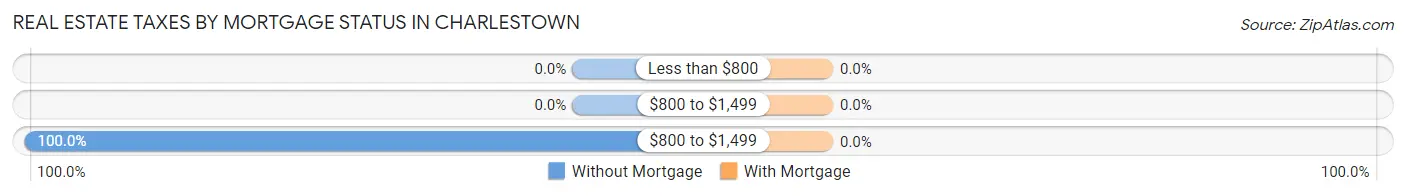
| Property Taxes | Without Mortgage | With Mortgage |
| Less than $800 | 0 (0.0%) | 0 (0.0%) |
| $800 to $1,499 | 0 (0.0%) | 0 (0.0%) |
| $800 to $1,499 | 364 (100.0%) | 0 (0.0%) |
| Total | 364 (100.0%) | 341 (100.0%) |
Health & Disability in Charlestown
Health Insurance Coverage by Age in Charlestown
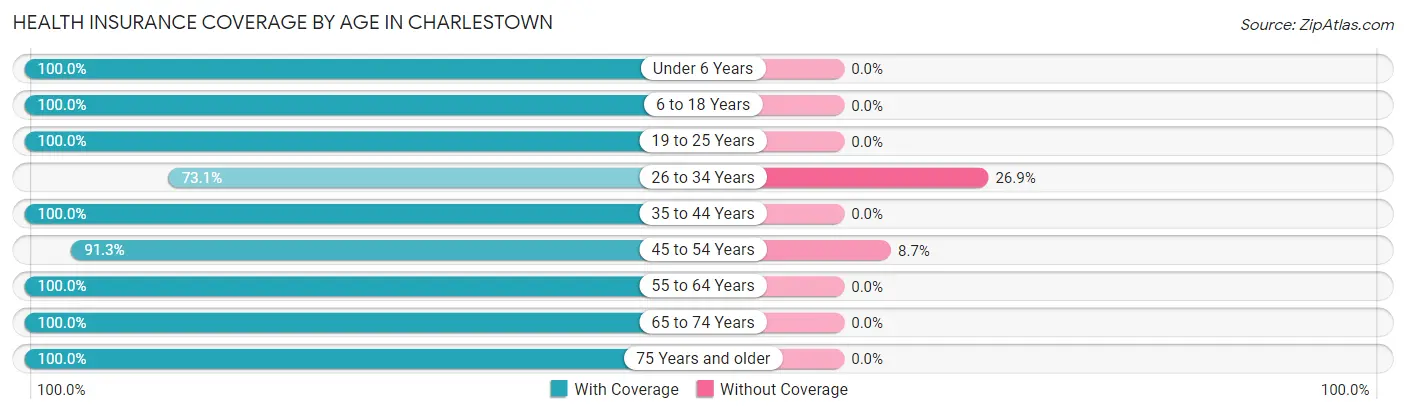
| Age Bracket | With Coverage | Without Coverage |
| Under 6 Years | 25 (100.0%) | 0 (0.0%) |
| 6 to 18 Years | 55 (100.0%) | 0 (0.0%) |
| 19 to 25 Years | 117 (100.0%) | 0 (0.0%) |
| 26 to 34 Years | 87 (73.1%) | 32 (26.9%) |
| 35 to 44 Years | 79 (100.0%) | 0 (0.0%) |
| 45 to 54 Years | 178 (91.3%) | 17 (8.7%) |
| 55 to 64 Years | 365 (100.0%) | 0 (0.0%) |
| 65 to 74 Years | 457 (100.0%) | 0 (0.0%) |
| 75 Years and older | 290 (100.0%) | 0 (0.0%) |
| Total | 1,653 (97.1%) | 49 (2.9%) |
Health Insurance Coverage by Citizenship Status in Charlestown
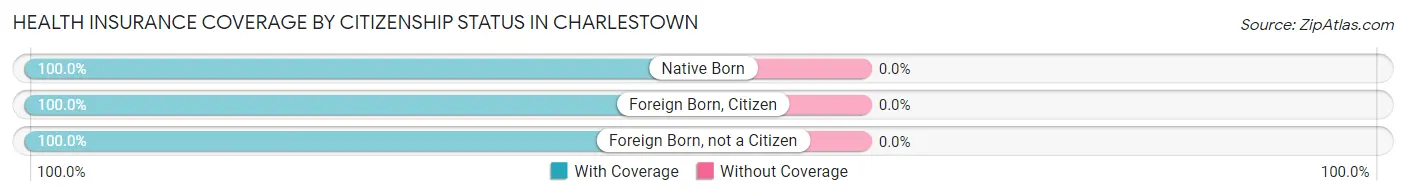
| Citizenship Status | With Coverage | Without Coverage |
| Native Born | 25 (100.0%) | 0 (0.0%) |
| Foreign Born, Citizen | 55 (100.0%) | 0 (0.0%) |
| Foreign Born, not a Citizen | 117 (100.0%) | 0 (0.0%) |
Health Insurance Coverage by Household Income in Charlestown
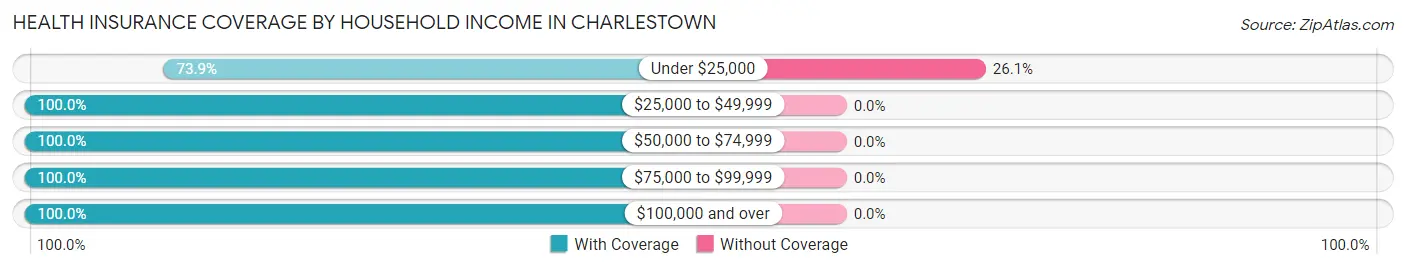
| Household Income | With Coverage | Without Coverage |
| Under $25,000 | 139 (73.9%) | 49 (26.1%) |
| $25,000 to $49,999 | 126 (100.0%) | 0 (0.0%) |
| $50,000 to $74,999 | 192 (100.0%) | 0 (0.0%) |
| $75,000 to $99,999 | 190 (100.0%) | 0 (0.0%) |
| $100,000 and over | 1,006 (100.0%) | 0 (0.0%) |
Public vs Private Health Insurance Coverage by Age in Charlestown
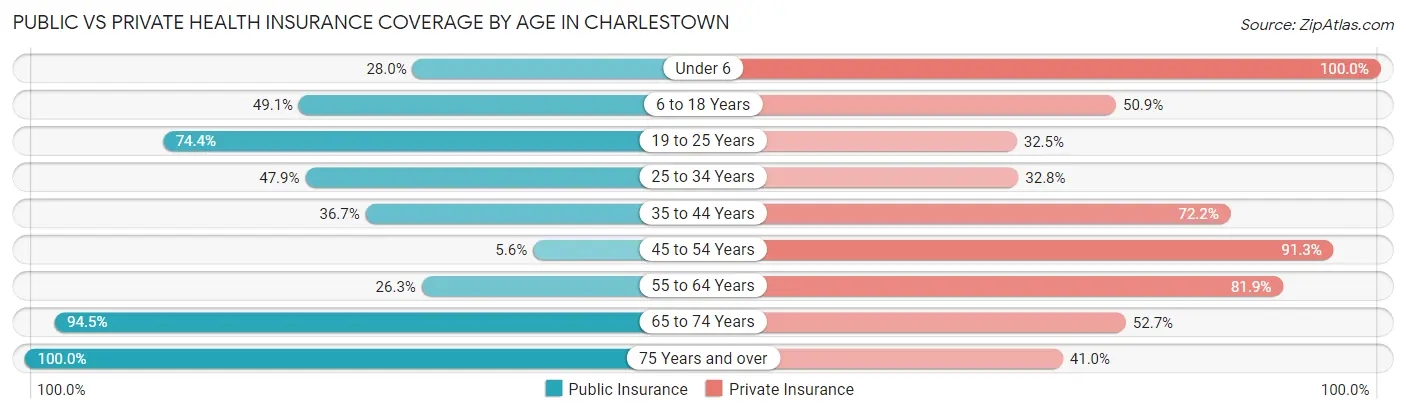
| Age Bracket | Public Insurance | Private Insurance |
| Under 6 | 7 (28.0%) | 25 (100.0%) |
| 6 to 18 Years | 27 (49.1%) | 28 (50.9%) |
| 19 to 25 Years | 87 (74.4%) | 38 (32.5%) |
| 25 to 34 Years | 57 (47.9%) | 39 (32.8%) |
| 35 to 44 Years | 29 (36.7%) | 57 (72.2%) |
| 45 to 54 Years | 11 (5.6%) | 178 (91.3%) |
| 55 to 64 Years | 96 (26.3%) | 299 (81.9%) |
| 65 to 74 Years | 432 (94.5%) | 241 (52.7%) |
| 75 Years and over | 290 (100.0%) | 119 (41.0%) |
| Total | 1,036 (60.9%) | 1,024 (60.2%) |
Disability Status by Sex by Age in Charlestown
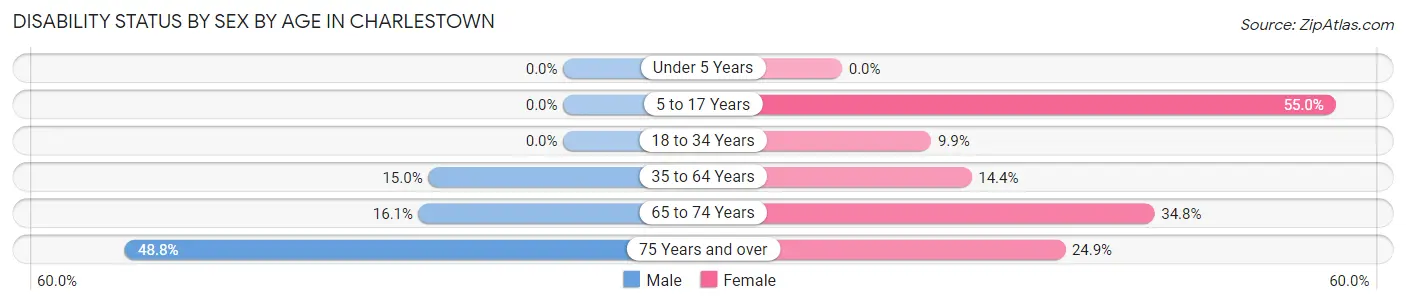
| Age Bracket | Male | Female |
| Under 5 Years | 0 (0.0%) | 0 (0.0%) |
| 5 to 17 Years | 0 (0.0%) | 11 (55.0%) |
| 18 to 34 Years | 0 (0.0%) | 14 (9.9%) |
| 35 to 64 Years | 47 (15.0%) | 47 (14.4%) |
| 65 to 74 Years | 37 (16.1%) | 79 (34.8%) |
| 75 Years and over | 61 (48.8%) | 41 (24.8%) |
Disability Class by Sex by Age in Charlestown
Disability Class: Hearing Difficulty
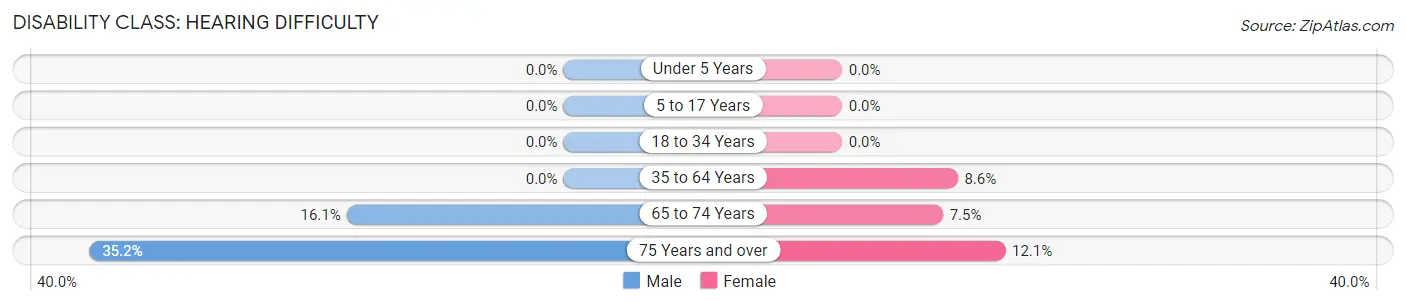
| Age Bracket | Male | Female |
| Under 5 Years | 0 (0.0%) | 0 (0.0%) |
| 5 to 17 Years | 0 (0.0%) | 0 (0.0%) |
| 18 to 34 Years | 0 (0.0%) | 0 (0.0%) |
| 35 to 64 Years | 0 (0.0%) | 28 (8.6%) |
| 65 to 74 Years | 37 (16.1%) | 17 (7.5%) |
| 75 Years and over | 44 (35.2%) | 20 (12.1%) |
Disability Class: Vision Difficulty
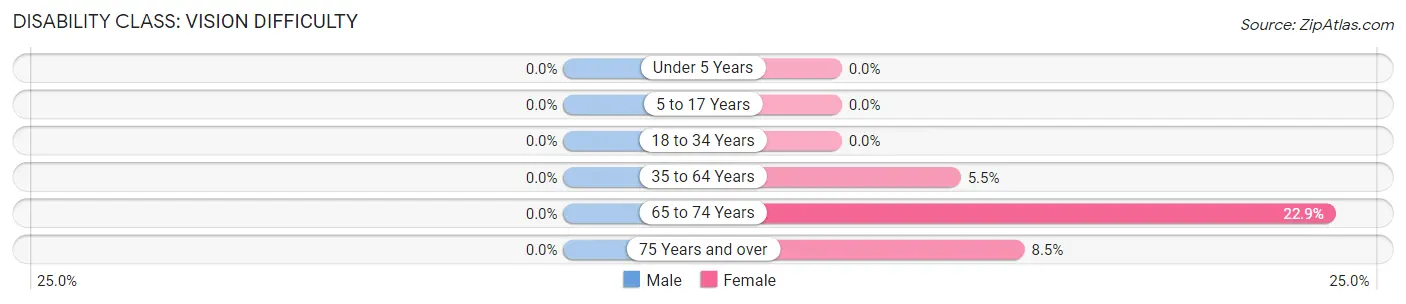
| Age Bracket | Male | Female |
| Under 5 Years | 0 (0.0%) | 0 (0.0%) |
| 5 to 17 Years | 0 (0.0%) | 0 (0.0%) |
| 18 to 34 Years | 0 (0.0%) | 0 (0.0%) |
| 35 to 64 Years | 0 (0.0%) | 18 (5.5%) |
| 65 to 74 Years | 0 (0.0%) | 52 (22.9%) |
| 75 Years and over | 0 (0.0%) | 14 (8.5%) |
Disability Class: Cognitive Difficulty
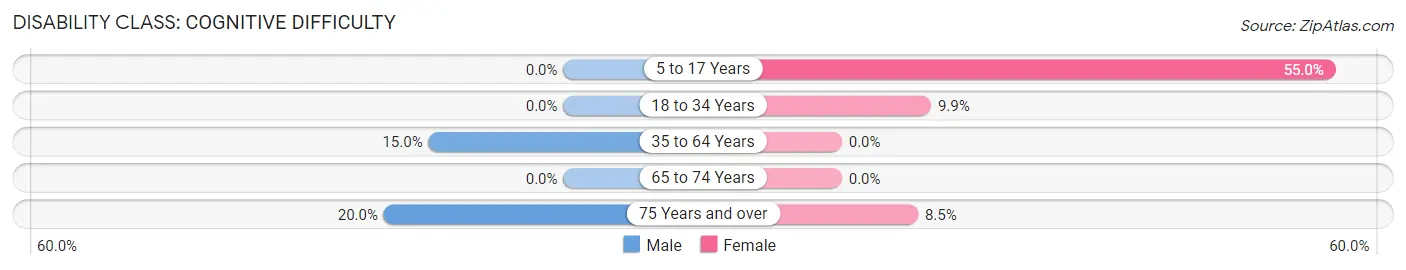
| Age Bracket | Male | Female |
| 5 to 17 Years | 0 (0.0%) | 11 (55.0%) |
| 18 to 34 Years | 0 (0.0%) | 14 (9.9%) |
| 35 to 64 Years | 47 (15.0%) | 0 (0.0%) |
| 65 to 74 Years | 0 (0.0%) | 0 (0.0%) |
| 75 Years and over | 25 (20.0%) | 14 (8.5%) |
Disability Class: Ambulatory Difficulty
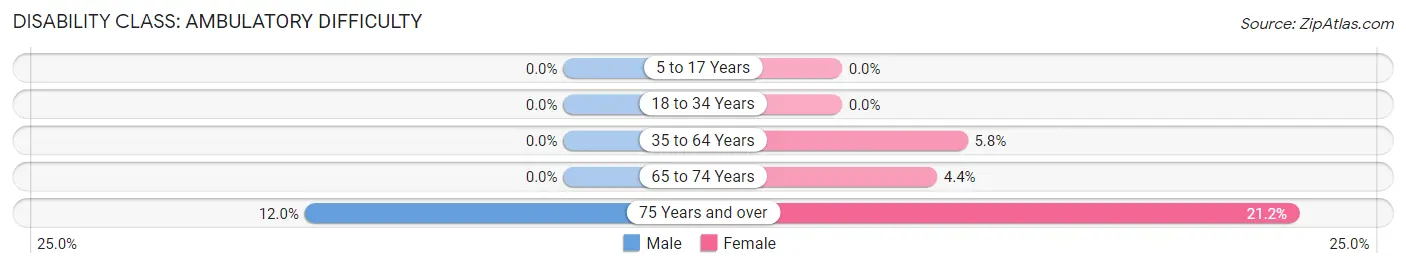
| Age Bracket | Male | Female |
| 5 to 17 Years | 0 (0.0%) | 0 (0.0%) |
| 18 to 34 Years | 0 (0.0%) | 0 (0.0%) |
| 35 to 64 Years | 0 (0.0%) | 19 (5.8%) |
| 65 to 74 Years | 0 (0.0%) | 10 (4.4%) |
| 75 Years and over | 15 (12.0%) | 35 (21.2%) |
Disability Class: Self-Care Difficulty
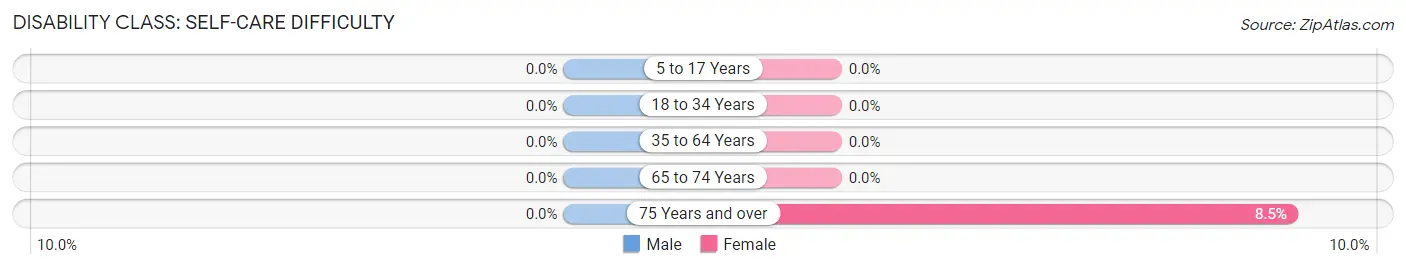
| Age Bracket | Male | Female |
| 5 to 17 Years | 0 (0.0%) | 0 (0.0%) |
| 18 to 34 Years | 0 (0.0%) | 0 (0.0%) |
| 35 to 64 Years | 0 (0.0%) | 0 (0.0%) |
| 65 to 74 Years | 0 (0.0%) | 0 (0.0%) |
| 75 Years and over | 0 (0.0%) | 14 (8.5%) |
Technology Access in Charlestown
Computing Device Access in Charlestown
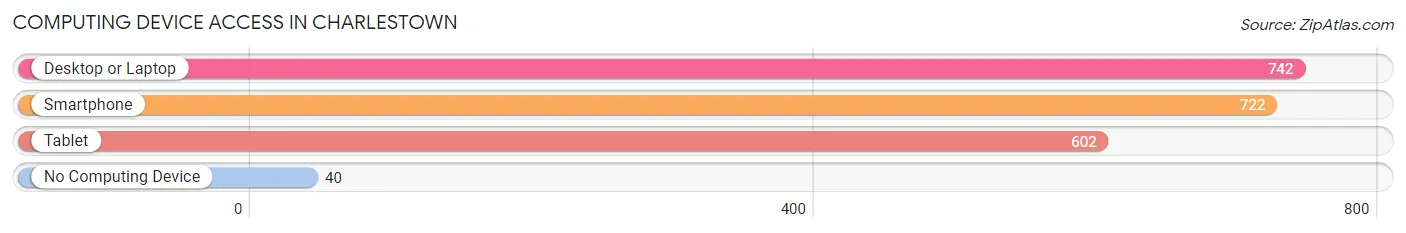
| Device Type | # Households | % Households |
| Desktop or Laptop | 742 | 87.4% |
| Smartphone | 722 | 85.0% |
| Tablet | 602 | 70.9% |
| No Computing Device | 40 | 4.7% |
| Total | 849 | 100.0% |
Internet Access in Charlestown
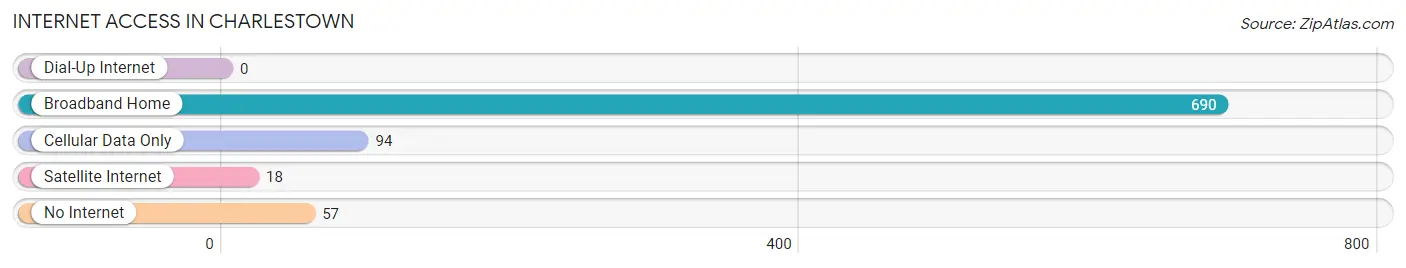
| Internet Type | # Households | % Households |
| Dial-Up Internet | 0 | 0.0% |
| Broadband Home | 690 | 81.3% |
| Cellular Data Only | 94 | 11.1% |
| Satellite Internet | 18 | 2.1% |
| No Internet | 57 | 6.7% |
| Total | 849 | 100.0% |
Charlestown Summary
Charlestown, Rhode Island is a small town located in the southwestern corner of the state. It is bordered by South Kingstown to the east, Westerly to the south, and the Atlantic Ocean to the south and west. The town has a population of 7,827 as of the 2010 census, making it the second smallest town in the state.
History
Charlestown was first settled in 1661 by a group of English settlers led by William Coddington. The town was named after King Charles II of England. The town was incorporated in 1664 and was the first town in the state to be incorporated.
In the late 17th century, Charlestown was a major port of entry for slaves from Africa. The town was also home to a large Quaker community, which was active in the abolitionist movement.
In the 19th century, Charlestown was a major center of the whaling industry. The town was home to several whaling ships, and the town's economy was heavily dependent on the industry.
Geography
Charlestown is located in the southwestern corner of Rhode Island, bordered by South Kingstown to the east, Westerly to the south, and the Atlantic Ocean to the south and west. The town covers an area of 24.3 square miles, with a population density of 322.7 people per square mile.
The town is located on the western shore of Narragansett Bay, and is home to several beaches, including East Beach, Charlestown Breachway, and Quonochontaug Pond. The town is also home to several parks, including Ninigret Park, Charlestown Breachway State Park, and Charlestown State Park.
Economy
Charlestown's economy is largely based on tourism and recreation. The town is home to several beaches, parks, and other attractions, which draw visitors from all over the region. The town is also home to several marinas, which provide services to boaters and fishermen.
The town is also home to several businesses, including restaurants, retail stores, and other services. The town is also home to several manufacturing companies, including a boat building company and a plastics manufacturer.
Demographics
As of the 2010 census, Charlestown had a population of 7,827. The racial makeup of the town was 94.3% White, 1.7% African American, 0.3% Native American, 0.7% Asian, 0.1% Pacific Islander, 1.2% from other races, and 1.9% from two or more races. Hispanic or Latino of any race were 3.2% of the population.
The median household income in the town was $60,938, and the median family income was $68,958. The per capita income for the town was $30,945. About 5.3% of families and 7.2% of the population were below the poverty line, including 8.3% of those under age 18 and 5.2% of those age 65 or over.
Common Questions
What is Per Capita Income in Charlestown?
Per Capita income in Charlestown is $84,017.
What is the Median Family Income in Charlestown?
Median Family Income in Charlestown is $127,292.
What is the Median Household income in Charlestown?
Median Household Income in Charlestown is $109,563.
What is Income or Wage Gap in Charlestown?
Income or Wage Gap in Charlestown is 47.3%.
Women in Charlestown earn 52.7 cents for every dollar earned by a man.
What is Inequality or Gini Index in Charlestown?
Inequality or Gini Index in Charlestown is 0.53.
What is the Total Population of Charlestown?
Total Population of Charlestown is 1,702.
What is the Total Male Population of Charlestown?
Total Male Population of Charlestown is 806.
What is the Total Female Population of Charlestown?
Total Female Population of Charlestown is 896.
What is the Ratio of Males per 100 Females in Charlestown?
There are 89.96 Males per 100 Females in Charlestown.
What is the Ratio of Females per 100 Males in Charlestown?
There are 111.17 Females per 100 Males in Charlestown.
What is the Median Population Age in Charlestown?
Median Population Age in Charlestown is 63.2 Years.
What is the Average Family Size in Charlestown
Average Family Size in Charlestown is 2.5 People.
What is the Average Household Size in Charlestown
Average Household Size in Charlestown is 2.0 People.
How Large is the Labor Force in Charlestown?
There are 847 People in the Labor Forcein in Charlestown.
What is the Percentage of People in the Labor Force in Charlestown?
51.5% of People are in the Labor Force in Charlestown.
What is the Unemployment Rate in Charlestown?
Unemployment Rate in Charlestown is 9.2%.