Chepachet, RI Map & Demographics
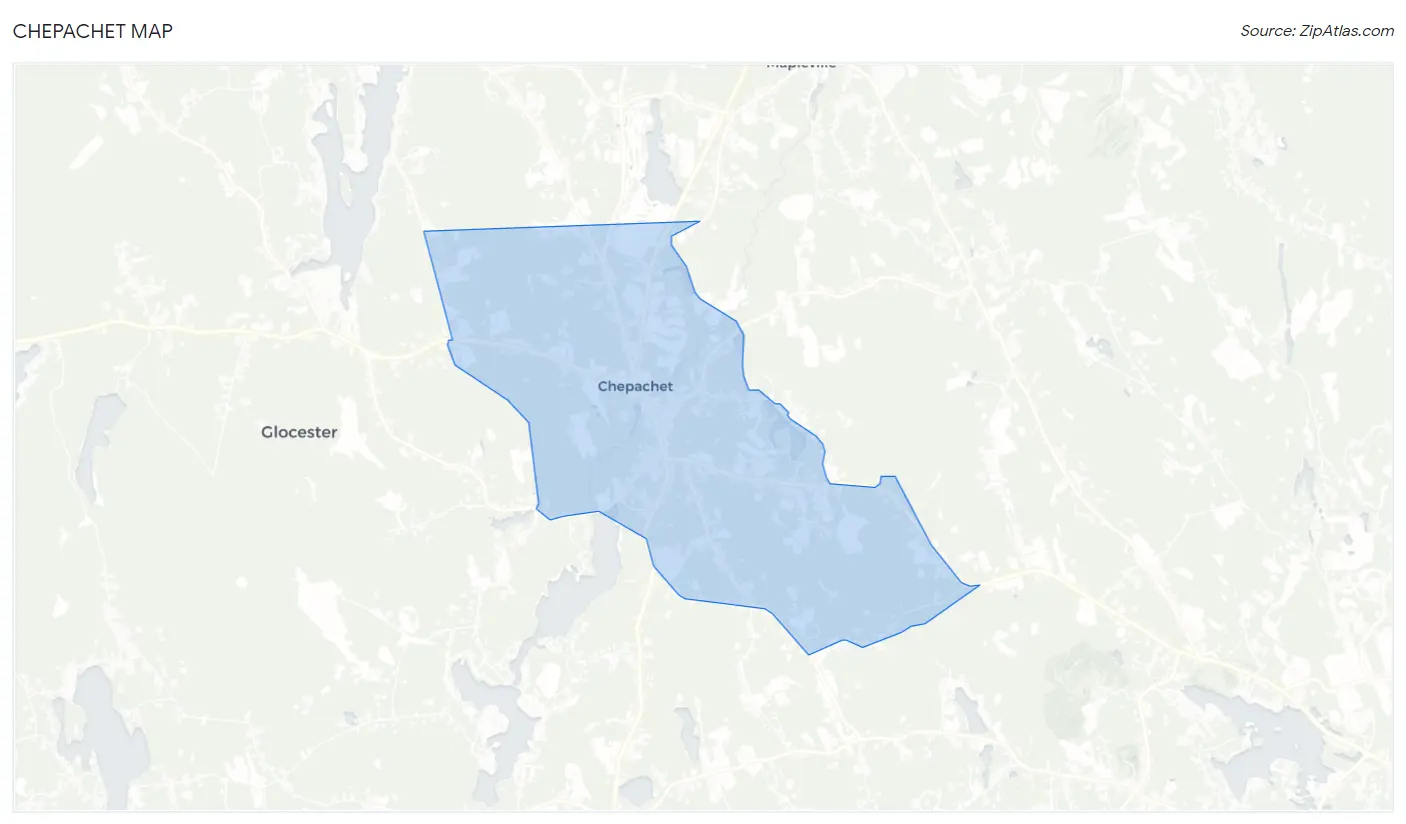
Chepachet Map
Chepachet Overview
$44,191
PER CAPITA INCOME
$91,688
AVG FAMILY INCOME
$92,228
AVG HOUSEHOLD INCOME
43.4%
WAGE / INCOME GAP [ % ]
56.6¢/ $1
WAGE / INCOME GAP [ $ ]
0.36
INEQUALITY / GINI INDEX
1,755
TOTAL POPULATION
871
MALE POPULATION
884
FEMALE POPULATION
98.53
MALES / 100 FEMALES
101.49
FEMALES / 100 MALES
41.8
MEDIAN AGE
2.9
AVG FAMILY SIZE
2.2
AVG HOUSEHOLD SIZE
1,022
LABOR FORCE [ PEOPLE ]
75.1%
PERCENT IN LABOR FORCE
Chepachet Zip Codes
Chepachet Area Codes
Income in Chepachet
Income Overview in Chepachet
Per Capita Income in Chepachet is $44,191, while median incomes of families and households are $91,688 and $92,228 respectively.
| Characteristic | Number | Measure |
| Per Capita Income | 1,755 | $44,191 |
| Median Family Income | 424 | $91,688 |
| Mean Family Income | 424 | $109,749 |
| Median Household Income | 785 | $92,228 |
| Mean Household Income | 785 | $98,752 |
| Income Deficit | 424 | $0 |
| Wage / Income Gap (%) | 1,755 | 43.44% |
| Wage / Income Gap ($) | 1,755 | 56.56¢ per $1 |
| Gini / Inequality Index | 1,755 | 0.36 |
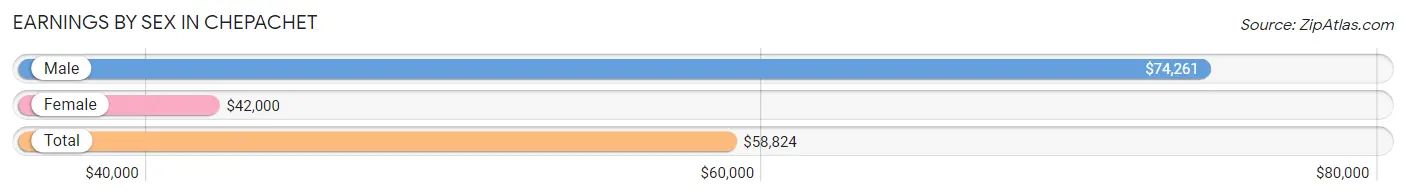
Earnings by Sex in Chepachet
Average Earnings in Chepachet are $58,824, $74,261 for men and $42,000 for women, a difference of 43.4%.
| Sex | Number | Average Earnings |
| Male | 588 (57.0%) | $74,261 |
| Female | 444 (43.0%) | $42,000 |
| Total | 1,032 (100.0%) | $58,824 |
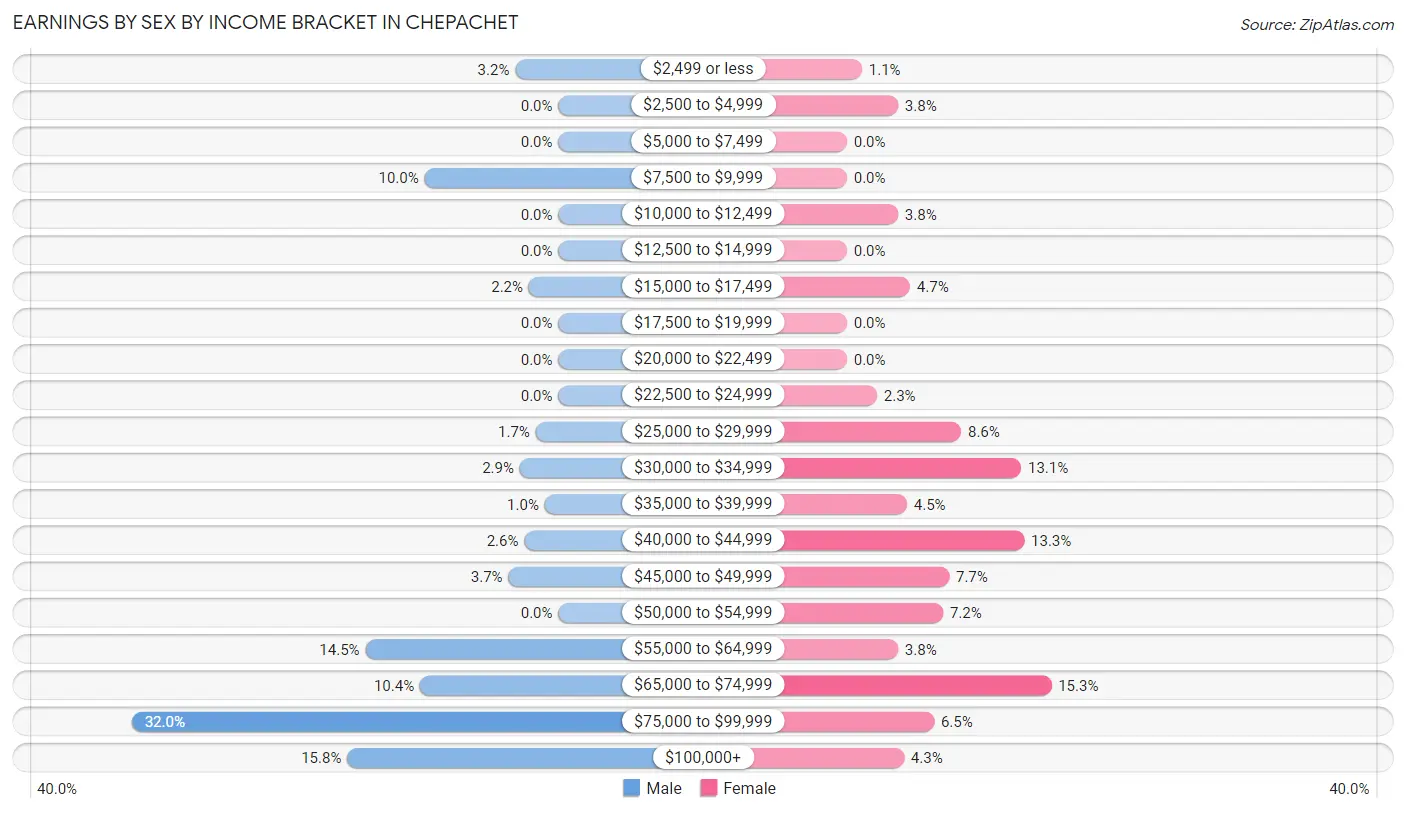
Earnings by Sex by Income Bracket in Chepachet
The most common earnings brackets in Chepachet are $75,000 to $99,999 for men (188 | 32.0%) and $65,000 to $74,999 for women (68 | 15.3%).
| Income | Male | Female |
| $2,499 or less | 19 (3.2%) | 5 (1.1%) |
| $2,500 to $4,999 | 0 (0.0%) | 17 (3.8%) |
| $5,000 to $7,499 | 0 (0.0%) | 0 (0.0%) |
| $7,500 to $9,999 | 59 (10.0%) | 0 (0.0%) |
| $10,000 to $12,499 | 0 (0.0%) | 17 (3.8%) |
| $12,500 to $14,999 | 0 (0.0%) | 0 (0.0%) |
| $15,000 to $17,499 | 13 (2.2%) | 21 (4.7%) |
| $17,500 to $19,999 | 0 (0.0%) | 0 (0.0%) |
| $20,000 to $22,499 | 0 (0.0%) | 0 (0.0%) |
| $22,500 to $24,999 | 0 (0.0%) | 10 (2.2%) |
| $25,000 to $29,999 | 10 (1.7%) | 38 (8.6%) |
| $30,000 to $34,999 | 17 (2.9%) | 58 (13.1%) |
| $35,000 to $39,999 | 6 (1.0%) | 20 (4.5%) |
| $40,000 to $44,999 | 15 (2.5%) | 59 (13.3%) |
| $45,000 to $49,999 | 22 (3.7%) | 34 (7.7%) |
| $50,000 to $54,999 | 0 (0.0%) | 32 (7.2%) |
| $55,000 to $64,999 | 85 (14.5%) | 17 (3.8%) |
| $65,000 to $74,999 | 61 (10.4%) | 68 (15.3%) |
| $75,000 to $99,999 | 188 (32.0%) | 29 (6.5%) |
| $100,000+ | 93 (15.8%) | 19 (4.3%) |
| Total | 588 (100.0%) | 444 (100.0%) |
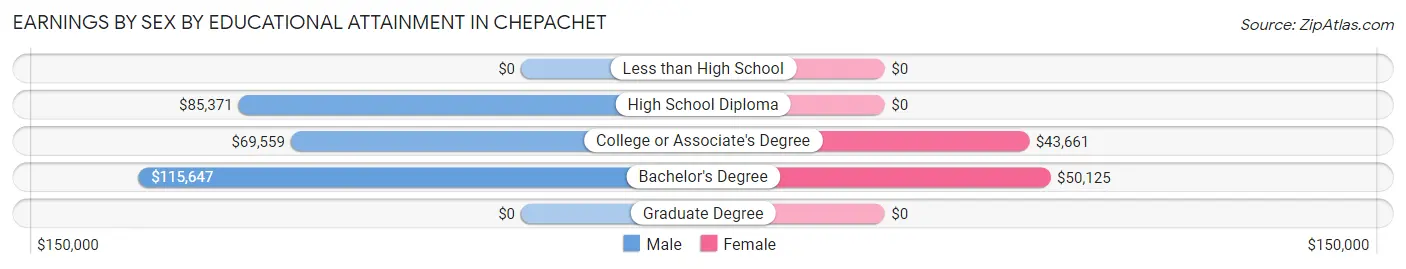
Earnings by Sex by Educational Attainment in Chepachet
Average earnings in Chepachet are $76,042 for men and $42,857 for women, a difference of 43.6%. Men with an educational attainment of bachelor's degree enjoy the highest average annual earnings of $115,647, while those with college or associate's degree education earn the least with $69,559. Women with an educational attainment of bachelor's degree earn the most with the average annual earnings of $50,125, while those with college or associate's degree education have the smallest earnings of $43,661.
| Educational Attainment | Male Income | Female Income |
| Less than High School | - | - |
| High School Diploma | $85,371 | $0 |
| College or Associate's Degree | $69,559 | $43,661 |
| Bachelor's Degree | $115,647 | $50,125 |
| Graduate Degree | - | - |
| Total | $76,042 | $42,857 |
Family Income in Chepachet
Family Income Brackets in Chepachet
According to the Chepachet family income data, there are 114 families falling into the $50,000 to $74,999 income range, which is the most common income bracket and makes up 26.9% of all families.
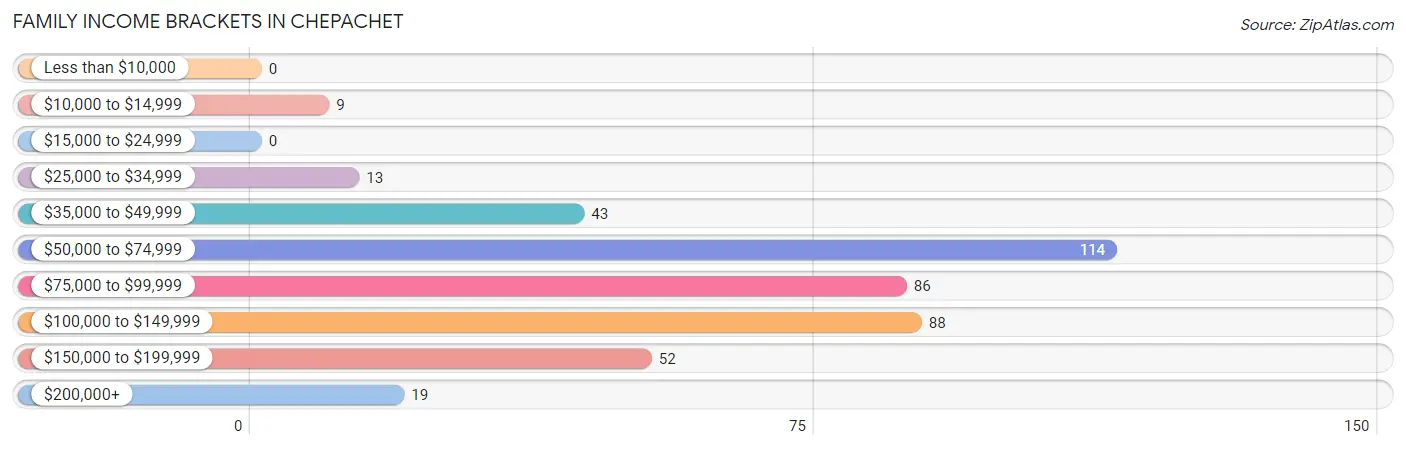
| Income Bracket | # Families | % Families |
| Less than $10,000 | 0 | 0.0% |
| $10,000 to $14,999 | 9 | 2.1% |
| $15,000 to $24,999 | 0 | 0.0% |
| $25,000 to $34,999 | 13 | 3.1% |
| $35,000 to $49,999 | 43 | 10.1% |
| $50,000 to $74,999 | 114 | 26.9% |
| $75,000 to $99,999 | 86 | 20.3% |
| $100,000 to $149,999 | 88 | 20.8% |
| $150,000 to $199,999 | 52 | 12.3% |
| $200,000+ | 19 | 4.5% |
Family Income by Famaliy Size in Chepachet
2-person families (253 | 59.7%) account for the highest median family income in Chepachet with $94,406 per family, while 2-person families (253 | 59.7%) have the highest median income of $47,203 per family member.
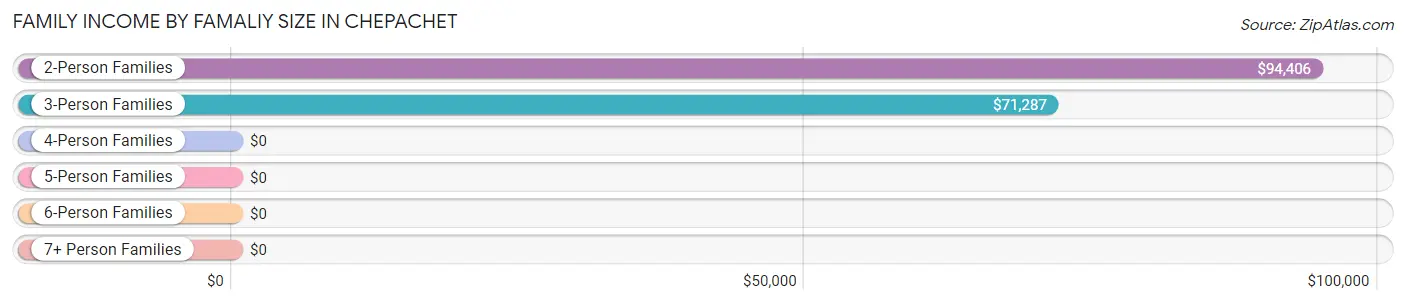
| Income Bracket | # Families | Median Income |
| 2-Person Families | 253 (59.7%) | $94,406 |
| 3-Person Families | 140 (33.0%) | $71,287 |
| 4-Person Families | 0 (0.0%) | $0 |
| 5-Person Families | 9 (2.1%) | $0 |
| 6-Person Families | 17 (4.0%) | $0 |
| 7+ Person Families | 5 (1.2%) | $0 |
| Total | 424 (100.0%) | $91,688 |
Family Income by Number of Earners in Chepachet
The median family income in Chepachet is $91,688, with families comprising 2 earners (131) having the highest median family income of $155,625, while families with 1 earner (193) have the lowest median family income of $71,673, accounting for 30.9% and 45.5% of families, respectively.
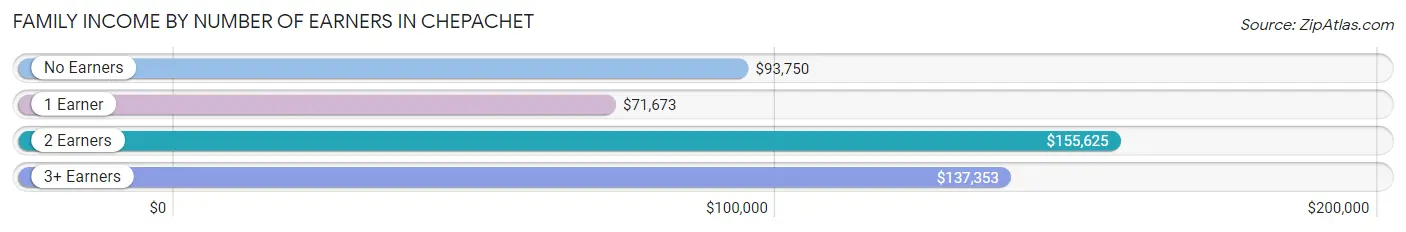
| Number of Earners | # Families | Median Income |
| No Earners | 58 (13.7%) | $93,750 |
| 1 Earner | 193 (45.5%) | $71,673 |
| 2 Earners | 131 (30.9%) | $155,625 |
| 3+ Earners | 42 (9.9%) | $137,353 |
| Total | 424 (100.0%) | $91,688 |
Household Income in Chepachet
Household Income Brackets in Chepachet
With 173 households falling in the category, the $50,000 to $74,999 income range is the most frequent in Chepachet, accounting for 22.0% of all households. In contrast, only 13 households (1.7%) fall into the $25,000 to $34,999 income bracket, making it the least populous group.
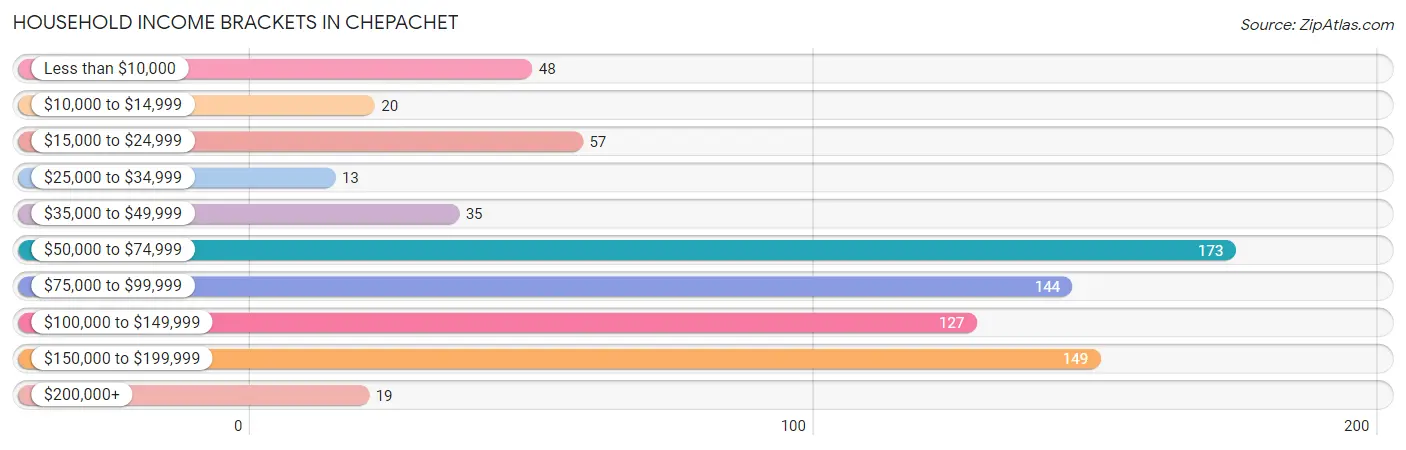
| Income Bracket | # Households | % Households |
| Less than $10,000 | 48 | 6.1% |
| $10,000 to $14,999 | 20 | 2.5% |
| $15,000 to $24,999 | 57 | 7.3% |
| $25,000 to $34,999 | 13 | 1.7% |
| $35,000 to $49,999 | 35 | 4.5% |
| $50,000 to $74,999 | 173 | 22.0% |
| $75,000 to $99,999 | 144 | 18.3% |
| $100,000 to $149,999 | 127 | 16.2% |
| $150,000 to $199,999 | 149 | 19.0% |
| $200,000+ | 19 | 2.4% |
Household Income by Householder Age in Chepachet
The median household income in Chepachet is $92,228, with the highest median household income of $155,055 found in the 25 to 44 years age bracket for the primary householder. A total of 233 households (29.7%) fall into this category.
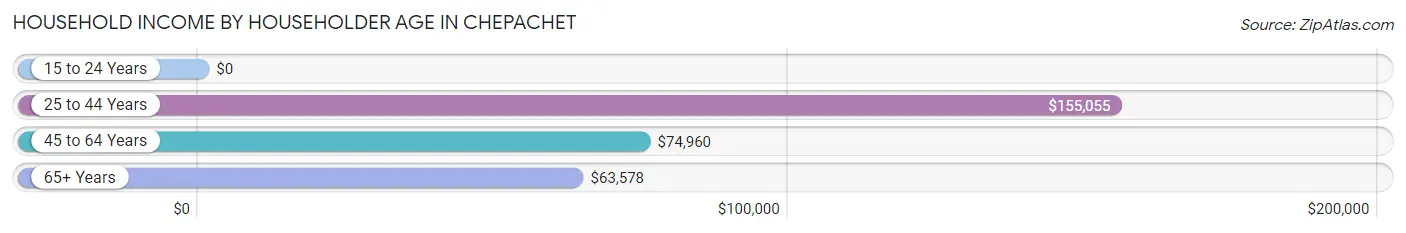
| Income Bracket | # Households | Median Income |
| 15 to 24 Years | 0 (0.0%) | $0 |
| 25 to 44 Years | 233 (29.7%) | $155,055 |
| 45 to 64 Years | 314 (40.0%) | $74,960 |
| 65+ Years | 238 (30.3%) | $63,578 |
| Total | 785 (100.0%) | $92,228 |
Poverty in Chepachet
Income Below Poverty by Sex and Age in Chepachet
With 3.2% poverty level for males and 6.6% for females among the residents of Chepachet, 65 to 74 year old males and 65 to 74 year old females are the most vulnerable to poverty, with 10 males (24.4%) and 49 females (35.0%) in their respective age groups living below the poverty level.
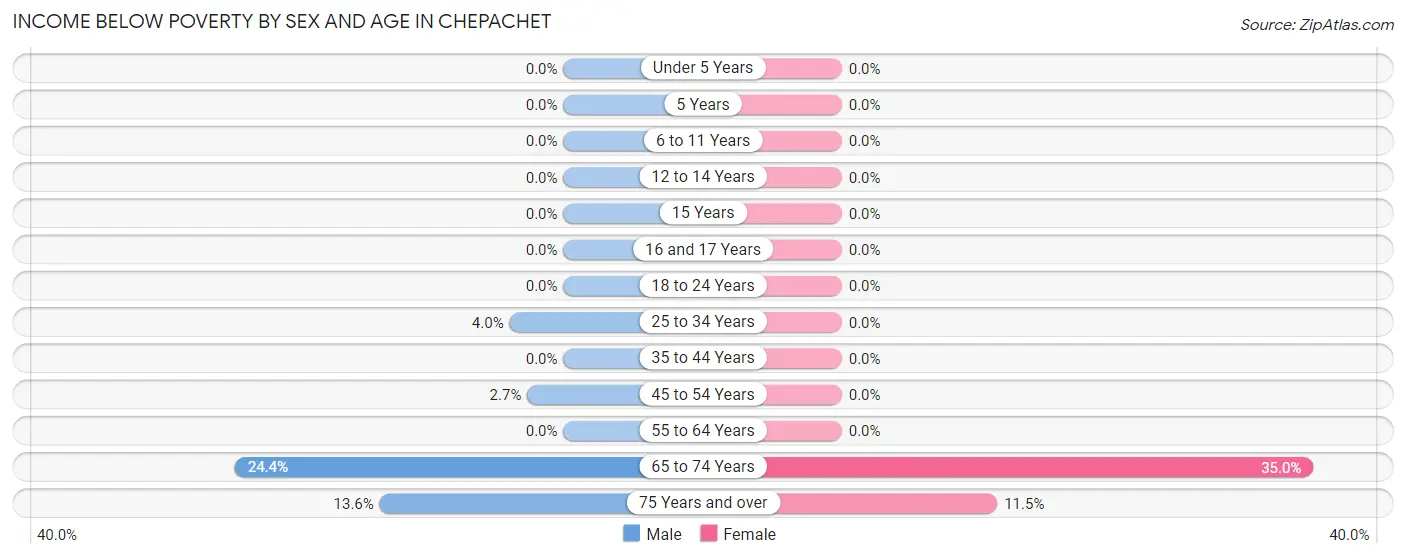
| Age Bracket | Male | Female |
| Under 5 Years | 0 (0.0%) | 0 (0.0%) |
| 5 Years | 0 (0.0%) | 0 (0.0%) |
| 6 to 11 Years | 0 (0.0%) | 0 (0.0%) |
| 12 to 14 Years | 0 (0.0%) | 0 (0.0%) |
| 15 Years | 0 (0.0%) | 0 (0.0%) |
| 16 and 17 Years | 0 (0.0%) | 0 (0.0%) |
| 18 to 24 Years | 0 (0.0%) | 0 (0.0%) |
| 25 to 34 Years | 5 (4.0%) | 0 (0.0%) |
| 35 to 44 Years | 0 (0.0%) | 0 (0.0%) |
| 45 to 54 Years | 4 (2.7%) | 0 (0.0%) |
| 55 to 64 Years | 0 (0.0%) | 0 (0.0%) |
| 65 to 74 Years | 10 (24.4%) | 49 (35.0%) |
| 75 Years and over | 9 (13.6%) | 9 (11.5%) |
| Total | 28 (3.2%) | 58 (6.6%) |
Income Above Poverty by Sex and Age in Chepachet
According to the poverty statistics in Chepachet, males aged 6 to 11 years and females aged under 5 years are the age groups that are most secure financially, with 100.0% of males and 100.0% of females in these age groups living above the poverty line.
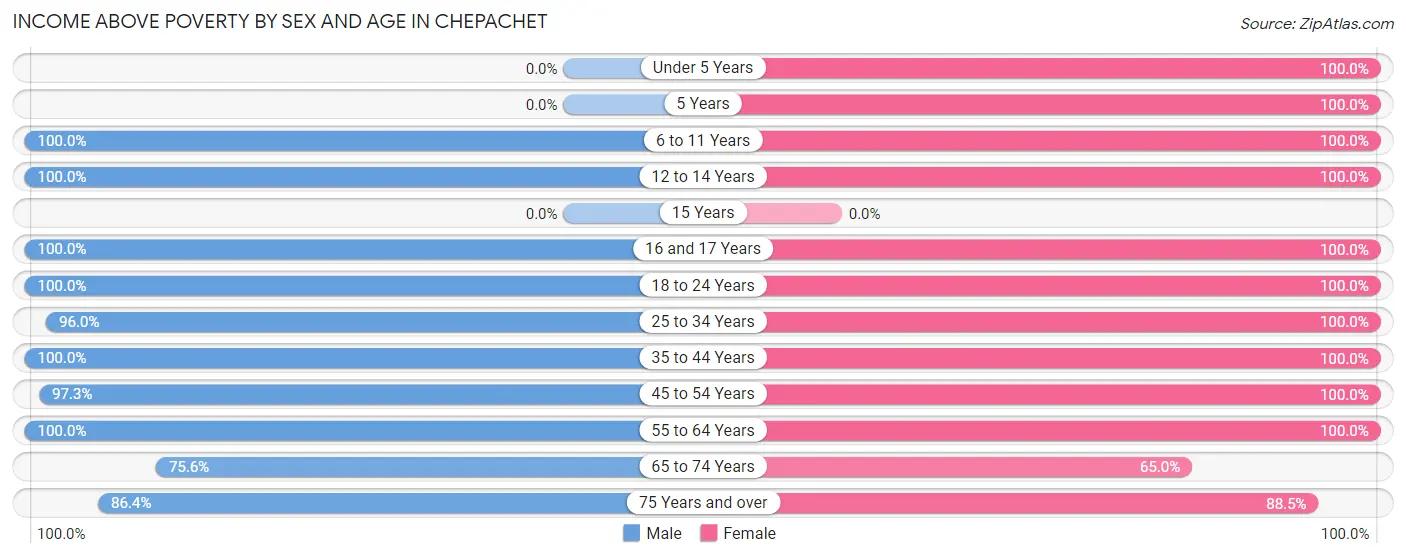
| Age Bracket | Male | Female |
| Under 5 Years | 0 (0.0%) | 15 (100.0%) |
| 5 Years | 0 (0.0%) | 9 (100.0%) |
| 6 to 11 Years | 38 (100.0%) | 173 (100.0%) |
| 12 to 14 Years | 148 (100.0%) | 11 (100.0%) |
| 15 Years | 0 (0.0%) | 0 (0.0%) |
| 16 and 17 Years | 19 (100.0%) | 5 (100.0%) |
| 18 to 24 Years | 22 (100.0%) | 17 (100.0%) |
| 25 to 34 Years | 120 (96.0%) | 72 (100.0%) |
| 35 to 44 Years | 94 (100.0%) | 159 (100.0%) |
| 45 to 54 Years | 145 (97.3%) | 33 (100.0%) |
| 55 to 64 Years | 169 (100.0%) | 172 (100.0%) |
| 65 to 74 Years | 31 (75.6%) | 91 (65.0%) |
| 75 Years and over | 57 (86.4%) | 69 (88.5%) |
| Total | 843 (96.8%) | 826 (93.4%) |
Income Below Poverty Among Married-Couple Families in Chepachet
The poverty statistics for married-couple families in Chepachet show that 3.1% or 9 of the total 292 families live below the poverty line. Families with no children have the highest poverty rate of 3.5%, comprising of 9 families. On the other hand, families with 3 or 4 children have the lowest poverty rate of 0.0%, which includes 0 families.
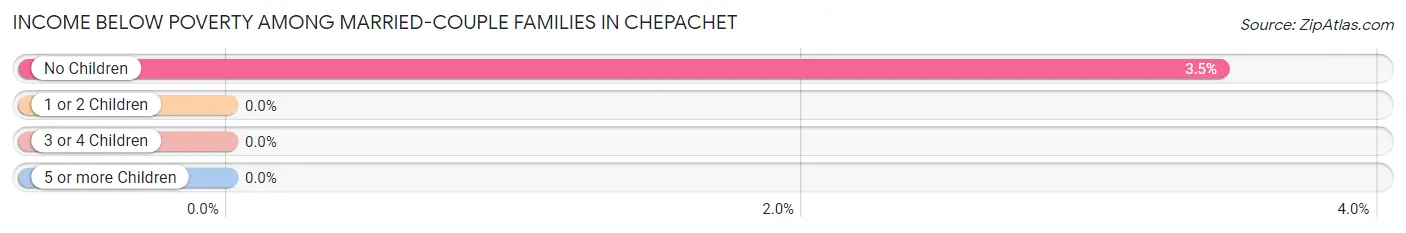
| Children | Above Poverty | Below Poverty |
| No Children | 252 (96.6%) | 9 (3.5%) |
| 1 or 2 Children | 0 (0.0%) | 0 (0.0%) |
| 3 or 4 Children | 26 (100.0%) | 0 (0.0%) |
| 5 or more Children | 5 (100.0%) | 0 (0.0%) |
| Total | 283 (96.9%) | 9 (3.1%) |
Income Below Poverty Among Single-Parent Households in Chepachet
| Children | Single Father | Single Mother |
| No Children | 0 (0.0%) | 0 (0.0%) |
| 1 or 2 Children | 0 (0.0%) | 0 (0.0%) |
| 3 or 4 Children | 0 (0.0%) | 0 (0.0%) |
| 5 or more Children | 0 (0.0%) | 0 (0.0%) |
| Total | 0 (0.0%) | 0 (0.0%) |
Income Below Poverty Among Married-Couple vs Single-Parent Households in Chepachet
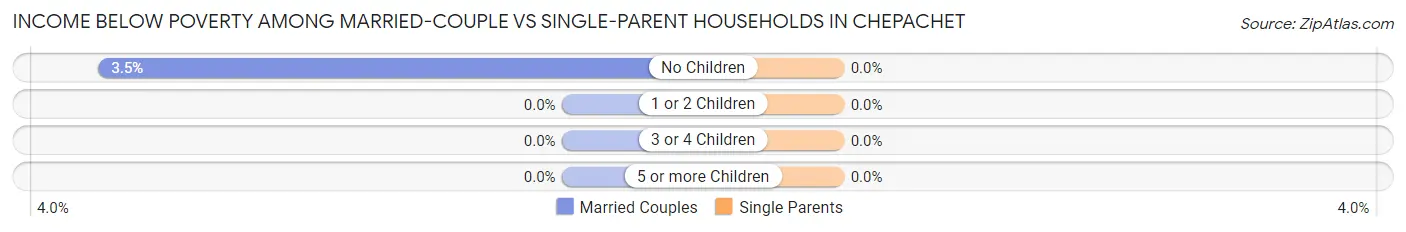
| Children | Married-Couple Families | Single-Parent Households |
| No Children | 9 (3.5%) | 0 (0.0%) |
| 1 or 2 Children | 0 (0.0%) | 0 (0.0%) |
| 3 or 4 Children | 0 (0.0%) | 0 (0.0%) |
| 5 or more Children | 0 (0.0%) | 0 (0.0%) |
| Total | 9 (3.1%) | 0 (0.0%) |
Race in Chepachet
The most populous races in Chepachet are White / Caucasian (1,687 | 96.1%), Asian (38 | 2.2%), and Hispanic or Latino (15 | 0.9%).
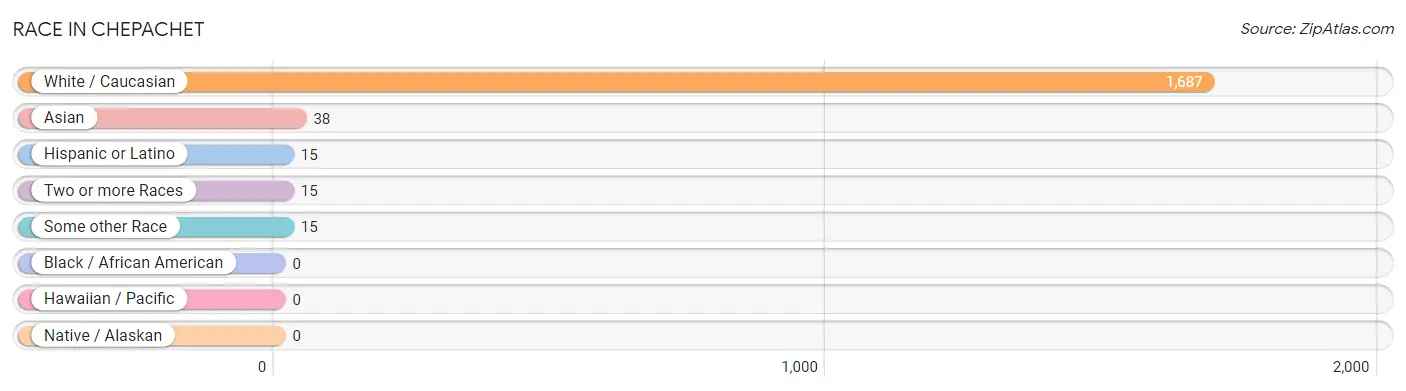
| Race | # Population | % Population |
| Asian | 38 | 2.2% |
| Black / African American | 0 | 0.0% |
| Hawaiian / Pacific | 0 | 0.0% |
| Hispanic or Latino | 15 | 0.9% |
| Native / Alaskan | 0 | 0.0% |
| White / Caucasian | 1,687 | 96.1% |
| Two or more Races | 15 | 0.9% |
| Some other Race | 15 | 0.9% |
| Total | 1,755 | 100.0% |
Ancestry in Chepachet
The most populous ancestries reported in Chepachet are Italian (530 | 30.2%), English (457 | 26.0%), Irish (321 | 18.3%), French (285 | 16.2%), and Polish (129 | 7.3%), together accounting for 98.1% of all Chepachet residents.
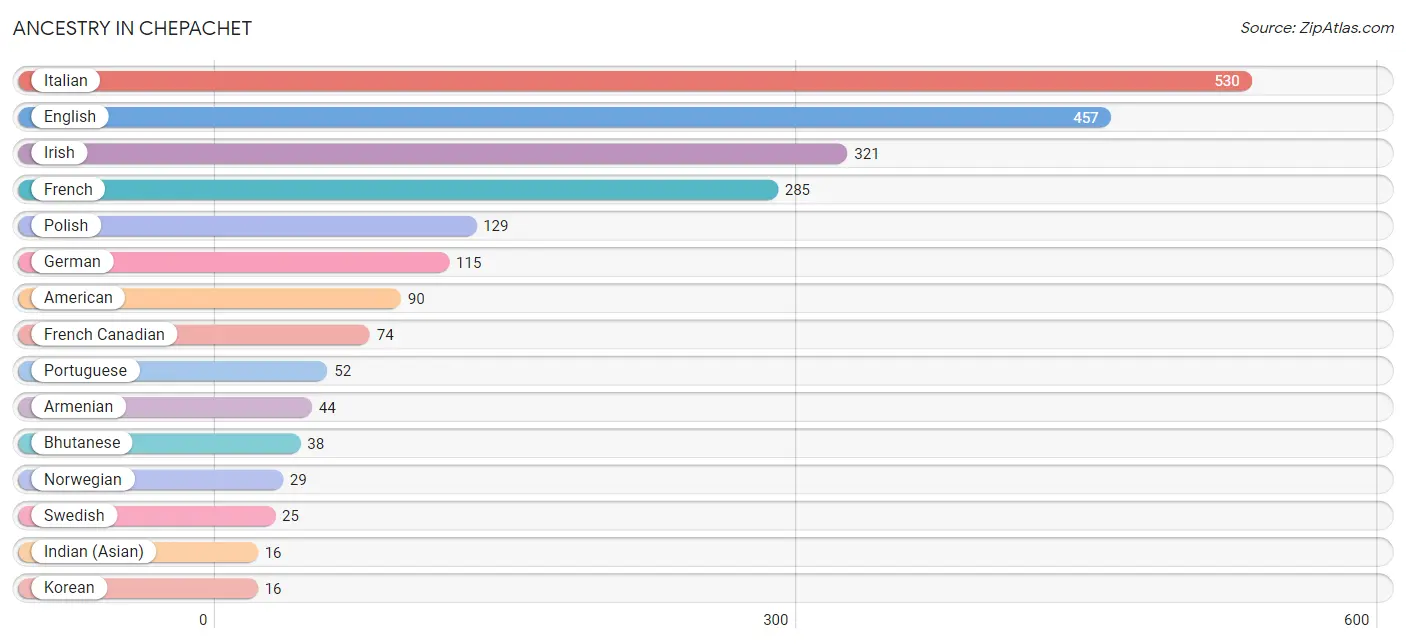
| Ancestry | # Population | % Population |
| American | 90 | 5.1% |
| Armenian | 44 | 2.5% |
| Bhutanese | 38 | 2.2% |
| English | 457 | 26.0% |
| French | 285 | 16.2% |
| French Canadian | 74 | 4.2% |
| German | 115 | 6.6% |
| Greek | 14 | 0.8% |
| Indian (Asian) | 16 | 0.9% |
| Irish | 321 | 18.3% |
| Italian | 530 | 30.2% |
| Korean | 16 | 0.9% |
| Norwegian | 29 | 1.7% |
| Polish | 129 | 7.3% |
| Portuguese | 52 | 3.0% |
| Puerto Rican | 15 | 0.9% |
| Swedish | 25 | 1.4% | View All 17 Rows |
Immigrants in Chepachet
The most numerous immigrant groups reported in Chepachet came from , and Canada (10 | 0.6%), together accounting for 0.6% of all Chepachet residents.

| Immigration Origin | # Population | % Population |
| Canada | 10 | 0.6% | View All 1 Rows |
Sex and Age in Chepachet
Sex and Age in Chepachet
The most populous age groups in Chepachet are 10 to 14 Years (162 | 18.6%) for men and 40 to 44 Years (159 | 18.0%) for women.
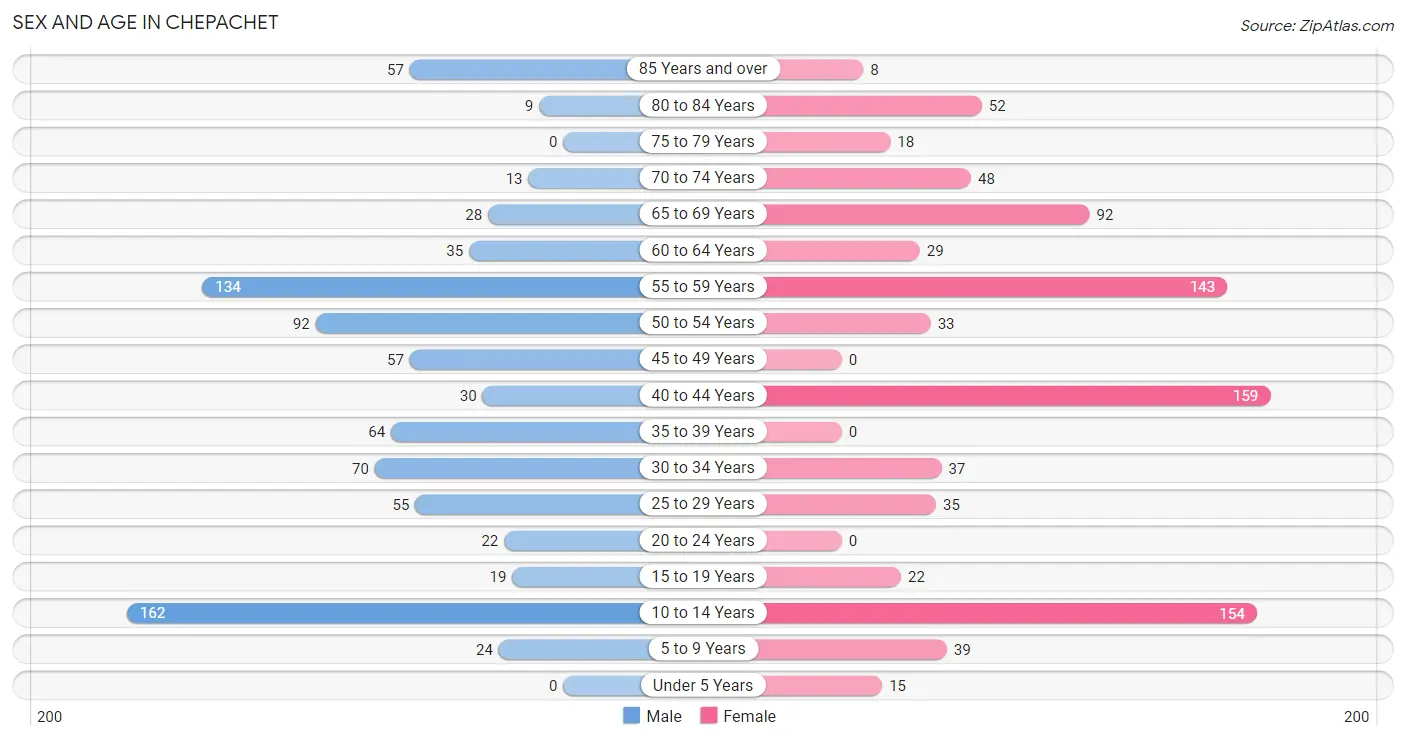
| Age Bracket | Male | Female |
| Under 5 Years | 0 (0.0%) | 15 (1.7%) |
| 5 to 9 Years | 24 (2.8%) | 39 (4.4%) |
| 10 to 14 Years | 162 (18.6%) | 154 (17.4%) |
| 15 to 19 Years | 19 (2.2%) | 22 (2.5%) |
| 20 to 24 Years | 22 (2.5%) | 0 (0.0%) |
| 25 to 29 Years | 55 (6.3%) | 35 (4.0%) |
| 30 to 34 Years | 70 (8.0%) | 37 (4.2%) |
| 35 to 39 Years | 64 (7.3%) | 0 (0.0%) |
| 40 to 44 Years | 30 (3.4%) | 159 (18.0%) |
| 45 to 49 Years | 57 (6.5%) | 0 (0.0%) |
| 50 to 54 Years | 92 (10.6%) | 33 (3.7%) |
| 55 to 59 Years | 134 (15.4%) | 143 (16.2%) |
| 60 to 64 Years | 35 (4.0%) | 29 (3.3%) |
| 65 to 69 Years | 28 (3.2%) | 92 (10.4%) |
| 70 to 74 Years | 13 (1.5%) | 48 (5.4%) |
| 75 to 79 Years | 0 (0.0%) | 18 (2.0%) |
| 80 to 84 Years | 9 (1.0%) | 52 (5.9%) |
| 85 Years and over | 57 (6.5%) | 8 (0.9%) |
| Total | 871 (100.0%) | 884 (100.0%) |
Families and Households in Chepachet
Median Family Size in Chepachet
The median family size in Chepachet is 2.92 persons per family, with single female/mother families (103 | 24.3%) accounting for the largest median family size of 4.24 persons per family. On the other hand, single male/father families (29 | 6.8%) represent the smallest median family size with 2.34 persons per family.
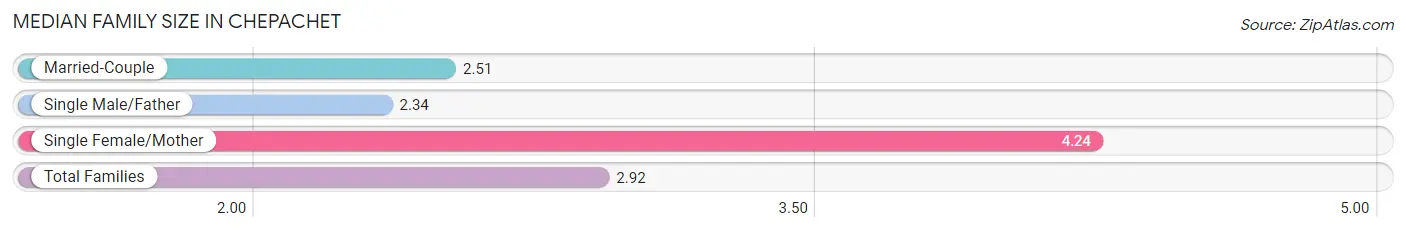
| Family Type | # Families | Family Size |
| Married-Couple | 292 (68.9%) | 2.51 |
| Single Male/Father | 29 (6.8%) | 2.34 |
| Single Female/Mother | 103 (24.3%) | 4.24 |
| Total Families | 424 (100.0%) | 2.92 |
Median Household Size in Chepachet
The median household size in Chepachet is 2.22 persons per household, with single female/mother households (103 | 13.1%) accounting for the largest median household size of 4.86 persons per household. non-family households (361 | 46.0%) represent the smallest median household size with 1.12 persons per household.
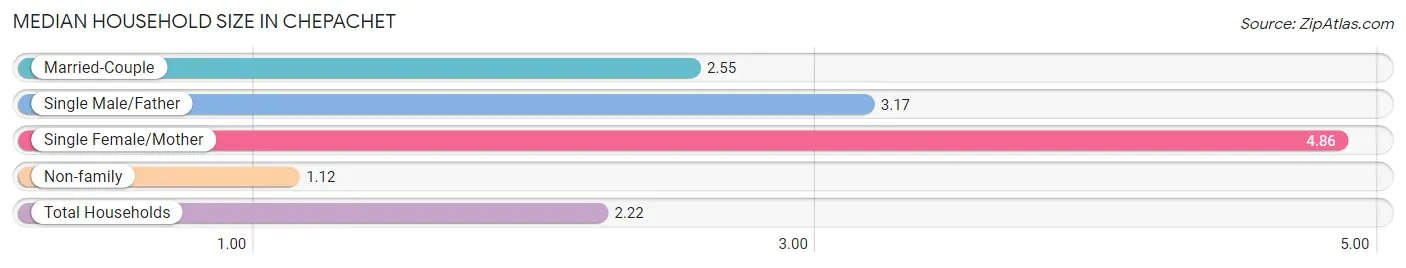
| Household Type | # Households | Household Size |
| Married-Couple | 292 (37.2%) | 2.55 |
| Single Male/Father | 29 (3.7%) | 3.17 |
| Single Female/Mother | 103 (13.1%) | 4.86 |
| Non-family | 361 (46.0%) | 1.12 |
| Total Households | 785 (100.0%) | 2.22 |
Household Size by Marriage Status in Chepachet
Out of a total of 785 households in Chepachet, 424 (54.0%) are family households, while 361 (46.0%) are nonfamily households. The most numerous type of family households are 2-person households, comprising 233, and the most common type of nonfamily households are 1-person households, comprising 310.
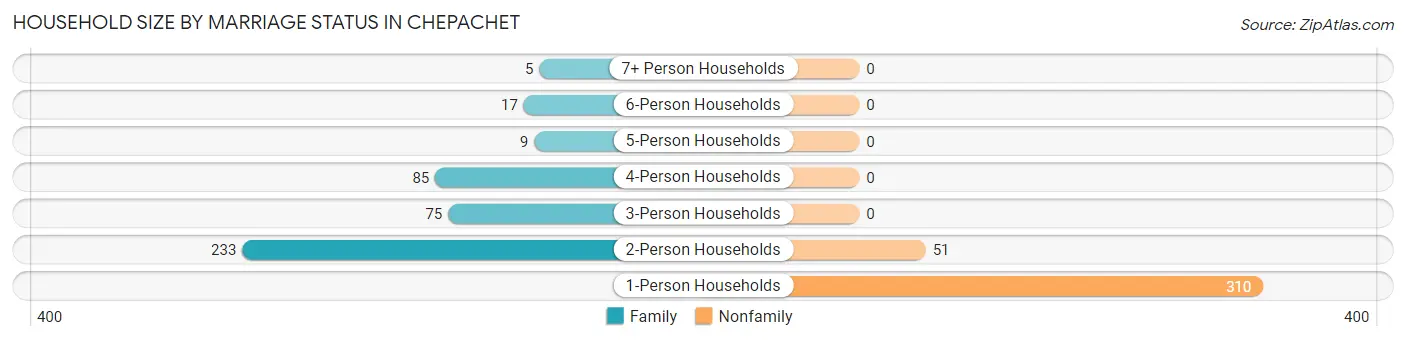
| Household Size | Family Households | Nonfamily Households |
| 1-Person Households | - | 310 (39.5%) |
| 2-Person Households | 233 (29.7%) | 51 (6.5%) |
| 3-Person Households | 75 (9.6%) | 0 (0.0%) |
| 4-Person Households | 85 (10.8%) | 0 (0.0%) |
| 5-Person Households | 9 (1.1%) | 0 (0.0%) |
| 6-Person Households | 17 (2.2%) | 0 (0.0%) |
| 7+ Person Households | 5 (0.6%) | 0 (0.0%) |
| Total | 424 (54.0%) | 361 (46.0%) |
Female Fertility in Chepachet
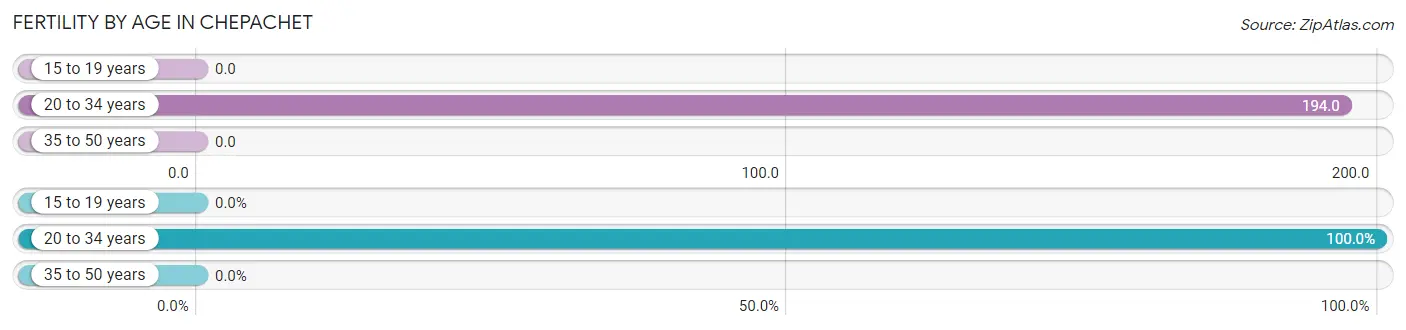
Fertility by Age in Chepachet
Average fertility rate in Chepachet is 51.0 births per 1,000 women. Women in the age bracket of 20 to 34 years have the highest fertility rate with 194.0 births per 1,000 women. Women in the age bracket of 20 to 34 years acount for 100.0% of all women with births.
| Age Bracket | Women with Births | Births / 1,000 Women |
| 15 to 19 years | 0 (0.0%) | 0.0 |
| 20 to 34 years | 14 (100.0%) | 194.0 |
| 35 to 50 years | 0 (0.0%) | 0.0 |
| Total | 14 (100.0%) | 51.0 |
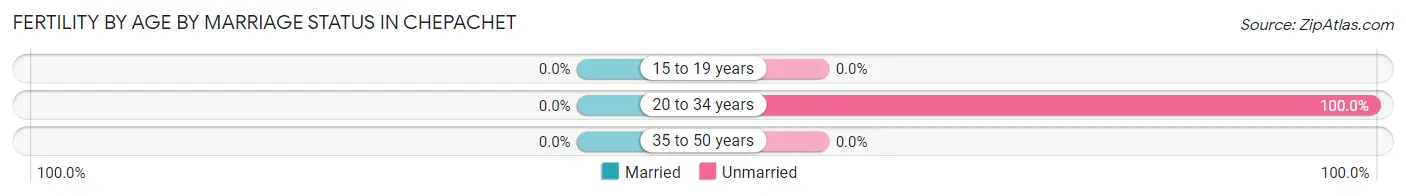
Fertility by Age by Marriage Status in Chepachet
| Age Bracket | Married | Unmarried |
| 15 to 19 years | 0 (0.0%) | 0 (0.0%) |
| 20 to 34 years | 0 (0.0%) | 14 (100.0%) |
| 35 to 50 years | 0 (0.0%) | 0 (0.0%) |
| Total | 0 (0.0%) | 14 (100.0%) |
Fertility by Education in Chepachet
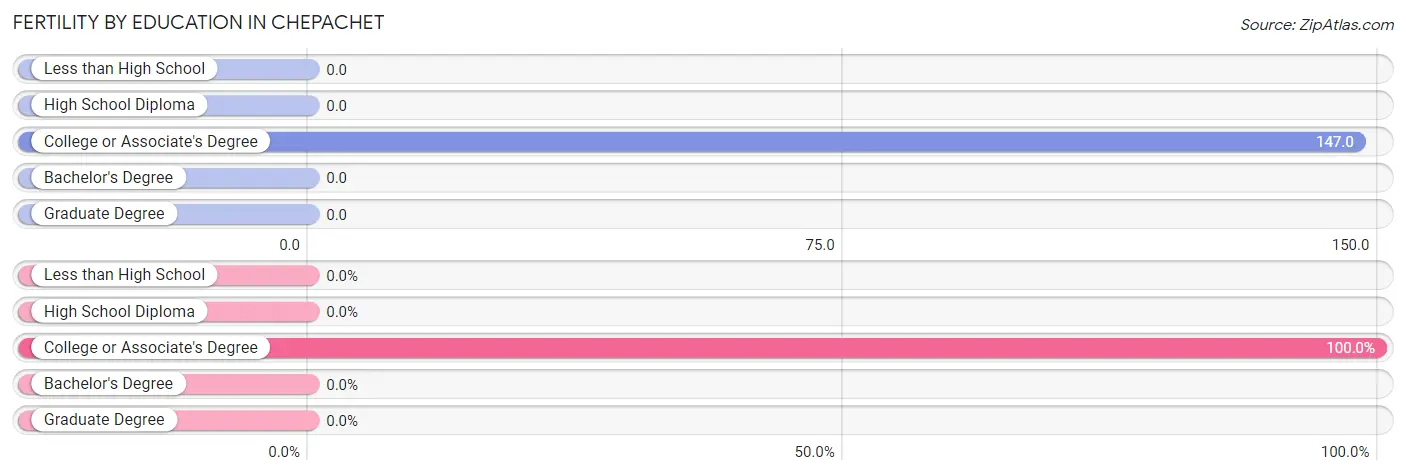
| Educational Attainment | Women with Births | Births / 1,000 Women |
| Less than High School | 0 (0.0%) | 0.0 |
| High School Diploma | 0 (0.0%) | 0.0 |
| College or Associate's Degree | 14 (100.0%) | 147.0 |
| Bachelor's Degree | 0 (0.0%) | 0.0 |
| Graduate Degree | 0 (0.0%) | 0.0 |
| Total | 14 (100.0%) | 51.0 |
Fertility by Education by Marriage Status in Chepachet
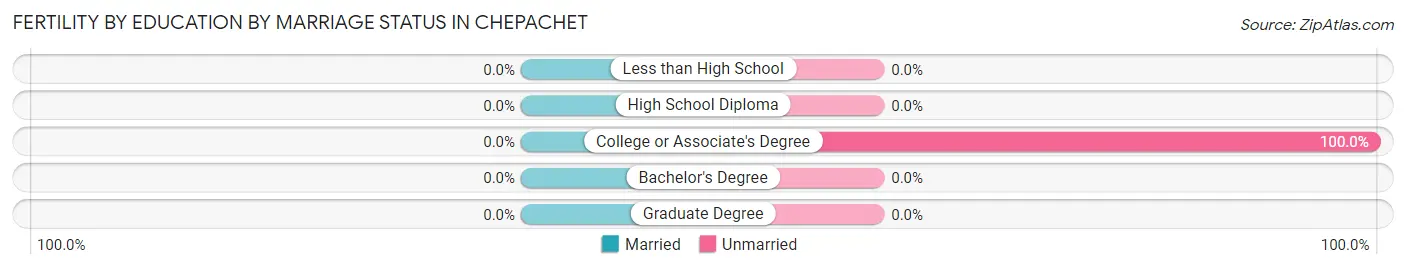
| Educational Attainment | Married | Unmarried |
| Less than High School | 0 (0.0%) | 0 (0.0%) |
| High School Diploma | 0 (0.0%) | 0 (0.0%) |
| College or Associate's Degree | 0 (0.0%) | 14 (100.0%) |
| Bachelor's Degree | 0 (0.0%) | 0 (0.0%) |
| Graduate Degree | 0 (0.0%) | 0 (0.0%) |
| Total | 0 (0.0%) | 14 (100.0%) |
Employment Characteristics in Chepachet
Employment by Class of Employer in Chepachet
Among the 1,022 employed individuals in Chepachet, private company employees (843 | 82.5%), self-employed (not incorporated) (74 | 7.2%), and self-employed (incorporated) (40 | 3.9%) make up the most common classes of employment.
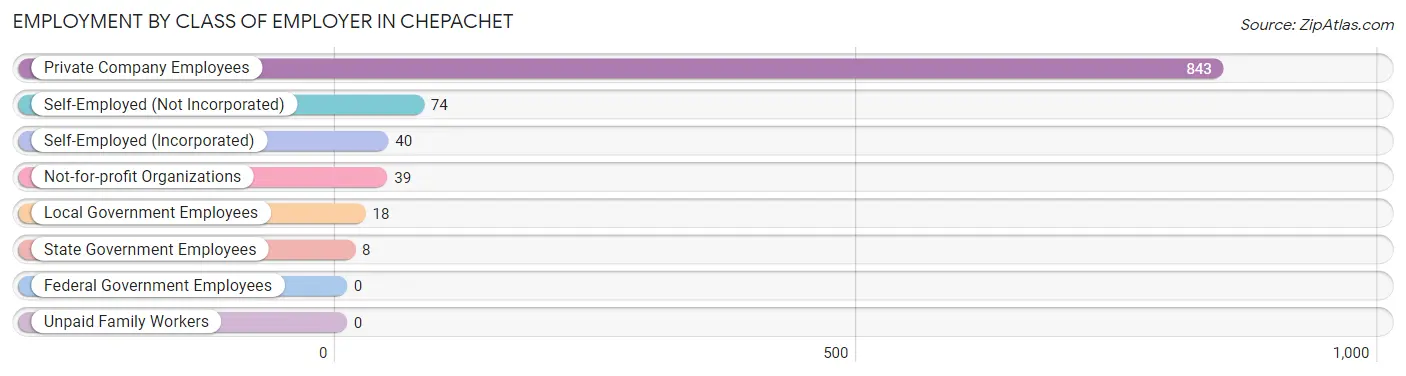
| Employer Class | # Employees | % Employees |
| Private Company Employees | 843 | 82.5% |
| Self-Employed (Incorporated) | 40 | 3.9% |
| Self-Employed (Not Incorporated) | 74 | 7.2% |
| Not-for-profit Organizations | 39 | 3.8% |
| Local Government Employees | 18 | 1.8% |
| State Government Employees | 8 | 0.8% |
| Federal Government Employees | 0 | 0.0% |
| Unpaid Family Workers | 0 | 0.0% |
| Total | 1,022 | 100.0% |
Employment Status by Age in Chepachet
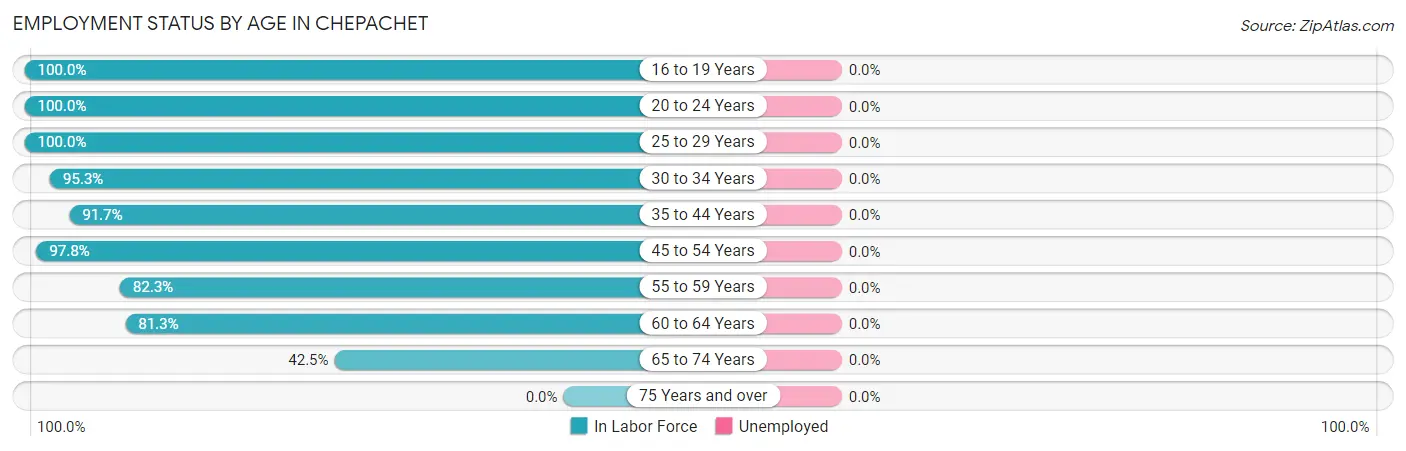
| Age Bracket | In Labor Force | Unemployed |
| 16 to 19 Years | 41 (100.0%) | 0 (0.0%) |
| 20 to 24 Years | 22 (100.0%) | 0 (0.0%) |
| 25 to 29 Years | 90 (100.0%) | 0 (0.0%) |
| 30 to 34 Years | 102 (95.3%) | 0 (0.0%) |
| 35 to 44 Years | 232 (91.7%) | 0 (0.0%) |
| 45 to 54 Years | 178 (97.8%) | 0 (0.0%) |
| 55 to 59 Years | 228 (82.3%) | 0 (0.0%) |
| 60 to 64 Years | 52 (81.3%) | 0 (0.0%) |
| 65 to 74 Years | 77 (42.5%) | 0 (0.0%) |
| 75 Years and over | 0 (0.0%) | 0 (0.0%) |
| Total | 1,022 (75.1%) | 0 (0.0%) |
Employment Status by Educational Attainment in Chepachet
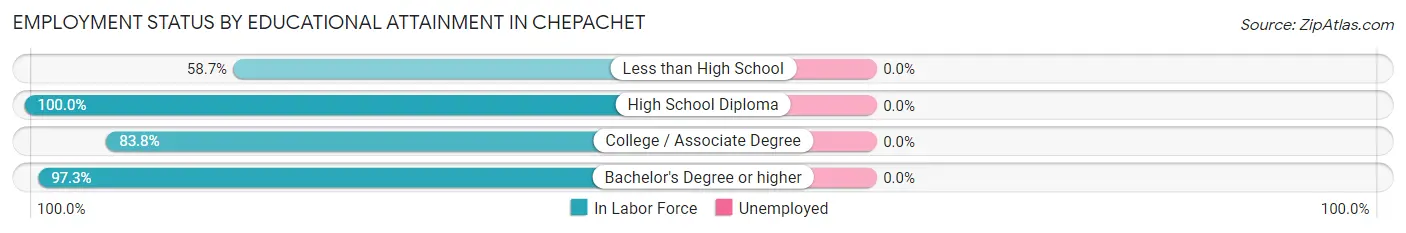
| Educational Attainment | In Labor Force | Unemployed |
| Less than High School | 37 (58.7%) | 0 (0.0%) |
| High School Diploma | 265 (100.0%) | 0 (0.0%) |
| College / Associate Degree | 295 (83.8%) | 0 (0.0%) |
| Bachelor's Degree or higher | 285 (97.3%) | 0 (0.0%) |
| Total | 882 (90.6%) | 0 (0.0%) |
Employment Occupations by Sex in Chepachet
Management, Business, Science and Arts Occupations
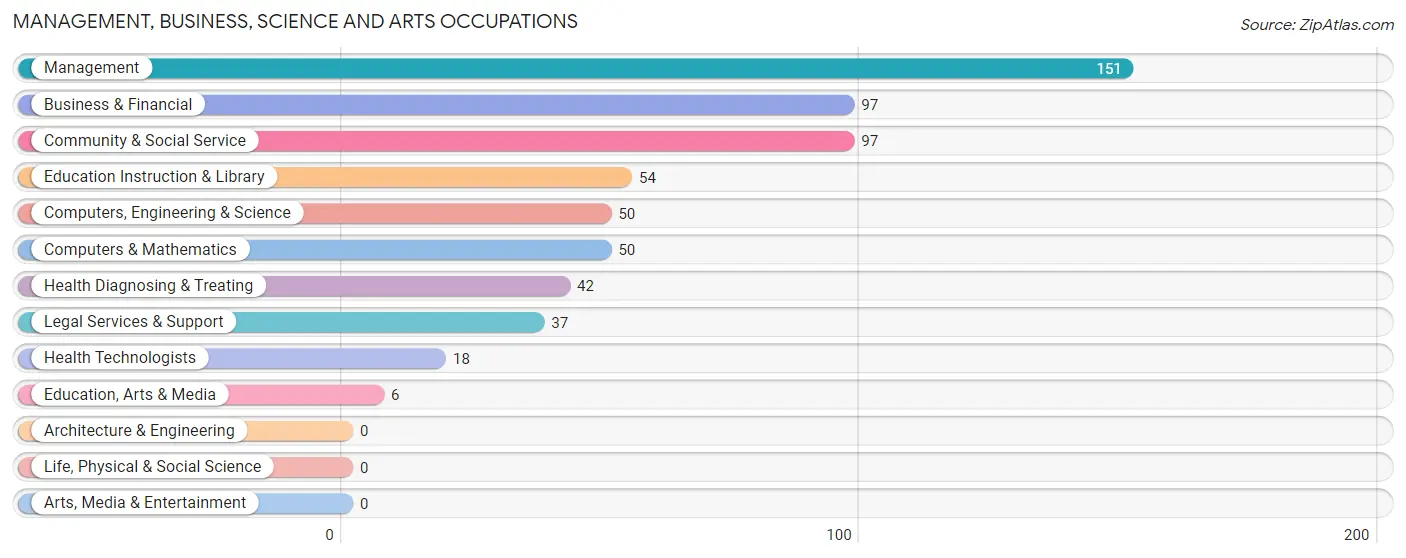
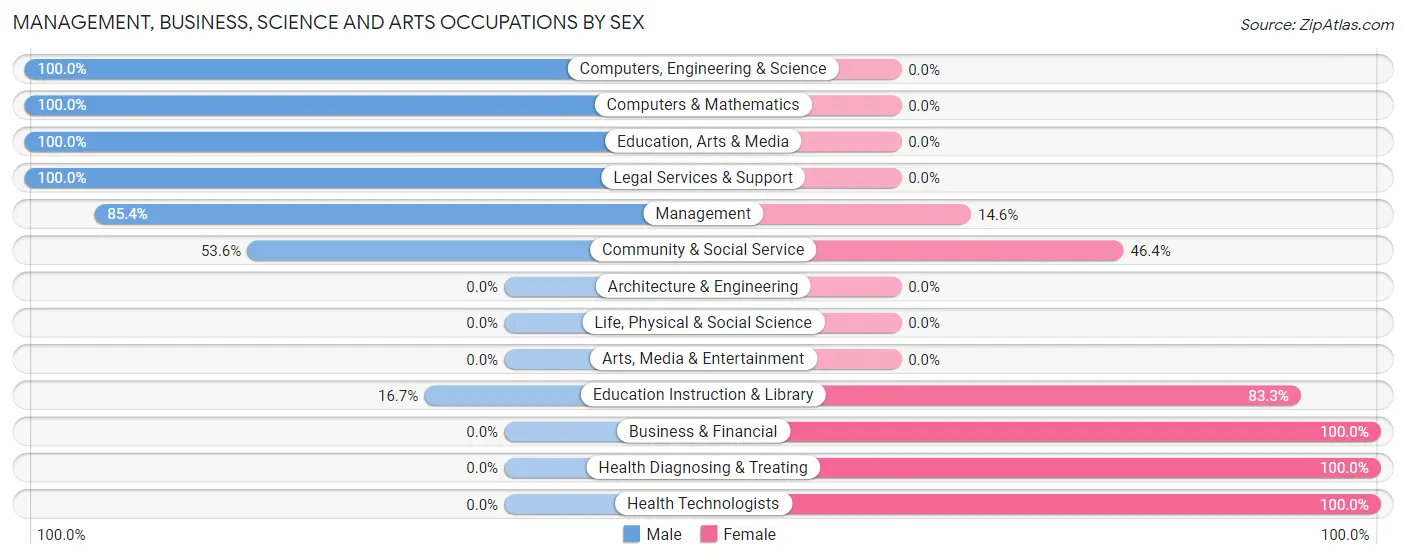
The most common Management, Business, Science and Arts occupations in Chepachet are Management (151 | 14.8%), Business & Financial (97 | 9.5%), Community & Social Service (97 | 9.5%), Education Instruction & Library (54 | 5.3%), and Computers, Engineering & Science (50 | 4.9%).
Management, Business, Science and Arts Occupations by Sex
Within the Management, Business, Science and Arts occupations in Chepachet, the most male-oriented occupations are Computers, Engineering & Science (100.0%), Computers & Mathematics (100.0%), and Education, Arts & Media (100.0%), while the most female-oriented occupations are Business & Financial (100.0%), Health Diagnosing & Treating (100.0%), and Health Technologists (100.0%).
| Occupation | Male | Female |
| Management | 129 (85.4%) | 22 (14.6%) |
| Business & Financial | 0 (0.0%) | 97 (100.0%) |
| Computers, Engineering & Science | 50 (100.0%) | 0 (0.0%) |
| Computers & Mathematics | 50 (100.0%) | 0 (0.0%) |
| Architecture & Engineering | 0 (0.0%) | 0 (0.0%) |
| Life, Physical & Social Science | 0 (0.0%) | 0 (0.0%) |
| Community & Social Service | 52 (53.6%) | 45 (46.4%) |
| Education, Arts & Media | 6 (100.0%) | 0 (0.0%) |
| Legal Services & Support | 37 (100.0%) | 0 (0.0%) |
| Education Instruction & Library | 9 (16.7%) | 45 (83.3%) |
| Arts, Media & Entertainment | 0 (0.0%) | 0 (0.0%) |
| Health Diagnosing & Treating | 0 (0.0%) | 42 (100.0%) |
| Health Technologists | 0 (0.0%) | 18 (100.0%) |
| Total (Category) | 231 (52.9%) | 206 (47.1%) |
| Total (Overall) | 588 (57.5%) | 434 (42.5%) |
Services Occupations
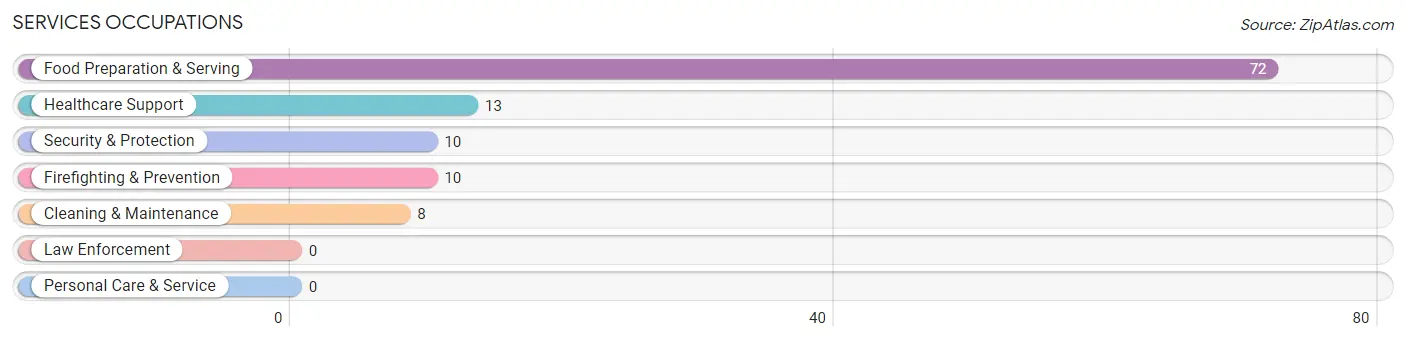
The most common Services occupations in Chepachet are Food Preparation & Serving (72 | 7.0%), Healthcare Support (13 | 1.3%), Security & Protection (10 | 1.0%), Firefighting & Prevention (10 | 1.0%), and Cleaning & Maintenance (8 | 0.8%).
Services Occupations by Sex
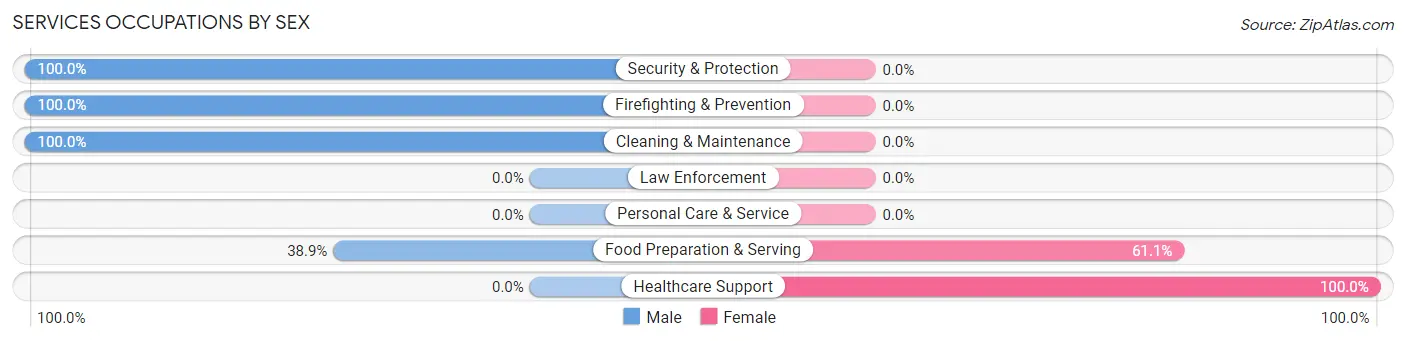
Within the Services occupations in Chepachet, the most male-oriented occupations are Security & Protection (100.0%), Firefighting & Prevention (100.0%), and Cleaning & Maintenance (100.0%), while the most female-oriented occupations are Healthcare Support (100.0%), and Food Preparation & Serving (61.1%).
| Occupation | Male | Female |
| Healthcare Support | 0 (0.0%) | 13 (100.0%) |
| Security & Protection | 10 (100.0%) | 0 (0.0%) |
| Firefighting & Prevention | 10 (100.0%) | 0 (0.0%) |
| Law Enforcement | 0 (0.0%) | 0 (0.0%) |
| Food Preparation & Serving | 28 (38.9%) | 44 (61.1%) |
| Cleaning & Maintenance | 8 (100.0%) | 0 (0.0%) |
| Personal Care & Service | 0 (0.0%) | 0 (0.0%) |
| Total (Category) | 46 (44.7%) | 57 (55.3%) |
| Total (Overall) | 588 (57.5%) | 434 (42.5%) |
Sales and Office Occupations
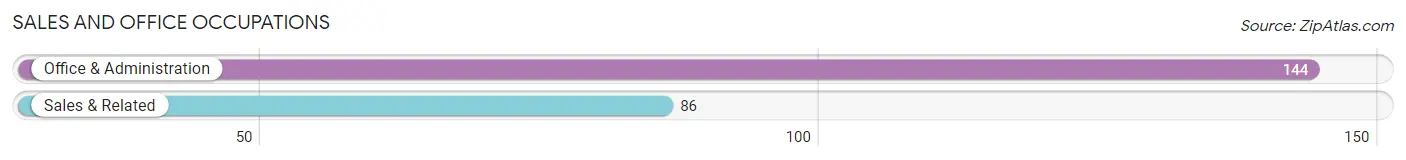
The most common Sales and Office occupations in Chepachet are Office & Administration (144 | 14.1%), and Sales & Related (86 | 8.4%).
Sales and Office Occupations by Sex
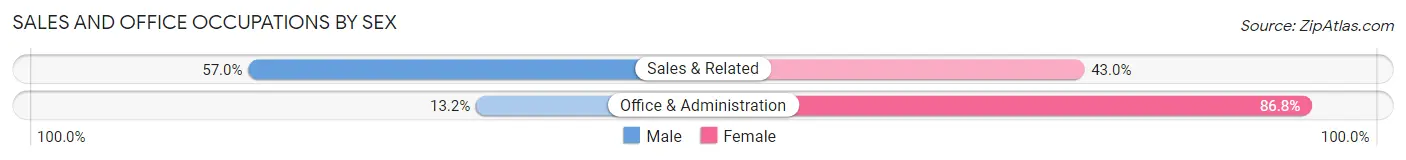
| Occupation | Male | Female |
| Sales & Related | 49 (57.0%) | 37 (43.0%) |
| Office & Administration | 19 (13.2%) | 125 (86.8%) |
| Total (Category) | 68 (29.6%) | 162 (70.4%) |
| Total (Overall) | 588 (57.5%) | 434 (42.5%) |
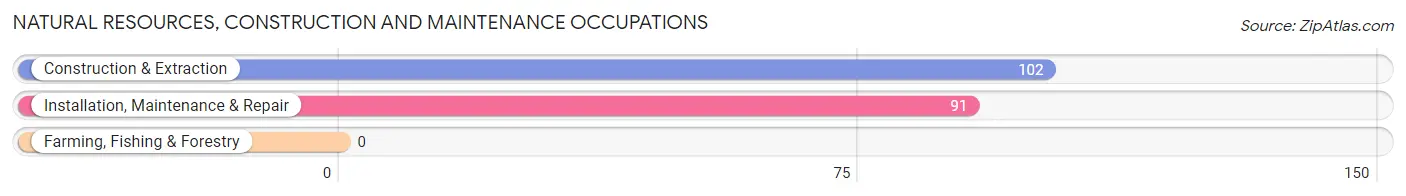
Natural Resources, Construction and Maintenance Occupations
The most common Natural Resources, Construction and Maintenance occupations in Chepachet are Construction & Extraction (102 | 10.0%), and Installation, Maintenance & Repair (91 | 8.9%).
Natural Resources, Construction and Maintenance Occupations by Sex
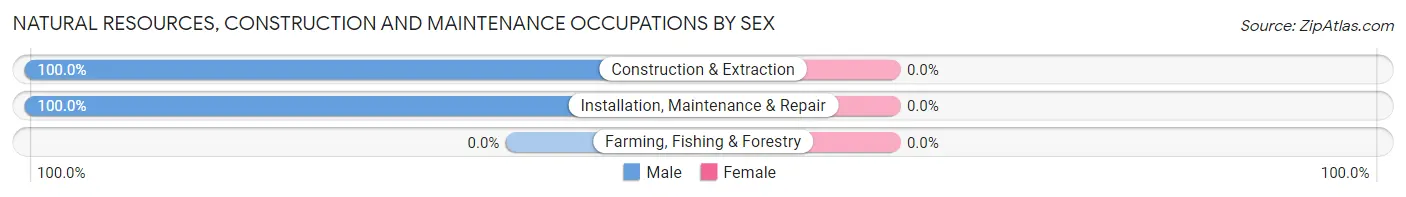
| Occupation | Male | Female |
| Farming, Fishing & Forestry | 0 (0.0%) | 0 (0.0%) |
| Construction & Extraction | 102 (100.0%) | 0 (0.0%) |
| Installation, Maintenance & Repair | 91 (100.0%) | 0 (0.0%) |
| Total (Category) | 193 (100.0%) | 0 (0.0%) |
| Total (Overall) | 588 (57.5%) | 434 (42.5%) |
Production, Transportation and Moving Occupations
The most common Production, Transportation and Moving occupations in Chepachet are Transportation (40 | 3.9%), Material Moving (10 | 1.0%), and Production (9 | 0.9%).
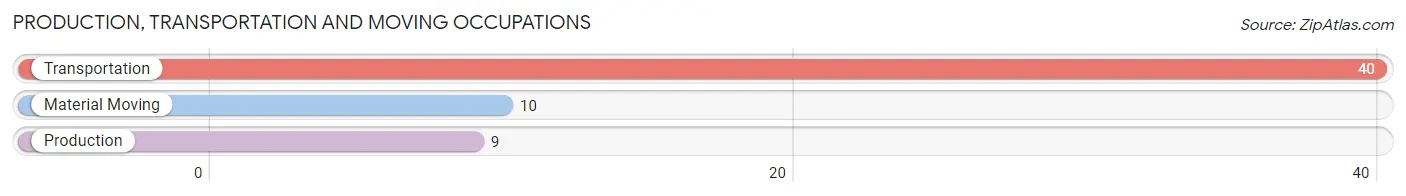
Production, Transportation and Moving Occupations by Sex
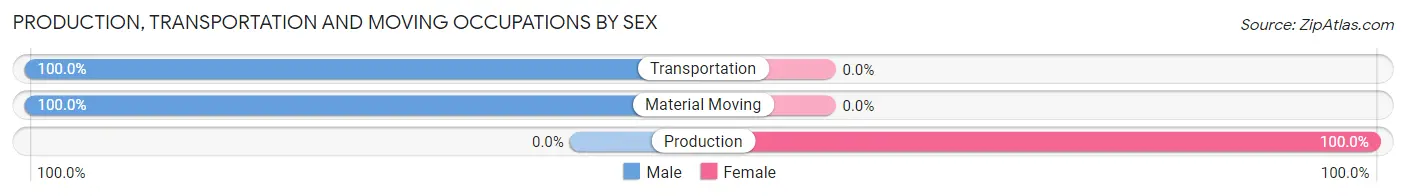
| Occupation | Male | Female |
| Production | 0 (0.0%) | 9 (100.0%) |
| Transportation | 40 (100.0%) | 0 (0.0%) |
| Material Moving | 10 (100.0%) | 0 (0.0%) |
| Total (Category) | 50 (84.8%) | 9 (15.2%) |
| Total (Overall) | 588 (57.5%) | 434 (42.5%) |
Employment Industries by Sex in Chepachet
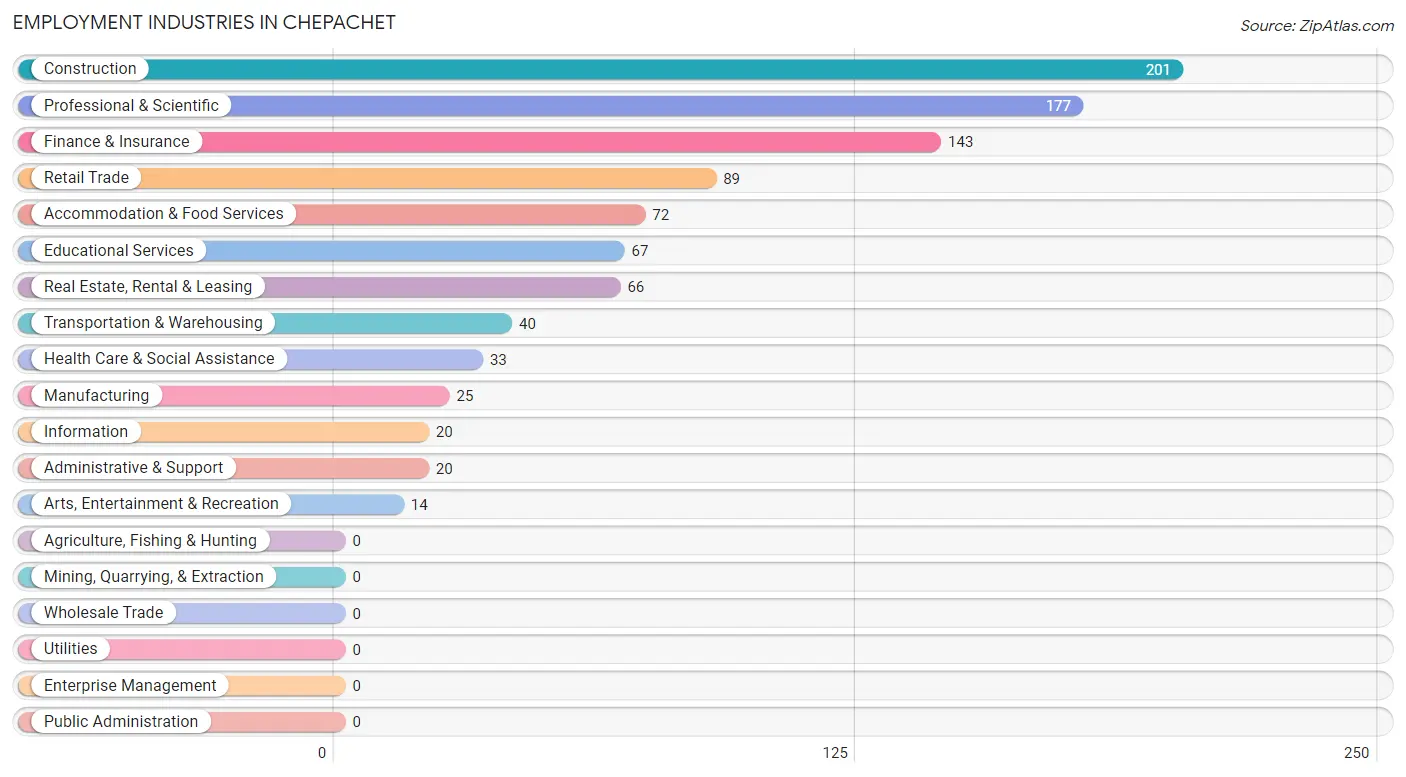
Employment Industries in Chepachet
The major employment industries in Chepachet include Construction (201 | 19.7%), Professional & Scientific (177 | 17.3%), Finance & Insurance (143 | 14.0%), Retail Trade (89 | 8.7%), and Accommodation & Food Services (72 | 7.0%).
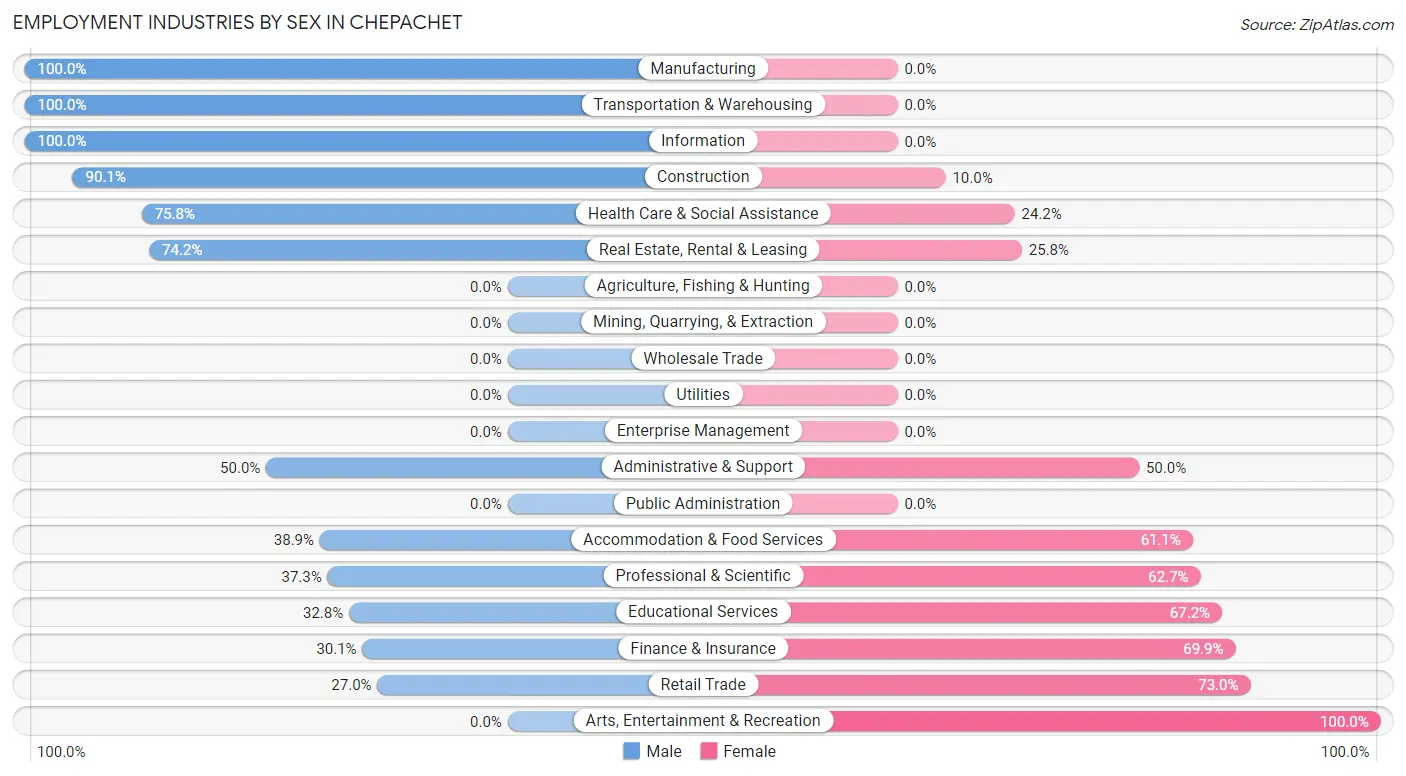
Employment Industries by Sex in Chepachet
The Chepachet industries that see more men than women are Manufacturing (100.0%), Transportation & Warehousing (100.0%), and Information (100.0%), whereas the industries that tend to have a higher number of women are Arts, Entertainment & Recreation (100.0%), Retail Trade (73.0%), and Finance & Insurance (69.9%).
| Industry | Male | Female |
| Agriculture, Fishing & Hunting | 0 (0.0%) | 0 (0.0%) |
| Mining, Quarrying, & Extraction | 0 (0.0%) | 0 (0.0%) |
| Construction | 181 (90.0%) | 20 (10.0%) |
| Manufacturing | 25 (100.0%) | 0 (0.0%) |
| Wholesale Trade | 0 (0.0%) | 0 (0.0%) |
| Retail Trade | 24 (27.0%) | 65 (73.0%) |
| Transportation & Warehousing | 40 (100.0%) | 0 (0.0%) |
| Utilities | 0 (0.0%) | 0 (0.0%) |
| Information | 20 (100.0%) | 0 (0.0%) |
| Finance & Insurance | 43 (30.1%) | 100 (69.9%) |
| Real Estate, Rental & Leasing | 49 (74.2%) | 17 (25.8%) |
| Professional & Scientific | 66 (37.3%) | 111 (62.7%) |
| Enterprise Management | 0 (0.0%) | 0 (0.0%) |
| Administrative & Support | 10 (50.0%) | 10 (50.0%) |
| Educational Services | 22 (32.8%) | 45 (67.2%) |
| Health Care & Social Assistance | 25 (75.8%) | 8 (24.2%) |
| Arts, Entertainment & Recreation | 0 (0.0%) | 14 (100.0%) |
| Accommodation & Food Services | 28 (38.9%) | 44 (61.1%) |
| Public Administration | 0 (0.0%) | 0 (0.0%) |
| Total | 588 (57.5%) | 434 (42.5%) |
Education in Chepachet
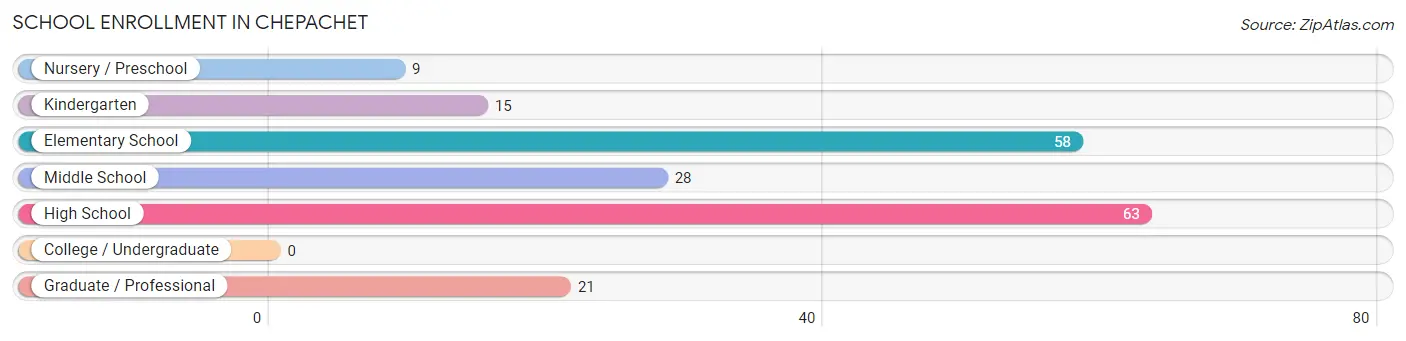
School Enrollment in Chepachet
The most common levels of schooling among the 194 students in Chepachet are high school (63 | 32.5%), elementary school (58 | 29.9%), and middle school (28 | 14.4%).
| School Level | # Students | % Students |
| Nursery / Preschool | 9 | 4.6% |
| Kindergarten | 15 | 7.7% |
| Elementary School | 58 | 29.9% |
| Middle School | 28 | 14.4% |
| High School | 63 | 32.5% |
| College / Undergraduate | 0 | 0.0% |
| Graduate / Professional | 21 | 10.8% |
| Total | 194 | 100.0% |
School Enrollment by Age by Funding Source in Chepachet
Out of a total of 194 students who are enrolled in schools in Chepachet, 9 (4.6%) attend a private institution, while the remaining 185 (95.4%) are enrolled in public schools. The age group of 5 to 9 year old has the highest likelihood of being enrolled in private schools, with 9 (14.3% in the age bracket) enrolled. Conversely, the age group of 10 to 14 year olds has the lowest likelihood of being enrolled in a private school, with 69 (100.0% in the age bracket) attending a public institution.
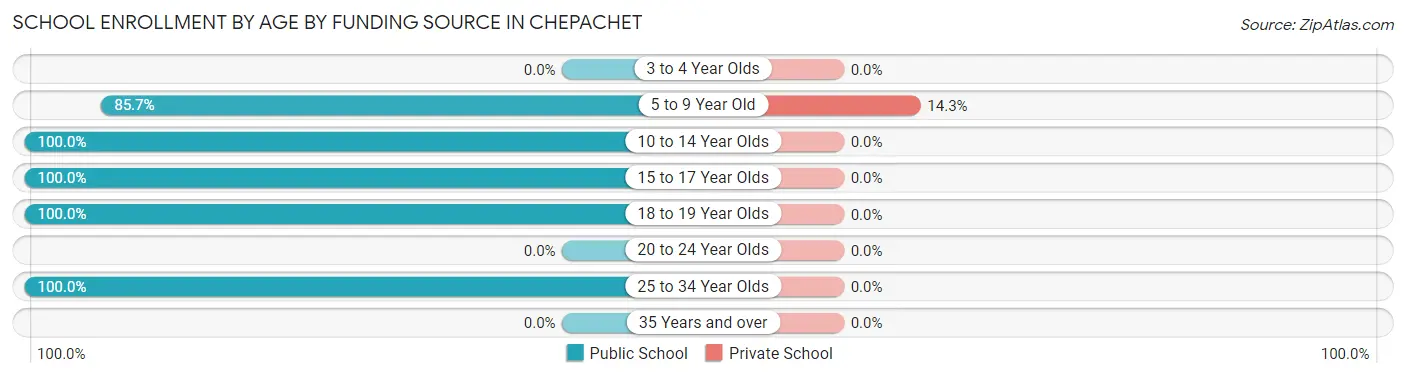
| Age Bracket | Public School | Private School |
| 3 to 4 Year Olds | 0 (0.0%) | 0 (0.0%) |
| 5 to 9 Year Old | 54 (85.7%) | 9 (14.3%) |
| 10 to 14 Year Olds | 69 (100.0%) | 0 (0.0%) |
| 15 to 17 Year Olds | 24 (100.0%) | 0 (0.0%) |
| 18 to 19 Year Olds | 17 (100.0%) | 0 (0.0%) |
| 20 to 24 Year Olds | 0 (0.0%) | 0 (0.0%) |
| 25 to 34 Year Olds | 21 (100.0%) | 0 (0.0%) |
| 35 Years and over | 0 (0.0%) | 0 (0.0%) |
| Total | 185 (95.4%) | 9 (4.6%) |
Educational Attainment by Field of Study in Chepachet
Social sciences (123 | 27.5%), business (100 | 22.3%), education (49 | 10.9%), liberal arts & history (37 | 8.3%), and communications (37 | 8.3%) are the most common fields of study among 448 individuals in Chepachet who have obtained a bachelor's degree or higher.
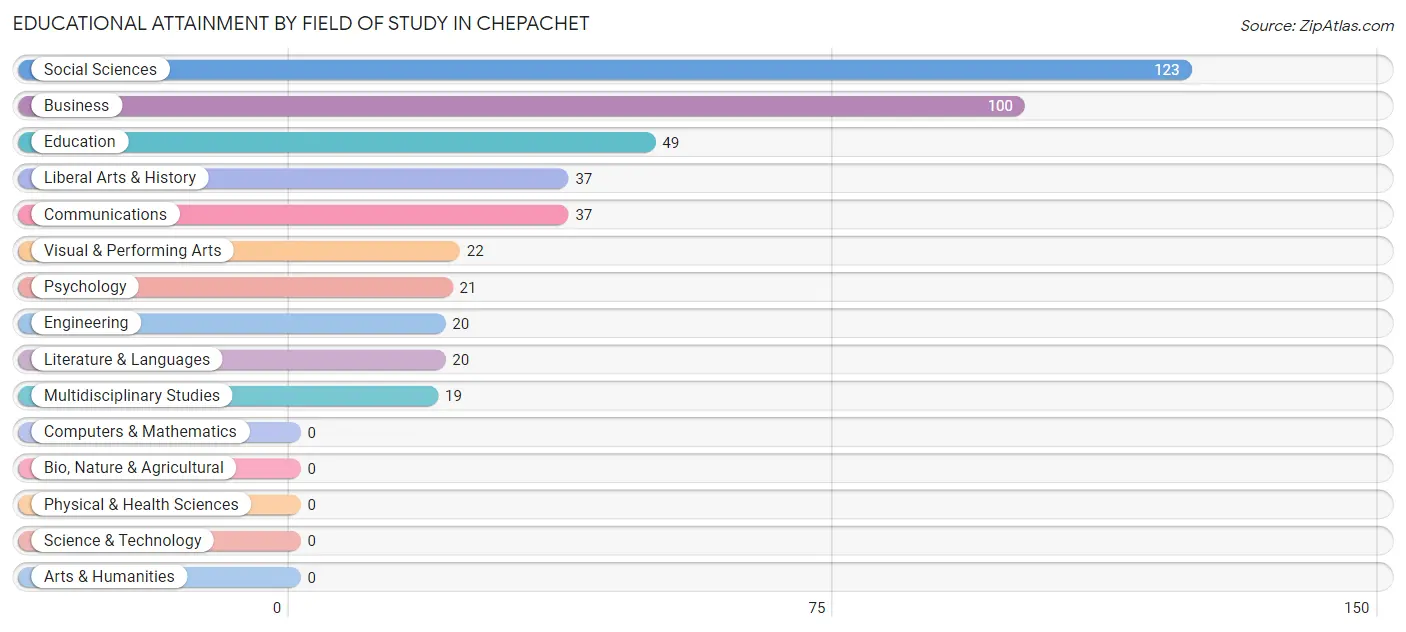
| Field of Study | # Graduates | % Graduates |
| Computers & Mathematics | 0 | 0.0% |
| Bio, Nature & Agricultural | 0 | 0.0% |
| Physical & Health Sciences | 0 | 0.0% |
| Psychology | 21 | 4.7% |
| Social Sciences | 123 | 27.5% |
| Engineering | 20 | 4.5% |
| Multidisciplinary Studies | 19 | 4.2% |
| Science & Technology | 0 | 0.0% |
| Business | 100 | 22.3% |
| Education | 49 | 10.9% |
| Literature & Languages | 20 | 4.5% |
| Liberal Arts & History | 37 | 8.3% |
| Visual & Performing Arts | 22 | 4.9% |
| Communications | 37 | 8.3% |
| Arts & Humanities | 0 | 0.0% |
| Total | 448 | 100.0% |
Transportation & Commute in Chepachet
Vehicle Availability by Sex in Chepachet
The most prevalent vehicle ownership categories in Chepachet are males with 2 vehicles (146, accounting for 24.8%) and females with 2 vehicles (134, making up 33.6%).
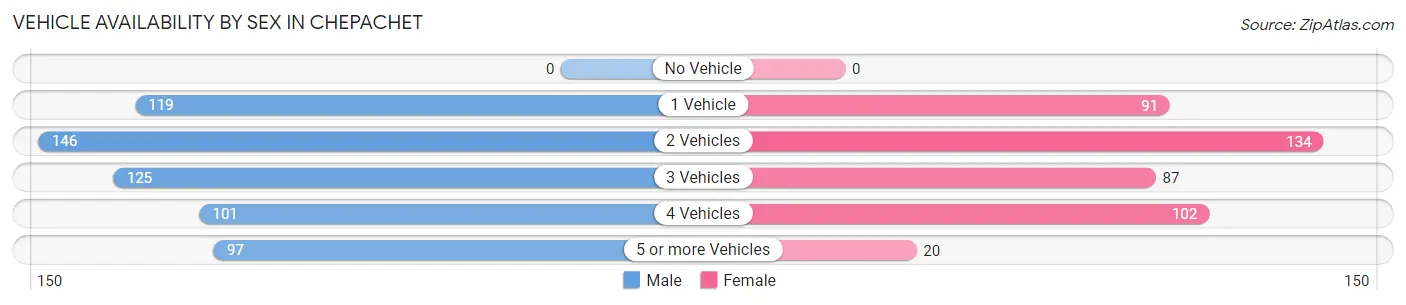
| Vehicles Available | Male | Female |
| No Vehicle | 0 (0.0%) | 0 (0.0%) |
| 1 Vehicle | 119 (20.2%) | 91 (21.0%) |
| 2 Vehicles | 146 (24.8%) | 134 (30.9%) |
| 3 Vehicles | 125 (21.3%) | 87 (20.1%) |
| 4 Vehicles | 101 (17.2%) | 102 (23.5%) |
| 5 or more Vehicles | 97 (16.5%) | 20 (4.6%) |
| Total | 588 (100.0%) | 434 (100.0%) |
Commute Time in Chepachet
The most frequently occuring commute durations in Chepachet are 30 to 34 minutes (200 commuters, 23.6%), 45 to 59 minutes (173 commuters, 20.4%), and 35 to 39 minutes (89 commuters, 10.5%).
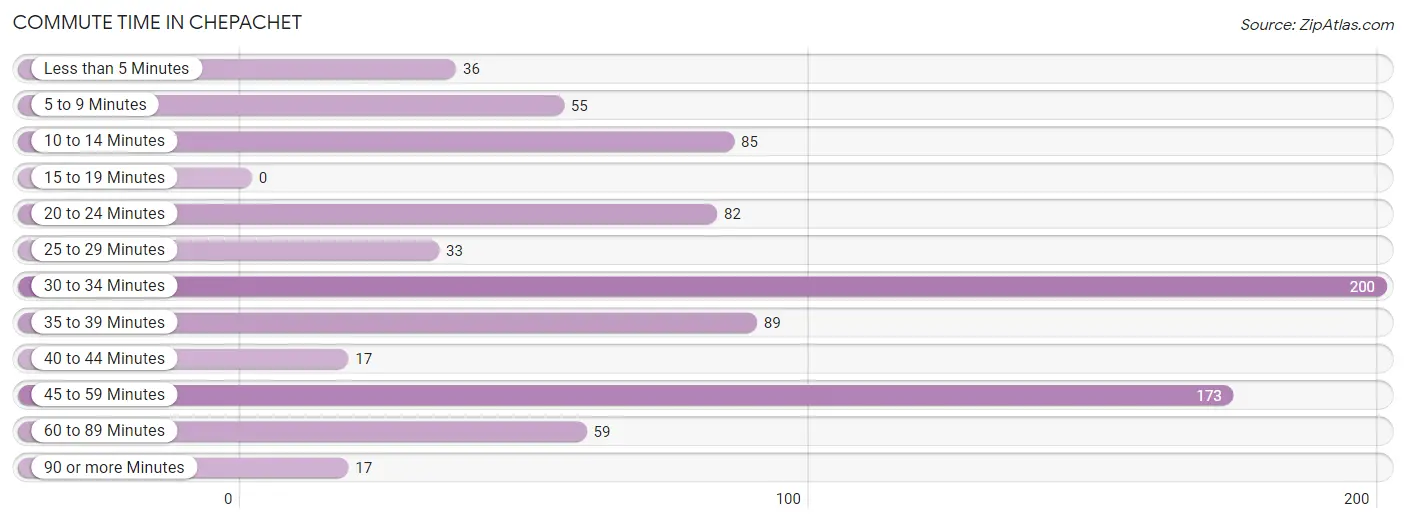
| Commute Time | # Commuters | % Commuters |
| Less than 5 Minutes | 36 | 4.3% |
| 5 to 9 Minutes | 55 | 6.5% |
| 10 to 14 Minutes | 85 | 10.1% |
| 15 to 19 Minutes | 0 | 0.0% |
| 20 to 24 Minutes | 82 | 9.7% |
| 25 to 29 Minutes | 33 | 3.9% |
| 30 to 34 Minutes | 200 | 23.6% |
| 35 to 39 Minutes | 89 | 10.5% |
| 40 to 44 Minutes | 17 | 2.0% |
| 45 to 59 Minutes | 173 | 20.4% |
| 60 to 89 Minutes | 59 | 7.0% |
| 90 or more Minutes | 17 | 2.0% |
Commute Time by Sex in Chepachet
The most common commute times in Chepachet are 30 to 34 minutes (157 commuters, 29.8%) for males and 45 to 59 minutes (138 commuters, 43.1%) for females.
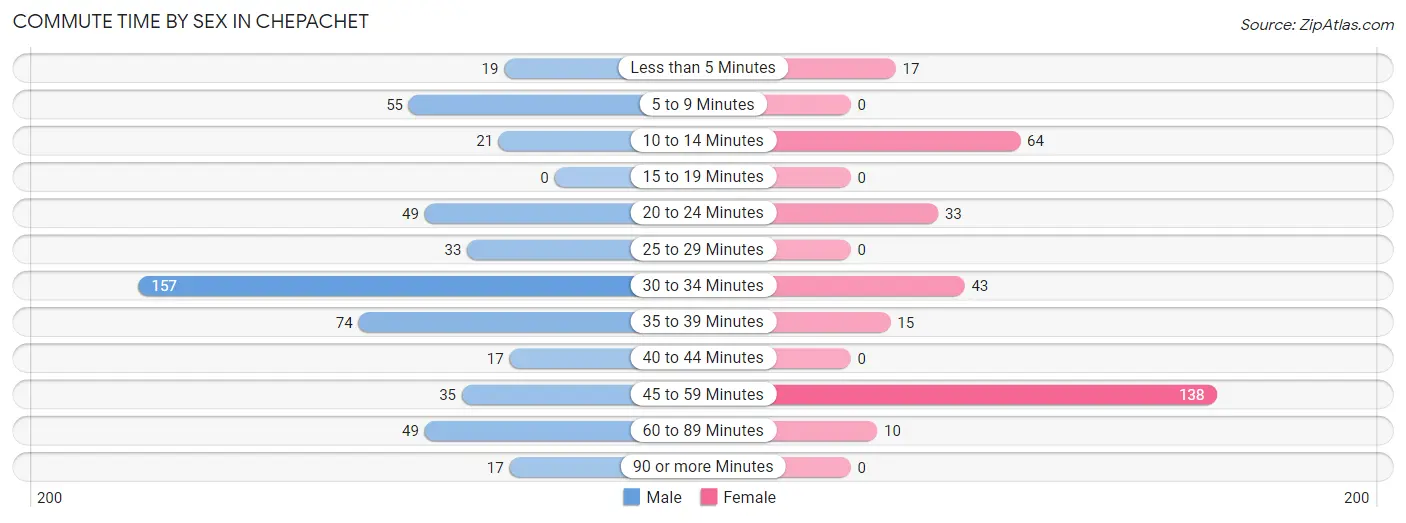
| Commute Time | Male | Female |
| Less than 5 Minutes | 19 (3.6%) | 17 (5.3%) |
| 5 to 9 Minutes | 55 (10.5%) | 0 (0.0%) |
| 10 to 14 Minutes | 21 (4.0%) | 64 (20.0%) |
| 15 to 19 Minutes | 0 (0.0%) | 0 (0.0%) |
| 20 to 24 Minutes | 49 (9.3%) | 33 (10.3%) |
| 25 to 29 Minutes | 33 (6.3%) | 0 (0.0%) |
| 30 to 34 Minutes | 157 (29.8%) | 43 (13.4%) |
| 35 to 39 Minutes | 74 (14.1%) | 15 (4.7%) |
| 40 to 44 Minutes | 17 (3.2%) | 0 (0.0%) |
| 45 to 59 Minutes | 35 (6.7%) | 138 (43.1%) |
| 60 to 89 Minutes | 49 (9.3%) | 10 (3.1%) |
| 90 or more Minutes | 17 (3.2%) | 0 (0.0%) |
Time of Departure to Work by Sex in Chepachet
The most frequent times of departure to work in Chepachet are 6:30 AM to 6:59 AM (136, 25.9%) for males and 8:00 AM to 8:29 AM (126, 39.4%) for females.
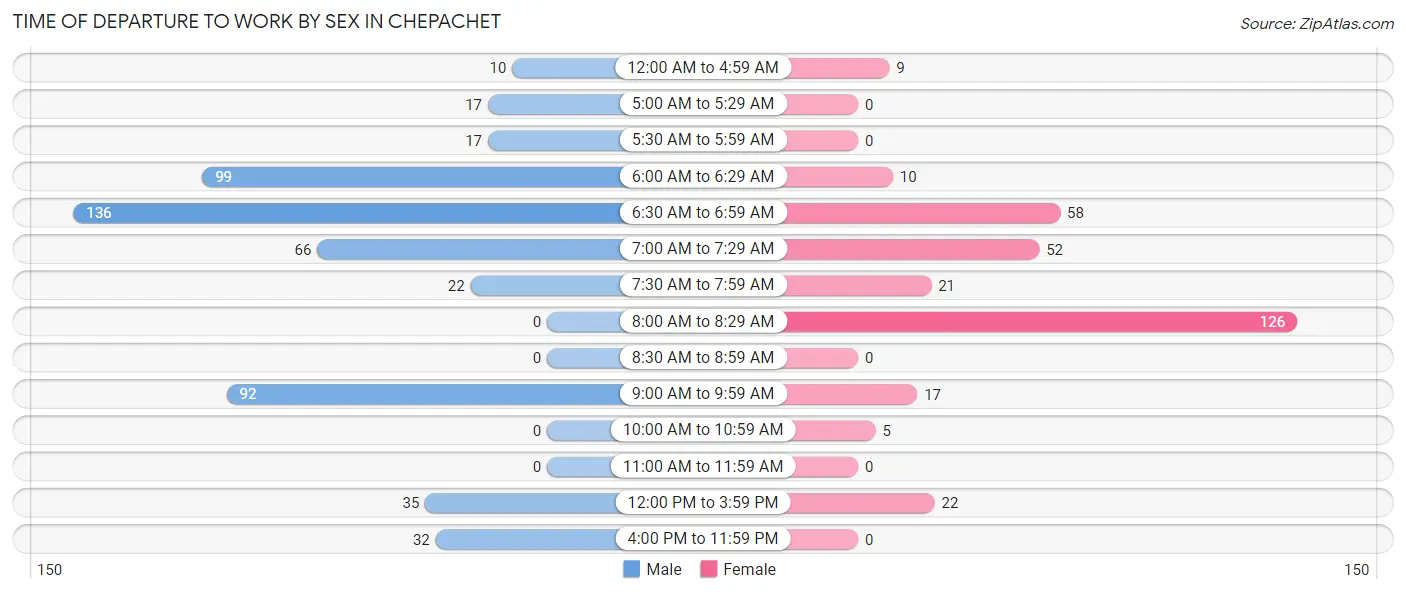
| Time of Departure | Male | Female |
| 12:00 AM to 4:59 AM | 10 (1.9%) | 9 (2.8%) |
| 5:00 AM to 5:29 AM | 17 (3.2%) | 0 (0.0%) |
| 5:30 AM to 5:59 AM | 17 (3.2%) | 0 (0.0%) |
| 6:00 AM to 6:29 AM | 99 (18.8%) | 10 (3.1%) |
| 6:30 AM to 6:59 AM | 136 (25.9%) | 58 (18.1%) |
| 7:00 AM to 7:29 AM | 66 (12.6%) | 52 (16.3%) |
| 7:30 AM to 7:59 AM | 22 (4.2%) | 21 (6.6%) |
| 8:00 AM to 8:29 AM | 0 (0.0%) | 126 (39.4%) |
| 8:30 AM to 8:59 AM | 0 (0.0%) | 0 (0.0%) |
| 9:00 AM to 9:59 AM | 92 (17.5%) | 17 (5.3%) |
| 10:00 AM to 10:59 AM | 0 (0.0%) | 5 (1.6%) |
| 11:00 AM to 11:59 AM | 0 (0.0%) | 0 (0.0%) |
| 12:00 PM to 3:59 PM | 35 (6.7%) | 22 (6.9%) |
| 4:00 PM to 11:59 PM | 32 (6.1%) | 0 (0.0%) |
| Total | 526 (100.0%) | 320 (100.0%) |
Housing Occupancy in Chepachet
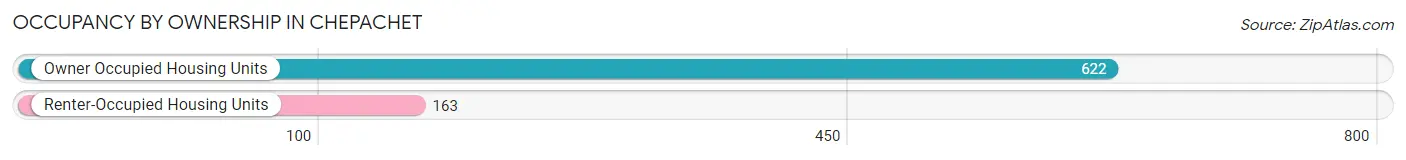
Occupancy by Ownership in Chepachet
Of the total 785 dwellings in Chepachet, owner-occupied units account for 622 (79.2%), while renter-occupied units make up 163 (20.8%).
| Occupancy | # Housing Units | % Housing Units |
| Owner Occupied Housing Units | 622 | 79.2% |
| Renter-Occupied Housing Units | 163 | 20.8% |
| Total Occupied Housing Units | 785 | 100.0% |
Occupancy by Household Size in Chepachet
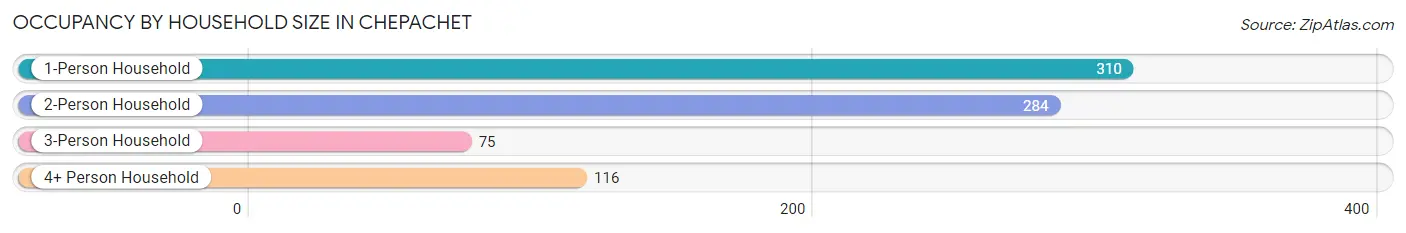
| Household Size | # Housing Units | % Housing Units |
| 1-Person Household | 310 | 39.5% |
| 2-Person Household | 284 | 36.2% |
| 3-Person Household | 75 | 9.6% |
| 4+ Person Household | 116 | 14.8% |
| Total Housing Units | 785 | 100.0% |
Occupancy by Ownership by Household Size in Chepachet
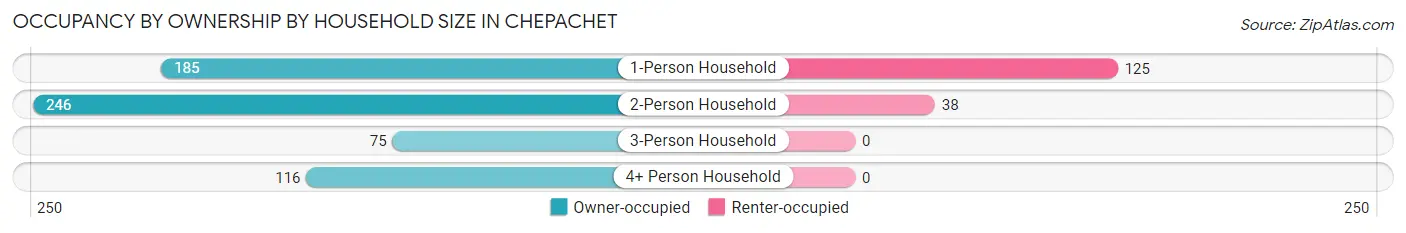
| Household Size | Owner-occupied | Renter-occupied |
| 1-Person Household | 185 (59.7%) | 125 (40.3%) |
| 2-Person Household | 246 (86.6%) | 38 (13.4%) |
| 3-Person Household | 75 (100.0%) | 0 (0.0%) |
| 4+ Person Household | 116 (100.0%) | 0 (0.0%) |
| Total Housing Units | 622 (79.2%) | 163 (20.8%) |
Occupancy by Educational Attainment in Chepachet
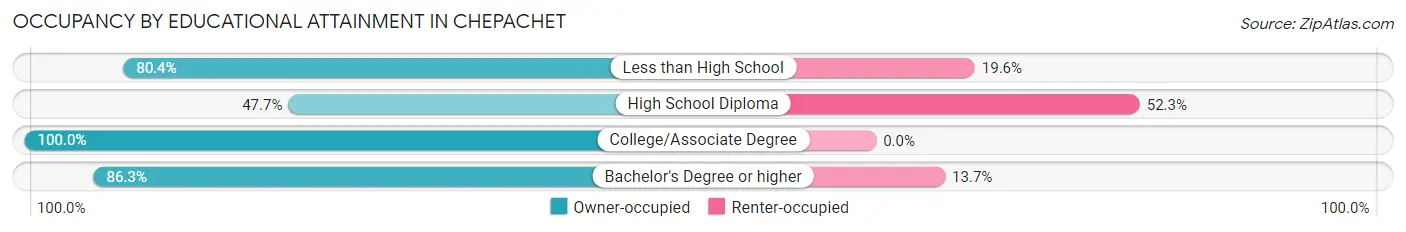
| Household Size | Owner-occupied | Renter-occupied |
| Less than High School | 37 (80.4%) | 9 (19.6%) |
| High School Diploma | 105 (47.7%) | 115 (52.3%) |
| College/Associate Degree | 234 (100.0%) | 0 (0.0%) |
| Bachelor's Degree or higher | 246 (86.3%) | 39 (13.7%) |
Occupancy by Age of Householder in Chepachet
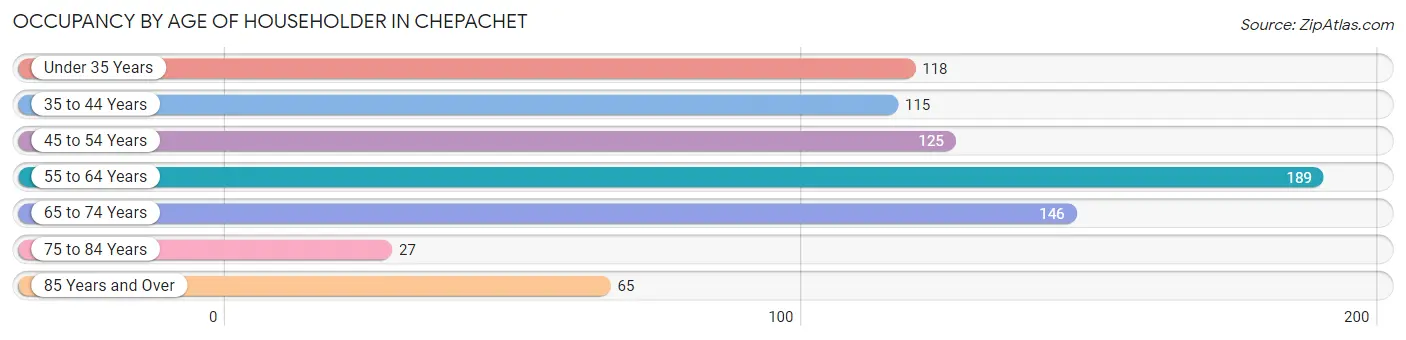
| Age Bracket | # Households | % Households |
| Under 35 Years | 118 | 15.0% |
| 35 to 44 Years | 115 | 14.6% |
| 45 to 54 Years | 125 | 15.9% |
| 55 to 64 Years | 189 | 24.1% |
| 65 to 74 Years | 146 | 18.6% |
| 75 to 84 Years | 27 | 3.4% |
| 85 Years and Over | 65 | 8.3% |
| Total | 785 | 100.0% |
Housing Finances in Chepachet
Median Income by Occupancy in Chepachet
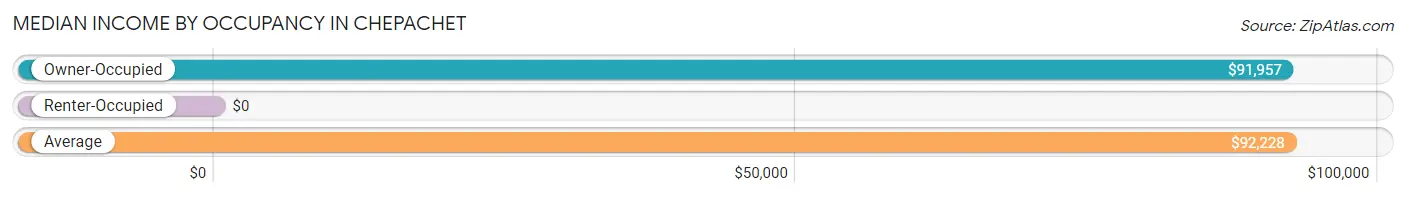
| Occupancy Type | # Households | Median Income |
| Owner-Occupied | 622 (79.2%) | $91,957 |
| Renter-Occupied | 163 (20.8%) | $0 |
| Average | 785 (100.0%) | $92,228 |
Occupancy by Householder Income Bracket in Chepachet
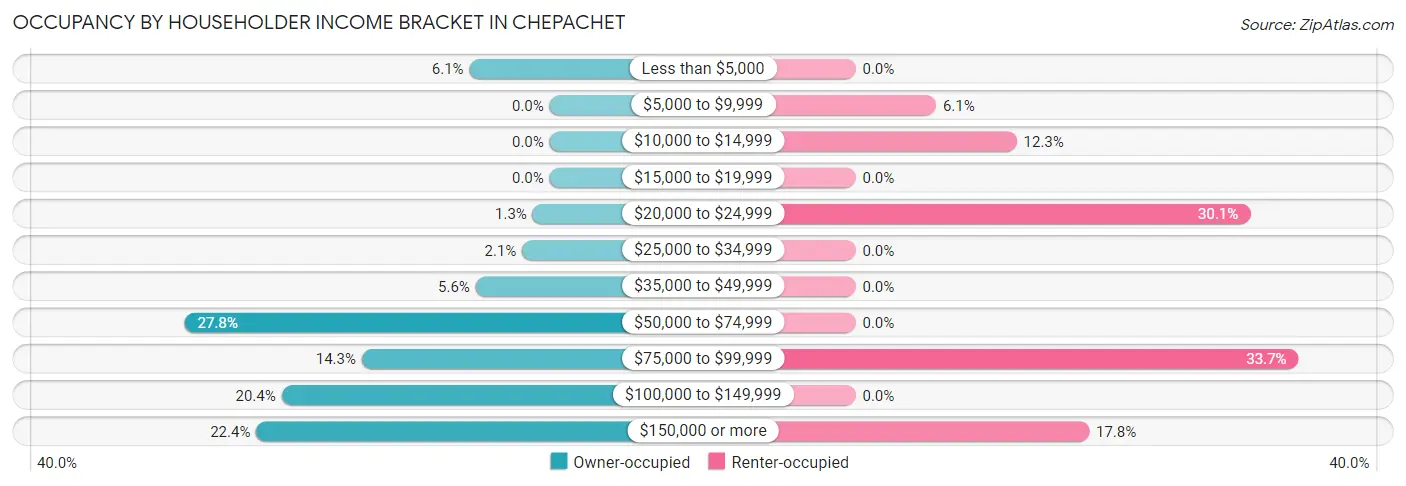
| Income Bracket | Owner-occupied | Renter-occupied |
| Less than $5,000 | 38 (6.1%) | 0 (0.0%) |
| $5,000 to $9,999 | 0 (0.0%) | 10 (6.1%) |
| $10,000 to $14,999 | 0 (0.0%) | 20 (12.3%) |
| $15,000 to $19,999 | 0 (0.0%) | 0 (0.0%) |
| $20,000 to $24,999 | 8 (1.3%) | 49 (30.1%) |
| $25,000 to $34,999 | 13 (2.1%) | 0 (0.0%) |
| $35,000 to $49,999 | 35 (5.6%) | 0 (0.0%) |
| $50,000 to $74,999 | 173 (27.8%) | 0 (0.0%) |
| $75,000 to $99,999 | 89 (14.3%) | 55 (33.7%) |
| $100,000 to $149,999 | 127 (20.4%) | 0 (0.0%) |
| $150,000 or more | 139 (22.4%) | 29 (17.8%) |
| Total | 622 (100.0%) | 163 (100.0%) |
Monthly Housing Cost Tiers in Chepachet
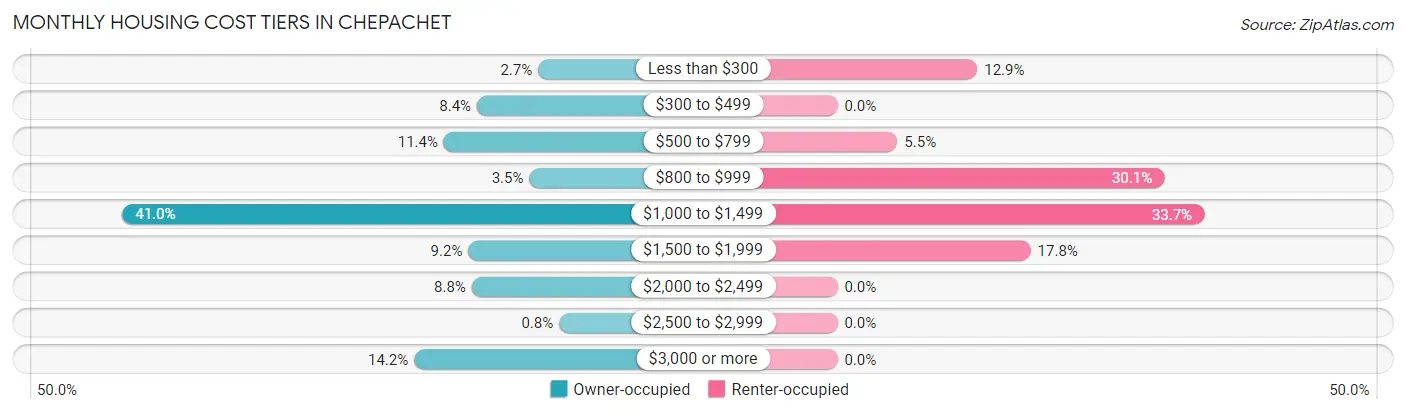
| Monthly Cost | Owner-occupied | Renter-occupied |
| Less than $300 | 17 (2.7%) | 21 (12.9%) |
| $300 to $499 | 52 (8.4%) | 0 (0.0%) |
| $500 to $799 | 71 (11.4%) | 9 (5.5%) |
| $800 to $999 | 22 (3.5%) | 49 (30.1%) |
| $1,000 to $1,499 | 255 (41.0%) | 55 (33.7%) |
| $1,500 to $1,999 | 57 (9.2%) | 29 (17.8%) |
| $2,000 to $2,499 | 55 (8.8%) | 0 (0.0%) |
| $2,500 to $2,999 | 5 (0.8%) | 0 (0.0%) |
| $3,000 or more | 88 (14.1%) | 0 (0.0%) |
| Total | 622 (100.0%) | 163 (100.0%) |
Physical Housing Characteristics in Chepachet
Housing Structures in Chepachet
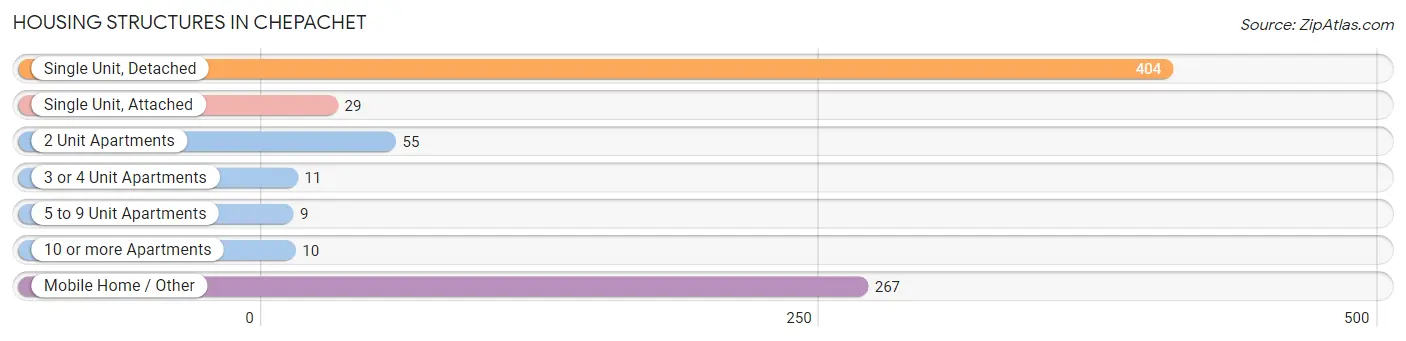
| Structure Type | # Housing Units | % Housing Units |
| Single Unit, Detached | 404 | 51.5% |
| Single Unit, Attached | 29 | 3.7% |
| 2 Unit Apartments | 55 | 7.0% |
| 3 or 4 Unit Apartments | 11 | 1.4% |
| 5 to 9 Unit Apartments | 9 | 1.1% |
| 10 or more Apartments | 10 | 1.3% |
| Mobile Home / Other | 267 | 34.0% |
| Total | 785 | 100.0% |
Housing Structures by Occupancy in Chepachet
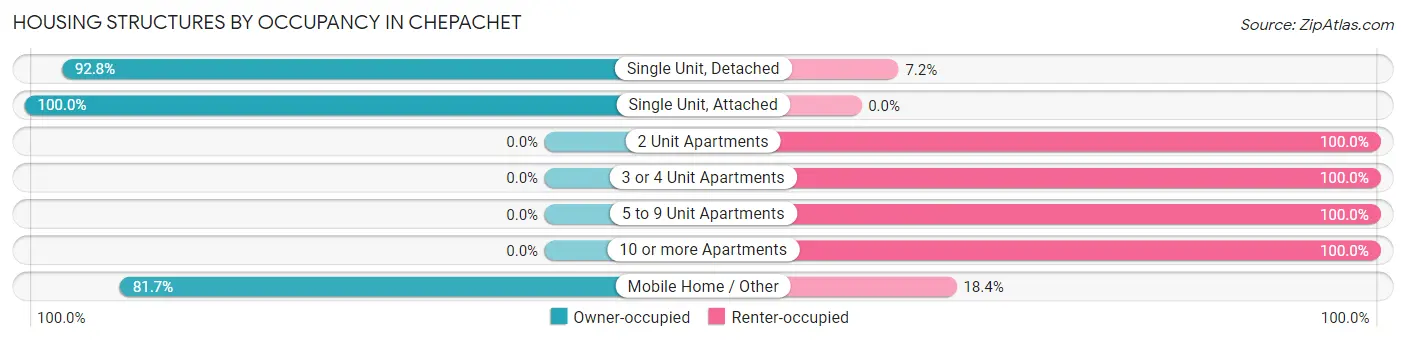
| Structure Type | Owner-occupied | Renter-occupied |
| Single Unit, Detached | 375 (92.8%) | 29 (7.2%) |
| Single Unit, Attached | 29 (100.0%) | 0 (0.0%) |
| 2 Unit Apartments | 0 (0.0%) | 55 (100.0%) |
| 3 or 4 Unit Apartments | 0 (0.0%) | 11 (100.0%) |
| 5 to 9 Unit Apartments | 0 (0.0%) | 9 (100.0%) |
| 10 or more Apartments | 0 (0.0%) | 10 (100.0%) |
| Mobile Home / Other | 218 (81.7%) | 49 (18.3%) |
| Total | 622 (79.2%) | 163 (20.8%) |
Housing Structures by Number of Rooms in Chepachet
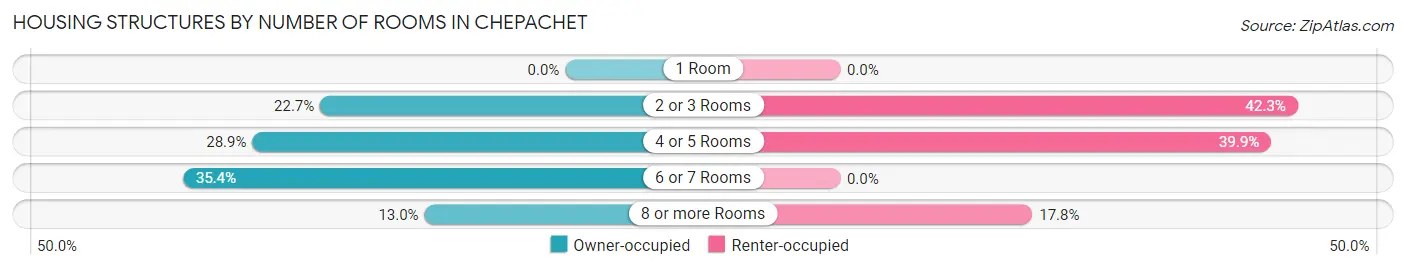
| Number of Rooms | Owner-occupied | Renter-occupied |
| 1 Room | 0 (0.0%) | 0 (0.0%) |
| 2 or 3 Rooms | 141 (22.7%) | 69 (42.3%) |
| 4 or 5 Rooms | 180 (28.9%) | 65 (39.9%) |
| 6 or 7 Rooms | 220 (35.4%) | 0 (0.0%) |
| 8 or more Rooms | 81 (13.0%) | 29 (17.8%) |
| Total | 622 (100.0%) | 163 (100.0%) |
Housing Structure by Heating Type in Chepachet
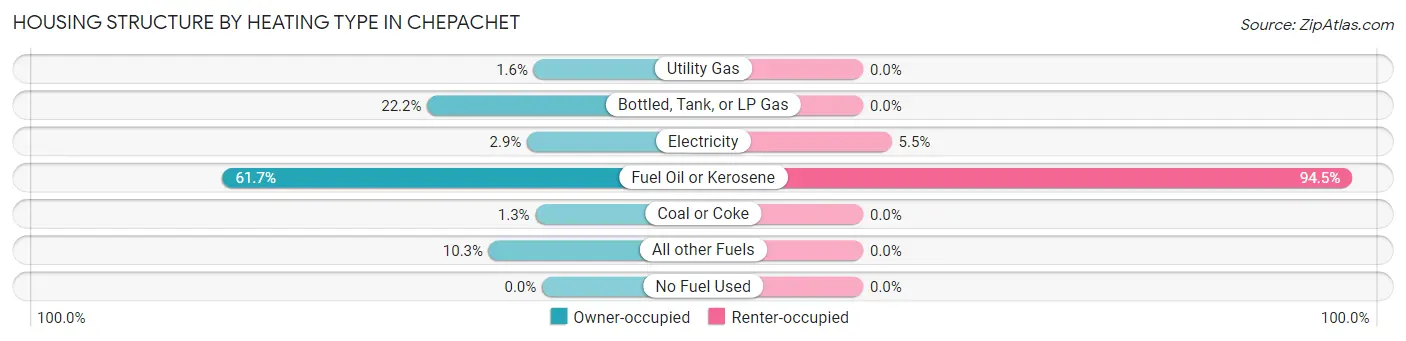
| Heating Type | Owner-occupied | Renter-occupied |
| Utility Gas | 10 (1.6%) | 0 (0.0%) |
| Bottled, Tank, or LP Gas | 138 (22.2%) | 0 (0.0%) |
| Electricity | 18 (2.9%) | 9 (5.5%) |
| Fuel Oil or Kerosene | 384 (61.7%) | 154 (94.5%) |
| Coal or Coke | 8 (1.3%) | 0 (0.0%) |
| All other Fuels | 64 (10.3%) | 0 (0.0%) |
| No Fuel Used | 0 (0.0%) | 0 (0.0%) |
| Total | 622 (100.0%) | 163 (100.0%) |
Household Vehicle Usage in Chepachet
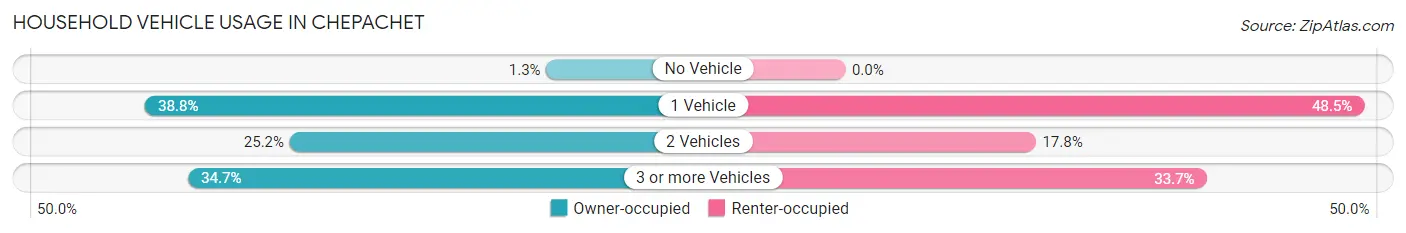
| Vehicles per Household | Owner-occupied | Renter-occupied |
| No Vehicle | 8 (1.3%) | 0 (0.0%) |
| 1 Vehicle | 241 (38.8%) | 79 (48.5%) |
| 2 Vehicles | 157 (25.2%) | 29 (17.8%) |
| 3 or more Vehicles | 216 (34.7%) | 55 (33.7%) |
| Total | 622 (100.0%) | 163 (100.0%) |
Real Estate & Mortgages in Chepachet
Real Estate and Mortgage Overview in Chepachet
| Characteristic | Without Mortgage | With Mortgage |
| Housing Units | 277 | 345 |
| Median Property Value | $125,700 | $356,000 |
| Median Household Income | $71,683 | $98 |
| Monthly Housing Costs | $950 | $88 |
| Real Estate Taxes | - | - |
Property Value by Mortgage Status in Chepachet
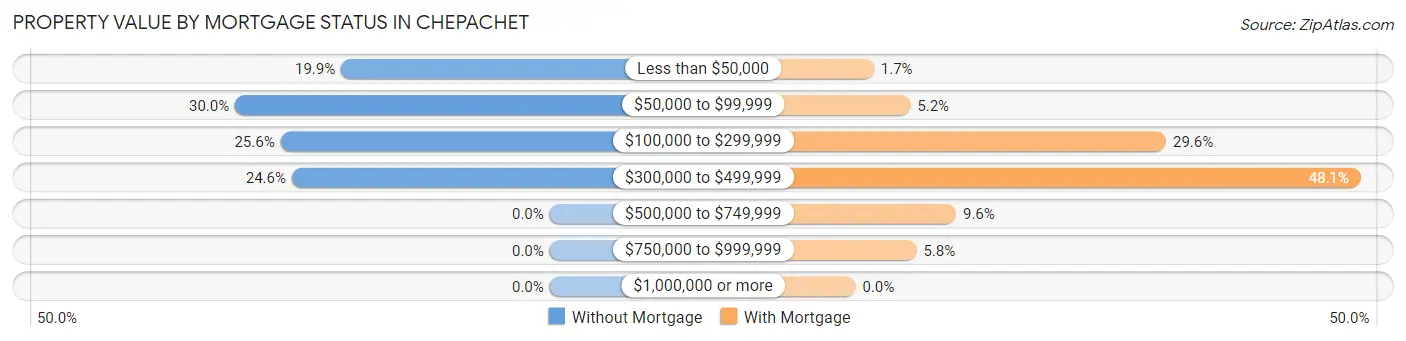
| Property Value | Without Mortgage | With Mortgage |
| Less than $50,000 | 55 (19.9%) | 6 (1.7%) |
| $50,000 to $99,999 | 83 (30.0%) | 18 (5.2%) |
| $100,000 to $299,999 | 71 (25.6%) | 102 (29.6%) |
| $300,000 to $499,999 | 68 (24.5%) | 166 (48.1%) |
| $500,000 to $749,999 | 0 (0.0%) | 33 (9.6%) |
| $750,000 to $999,999 | 0 (0.0%) | 20 (5.8%) |
| $1,000,000 or more | 0 (0.0%) | 0 (0.0%) |
| Total | 277 (100.0%) | 345 (100.0%) |
Household Income by Mortgage Status in Chepachet
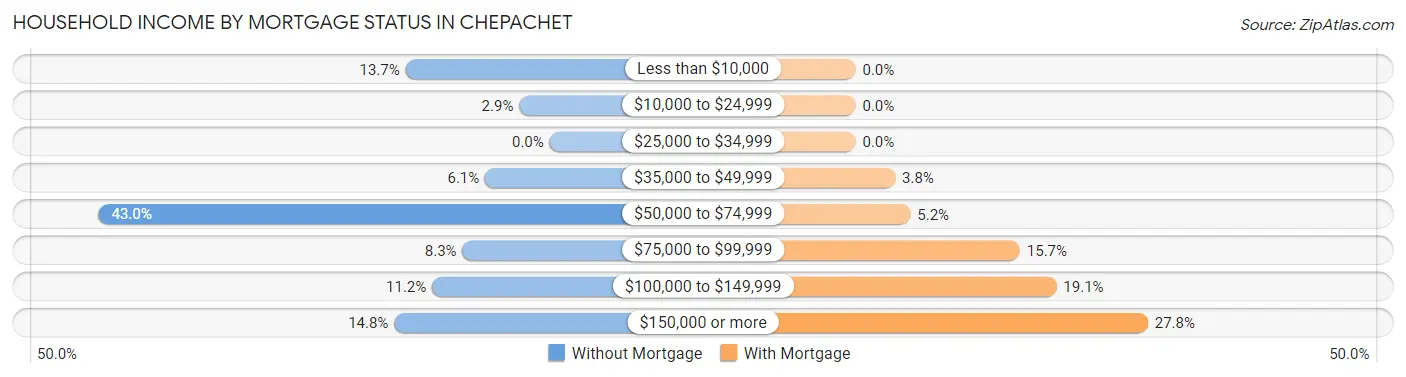
| Household Income | Without Mortgage | With Mortgage |
| Less than $10,000 | 38 (13.7%) | 0 (0.0%) |
| $10,000 to $24,999 | 8 (2.9%) | 0 (0.0%) |
| $25,000 to $34,999 | 0 (0.0%) | 0 (0.0%) |
| $35,000 to $49,999 | 17 (6.1%) | 13 (3.8%) |
| $50,000 to $74,999 | 119 (43.0%) | 18 (5.2%) |
| $75,000 to $99,999 | 23 (8.3%) | 54 (15.7%) |
| $100,000 to $149,999 | 31 (11.2%) | 66 (19.1%) |
| $150,000 or more | 41 (14.8%) | 96 (27.8%) |
| Total | 277 (100.0%) | 345 (100.0%) |
Property Value to Household Income Ratio in Chepachet
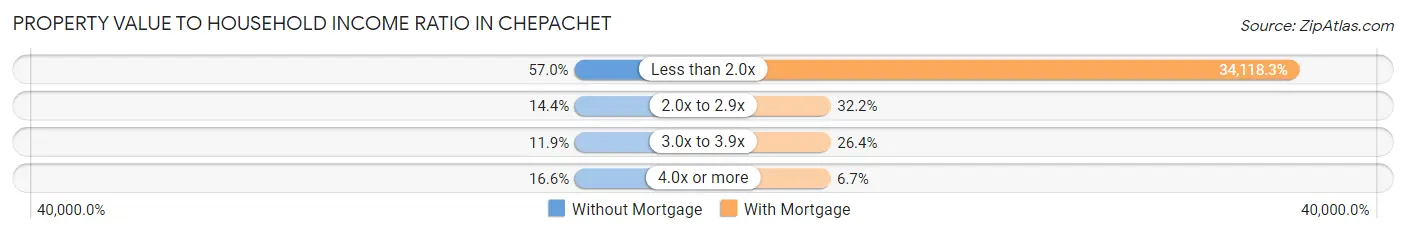
| Value-to-Income Ratio | Without Mortgage | With Mortgage |
| Less than 2.0x | 158 (57.0%) | 117,708 (34,118.3%) |
| 2.0x to 2.9x | 40 (14.4%) | 111 (32.2%) |
| 3.0x to 3.9x | 33 (11.9%) | 91 (26.4%) |
| 4.0x or more | 46 (16.6%) | 23 (6.7%) |
| Total | 277 (100.0%) | 345 (100.0%) |
Real Estate Taxes by Mortgage Status in Chepachet
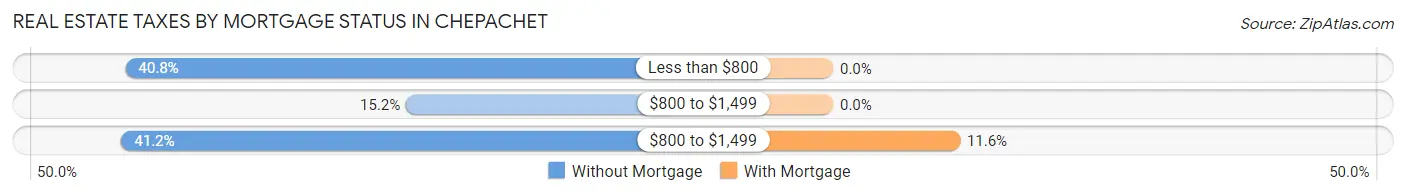
| Property Taxes | Without Mortgage | With Mortgage |
| Less than $800 | 113 (40.8%) | 0 (0.0%) |
| $800 to $1,499 | 42 (15.2%) | 0 (0.0%) |
| $800 to $1,499 | 114 (41.2%) | 40 (11.6%) |
| Total | 277 (100.0%) | 345 (100.0%) |
Health & Disability in Chepachet
Health Insurance Coverage by Age in Chepachet
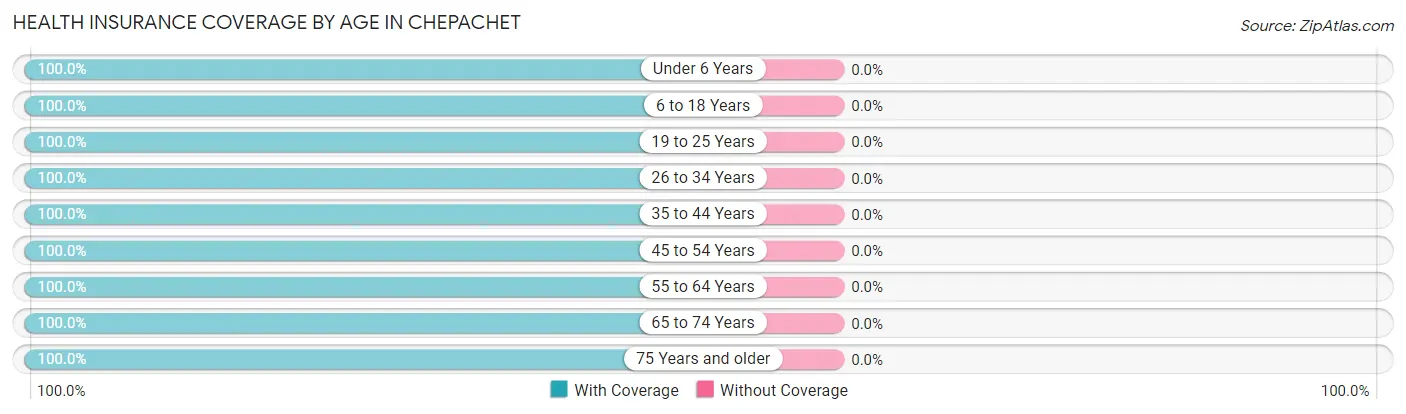
| Age Bracket | With Coverage | Without Coverage |
| Under 6 Years | 24 (100.0%) | 0 (0.0%) |
| 6 to 18 Years | 411 (100.0%) | 0 (0.0%) |
| 19 to 25 Years | 43 (100.0%) | 0 (0.0%) |
| 26 to 34 Years | 176 (100.0%) | 0 (0.0%) |
| 35 to 44 Years | 253 (100.0%) | 0 (0.0%) |
| 45 to 54 Years | 182 (100.0%) | 0 (0.0%) |
| 55 to 64 Years | 341 (100.0%) | 0 (0.0%) |
| 65 to 74 Years | 181 (100.0%) | 0 (0.0%) |
| 75 Years and older | 144 (100.0%) | 0 (0.0%) |
| Total | 1,755 (100.0%) | 0 (0.0%) |
Health Insurance Coverage by Citizenship Status in Chepachet
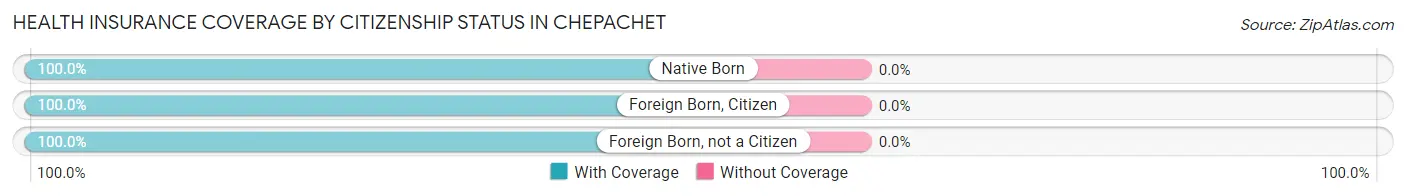
| Citizenship Status | With Coverage | Without Coverage |
| Native Born | 24 (100.0%) | 0 (0.0%) |
| Foreign Born, Citizen | 411 (100.0%) | 0 (0.0%) |
| Foreign Born, not a Citizen | 43 (100.0%) | 0 (0.0%) |
Health Insurance Coverage by Household Income in Chepachet
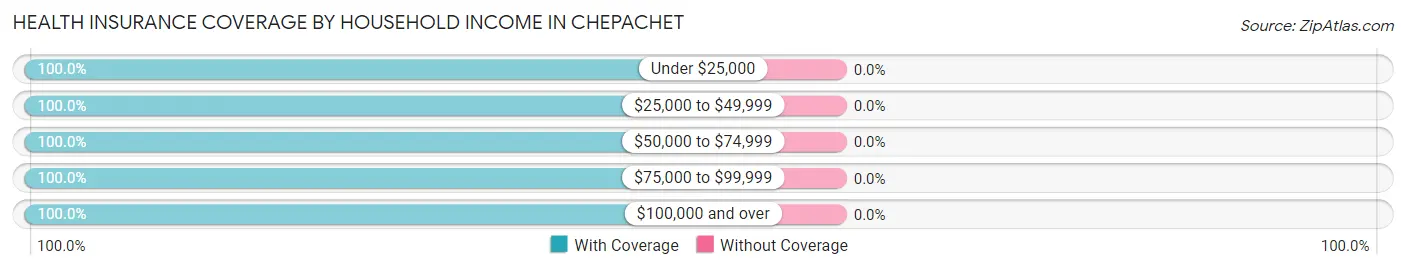
| Household Income | With Coverage | Without Coverage |
| Under $25,000 | 134 (100.0%) | 0 (0.0%) |
| $25,000 to $49,999 | 147 (100.0%) | 0 (0.0%) |
| $50,000 to $74,999 | 221 (100.0%) | 0 (0.0%) |
| $75,000 to $99,999 | 258 (100.0%) | 0 (0.0%) |
| $100,000 and over | 983 (100.0%) | 0 (0.0%) |
Public vs Private Health Insurance Coverage by Age in Chepachet
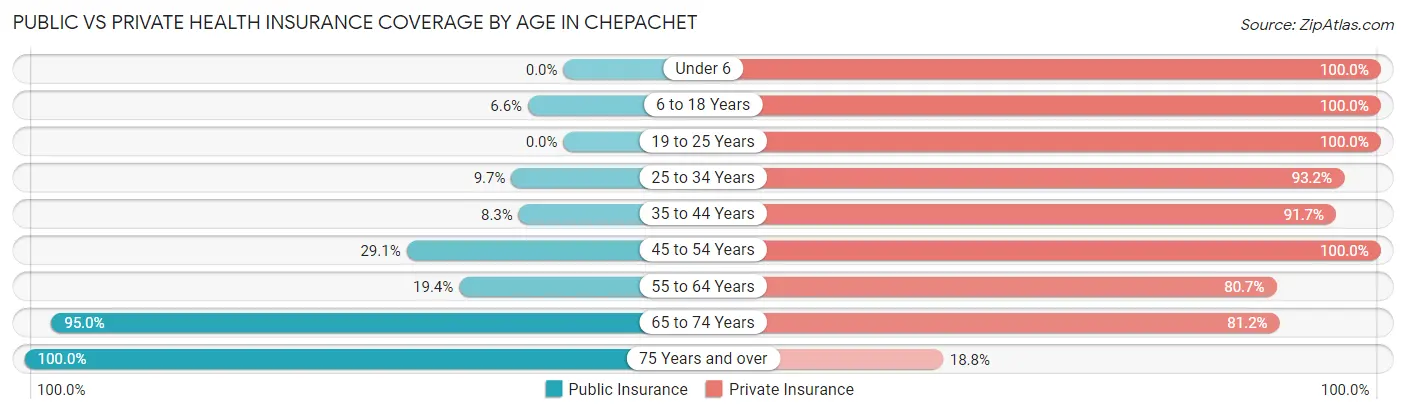
| Age Bracket | Public Insurance | Private Insurance |
| Under 6 | 0 (0.0%) | 24 (100.0%) |
| 6 to 18 Years | 27 (6.6%) | 411 (100.0%) |
| 19 to 25 Years | 0 (0.0%) | 43 (100.0%) |
| 25 to 34 Years | 17 (9.7%) | 164 (93.2%) |
| 35 to 44 Years | 21 (8.3%) | 232 (91.7%) |
| 45 to 54 Years | 53 (29.1%) | 182 (100.0%) |
| 55 to 64 Years | 66 (19.4%) | 275 (80.6%) |
| 65 to 74 Years | 172 (95.0%) | 147 (81.2%) |
| 75 Years and over | 144 (100.0%) | 27 (18.8%) |
| Total | 500 (28.5%) | 1,505 (85.8%) |
Disability Status by Sex by Age in Chepachet
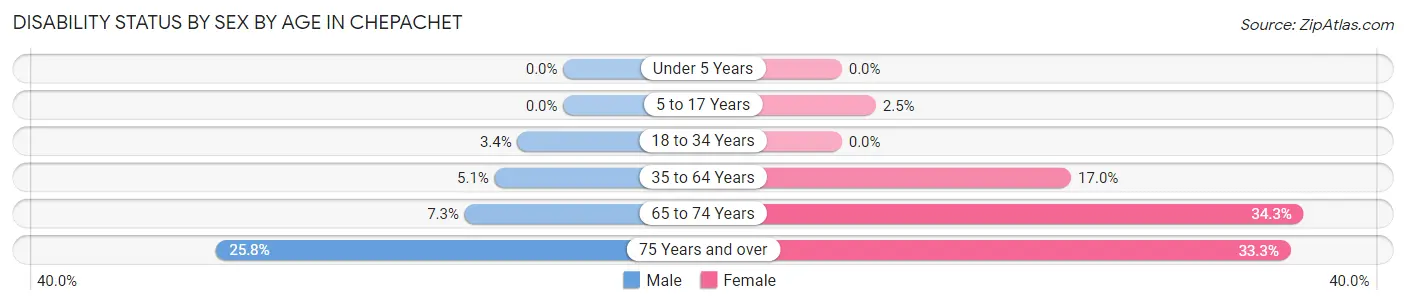
| Age Bracket | Male | Female |
| Under 5 Years | 0 (0.0%) | 0 (0.0%) |
| 5 to 17 Years | 0 (0.0%) | 5 (2.5%) |
| 18 to 34 Years | 5 (3.4%) | 0 (0.0%) |
| 35 to 64 Years | 21 (5.1%) | 62 (17.0%) |
| 65 to 74 Years | 3 (7.3%) | 48 (34.3%) |
| 75 Years and over | 17 (25.8%) | 26 (33.3%) |
Disability Class by Sex by Age in Chepachet
Disability Class: Hearing Difficulty
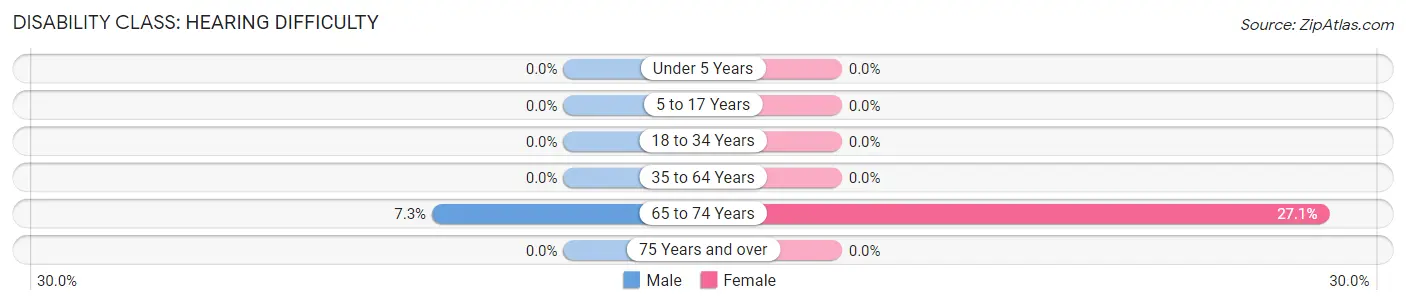
| Age Bracket | Male | Female |
| Under 5 Years | 0 (0.0%) | 0 (0.0%) |
| 5 to 17 Years | 0 (0.0%) | 0 (0.0%) |
| 18 to 34 Years | 0 (0.0%) | 0 (0.0%) |
| 35 to 64 Years | 0 (0.0%) | 0 (0.0%) |
| 65 to 74 Years | 3 (7.3%) | 38 (27.1%) |
| 75 Years and over | 0 (0.0%) | 0 (0.0%) |
Disability Class: Vision Difficulty
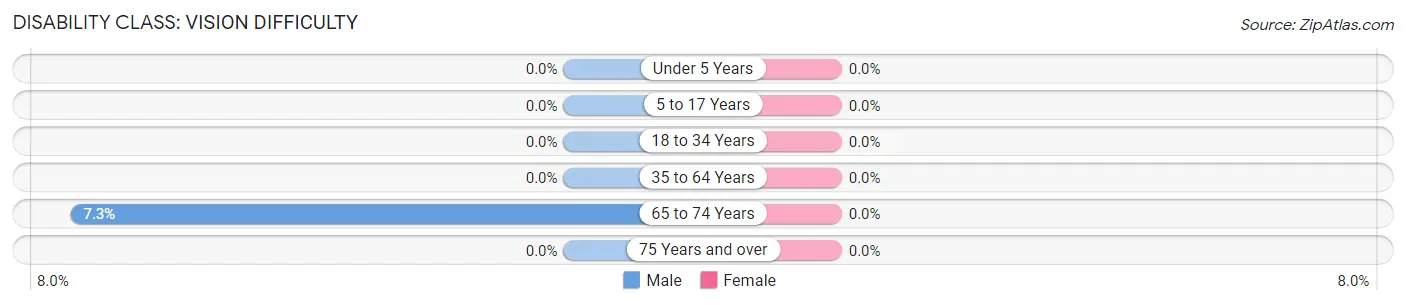
| Age Bracket | Male | Female |
| Under 5 Years | 0 (0.0%) | 0 (0.0%) |
| 5 to 17 Years | 0 (0.0%) | 0 (0.0%) |
| 18 to 34 Years | 0 (0.0%) | 0 (0.0%) |
| 35 to 64 Years | 0 (0.0%) | 0 (0.0%) |
| 65 to 74 Years | 3 (7.3%) | 0 (0.0%) |
| 75 Years and over | 0 (0.0%) | 0 (0.0%) |
Disability Class: Cognitive Difficulty
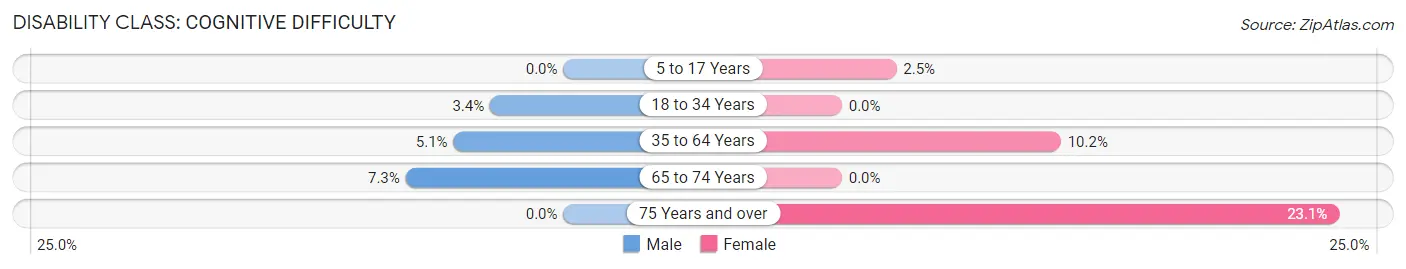
| Age Bracket | Male | Female |
| 5 to 17 Years | 0 (0.0%) | 5 (2.5%) |
| 18 to 34 Years | 5 (3.4%) | 0 (0.0%) |
| 35 to 64 Years | 21 (5.1%) | 37 (10.2%) |
| 65 to 74 Years | 3 (7.3%) | 0 (0.0%) |
| 75 Years and over | 0 (0.0%) | 18 (23.1%) |
Disability Class: Ambulatory Difficulty
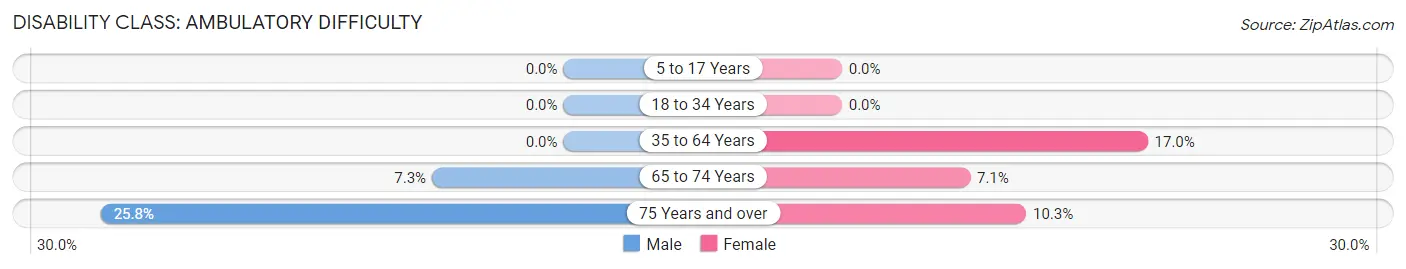
| Age Bracket | Male | Female |
| 5 to 17 Years | 0 (0.0%) | 0 (0.0%) |
| 18 to 34 Years | 0 (0.0%) | 0 (0.0%) |
| 35 to 64 Years | 0 (0.0%) | 62 (17.0%) |
| 65 to 74 Years | 3 (7.3%) | 10 (7.1%) |
| 75 Years and over | 17 (25.8%) | 8 (10.3%) |
Disability Class: Self-Care Difficulty
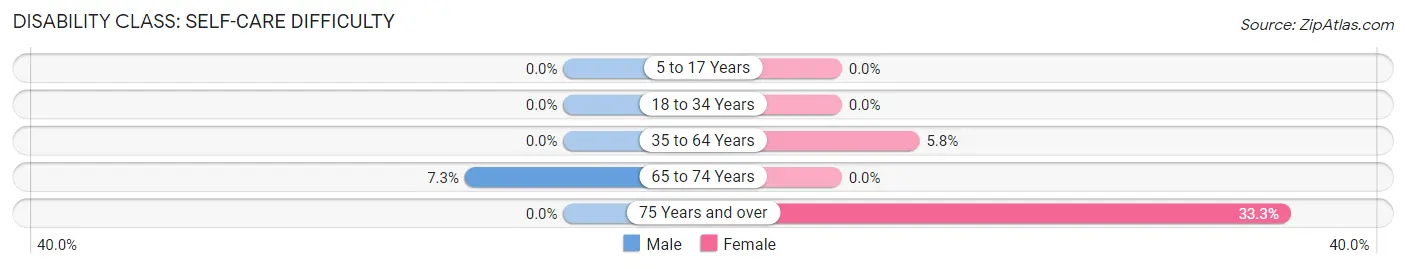
| Age Bracket | Male | Female |
| 5 to 17 Years | 0 (0.0%) | 0 (0.0%) |
| 18 to 34 Years | 0 (0.0%) | 0 (0.0%) |
| 35 to 64 Years | 0 (0.0%) | 21 (5.8%) |
| 65 to 74 Years | 3 (7.3%) | 0 (0.0%) |
| 75 Years and over | 0 (0.0%) | 26 (33.3%) |
Technology Access in Chepachet
Computing Device Access in Chepachet
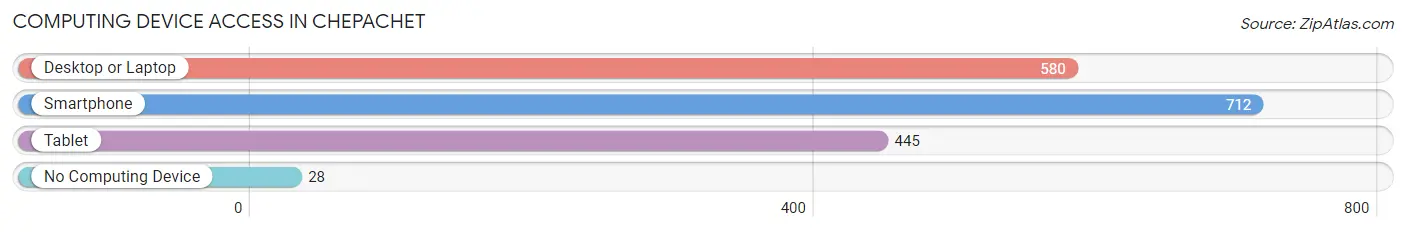
| Device Type | # Households | % Households |
| Desktop or Laptop | 580 | 73.9% |
| Smartphone | 712 | 90.7% |
| Tablet | 445 | 56.7% |
| No Computing Device | 28 | 3.6% |
| Total | 785 | 100.0% |
Internet Access in Chepachet
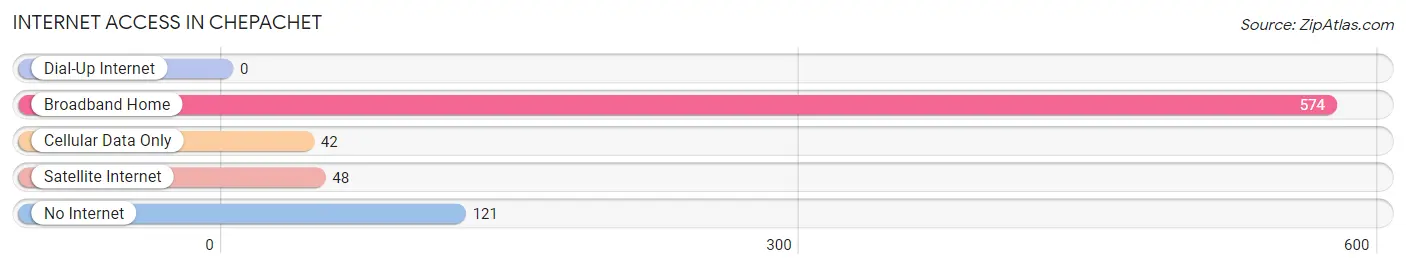
| Internet Type | # Households | % Households |
| Dial-Up Internet | 0 | 0.0% |
| Broadband Home | 574 | 73.1% |
| Cellular Data Only | 42 | 5.3% |
| Satellite Internet | 48 | 6.1% |
| No Internet | 121 | 15.4% |
| Total | 785 | 100.0% |
Chepachet Summary
History
Chepachet, Rhode Island is a small village located in the town of Glocester, Rhode Island. It is located in the northwest corner of the state, near the border of Connecticut. The village was first settled in the late 1600s by English settlers, and was originally known as “Chepachett”. The name is derived from the Narragansett word “Chepahchet”, which means “place of the great spring”. The village was incorporated in 1731, and has remained a small, rural community ever since.
Chepachet has a rich history of industry and agriculture. In the early 1800s, the village was home to several mills, including a grist mill, a saw mill, and a woolen mill. These mills provided employment for many of the villagers, and helped to make Chepachet a prosperous community. In the late 1800s, the village was home to several farms, which produced a variety of crops, including corn, potatoes, and hay.
Chepachet was also home to several notable figures in Rhode Island history. In the late 1700s, the village was home to the first governor of Rhode Island, William Greene. In the early 1800s, the village was home to the first female doctor in the United States, Dr. Esther Hill. In the late 1800s, the village was home to the first African-American doctor in Rhode Island, Dr. William H. Brown.
Geography
Chepachet is located in the northwest corner of Rhode Island, near the border of Connecticut. The village is situated in the town of Glocester, and is bordered by the towns of Burrillville, Smithfield, and Foster. The village is located in the Blackstone Valley, and is surrounded by rolling hills and forests. The village is located at the intersection of two major highways, Route 44 and Route 102.
The village is located in a temperate climate, with warm summers and cold winters. The average temperature in the summer is around 75 degrees Fahrenheit, and the average temperature in the winter is around 25 degrees Fahrenheit. The village receives an average of 45 inches of precipitation per year, with most of it falling in the form of snow in the winter months.
Economy
Chepachet is a small, rural community with a limited economy. The village is home to several small businesses, including a few restaurants, a grocery store, and a few retail stores. The village is also home to several small manufacturing companies, which produce a variety of products, including furniture, clothing, and electronics.
The village is also home to several farms, which produce a variety of crops, including corn, potatoes, and hay. The village is also home to several small businesses, which provide services to the local community, such as landscaping, plumbing, and auto repair.
Demographics
As of the 2010 census, the population of Chepachet was 1,845. The population is predominantly white (94.3%), with a small percentage of African-Americans (2.2%) and Hispanics (2.2%). The median household income in the village is $50,000, and the median age is 43.
The village is home to several churches, including the Chepachet Baptist Church, the Chepachet Congregational Church, and the Chepachet United Methodist Church. The village is also home to several schools, including the Chepachet Elementary School, the Chepachet Middle School, and the Chepachet High School.
Conclusion
Chepachet, Rhode Island is a small, rural village located in the northwest corner of the state. The village has a rich history of industry and agriculture, and is home to several notable figures in Rhode Island history. The village has a limited economy, with most of its residents employed in small businesses or on local farms. The population of the village is predominantly white, with a small percentage of African-Americans and Hispanics. The village is home to several churches and schools, and is a peaceful, close-knit community.
Common Questions
What is Per Capita Income in Chepachet?
Per Capita income in Chepachet is $44,191.
What is the Median Family Income in Chepachet?
Median Family Income in Chepachet is $91,688.
What is the Median Household income in Chepachet?
Median Household Income in Chepachet is $92,228.
What is Income or Wage Gap in Chepachet?
Income or Wage Gap in Chepachet is 43.4%.
Women in Chepachet earn 56.6 cents for every dollar earned by a man.
What is Inequality or Gini Index in Chepachet?
Inequality or Gini Index in Chepachet is 0.36.
What is the Total Population of Chepachet?
Total Population of Chepachet is 1,755.
What is the Total Male Population of Chepachet?
Total Male Population of Chepachet is 871.
What is the Total Female Population of Chepachet?
Total Female Population of Chepachet is 884.
What is the Ratio of Males per 100 Females in Chepachet?
There are 98.53 Males per 100 Females in Chepachet.
What is the Ratio of Females per 100 Males in Chepachet?
There are 101.49 Females per 100 Males in Chepachet.
What is the Median Population Age in Chepachet?
Median Population Age in Chepachet is 41.8 Years.
What is the Average Family Size in Chepachet
Average Family Size in Chepachet is 2.9 People.
What is the Average Household Size in Chepachet
Average Household Size in Chepachet is 2.2 People.
How Large is the Labor Force in Chepachet?
There are 1,022 People in the Labor Forcein in Chepachet.
What is the Percentage of People in the Labor Force in Chepachet?
75.1% of People are in the Labor Force in Chepachet.