Pascoag, RI Map & Demographics
Pascoag Map
Pascoag Overview
$37,659
PER CAPITA INCOME
$112,917
AVG FAMILY INCOME
$97,064
AVG HOUSEHOLD INCOME
36.6%
WAGE / INCOME GAP [ % ]
63.4¢/ $1
WAGE / INCOME GAP [ $ ]
0.38
INEQUALITY / GINI INDEX
4,527
TOTAL POPULATION
2,639
MALE POPULATION
1,888
FEMALE POPULATION
139.78
MALES / 100 FEMALES
71.54
FEMALES / 100 MALES
34.7
MEDIAN AGE
3.2
AVG FAMILY SIZE
2.8
AVG HOUSEHOLD SIZE
2,406
LABOR FORCE [ PEOPLE ]
64.8%
PERCENT IN LABOR FORCE
7.7%
UNEMPLOYMENT RATE
Pascoag Zip Codes
Pascoag Area Codes
Income in Pascoag
Income Overview in Pascoag
Per Capita Income in Pascoag is $37,659, while median incomes of families and households are $112,917 and $97,064 respectively.
| Characteristic | Number | Measure |
| Per Capita Income | 4,527 | $37,659 |
| Median Family Income | 1,112 | $112,917 |
| Mean Family Income | 1,112 | $115,935 |
| Median Household Income | 1,524 | $97,064 |
| Mean Household Income | 1,524 | $101,601 |
| Income Deficit | 1,112 | $0 |
| Wage / Income Gap (%) | 4,527 | 36.59% |
| Wage / Income Gap ($) | 4,527 | 63.41¢ per $1 |
| Gini / Inequality Index | 4,527 | 0.38 |
Earnings by Sex in Pascoag
Average Earnings in Pascoag are $46,534, $60,333 for men and $38,255 for women, a difference of 36.6%.
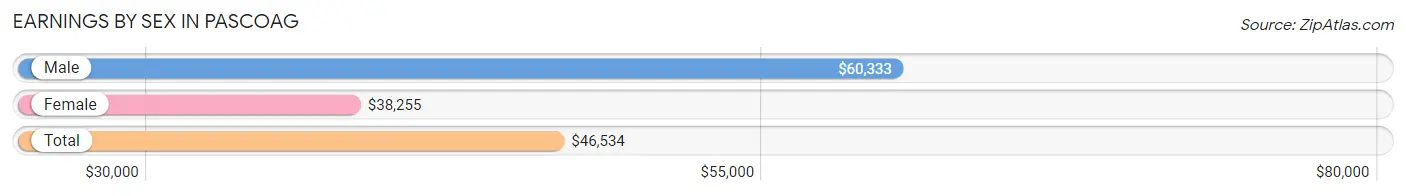
| Sex | Number | Average Earnings |
| Male | 1,440 (59.5%) | $60,333 |
| Female | 979 (40.5%) | $38,255 |
| Total | 2,419 (100.0%) | $46,534 |
Earnings by Sex by Income Bracket in Pascoag
The most common earnings brackets in Pascoag are $75,000 to $99,999 for men (415 | 28.8%) and $30,000 to $34,999 for women (183 | 18.7%).
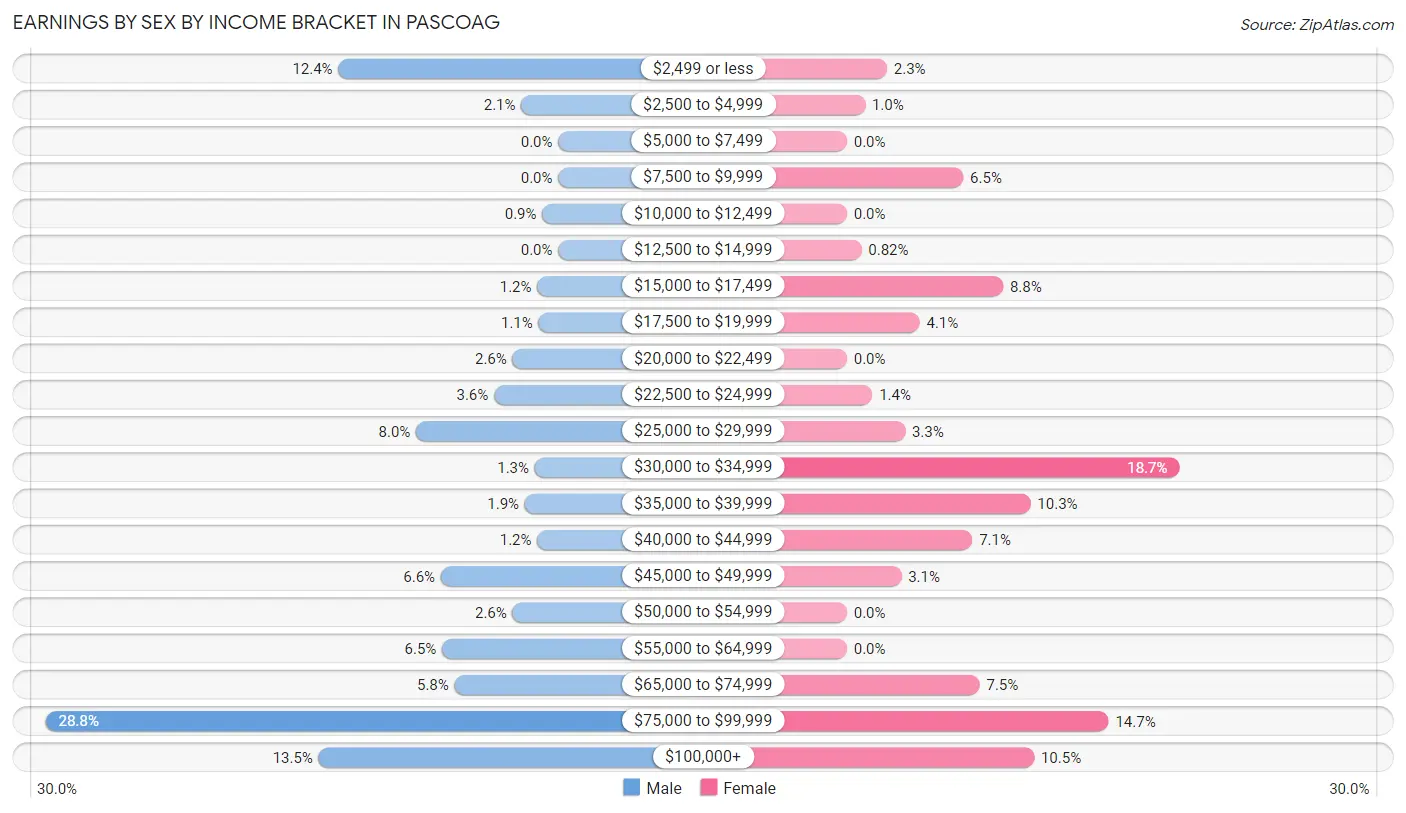
| Income | Male | Female |
| $2,499 or less | 178 (12.4%) | 22 (2.2%) |
| $2,500 to $4,999 | 30 (2.1%) | 10 (1.0%) |
| $5,000 to $7,499 | 0 (0.0%) | 0 (0.0%) |
| $7,500 to $9,999 | 0 (0.0%) | 64 (6.5%) |
| $10,000 to $12,499 | 13 (0.9%) | 0 (0.0%) |
| $12,500 to $14,999 | 0 (0.0%) | 8 (0.8%) |
| $15,000 to $17,499 | 17 (1.2%) | 86 (8.8%) |
| $17,500 to $19,999 | 16 (1.1%) | 40 (4.1%) |
| $20,000 to $22,499 | 37 (2.6%) | 0 (0.0%) |
| $22,500 to $24,999 | 52 (3.6%) | 14 (1.4%) |
| $25,000 to $29,999 | 115 (8.0%) | 32 (3.3%) |
| $30,000 to $34,999 | 19 (1.3%) | 183 (18.7%) |
| $35,000 to $39,999 | 27 (1.9%) | 101 (10.3%) |
| $40,000 to $44,999 | 17 (1.2%) | 69 (7.0%) |
| $45,000 to $49,999 | 95 (6.6%) | 30 (3.1%) |
| $50,000 to $54,999 | 37 (2.6%) | 0 (0.0%) |
| $55,000 to $64,999 | 94 (6.5%) | 0 (0.0%) |
| $65,000 to $74,999 | 84 (5.8%) | 73 (7.5%) |
| $75,000 to $99,999 | 415 (28.8%) | 144 (14.7%) |
| $100,000+ | 194 (13.5%) | 103 (10.5%) |
| Total | 1,440 (100.0%) | 979 (100.0%) |
Earnings by Sex by Educational Attainment in Pascoag
Average earnings in Pascoag are $78,453 for men and $38,663 for women, a difference of 50.7%. Men with an educational attainment of bachelor's degree enjoy the highest average annual earnings of $97,250, while those with high school diploma education earn the least with $63,929. Women with an educational attainment of bachelor's degree earn the most with the average annual earnings of $91,862, while those with college or associate's degree education have the smallest earnings of $33,360.
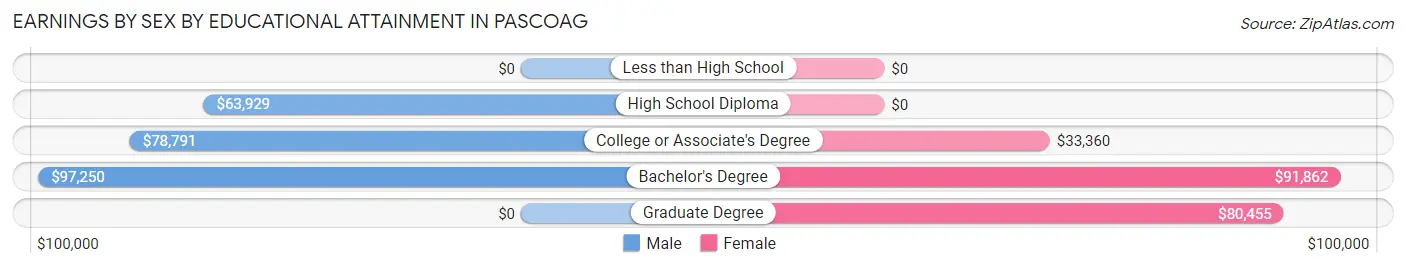
| Educational Attainment | Male Income | Female Income |
| Less than High School | - | - |
| High School Diploma | $63,929 | $0 |
| College or Associate's Degree | $78,791 | $33,360 |
| Bachelor's Degree | $97,250 | $91,862 |
| Graduate Degree | - | - |
| Total | $78,453 | $38,663 |
Family Income in Pascoag
Family Income Brackets in Pascoag
According to the Pascoag family income data, there are 346 families falling into the $100,000 to $149,999 income range, which is the most common income bracket and makes up 31.1% of all families.
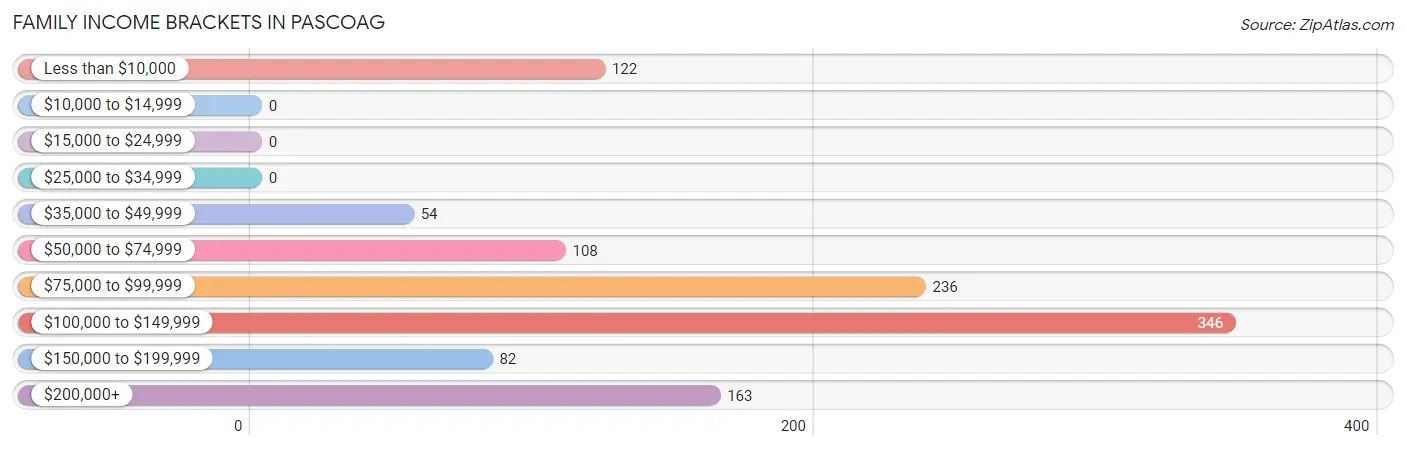
| Income Bracket | # Families | % Families |
| Less than $10,000 | 122 | 11.0% |
| $10,000 to $14,999 | 0 | 0.0% |
| $15,000 to $24,999 | 0 | 0.0% |
| $25,000 to $34,999 | 0 | 0.0% |
| $35,000 to $49,999 | 54 | 4.9% |
| $50,000 to $74,999 | 108 | 9.7% |
| $75,000 to $99,999 | 236 | 21.2% |
| $100,000 to $149,999 | 346 | 31.1% |
| $150,000 to $199,999 | 82 | 7.4% |
| $200,000+ | 163 | 14.7% |
Family Income by Famaliy Size in Pascoag
4-person families (349 | 31.4%) account for the highest median family income in Pascoag with $121,580 per family, while 2-person families (459 | 41.3%) have the highest median income of $48,400 per family member.
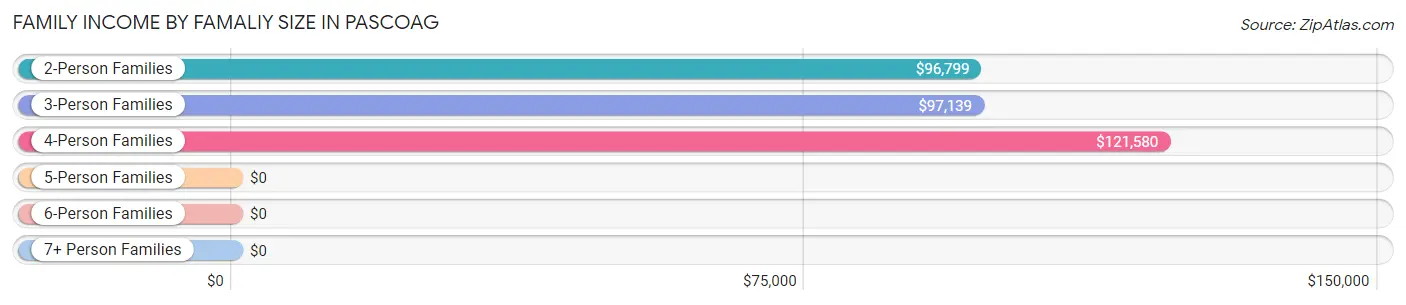
| Income Bracket | # Families | Median Income |
| 2-Person Families | 459 (41.3%) | $96,799 |
| 3-Person Families | 275 (24.7%) | $97,139 |
| 4-Person Families | 349 (31.4%) | $121,580 |
| 5-Person Families | 0 (0.0%) | $0 |
| 6-Person Families | 29 (2.6%) | $0 |
| 7+ Person Families | 0 (0.0%) | $0 |
| Total | 1,112 (100.0%) | $112,917 |
Family Income by Number of Earners in Pascoag
The median family income in Pascoag is $112,917, with families comprising 3+ earners (117) having the highest median family income of $188,250, while families with no earners (119) have the lowest median family income of $58,083, accounting for 10.5% and 10.7% of families, respectively.
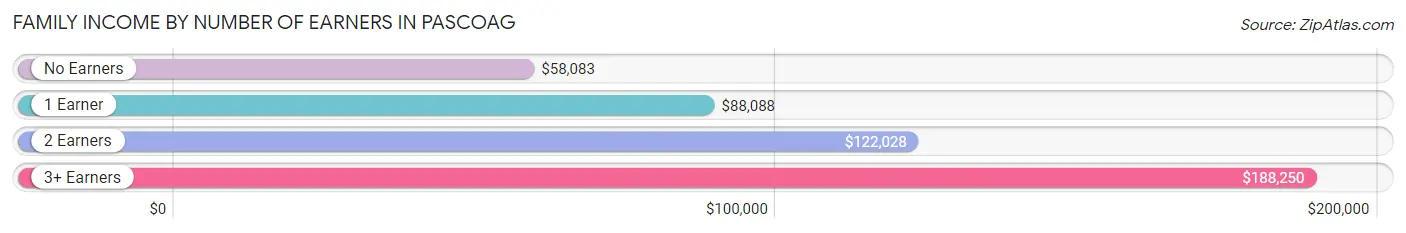
| Number of Earners | # Families | Median Income |
| No Earners | 119 (10.7%) | $58,083 |
| 1 Earner | 328 (29.5%) | $88,088 |
| 2 Earners | 548 (49.3%) | $122,028 |
| 3+ Earners | 117 (10.5%) | $188,250 |
| Total | 1,112 (100.0%) | $112,917 |
Household Income in Pascoag
Household Income Brackets in Pascoag
With 469 households falling in the category, the $100,000 to $149,999 income range is the most frequent in Pascoag, accounting for 30.8% of all households. In contrast, only 14 households (0.9%) fall into the $10,000 to $14,999 income bracket, making it the least populous group.
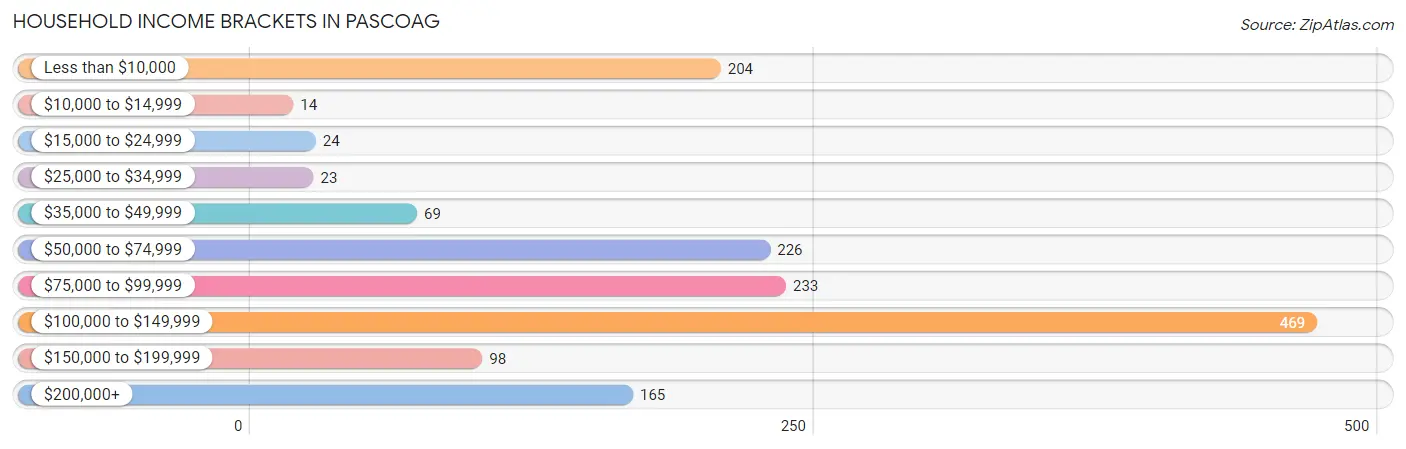
| Income Bracket | # Households | % Households |
| Less than $10,000 | 204 | 13.4% |
| $10,000 to $14,999 | 14 | 0.9% |
| $15,000 to $24,999 | 24 | 1.6% |
| $25,000 to $34,999 | 23 | 1.5% |
| $35,000 to $49,999 | 69 | 4.5% |
| $50,000 to $74,999 | 226 | 14.8% |
| $75,000 to $99,999 | 233 | 15.3% |
| $100,000 to $149,999 | 469 | 30.8% |
| $150,000 to $199,999 | 98 | 6.4% |
| $200,000+ | 165 | 10.8% |
Household Income by Householder Age in Pascoag
The median household income in Pascoag is $97,064, with the highest median household income of $113,923 found in the 45 to 64 years age bracket for the primary householder. A total of 523 households (34.3%) fall into this category. Meanwhile, the 15 to 24 years age bracket for the primary householder has the lowest median household income of $0, with 40 households (2.6%) in this group.
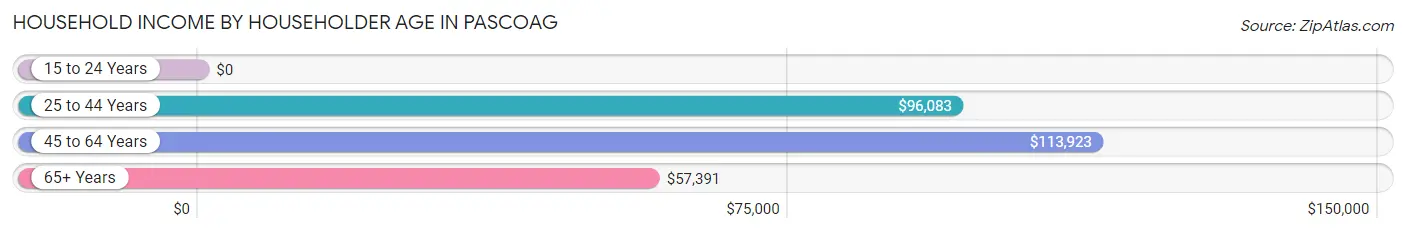
| Income Bracket | # Households | Median Income |
| 15 to 24 Years | 40 (2.6%) | $0 |
| 25 to 44 Years | 669 (43.9%) | $96,083 |
| 45 to 64 Years | 523 (34.3%) | $113,923 |
| 65+ Years | 292 (19.2%) | $57,391 |
| Total | 1,524 (100.0%) | $97,064 |
Poverty in Pascoag
Income Below Poverty by Sex and Age in Pascoag
With 22.1% poverty level for males and 4.3% for females among the residents of Pascoag, 12 to 14 year old males and 75 year old and over females are the most vulnerable to poverty, with 107 males (69.9%) and 28 females (24.8%) in their respective age groups living below the poverty level.
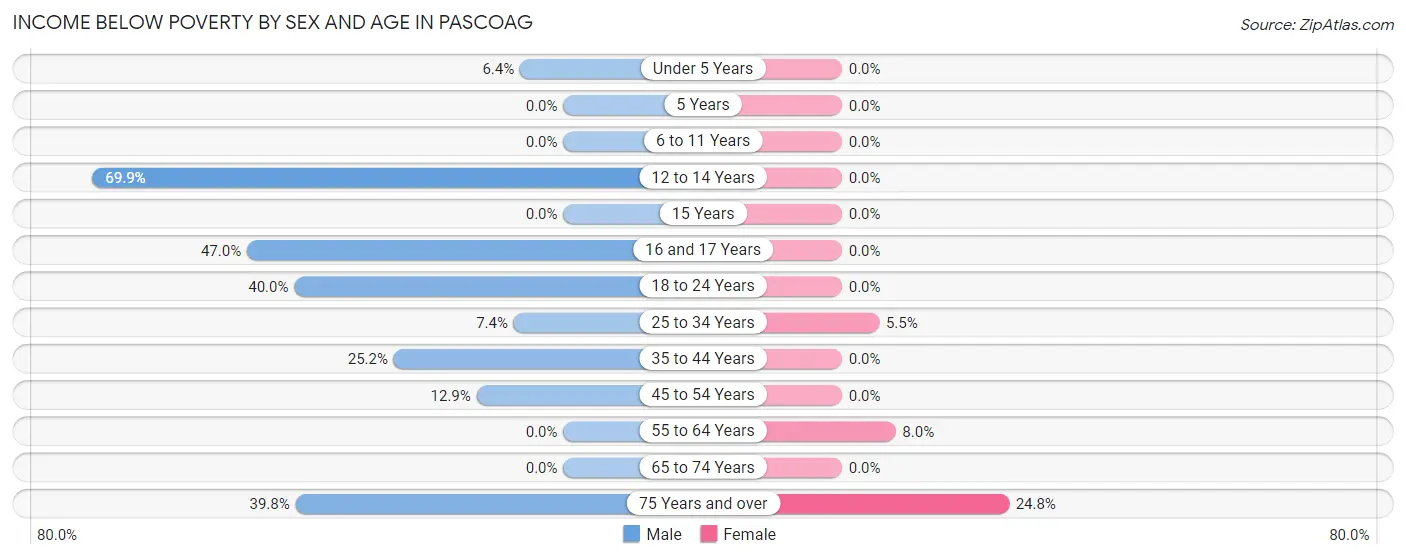
| Age Bracket | Male | Female |
| Under 5 Years | 18 (6.4%) | 0 (0.0%) |
| 5 Years | 0 (0.0%) | 0 (0.0%) |
| 6 to 11 Years | 0 (0.0%) | 0 (0.0%) |
| 12 to 14 Years | 107 (69.9%) | 0 (0.0%) |
| 15 Years | 0 (0.0%) | 0 (0.0%) |
| 16 and 17 Years | 101 (47.0%) | 0 (0.0%) |
| 18 to 24 Years | 151 (40.0%) | 0 (0.0%) |
| 25 to 34 Years | 34 (7.4%) | 16 (5.5%) |
| 35 to 44 Years | 106 (25.2%) | 0 (0.0%) |
| 45 to 54 Years | 17 (12.9%) | 0 (0.0%) |
| 55 to 64 Years | 0 (0.0%) | 30 (8.0%) |
| 65 to 74 Years | 0 (0.0%) | 0 (0.0%) |
| 75 Years and over | 35 (39.8%) | 28 (24.8%) |
| Total | 569 (22.1%) | 74 (4.3%) |
Income Above Poverty by Sex and Age in Pascoag
According to the poverty statistics in Pascoag, males aged 5 years and females aged under 5 years are the age groups that are most secure financially, with 100.0% of males and 100.0% of females in these age groups living above the poverty line.
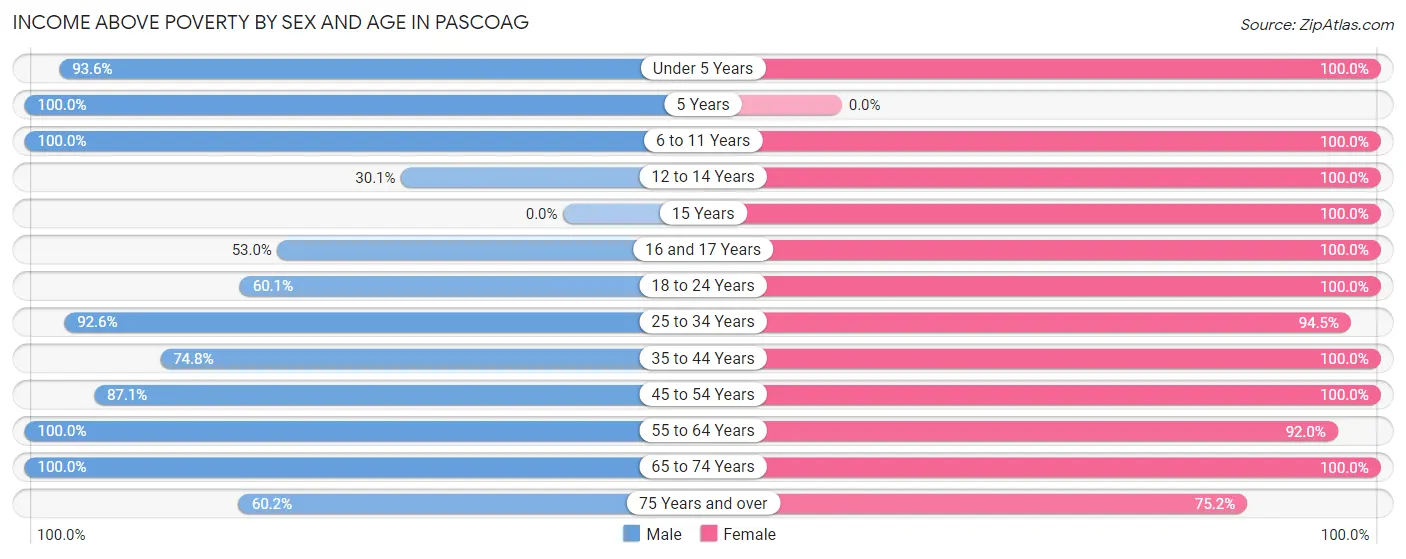
| Age Bracket | Male | Female |
| Under 5 Years | 262 (93.6%) | 98 (100.0%) |
| 5 Years | 7 (100.0%) | 0 (0.0%) |
| 6 to 11 Years | 64 (100.0%) | 130 (100.0%) |
| 12 to 14 Years | 46 (30.1%) | 17 (100.0%) |
| 15 Years | 0 (0.0%) | 16 (100.0%) |
| 16 and 17 Years | 114 (53.0%) | 35 (100.0%) |
| 18 to 24 Years | 227 (60.1%) | 82 (100.0%) |
| 25 to 34 Years | 428 (92.6%) | 274 (94.5%) |
| 35 to 44 Years | 315 (74.8%) | 191 (100.0%) |
| 45 to 54 Years | 115 (87.1%) | 157 (100.0%) |
| 55 to 64 Years | 221 (100.0%) | 347 (92.0%) |
| 65 to 74 Years | 154 (100.0%) | 198 (100.0%) |
| 75 Years and over | 53 (60.2%) | 85 (75.2%) |
| Total | 2,006 (77.9%) | 1,630 (95.7%) |
Income Below Poverty Among Married-Couple Families in Pascoag
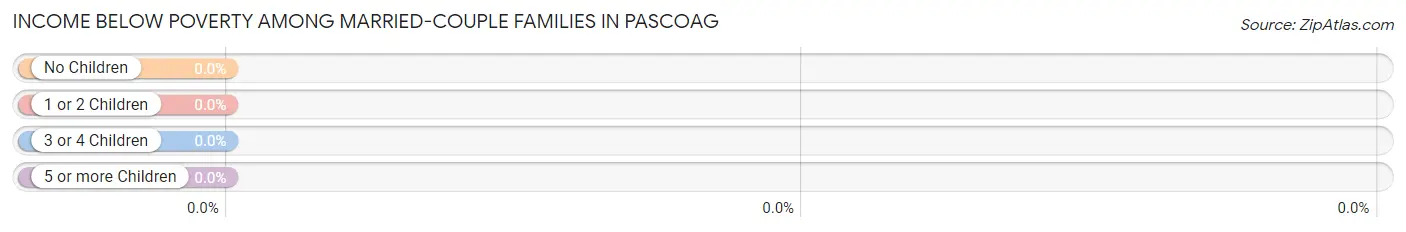
| Children | Above Poverty | Below Poverty |
| No Children | 540 (100.0%) | 0 (0.0%) |
| 1 or 2 Children | 271 (100.0%) | 0 (0.0%) |
| 3 or 4 Children | 15 (100.0%) | 0 (0.0%) |
| 5 or more Children | 0 (0.0%) | 0 (0.0%) |
| Total | 826 (100.0%) | 0 (0.0%) |
Income Below Poverty Among Single-Parent Households in Pascoag
According to the poverty data in Pascoag, 78.5% or 106 single-father households and 10.6% or 16 single-mother households are living below the poverty line. Among single-father households, those with 1 or 2 children have the highest poverty rate, with 106 households (86.2%) experiencing poverty. Likewise, among single-mother households, those with 1 or 2 children have the highest poverty rate, with 16 households (14.4%) falling below the poverty line.
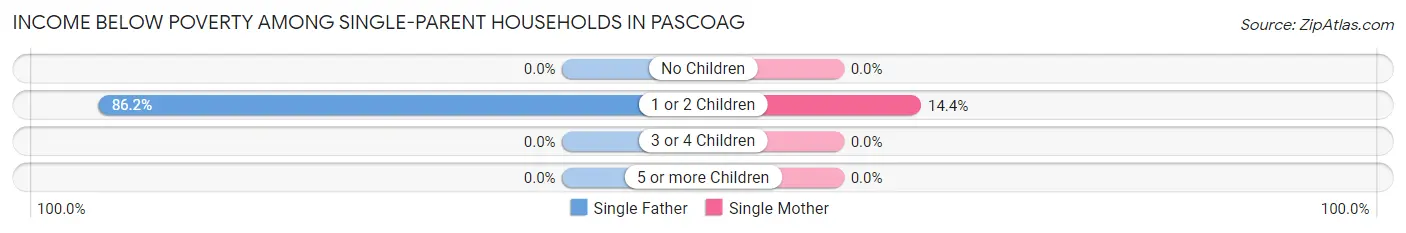
| Children | Single Father | Single Mother |
| No Children | 0 (0.0%) | 0 (0.0%) |
| 1 or 2 Children | 106 (86.2%) | 16 (14.4%) |
| 3 or 4 Children | 0 (0.0%) | 0 (0.0%) |
| 5 or more Children | 0 (0.0%) | 0 (0.0%) |
| Total | 106 (78.5%) | 16 (10.6%) |
Income Below Poverty Among Married-Couple vs Single-Parent Households in Pascoag
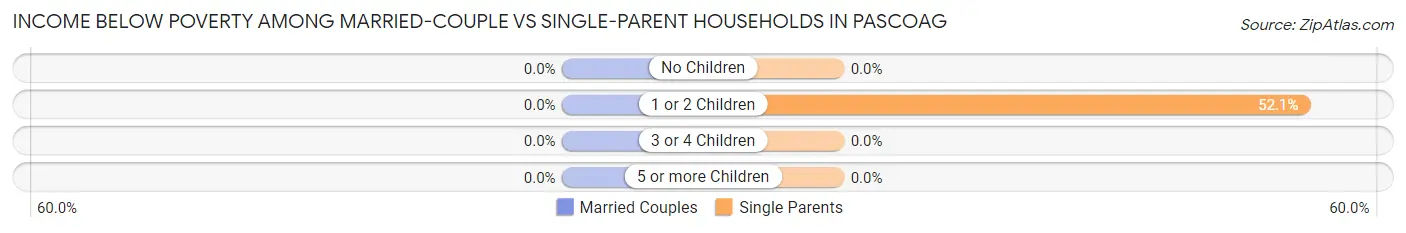
| Children | Married-Couple Families | Single-Parent Households |
| No Children | 0 (0.0%) | 0 (0.0%) |
| 1 or 2 Children | 0 (0.0%) | 122 (52.1%) |
| 3 or 4 Children | 0 (0.0%) | 0 (0.0%) |
| 5 or more Children | 0 (0.0%) | 0 (0.0%) |
| Total | 0 (0.0%) | 122 (42.7%) |
Race in Pascoag
The most populous races in Pascoag are White / Caucasian (3,715 | 82.1%), Hispanic or Latino (793 | 17.5%), and Some other Race (633 | 14.0%).
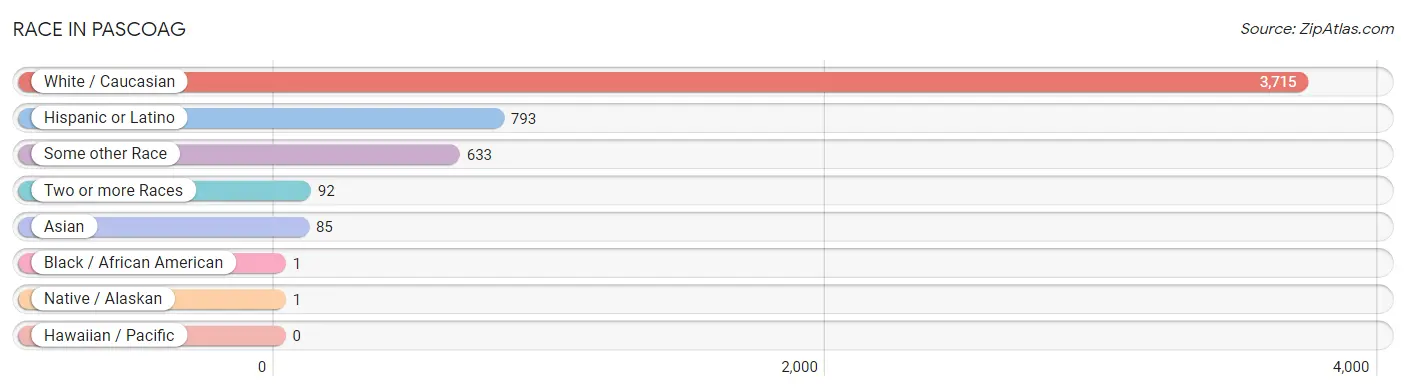
| Race | # Population | % Population |
| Asian | 85 | 1.9% |
| Black / African American | 1 | 0.0% |
| Hawaiian / Pacific | 0 | 0.0% |
| Hispanic or Latino | 793 | 17.5% |
| Native / Alaskan | 1 | 0.0% |
| White / Caucasian | 3,715 | 82.1% |
| Two or more Races | 92 | 2.0% |
| Some other Race | 633 | 14.0% |
| Total | 4,527 | 100.0% |
Ancestry in Pascoag
The most populous ancestries reported in Pascoag are Italian (763 | 16.9%), French (709 | 15.7%), Irish (617 | 13.6%), English (542 | 12.0%), and Dominican (465 | 10.3%), together accounting for 68.4% of all Pascoag residents.
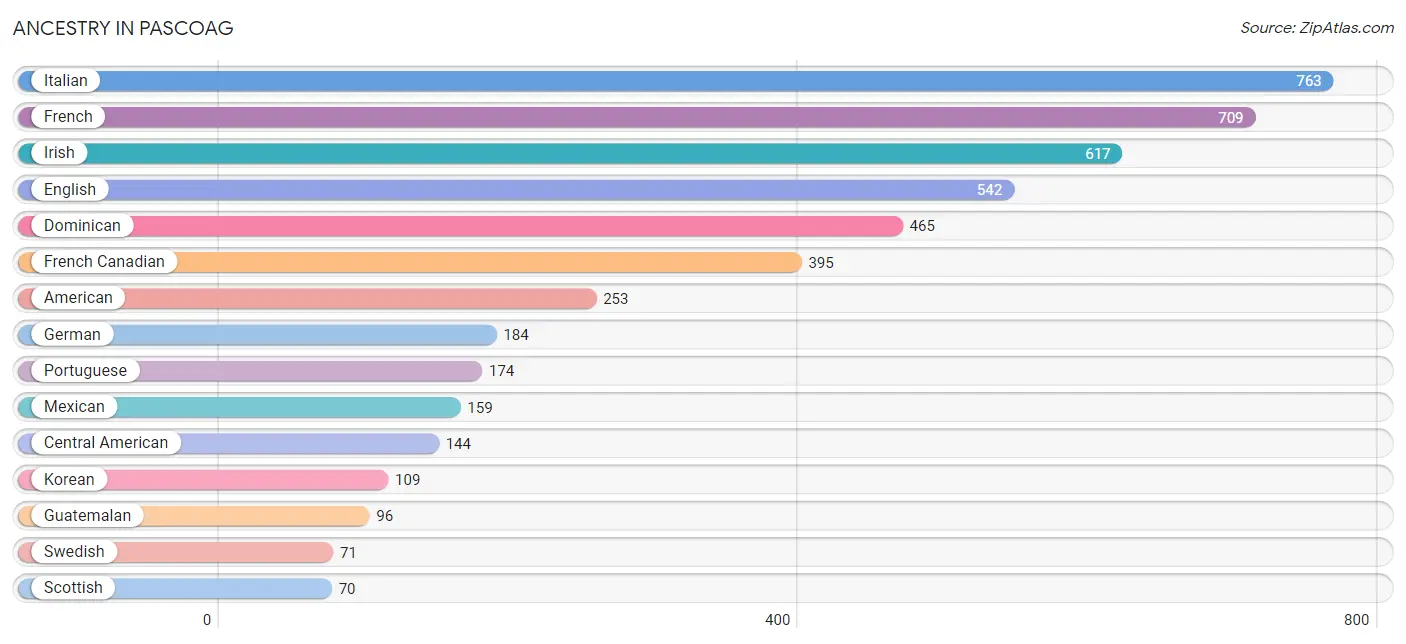
| Ancestry | # Population | % Population |
| American | 253 | 5.6% |
| Bhutanese | 46 | 1.0% |
| Central American | 144 | 3.2% |
| Danish | 39 | 0.9% |
| Dominican | 465 | 10.3% |
| Dutch | 31 | 0.7% |
| Eastern European | 15 | 0.3% |
| English | 542 | 12.0% |
| European | 17 | 0.4% |
| Finnish | 29 | 0.6% |
| French | 709 | 15.7% |
| French Canadian | 395 | 8.7% |
| German | 184 | 4.1% |
| Guatemalan | 96 | 2.1% |
| Irish | 617 | 13.6% |
| Italian | 763 | 16.9% |
| Korean | 109 | 2.4% |
| Mexican | 159 | 3.5% |
| Polish | 31 | 0.7% |
| Portuguese | 174 | 3.8% |
| Puerto Rican | 24 | 0.5% |
| Salvadoran | 48 | 1.1% |
| Scotch-Irish | 17 | 0.4% |
| Scottish | 70 | 1.5% |
| Swedish | 71 | 1.6% | View All 25 Rows |
Immigrants in Pascoag
The most numerous immigrant groups reported in Pascoag came from Latin America (473 | 10.4%), Caribbean (364 | 8.0%), Dominican Republic (364 | 8.0%), Central America (96 | 2.1%), and Guatemala (96 | 2.1%), together accounting for 30.8% of all Pascoag residents.
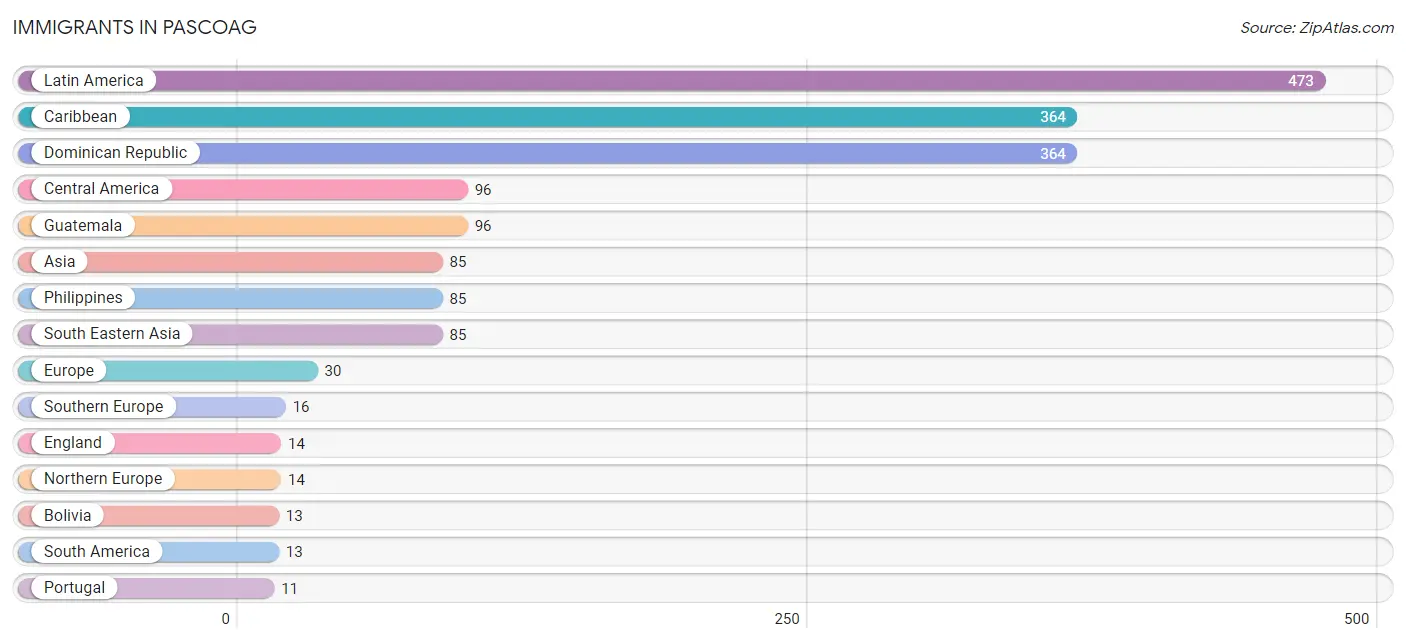
| Immigration Origin | # Population | % Population |
| Asia | 85 | 1.9% |
| Bolivia | 13 | 0.3% |
| Caribbean | 364 | 8.0% |
| Central America | 96 | 2.1% |
| Dominican Republic | 364 | 8.0% |
| England | 14 | 0.3% |
| Europe | 30 | 0.7% |
| Guatemala | 96 | 2.1% |
| Italy | 5 | 0.1% |
| Latin America | 473 | 10.4% |
| Northern Europe | 14 | 0.3% |
| Philippines | 85 | 1.9% |
| Portugal | 11 | 0.2% |
| South America | 13 | 0.3% |
| South Eastern Asia | 85 | 1.9% |
| Southern Europe | 16 | 0.4% | View All 16 Rows |
Sex and Age in Pascoag
Sex and Age in Pascoag
The most populous age groups in Pascoag are 20 to 24 Years (328 | 12.4%) for men and 55 to 59 Years (208 | 11.0%) for women.
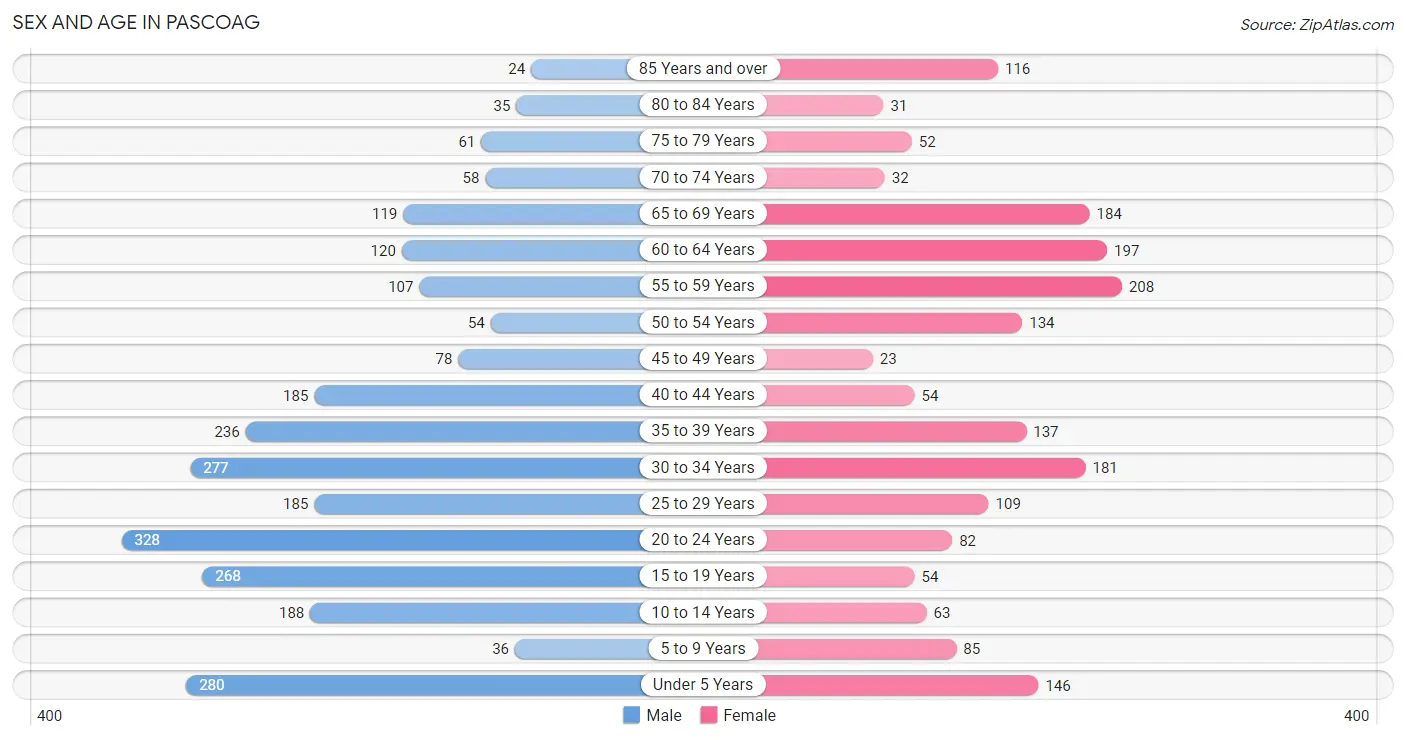
| Age Bracket | Male | Female |
| Under 5 Years | 280 (10.6%) | 146 (7.7%) |
| 5 to 9 Years | 36 (1.4%) | 85 (4.5%) |
| 10 to 14 Years | 188 (7.1%) | 63 (3.3%) |
| 15 to 19 Years | 268 (10.2%) | 54 (2.9%) |
| 20 to 24 Years | 328 (12.4%) | 82 (4.3%) |
| 25 to 29 Years | 185 (7.0%) | 109 (5.8%) |
| 30 to 34 Years | 277 (10.5%) | 181 (9.6%) |
| 35 to 39 Years | 236 (8.9%) | 137 (7.3%) |
| 40 to 44 Years | 185 (7.0%) | 54 (2.9%) |
| 45 to 49 Years | 78 (3.0%) | 23 (1.2%) |
| 50 to 54 Years | 54 (2.1%) | 134 (7.1%) |
| 55 to 59 Years | 107 (4.1%) | 208 (11.0%) |
| 60 to 64 Years | 120 (4.5%) | 197 (10.4%) |
| 65 to 69 Years | 119 (4.5%) | 184 (9.8%) |
| 70 to 74 Years | 58 (2.2%) | 32 (1.7%) |
| 75 to 79 Years | 61 (2.3%) | 52 (2.8%) |
| 80 to 84 Years | 35 (1.3%) | 31 (1.6%) |
| 85 Years and over | 24 (0.9%) | 116 (6.1%) |
| Total | 2,639 (100.0%) | 1,888 (100.0%) |
Families and Households in Pascoag
Median Family Size in Pascoag
The median family size in Pascoag is 3.18 persons per family, with single male/father families (135 | 12.1%) accounting for the largest median family size of 4.04 persons per family. On the other hand, single female/mother families (151 | 13.6%) represent the smallest median family size with 2.64 persons per family.
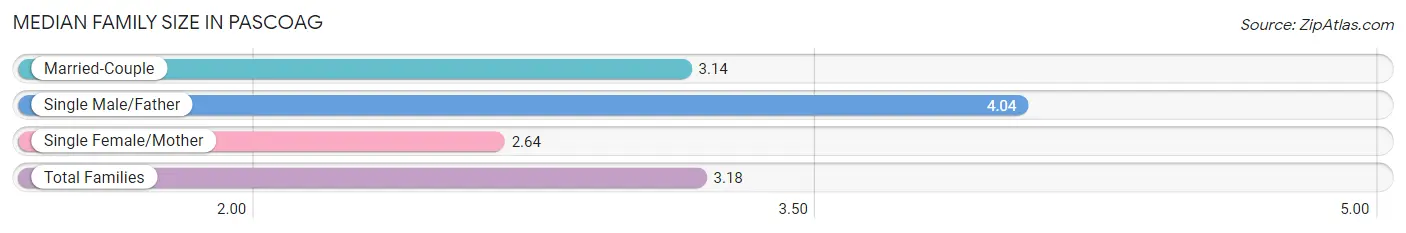
| Family Type | # Families | Family Size |
| Married-Couple | 826 (74.3%) | 3.14 |
| Single Male/Father | 135 (12.1%) | 4.04 |
| Single Female/Mother | 151 (13.6%) | 2.64 |
| Total Families | 1,112 (100.0%) | 3.18 |
Median Household Size in Pascoag
The median household size in Pascoag is 2.84 persons per household, with single male/father households (135 | 8.9%) accounting for the largest median household size of 4.04 persons per household. non-family households (412 | 27.0%) represent the smallest median household size with 1.57 persons per household.
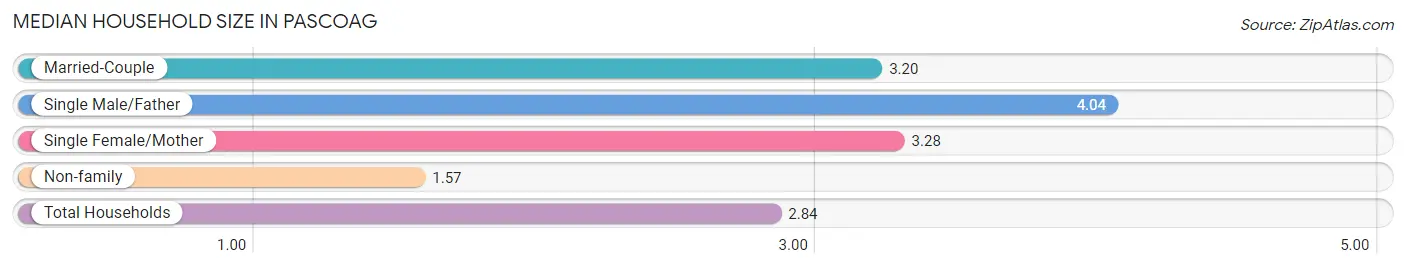
| Household Type | # Households | Household Size |
| Married-Couple | 826 (54.2%) | 3.20 |
| Single Male/Father | 135 (8.9%) | 4.04 |
| Single Female/Mother | 151 (9.9%) | 3.28 |
| Non-family | 412 (27.0%) | 1.57 |
| Total Households | 1,524 (100.0%) | 2.84 |
Household Size by Marriage Status in Pascoag
Out of a total of 1,524 households in Pascoag, 1,112 (73.0%) are family households, while 412 (27.0%) are nonfamily households. The most numerous type of family households are 2-person households, comprising 412, and the most common type of nonfamily households are 1-person households, comprising 289.
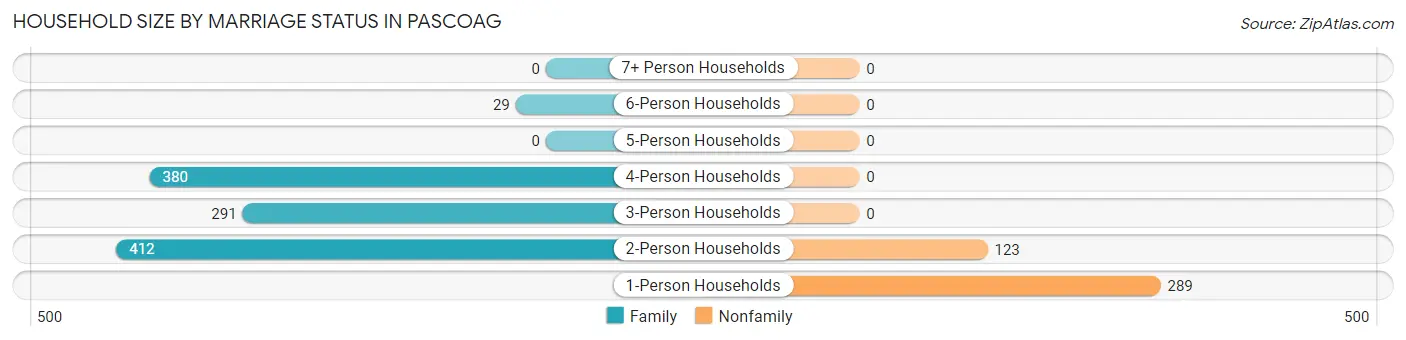
| Household Size | Family Households | Nonfamily Households |
| 1-Person Households | - | 289 (19.0%) |
| 2-Person Households | 412 (27.0%) | 123 (8.1%) |
| 3-Person Households | 291 (19.1%) | 0 (0.0%) |
| 4-Person Households | 380 (24.9%) | 0 (0.0%) |
| 5-Person Households | 0 (0.0%) | 0 (0.0%) |
| 6-Person Households | 29 (1.9%) | 0 (0.0%) |
| 7+ Person Households | 0 (0.0%) | 0 (0.0%) |
| Total | 1,112 (73.0%) | 412 (27.0%) |
Female Fertility in Pascoag
Fertility by Age in Pascoag
Average fertility rate in Pascoag is 51.0 births per 1,000 women. Women in the age bracket of 20 to 34 years have the highest fertility rate with 89.0 births per 1,000 women. Women in the age bracket of 20 to 34 years acount for 100.0% of all women with births.
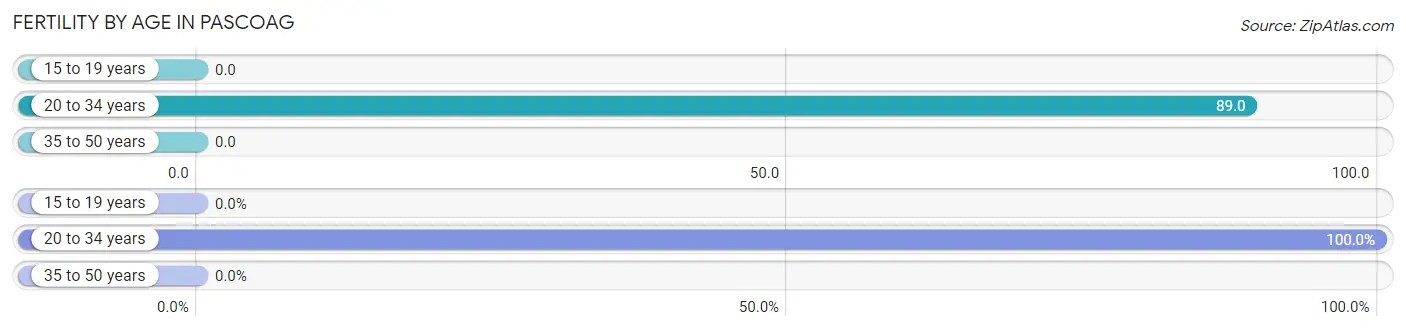
| Age Bracket | Women with Births | Births / 1,000 Women |
| 15 to 19 years | 0 (0.0%) | 0.0 |
| 20 to 34 years | 33 (100.0%) | 89.0 |
| 35 to 50 years | 0 (0.0%) | 0.0 |
| Total | 33 (100.0%) | 51.0 |
Fertility by Age by Marriage Status in Pascoag
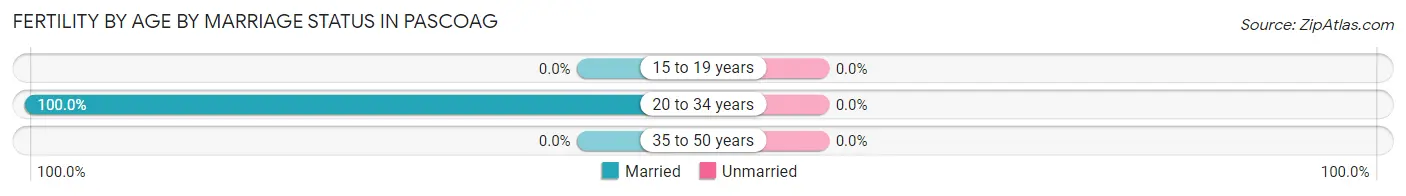
| Age Bracket | Married | Unmarried |
| 15 to 19 years | 0 (0.0%) | 0 (0.0%) |
| 20 to 34 years | 33 (100.0%) | 0 (0.0%) |
| 35 to 50 years | 0 (0.0%) | 0 (0.0%) |
| Total | 33 (100.0%) | 0 (0.0%) |
Fertility by Education in Pascoag
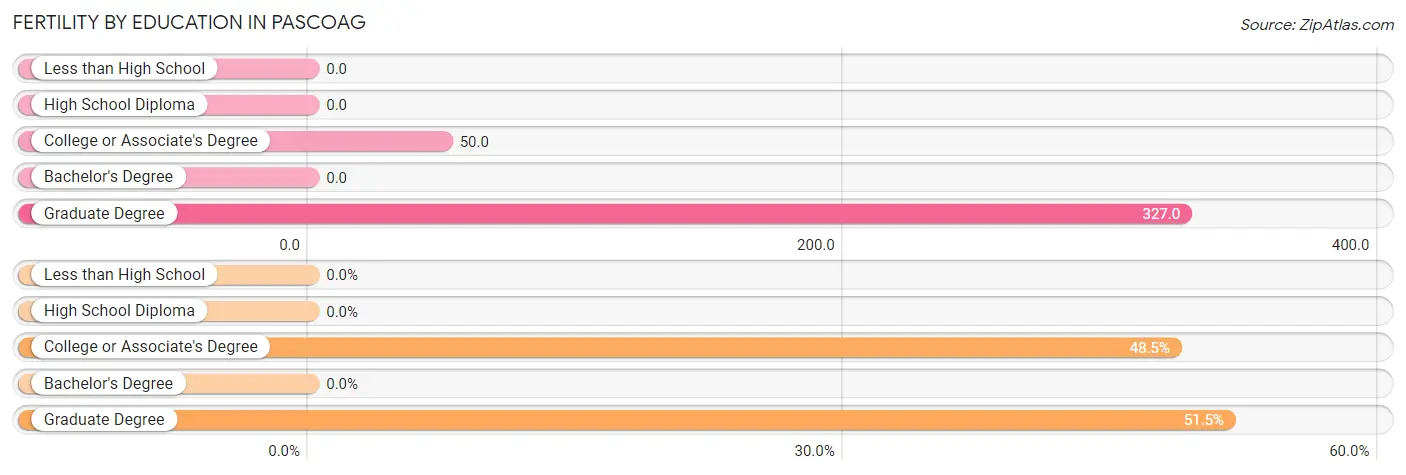
| Educational Attainment | Women with Births | Births / 1,000 Women |
| Less than High School | 0 (0.0%) | 0.0 |
| High School Diploma | 0 (0.0%) | 0.0 |
| College or Associate's Degree | 16 (48.5%) | 50.0 |
| Bachelor's Degree | 0 (0.0%) | 0.0 |
| Graduate Degree | 17 (51.5%) | 327.0 |
| Total | 33 (100.0%) | 51.0 |
Fertility by Education by Marriage Status in Pascoag
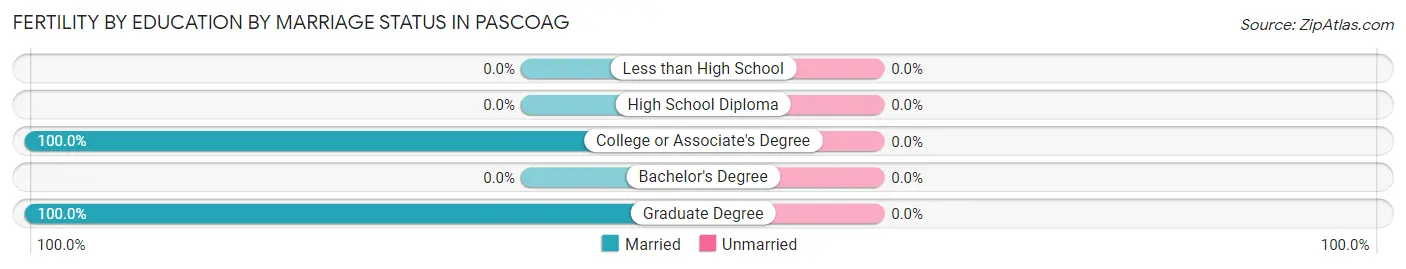
| Educational Attainment | Married | Unmarried |
| Less than High School | 0 (0.0%) | 0 (0.0%) |
| High School Diploma | 0 (0.0%) | 0 (0.0%) |
| College or Associate's Degree | 16 (100.0%) | 0 (0.0%) |
| Bachelor's Degree | 0 (0.0%) | 0 (0.0%) |
| Graduate Degree | 17 (100.0%) | 0 (0.0%) |
| Total | 33 (100.0%) | 0 (0.0%) |
Employment Characteristics in Pascoag
Employment by Class of Employer in Pascoag
Among the 2,209 employed individuals in Pascoag, private company employees (1,550 | 70.2%), not-for-profit organizations (187 | 8.5%), and local government employees (121 | 5.5%) make up the most common classes of employment.
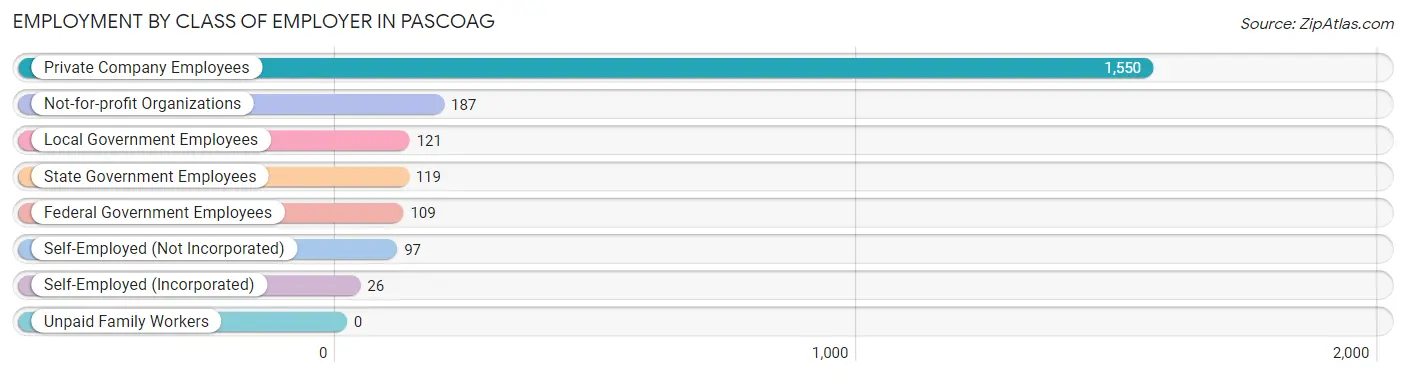
| Employer Class | # Employees | % Employees |
| Private Company Employees | 1,550 | 70.2% |
| Self-Employed (Incorporated) | 26 | 1.2% |
| Self-Employed (Not Incorporated) | 97 | 4.4% |
| Not-for-profit Organizations | 187 | 8.5% |
| Local Government Employees | 121 | 5.5% |
| State Government Employees | 119 | 5.4% |
| Federal Government Employees | 109 | 4.9% |
| Unpaid Family Workers | 0 | 0.0% |
| Total | 2,209 | 100.0% |
Employment Status by Age in Pascoag
According to the labor force statistics for Pascoag, out of the total population over 16 years of age (3,713), 64.8% or 2,406 individuals are in the labor force, with 7.7% or 185 of them unemployed. The age group with the highest labor force participation rate is 20 to 24 years, with 97.3% or 399 individuals in the labor force. Within the labor force, the 16 to 19 years age range has the highest percentage of unemployed individuals, with 86.7% or 65 of them being unemployed.
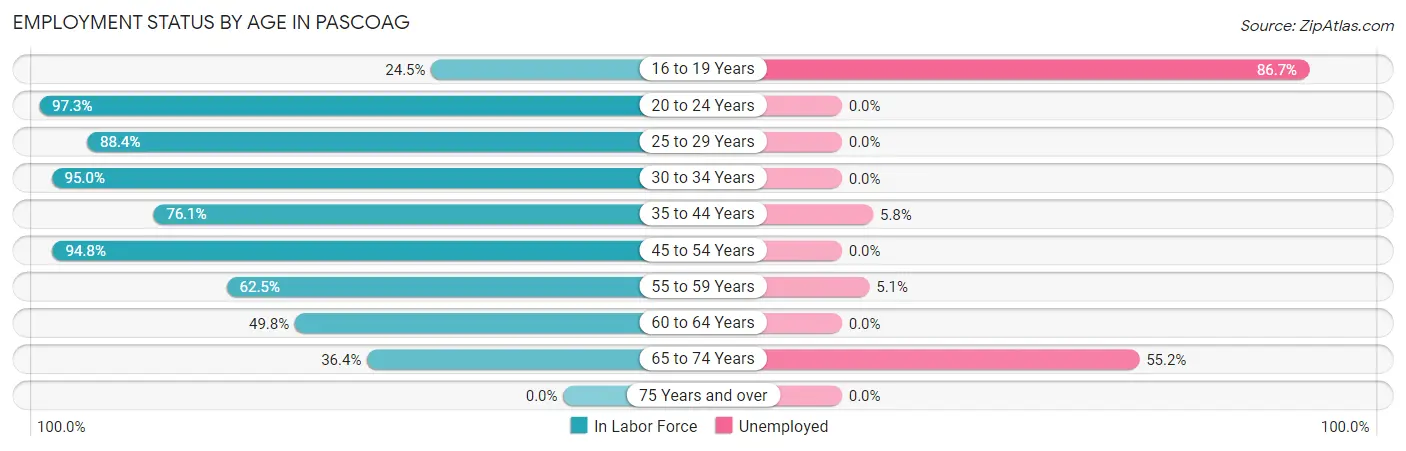
| Age Bracket | In Labor Force | Unemployed |
| 16 to 19 Years | 75 (24.5%) | 65 (86.7%) |
| 20 to 24 Years | 399 (97.3%) | 0 (0.0%) |
| 25 to 29 Years | 260 (88.4%) | 0 (0.0%) |
| 30 to 34 Years | 435 (95.0%) | 0 (0.0%) |
| 35 to 44 Years | 466 (76.1%) | 27 (5.8%) |
| 45 to 54 Years | 274 (94.8%) | 0 (0.0%) |
| 55 to 59 Years | 197 (62.5%) | 10 (5.1%) |
| 60 to 64 Years | 158 (49.8%) | 0 (0.0%) |
| 65 to 74 Years | 143 (36.4%) | 79 (55.2%) |
| 75 Years and over | 0 (0.0%) | 0 (0.0%) |
| Total | 2,406 (64.8%) | 185 (7.7%) |
Employment Status by Educational Attainment in Pascoag
According to labor force statistics for Pascoag, 78.3% of individuals (1,789) out of the total population between 25 and 64 years of age (2,285) are in the labor force, with 2.1% or 38 of them being unemployed. The group with the highest labor force participation rate are those with the educational attainment of college / associate degree, with 91.8% or 961 individuals in the labor force. Within the labor force, individuals with college / associate degree education have the highest percentage of unemployment, with 3.9% or 37 of them being unemployed.
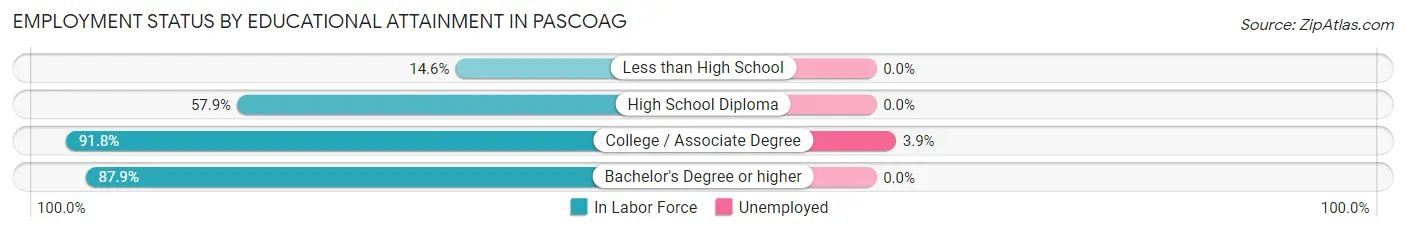
| Educational Attainment | In Labor Force | Unemployed |
| Less than High School | 13 (14.6%) | 0 (0.0%) |
| High School Diploma | 374 (57.9%) | 0 (0.0%) |
| College / Associate Degree | 961 (91.8%) | 41 (3.9%) |
| Bachelor's Degree or higher | 442 (87.9%) | 0 (0.0%) |
| Total | 1,789 (78.3%) | 48 (2.1%) |
Employment Occupations by Sex in Pascoag
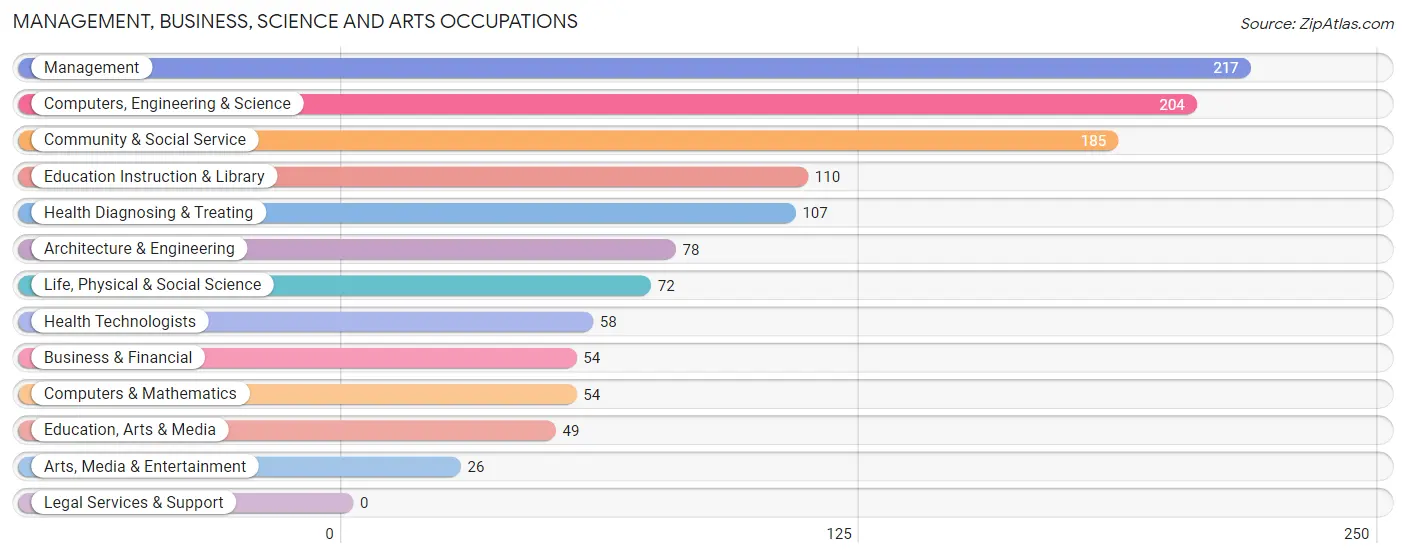
Management, Business, Science and Arts Occupations
The most common Management, Business, Science and Arts occupations in Pascoag are Management (217 | 10.0%), Computers, Engineering & Science (204 | 9.4%), Community & Social Service (185 | 8.5%), Education Instruction & Library (110 | 5.1%), and Health Diagnosing & Treating (107 | 4.9%).
Management, Business, Science and Arts Occupations by Sex
Within the Management, Business, Science and Arts occupations in Pascoag, the most male-oriented occupations are Architecture & Engineering (100.0%), Computers & Mathematics (74.1%), and Business & Financial (66.7%), while the most female-oriented occupations are Education, Arts & Media (100.0%), Health Technologists (100.0%), and Education Instruction & Library (85.5%).
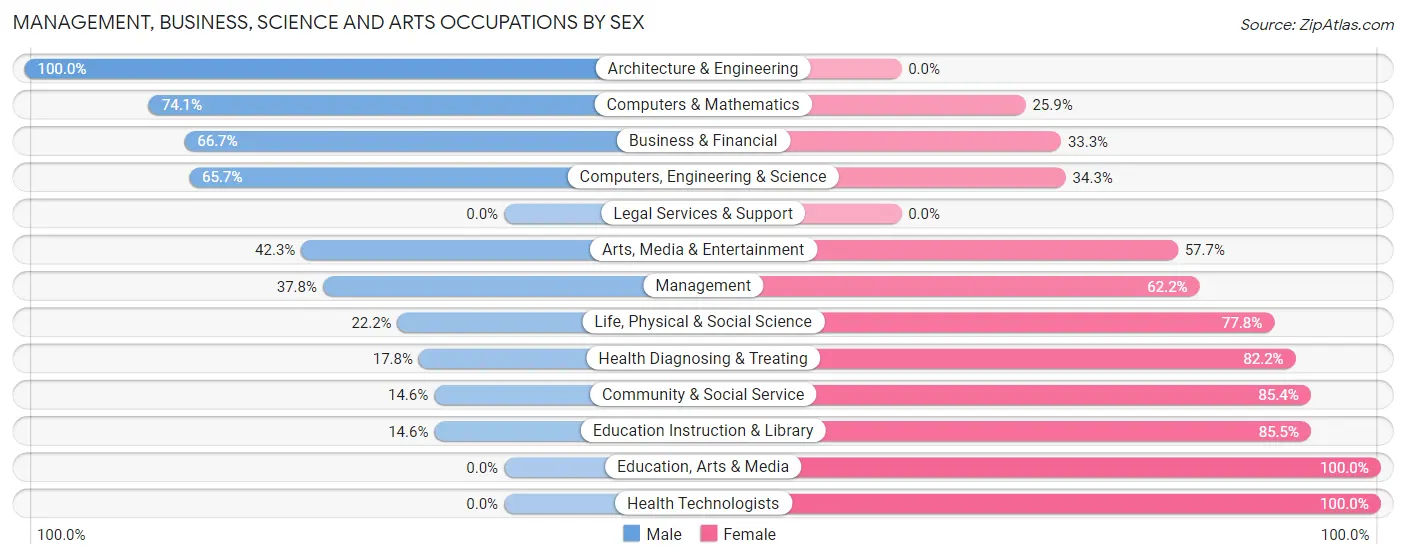
| Occupation | Male | Female |
| Management | 82 (37.8%) | 135 (62.2%) |
| Business & Financial | 36 (66.7%) | 18 (33.3%) |
| Computers, Engineering & Science | 134 (65.7%) | 70 (34.3%) |
| Computers & Mathematics | 40 (74.1%) | 14 (25.9%) |
| Architecture & Engineering | 78 (100.0%) | 0 (0.0%) |
| Life, Physical & Social Science | 16 (22.2%) | 56 (77.8%) |
| Community & Social Service | 27 (14.6%) | 158 (85.4%) |
| Education, Arts & Media | 0 (0.0%) | 49 (100.0%) |
| Legal Services & Support | 0 (0.0%) | 0 (0.0%) |
| Education Instruction & Library | 16 (14.5%) | 94 (85.5%) |
| Arts, Media & Entertainment | 11 (42.3%) | 15 (57.7%) |
| Health Diagnosing & Treating | 19 (17.8%) | 88 (82.2%) |
| Health Technologists | 0 (0.0%) | 58 (100.0%) |
| Total (Category) | 298 (38.9%) | 469 (61.2%) |
| Total (Overall) | 1,274 (58.8%) | 893 (41.2%) |
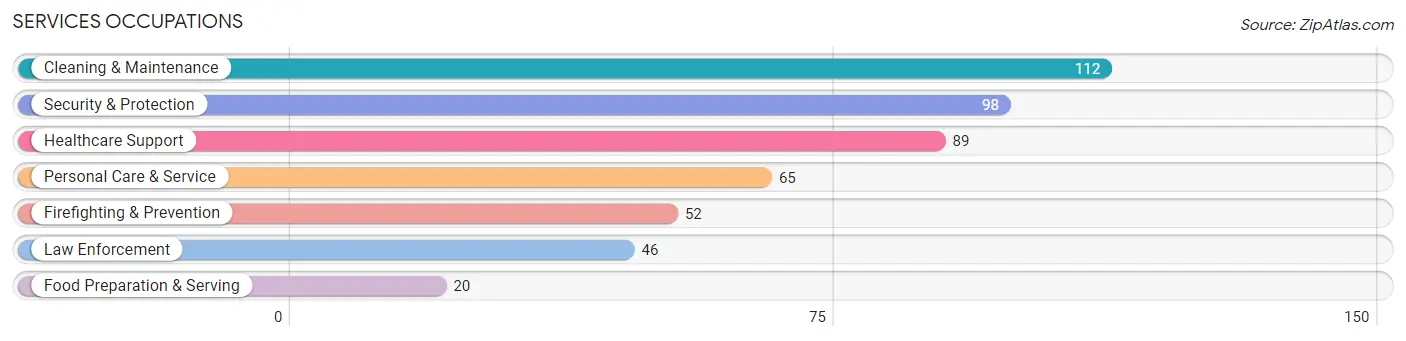
Services Occupations
The most common Services occupations in Pascoag are Cleaning & Maintenance (112 | 5.2%), Security & Protection (98 | 4.5%), Healthcare Support (89 | 4.1%), Personal Care & Service (65 | 3.0%), and Firefighting & Prevention (52 | 2.4%).
Services Occupations by Sex
Within the Services occupations in Pascoag, the most male-oriented occupations are Law Enforcement (100.0%), Security & Protection (84.7%), and Firefighting & Prevention (71.2%), while the most female-oriented occupations are Healthcare Support (100.0%), Food Preparation & Serving (100.0%), and Personal Care & Service (100.0%).
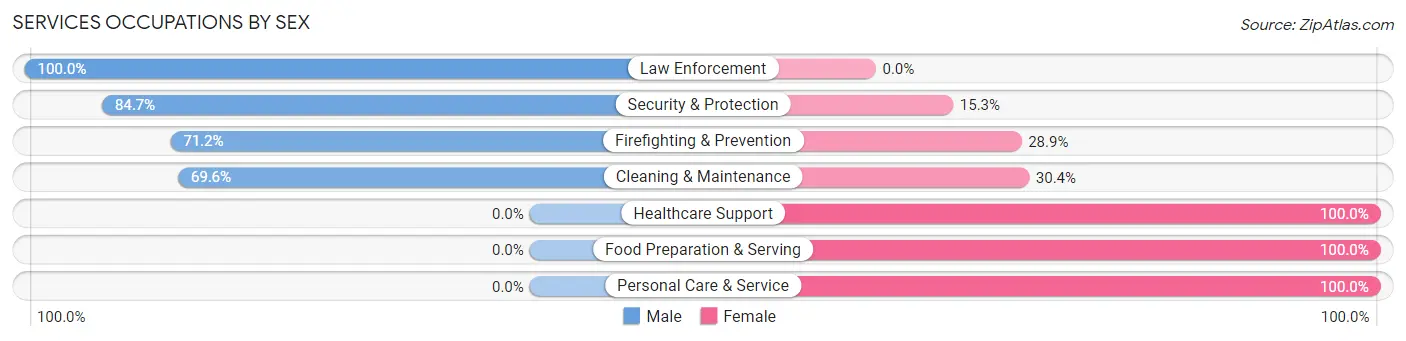
| Occupation | Male | Female |
| Healthcare Support | 0 (0.0%) | 89 (100.0%) |
| Security & Protection | 83 (84.7%) | 15 (15.3%) |
| Firefighting & Prevention | 37 (71.2%) | 15 (28.8%) |
| Law Enforcement | 46 (100.0%) | 0 (0.0%) |
| Food Preparation & Serving | 0 (0.0%) | 20 (100.0%) |
| Cleaning & Maintenance | 78 (69.6%) | 34 (30.4%) |
| Personal Care & Service | 0 (0.0%) | 65 (100.0%) |
| Total (Category) | 161 (41.9%) | 223 (58.1%) |
| Total (Overall) | 1,274 (58.8%) | 893 (41.2%) |
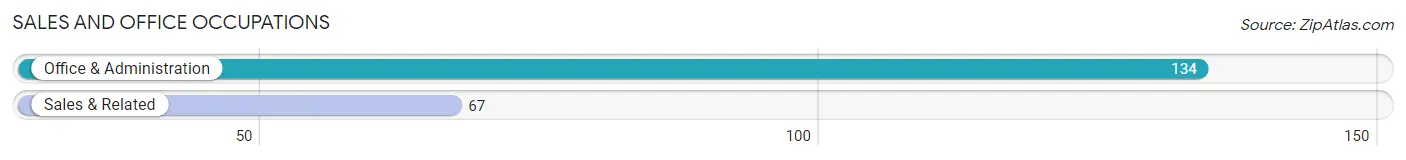
Sales and Office Occupations
The most common Sales and Office occupations in Pascoag are Office & Administration (134 | 6.2%), and Sales & Related (67 | 3.1%).
Sales and Office Occupations by Sex
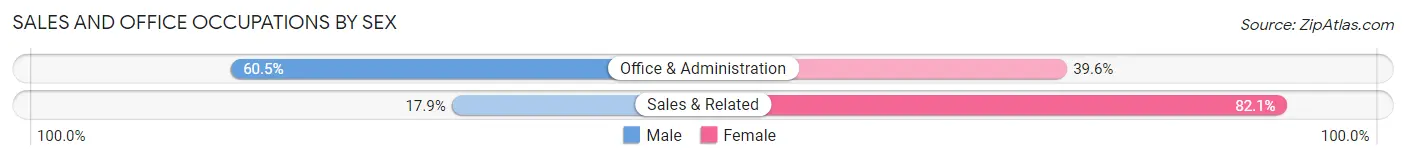
| Occupation | Male | Female |
| Sales & Related | 12 (17.9%) | 55 (82.1%) |
| Office & Administration | 81 (60.5%) | 53 (39.6%) |
| Total (Category) | 93 (46.3%) | 108 (53.7%) |
| Total (Overall) | 1,274 (58.8%) | 893 (41.2%) |
Natural Resources, Construction and Maintenance Occupations
The most common Natural Resources, Construction and Maintenance occupations in Pascoag are Construction & Extraction (334 | 15.4%), and Installation, Maintenance & Repair (88 | 4.1%).
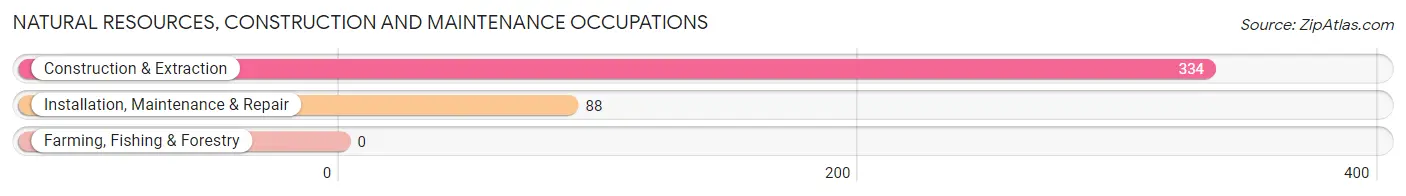
Natural Resources, Construction and Maintenance Occupations by Sex
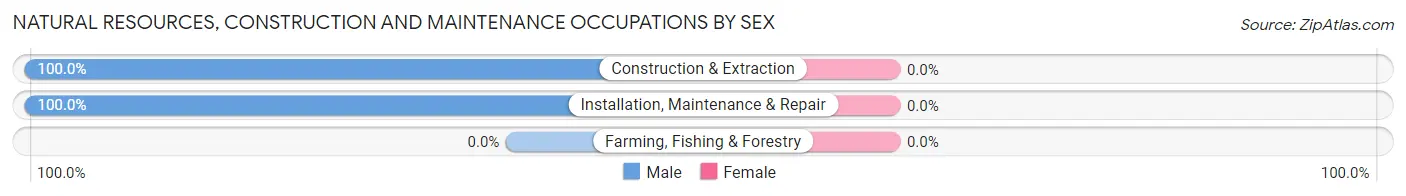
| Occupation | Male | Female |
| Farming, Fishing & Forestry | 0 (0.0%) | 0 (0.0%) |
| Construction & Extraction | 334 (100.0%) | 0 (0.0%) |
| Installation, Maintenance & Repair | 88 (100.0%) | 0 (0.0%) |
| Total (Category) | 422 (100.0%) | 0 (0.0%) |
| Total (Overall) | 1,274 (58.8%) | 893 (41.2%) |
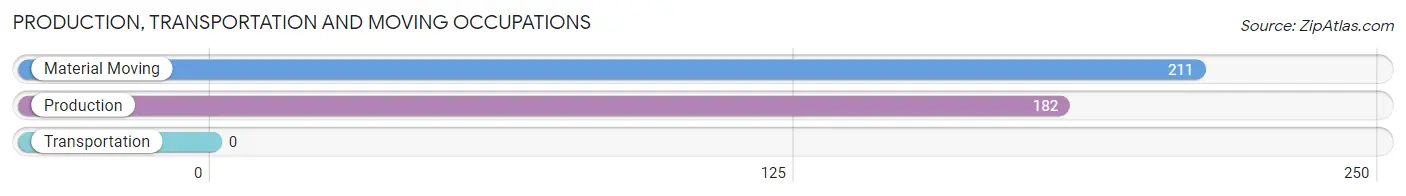
Production, Transportation and Moving Occupations
The most common Production, Transportation and Moving occupations in Pascoag are Material Moving (211 | 9.7%), and Production (182 | 8.4%).
Production, Transportation and Moving Occupations by Sex
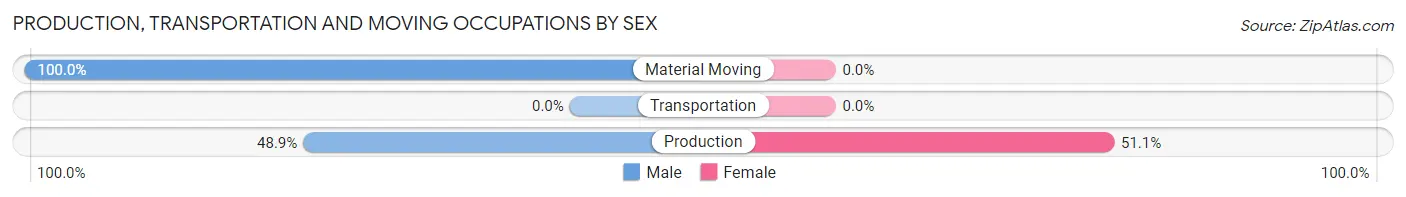
| Occupation | Male | Female |
| Production | 89 (48.9%) | 93 (51.1%) |
| Transportation | 0 (0.0%) | 0 (0.0%) |
| Material Moving | 211 (100.0%) | 0 (0.0%) |
| Total (Category) | 300 (76.3%) | 93 (23.7%) |
| Total (Overall) | 1,274 (58.8%) | 893 (41.2%) |
Employment Industries by Sex in Pascoag
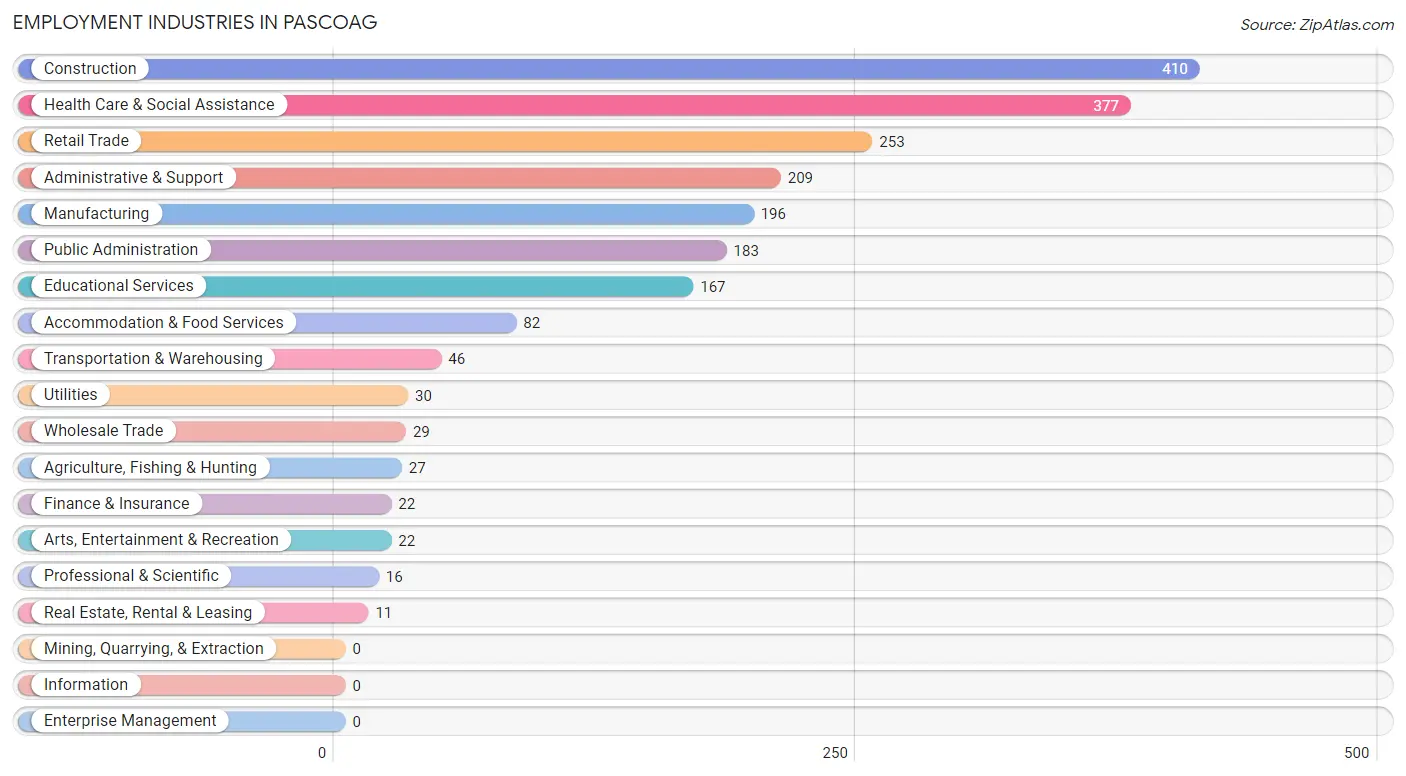
Employment Industries in Pascoag
The major employment industries in Pascoag include Construction (410 | 18.9%), Health Care & Social Assistance (377 | 17.4%), Retail Trade (253 | 11.7%), Administrative & Support (209 | 9.6%), and Manufacturing (196 | 9.0%).
Employment Industries by Sex in Pascoag
The Pascoag industries that see more men than women are Agriculture, Fishing & Hunting (100.0%), Construction (100.0%), and Utilities (100.0%), whereas the industries that tend to have a higher number of women are Wholesale Trade (100.0%), Finance & Insurance (100.0%), and Health Care & Social Assistance (95.0%).
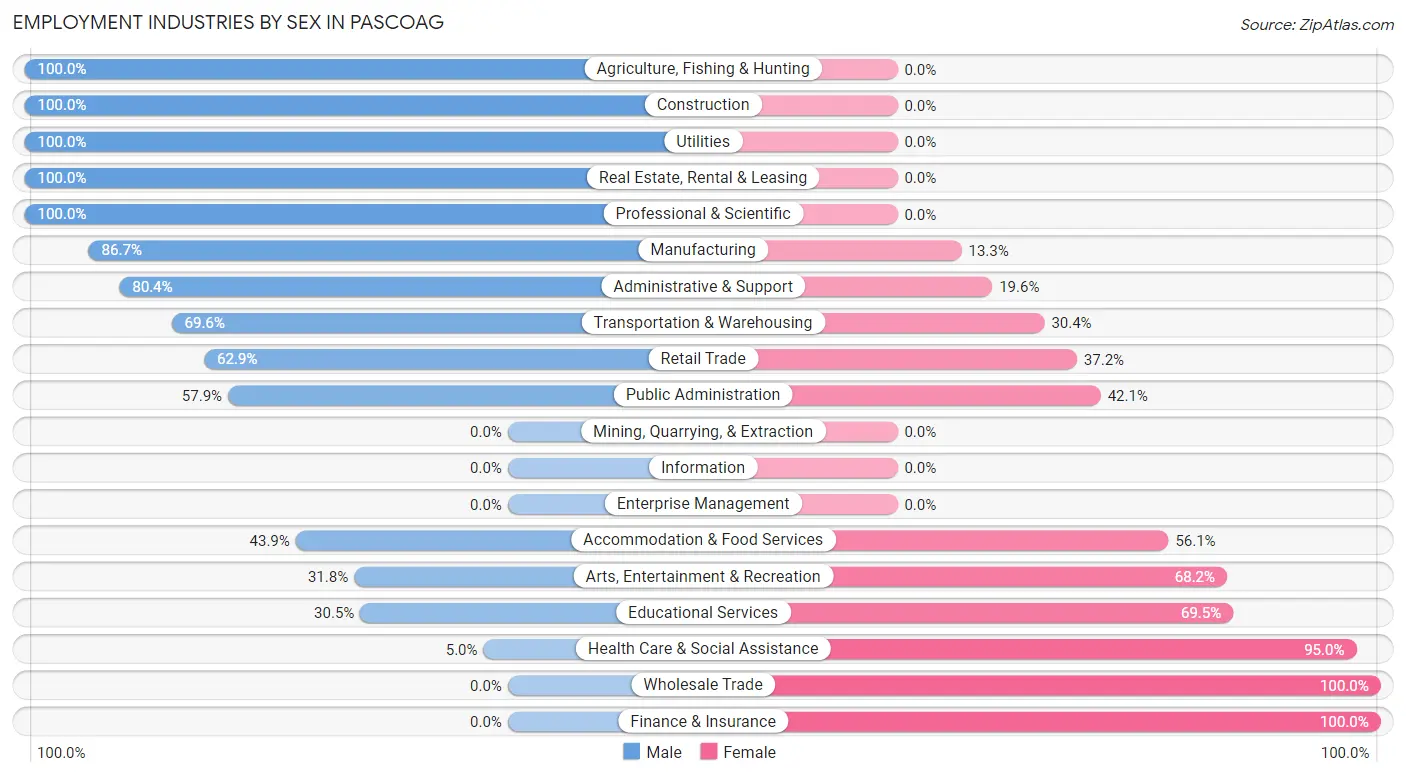
| Industry | Male | Female |
| Agriculture, Fishing & Hunting | 27 (100.0%) | 0 (0.0%) |
| Mining, Quarrying, & Extraction | 0 (0.0%) | 0 (0.0%) |
| Construction | 410 (100.0%) | 0 (0.0%) |
| Manufacturing | 170 (86.7%) | 26 (13.3%) |
| Wholesale Trade | 0 (0.0%) | 29 (100.0%) |
| Retail Trade | 159 (62.8%) | 94 (37.1%) |
| Transportation & Warehousing | 32 (69.6%) | 14 (30.4%) |
| Utilities | 30 (100.0%) | 0 (0.0%) |
| Information | 0 (0.0%) | 0 (0.0%) |
| Finance & Insurance | 0 (0.0%) | 22 (100.0%) |
| Real Estate, Rental & Leasing | 11 (100.0%) | 0 (0.0%) |
| Professional & Scientific | 16 (100.0%) | 0 (0.0%) |
| Enterprise Management | 0 (0.0%) | 0 (0.0%) |
| Administrative & Support | 168 (80.4%) | 41 (19.6%) |
| Educational Services | 51 (30.5%) | 116 (69.5%) |
| Health Care & Social Assistance | 19 (5.0%) | 358 (95.0%) |
| Arts, Entertainment & Recreation | 7 (31.8%) | 15 (68.2%) |
| Accommodation & Food Services | 36 (43.9%) | 46 (56.1%) |
| Public Administration | 106 (57.9%) | 77 (42.1%) |
| Total | 1,274 (58.8%) | 893 (41.2%) |
Education in Pascoag
School Enrollment in Pascoag
The most common levels of schooling among the 1,065 students in Pascoag are high school (461 | 43.3%), middle school (170 | 16.0%), and nursery / preschool (145 | 13.6%).
| School Level | # Students | % Students |
| Nursery / Preschool | 145 | 13.6% |
| Kindergarten | 40 | 3.8% |
| Elementary School | 140 | 13.2% |
| Middle School | 170 | 16.0% |
| High School | 461 | 43.3% |
| College / Undergraduate | 57 | 5.3% |
| Graduate / Professional | 52 | 4.9% |
| Total | 1,065 | 100.0% |
School Enrollment by Age by Funding Source in Pascoag
Out of a total of 1,065 students who are enrolled in schools in Pascoag, 62 (5.8%) attend a private institution, while the remaining 1,003 (94.2%) are enrolled in public schools. The age group of 35 years and over has the highest likelihood of being enrolled in private schools, with 14 (100.0% in the age bracket) enrolled. Conversely, the age group of 3 to 4 year olds has the lowest likelihood of being enrolled in a private school, with 138 (100.0% in the age bracket) attending a public institution.
| Age Bracket | Public School | Private School |
| 3 to 4 Year Olds | 138 (100.0%) | 0 (0.0%) |
| 5 to 9 Year Old | 91 (75.2%) | 30 (24.8%) |
| 10 to 14 Year Olds | 251 (100.0%) | 0 (0.0%) |
| 15 to 17 Year Olds | 255 (100.0%) | 0 (0.0%) |
| 18 to 19 Year Olds | 10 (100.0%) | 0 (0.0%) |
| 20 to 24 Year Olds | 40 (100.0%) | 0 (0.0%) |
| 25 to 34 Year Olds | 218 (92.4%) | 18 (7.6%) |
| 35 Years and over | 0 (0.0%) | 14 (100.0%) |
| Total | 1,003 (94.2%) | 62 (5.8%) |
Educational Attainment by Field of Study in Pascoag
Science & technology (150 | 19.8%), business (147 | 19.4%), social sciences (85 | 11.2%), arts & humanities (73 | 9.6%), and education (65 | 8.6%) are the most common fields of study among 758 individuals in Pascoag who have obtained a bachelor's degree or higher.
| Field of Study | # Graduates | % Graduates |
| Computers & Mathematics | 64 | 8.4% |
| Bio, Nature & Agricultural | 26 | 3.4% |
| Physical & Health Sciences | 30 | 4.0% |
| Psychology | 49 | 6.5% |
| Social Sciences | 85 | 11.2% |
| Engineering | 16 | 2.1% |
| Multidisciplinary Studies | 25 | 3.3% |
| Science & Technology | 150 | 19.8% |
| Business | 147 | 19.4% |
| Education | 65 | 8.6% |
| Literature & Languages | 17 | 2.2% |
| Liberal Arts & History | 0 | 0.0% |
| Visual & Performing Arts | 0 | 0.0% |
| Communications | 11 | 1.5% |
| Arts & Humanities | 73 | 9.6% |
| Total | 758 | 100.0% |
Transportation & Commute in Pascoag
Vehicle Availability by Sex in Pascoag
The most prevalent vehicle ownership categories in Pascoag are males with 2 vehicles (743, accounting for 56.5%) and females with 2 vehicles (521, making up 83.2%).
| Vehicles Available | Male | Female |
| No Vehicle | 166 (12.6%) | 0 (0.0%) |
| 1 Vehicle | 95 (7.2%) | 105 (11.8%) |
| 2 Vehicles | 743 (56.5%) | 521 (58.3%) |
| 3 Vehicles | 277 (21.0%) | 218 (24.4%) |
| 4 Vehicles | 35 (2.7%) | 35 (3.9%) |
| 5 or more Vehicles | 0 (0.0%) | 14 (1.6%) |
| Total | 1,316 (100.0%) | 893 (100.0%) |
Commute Time in Pascoag
The most frequently occuring commute durations in Pascoag are 45 to 59 minutes (358 commuters, 16.8%), 35 to 39 minutes (296 commuters, 13.9%), and 20 to 24 minutes (264 commuters, 12.4%).
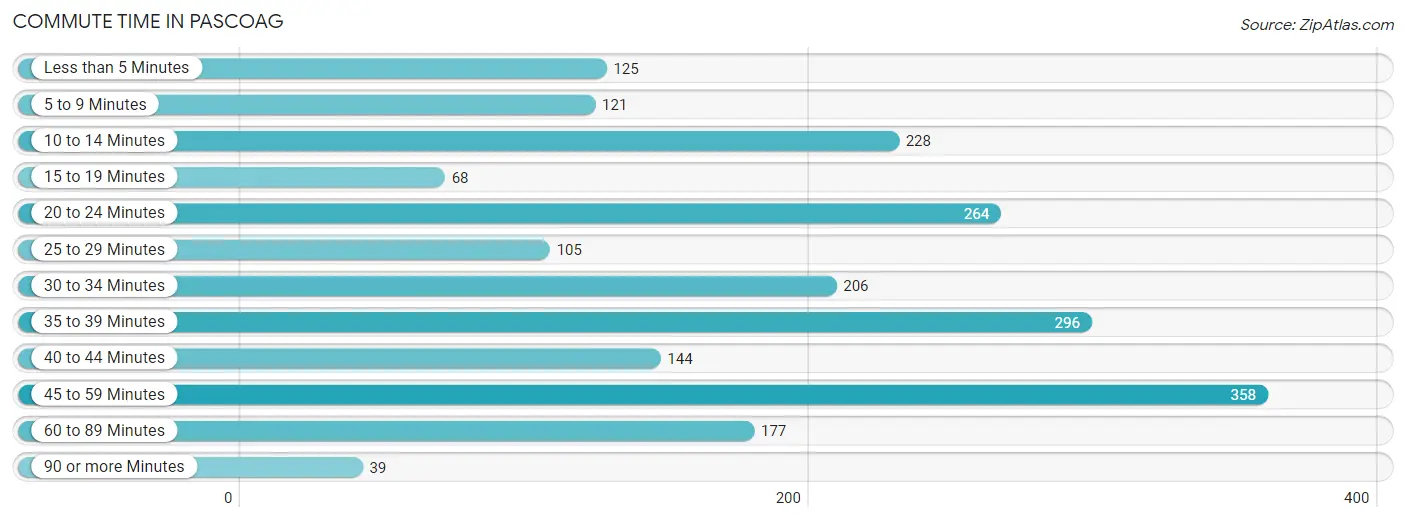
| Commute Time | # Commuters | % Commuters |
| Less than 5 Minutes | 125 | 5.9% |
| 5 to 9 Minutes | 121 | 5.7% |
| 10 to 14 Minutes | 228 | 10.7% |
| 15 to 19 Minutes | 68 | 3.2% |
| 20 to 24 Minutes | 264 | 12.4% |
| 25 to 29 Minutes | 105 | 4.9% |
| 30 to 34 Minutes | 206 | 9.7% |
| 35 to 39 Minutes | 296 | 13.9% |
| 40 to 44 Minutes | 144 | 6.8% |
| 45 to 59 Minutes | 358 | 16.8% |
| 60 to 89 Minutes | 177 | 8.3% |
| 90 or more Minutes | 39 | 1.8% |
Commute Time by Sex in Pascoag
The most common commute times in Pascoag are 45 to 59 minutes (293 commuters, 23.2%) for males and 35 to 39 minutes (171 commuters, 19.7%) for females.
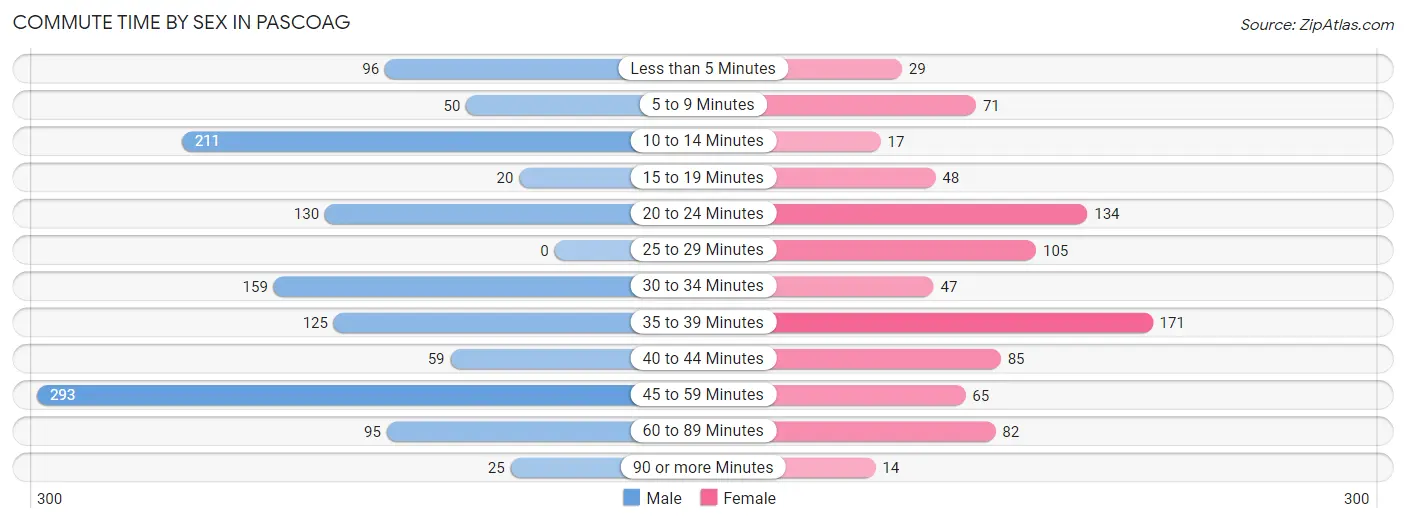
| Commute Time | Male | Female |
| Less than 5 Minutes | 96 (7.6%) | 29 (3.3%) |
| 5 to 9 Minutes | 50 (4.0%) | 71 (8.2%) |
| 10 to 14 Minutes | 211 (16.7%) | 17 (2.0%) |
| 15 to 19 Minutes | 20 (1.6%) | 48 (5.5%) |
| 20 to 24 Minutes | 130 (10.3%) | 134 (15.4%) |
| 25 to 29 Minutes | 0 (0.0%) | 105 (12.1%) |
| 30 to 34 Minutes | 159 (12.6%) | 47 (5.4%) |
| 35 to 39 Minutes | 125 (9.9%) | 171 (19.7%) |
| 40 to 44 Minutes | 59 (4.7%) | 85 (9.8%) |
| 45 to 59 Minutes | 293 (23.2%) | 65 (7.5%) |
| 60 to 89 Minutes | 95 (7.5%) | 82 (9.5%) |
| 90 or more Minutes | 25 (2.0%) | 14 (1.6%) |
Time of Departure to Work by Sex in Pascoag
The most frequent times of departure to work in Pascoag are 6:00 AM to 6:29 AM (368, 29.1%) for males and 7:30 AM to 7:59 AM (155, 17.9%) for females.
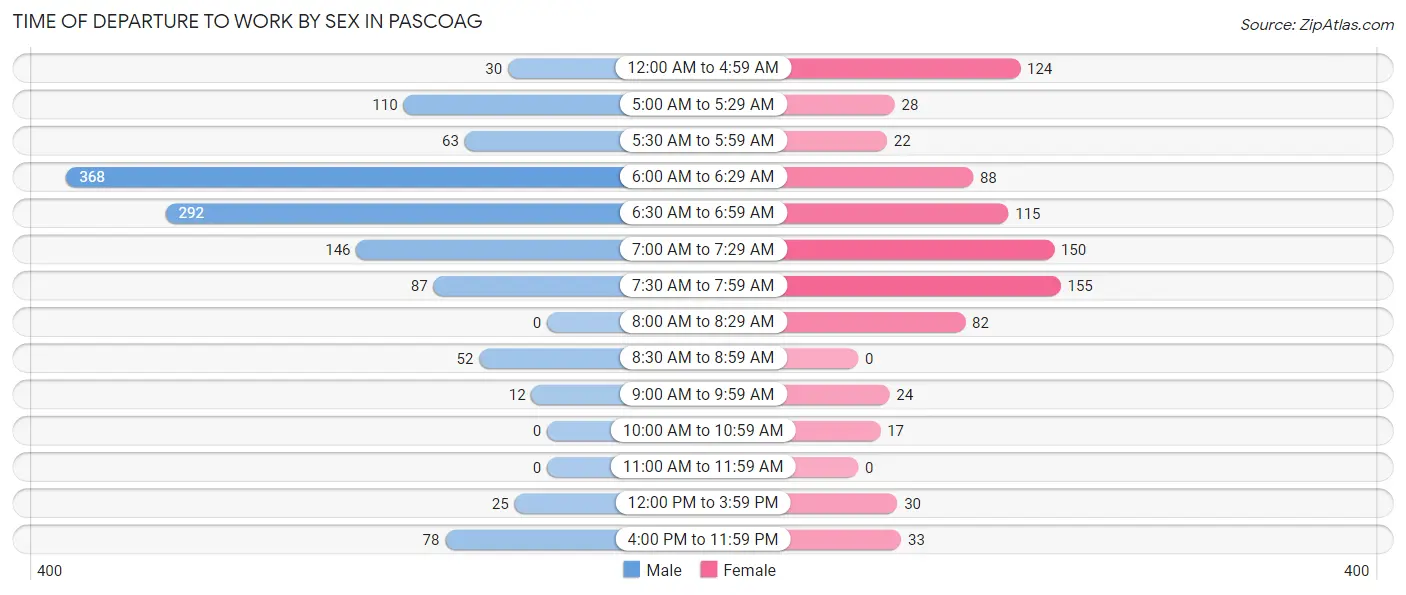
| Time of Departure | Male | Female |
| 12:00 AM to 4:59 AM | 30 (2.4%) | 124 (14.3%) |
| 5:00 AM to 5:29 AM | 110 (8.7%) | 28 (3.2%) |
| 5:30 AM to 5:59 AM | 63 (5.0%) | 22 (2.5%) |
| 6:00 AM to 6:29 AM | 368 (29.1%) | 88 (10.1%) |
| 6:30 AM to 6:59 AM | 292 (23.1%) | 115 (13.3%) |
| 7:00 AM to 7:29 AM | 146 (11.6%) | 150 (17.3%) |
| 7:30 AM to 7:59 AM | 87 (6.9%) | 155 (17.9%) |
| 8:00 AM to 8:29 AM | 0 (0.0%) | 82 (9.5%) |
| 8:30 AM to 8:59 AM | 52 (4.1%) | 0 (0.0%) |
| 9:00 AM to 9:59 AM | 12 (0.9%) | 24 (2.8%) |
| 10:00 AM to 10:59 AM | 0 (0.0%) | 17 (2.0%) |
| 11:00 AM to 11:59 AM | 0 (0.0%) | 0 (0.0%) |
| 12:00 PM to 3:59 PM | 25 (2.0%) | 30 (3.5%) |
| 4:00 PM to 11:59 PM | 78 (6.2%) | 33 (3.8%) |
| Total | 1,263 (100.0%) | 868 (100.0%) |
Housing Occupancy in Pascoag
Occupancy by Ownership in Pascoag
Of the total 1,524 dwellings in Pascoag, owner-occupied units account for 959 (62.9%), while renter-occupied units make up 565 (37.1%).
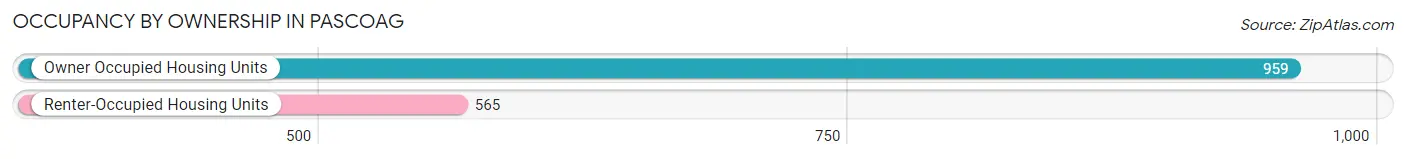
| Occupancy | # Housing Units | % Housing Units |
| Owner Occupied Housing Units | 959 | 62.9% |
| Renter-Occupied Housing Units | 565 | 37.1% |
| Total Occupied Housing Units | 1,524 | 100.0% |
Occupancy by Household Size in Pascoag
| Household Size | # Housing Units | % Housing Units |
| 1-Person Household | 289 | 19.0% |
| 2-Person Household | 535 | 35.1% |
| 3-Person Household | 291 | 19.1% |
| 4+ Person Household | 409 | 26.8% |
| Total Housing Units | 1,524 | 100.0% |
Occupancy by Ownership by Household Size in Pascoag
| Household Size | Owner-occupied | Renter-occupied |
| 1-Person Household | 148 (51.2%) | 141 (48.8%) |
| 2-Person Household | 334 (62.4%) | 201 (37.6%) |
| 3-Person Household | 189 (64.9%) | 102 (35.0%) |
| 4+ Person Household | 288 (70.4%) | 121 (29.6%) |
| Total Housing Units | 959 (62.9%) | 565 (37.1%) |
Occupancy by Educational Attainment in Pascoag
| Household Size | Owner-occupied | Renter-occupied |
| Less than High School | 32 (37.7%) | 53 (62.4%) |
| High School Diploma | 235 (50.9%) | 227 (49.1%) |
| College/Associate Degree | 312 (56.9%) | 236 (43.1%) |
| Bachelor's Degree or higher | 380 (88.6%) | 49 (11.4%) |
Occupancy by Age of Householder in Pascoag
| Age Bracket | # Households | % Households |
| Under 35 Years | 325 | 21.3% |
| 35 to 44 Years | 384 | 25.2% |
| 45 to 54 Years | 242 | 15.9% |
| 55 to 64 Years | 281 | 18.4% |
| 65 to 74 Years | 168 | 11.0% |
| 75 to 84 Years | 91 | 6.0% |
| 85 Years and Over | 33 | 2.2% |
| Total | 1,524 | 100.0% |
Housing Finances in Pascoag
Median Income by Occupancy in Pascoag
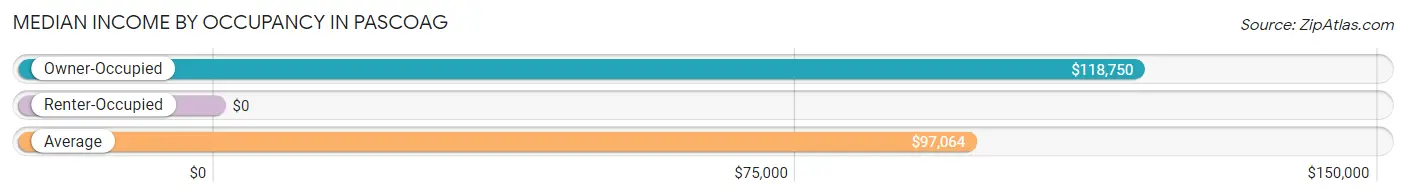
| Occupancy Type | # Households | Median Income |
| Owner-Occupied | 959 (62.9%) | $118,750 |
| Renter-Occupied | 565 (37.1%) | $0 |
| Average | 1,524 (100.0%) | $97,064 |
Occupancy by Householder Income Bracket in Pascoag
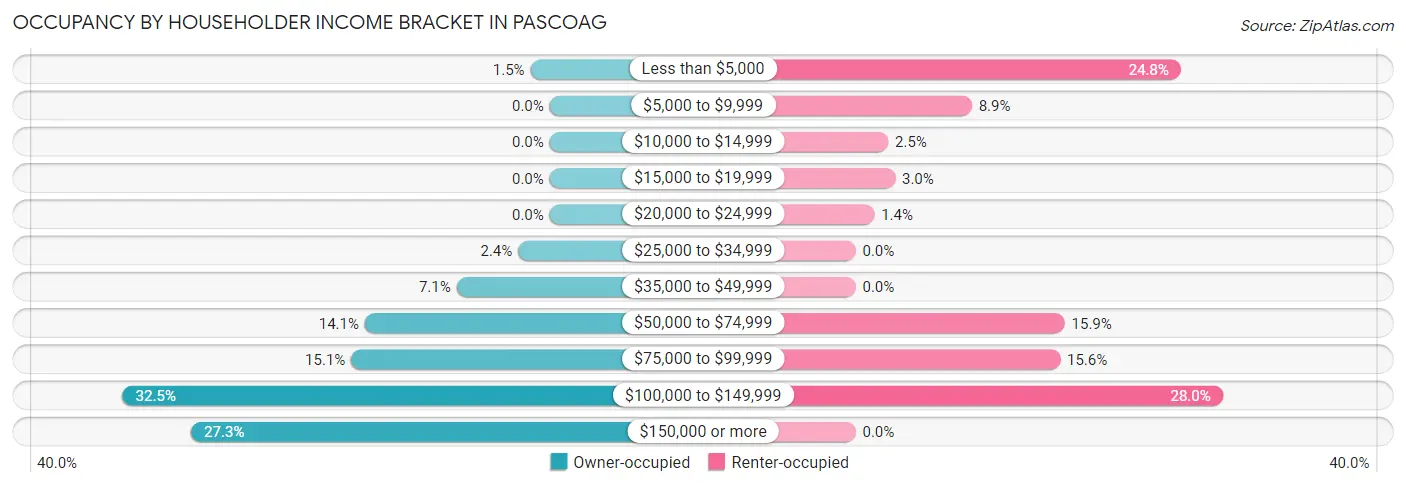
| Income Bracket | Owner-occupied | Renter-occupied |
| Less than $5,000 | 14 (1.5%) | 140 (24.8%) |
| $5,000 to $9,999 | 0 (0.0%) | 50 (8.8%) |
| $10,000 to $14,999 | 0 (0.0%) | 14 (2.5%) |
| $15,000 to $19,999 | 0 (0.0%) | 17 (3.0%) |
| $20,000 to $24,999 | 0 (0.0%) | 8 (1.4%) |
| $25,000 to $34,999 | 23 (2.4%) | 0 (0.0%) |
| $35,000 to $49,999 | 68 (7.1%) | 0 (0.0%) |
| $50,000 to $74,999 | 135 (14.1%) | 90 (15.9%) |
| $75,000 to $99,999 | 145 (15.1%) | 88 (15.6%) |
| $100,000 to $149,999 | 312 (32.5%) | 158 (28.0%) |
| $150,000 or more | 262 (27.3%) | 0 (0.0%) |
| Total | 959 (100.0%) | 565 (100.0%) |
Monthly Housing Cost Tiers in Pascoag
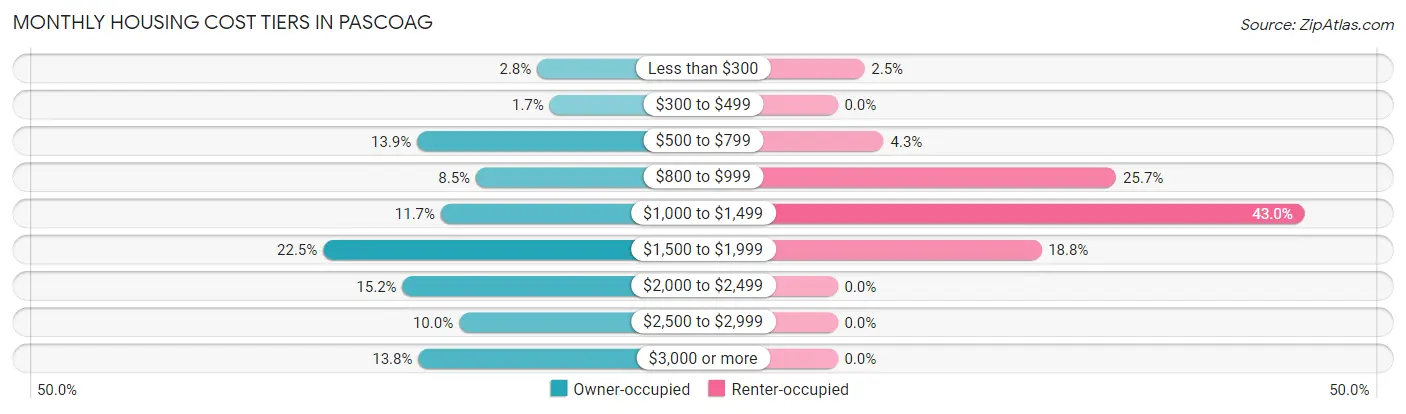
| Monthly Cost | Owner-occupied | Renter-occupied |
| Less than $300 | 27 (2.8%) | 14 (2.5%) |
| $300 to $499 | 16 (1.7%) | 0 (0.0%) |
| $500 to $799 | 133 (13.9%) | 24 (4.3%) |
| $800 to $999 | 81 (8.5%) | 145 (25.7%) |
| $1,000 to $1,499 | 112 (11.7%) | 243 (43.0%) |
| $1,500 to $1,999 | 216 (22.5%) | 106 (18.8%) |
| $2,000 to $2,499 | 146 (15.2%) | 0 (0.0%) |
| $2,500 to $2,999 | 96 (10.0%) | 0 (0.0%) |
| $3,000 or more | 132 (13.8%) | 0 (0.0%) |
| Total | 959 (100.0%) | 565 (100.0%) |
Physical Housing Characteristics in Pascoag
Housing Structures in Pascoag
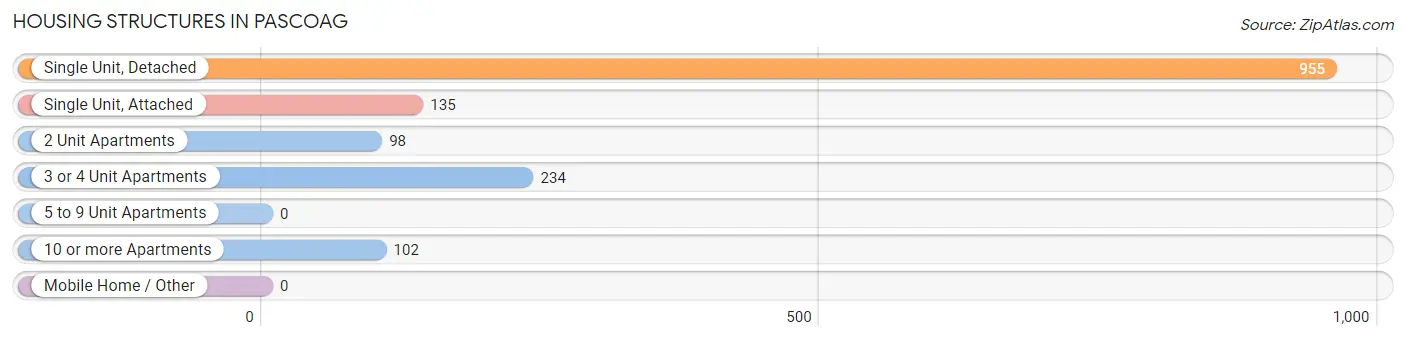
| Structure Type | # Housing Units | % Housing Units |
| Single Unit, Detached | 955 | 62.7% |
| Single Unit, Attached | 135 | 8.9% |
| 2 Unit Apartments | 98 | 6.4% |
| 3 or 4 Unit Apartments | 234 | 15.3% |
| 5 to 9 Unit Apartments | 0 | 0.0% |
| 10 or more Apartments | 102 | 6.7% |
| Mobile Home / Other | 0 | 0.0% |
| Total | 1,524 | 100.0% |
Housing Structures by Occupancy in Pascoag
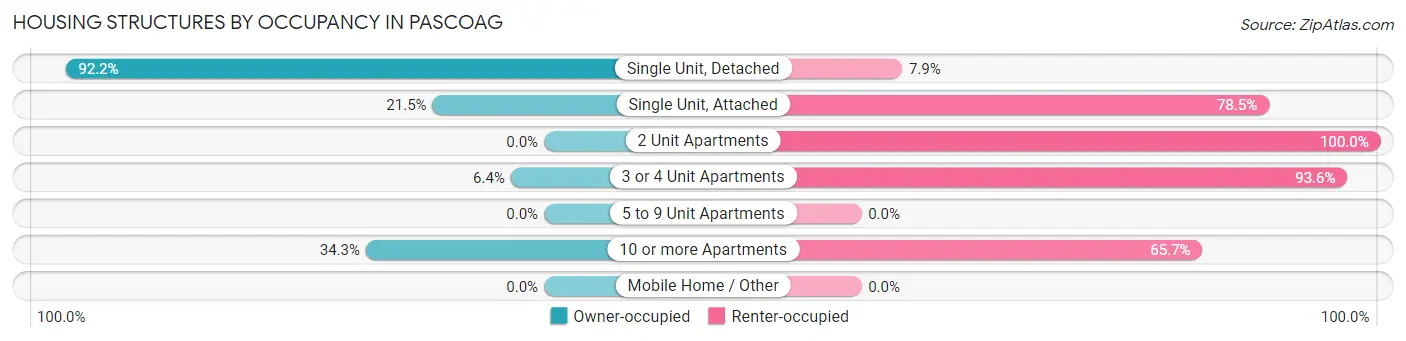
| Structure Type | Owner-occupied | Renter-occupied |
| Single Unit, Detached | 880 (92.1%) | 75 (7.9%) |
| Single Unit, Attached | 29 (21.5%) | 106 (78.5%) |
| 2 Unit Apartments | 0 (0.0%) | 98 (100.0%) |
| 3 or 4 Unit Apartments | 15 (6.4%) | 219 (93.6%) |
| 5 to 9 Unit Apartments | 0 (0.0%) | 0 (0.0%) |
| 10 or more Apartments | 35 (34.3%) | 67 (65.7%) |
| Mobile Home / Other | 0 (0.0%) | 0 (0.0%) |
| Total | 959 (62.9%) | 565 (37.1%) |
Housing Structures by Number of Rooms in Pascoag
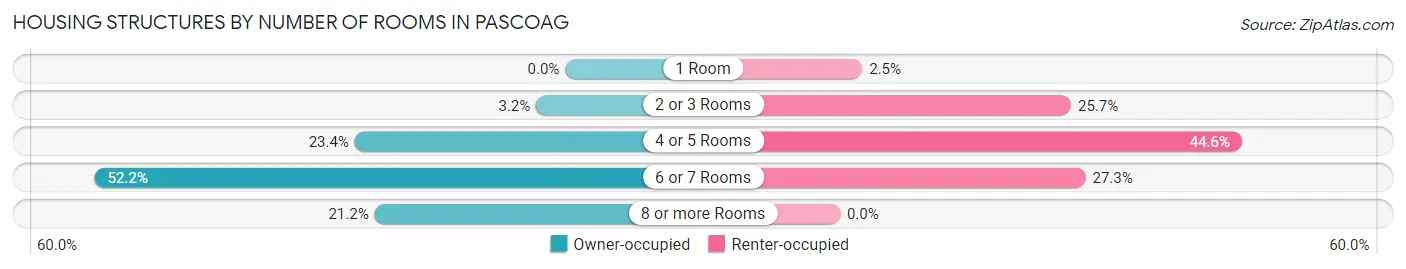
| Number of Rooms | Owner-occupied | Renter-occupied |
| 1 Room | 0 (0.0%) | 14 (2.5%) |
| 2 or 3 Rooms | 31 (3.2%) | 145 (25.7%) |
| 4 or 5 Rooms | 224 (23.4%) | 252 (44.6%) |
| 6 or 7 Rooms | 501 (52.2%) | 154 (27.3%) |
| 8 or more Rooms | 203 (21.2%) | 0 (0.0%) |
| Total | 959 (100.0%) | 565 (100.0%) |
Housing Structure by Heating Type in Pascoag
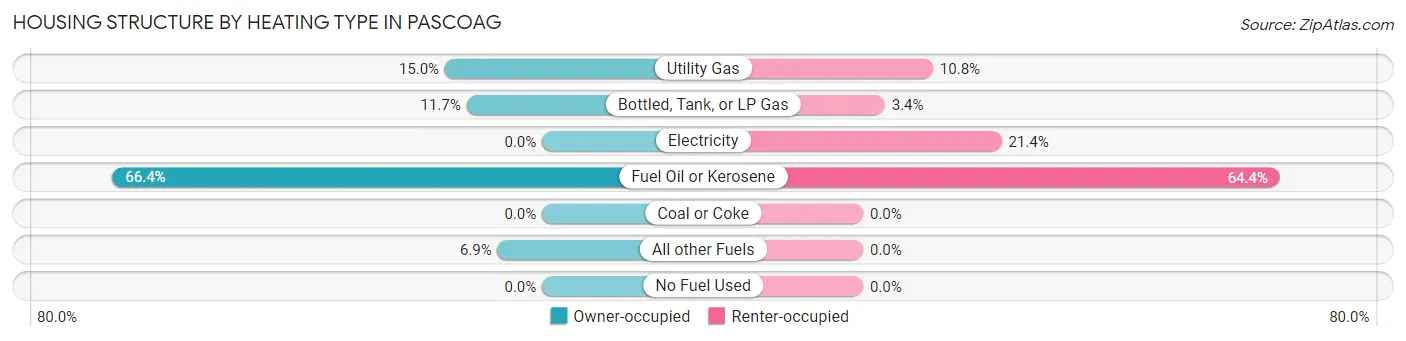
| Heating Type | Owner-occupied | Renter-occupied |
| Utility Gas | 144 (15.0%) | 61 (10.8%) |
| Bottled, Tank, or LP Gas | 112 (11.7%) | 19 (3.4%) |
| Electricity | 0 (0.0%) | 121 (21.4%) |
| Fuel Oil or Kerosene | 637 (66.4%) | 364 (64.4%) |
| Coal or Coke | 0 (0.0%) | 0 (0.0%) |
| All other Fuels | 66 (6.9%) | 0 (0.0%) |
| No Fuel Used | 0 (0.0%) | 0 (0.0%) |
| Total | 959 (100.0%) | 565 (100.0%) |
Household Vehicle Usage in Pascoag
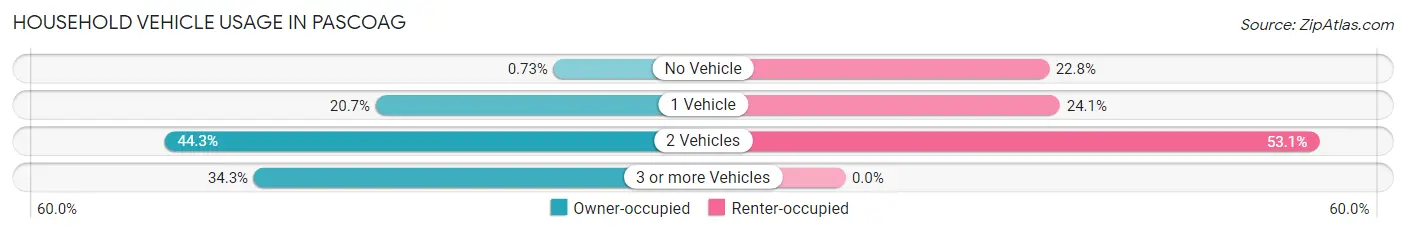
| Vehicles per Household | Owner-occupied | Renter-occupied |
| No Vehicle | 7 (0.7%) | 129 (22.8%) |
| 1 Vehicle | 198 (20.6%) | 136 (24.1%) |
| 2 Vehicles | 425 (44.3%) | 300 (53.1%) |
| 3 or more Vehicles | 329 (34.3%) | 0 (0.0%) |
| Total | 959 (100.0%) | 565 (100.0%) |
Real Estate & Mortgages in Pascoag
Real Estate and Mortgage Overview in Pascoag
| Characteristic | Without Mortgage | With Mortgage |
| Housing Units | 221 | 738 |
| Median Property Value | $248,000 | $308,400 |
| Median Household Income | $75,184 | $250 |
| Monthly Housing Costs | $676 | $132 |
| Real Estate Taxes | $3,756 | $0 |
Property Value by Mortgage Status in Pascoag
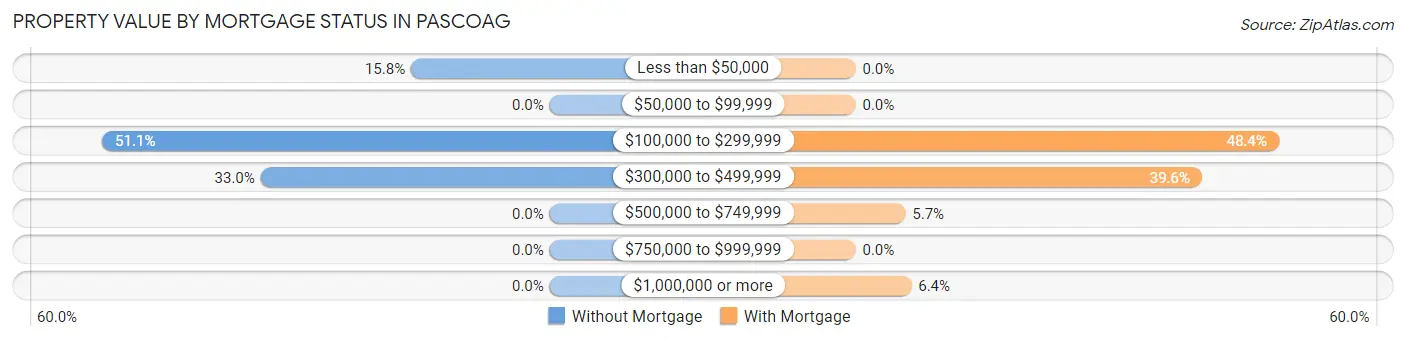
| Property Value | Without Mortgage | With Mortgage |
| Less than $50,000 | 35 (15.8%) | 0 (0.0%) |
| $50,000 to $99,999 | 0 (0.0%) | 0 (0.0%) |
| $100,000 to $299,999 | 113 (51.1%) | 357 (48.4%) |
| $300,000 to $499,999 | 73 (33.0%) | 292 (39.6%) |
| $500,000 to $749,999 | 0 (0.0%) | 42 (5.7%) |
| $750,000 to $999,999 | 0 (0.0%) | 0 (0.0%) |
| $1,000,000 or more | 0 (0.0%) | 47 (6.4%) |
| Total | 221 (100.0%) | 738 (100.0%) |
Household Income by Mortgage Status in Pascoag
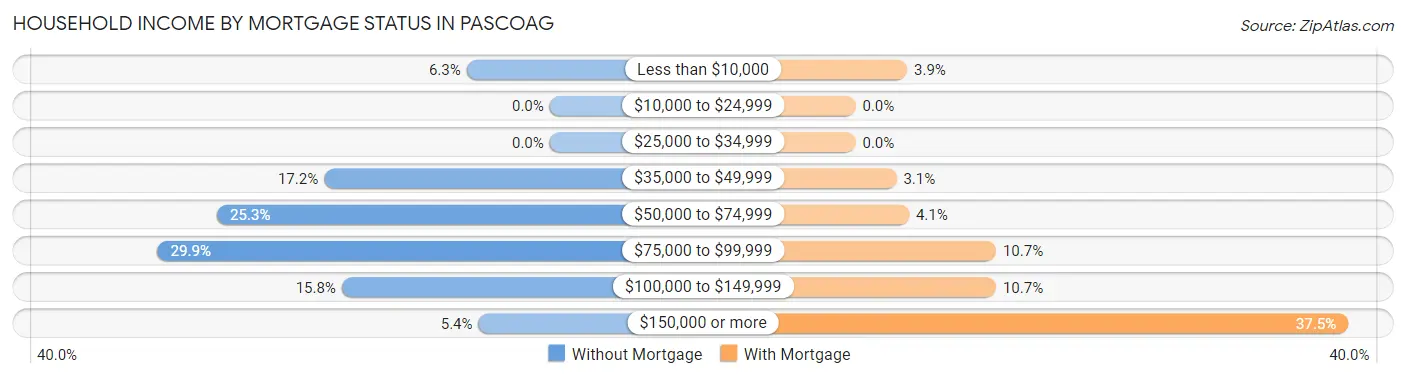
| Household Income | Without Mortgage | With Mortgage |
| Less than $10,000 | 14 (6.3%) | 29 (3.9%) |
| $10,000 to $24,999 | 0 (0.0%) | 0 (0.0%) |
| $25,000 to $34,999 | 0 (0.0%) | 0 (0.0%) |
| $35,000 to $49,999 | 38 (17.2%) | 23 (3.1%) |
| $50,000 to $74,999 | 56 (25.3%) | 30 (4.1%) |
| $75,000 to $99,999 | 66 (29.9%) | 79 (10.7%) |
| $100,000 to $149,999 | 35 (15.8%) | 79 (10.7%) |
| $150,000 or more | 12 (5.4%) | 277 (37.5%) |
| Total | 221 (100.0%) | 738 (100.0%) |
Property Value to Household Income Ratio in Pascoag
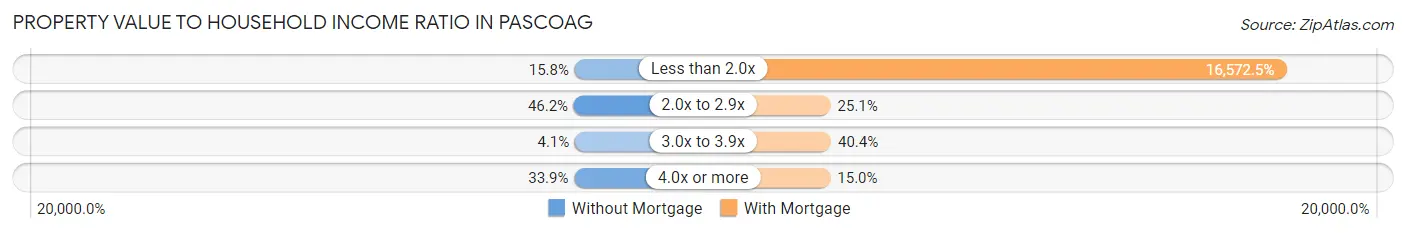
| Value-to-Income Ratio | Without Mortgage | With Mortgage |
| Less than 2.0x | 35 (15.8%) | 122,305 (16,572.5%) |
| 2.0x to 2.9x | 102 (46.2%) | 185 (25.1%) |
| 3.0x to 3.9x | 9 (4.1%) | 298 (40.4%) |
| 4.0x or more | 75 (33.9%) | 111 (15.0%) |
| Total | 221 (100.0%) | 738 (100.0%) |
Real Estate Taxes by Mortgage Status in Pascoag
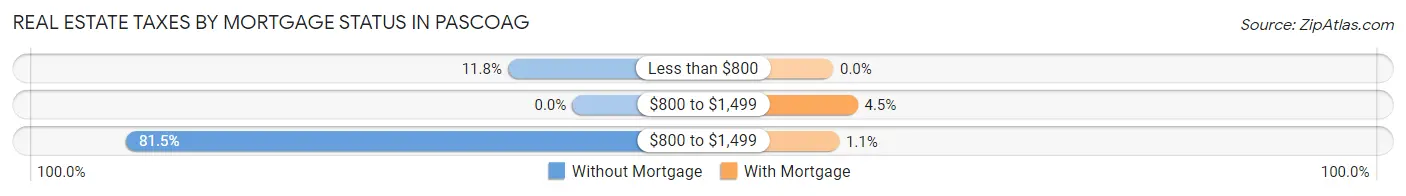
| Property Taxes | Without Mortgage | With Mortgage |
| Less than $800 | 26 (11.8%) | 0 (0.0%) |
| $800 to $1,499 | 0 (0.0%) | 33 (4.5%) |
| $800 to $1,499 | 180 (81.5%) | 8 (1.1%) |
| Total | 221 (100.0%) | 738 (100.0%) |
Health & Disability in Pascoag
Health Insurance Coverage by Age in Pascoag
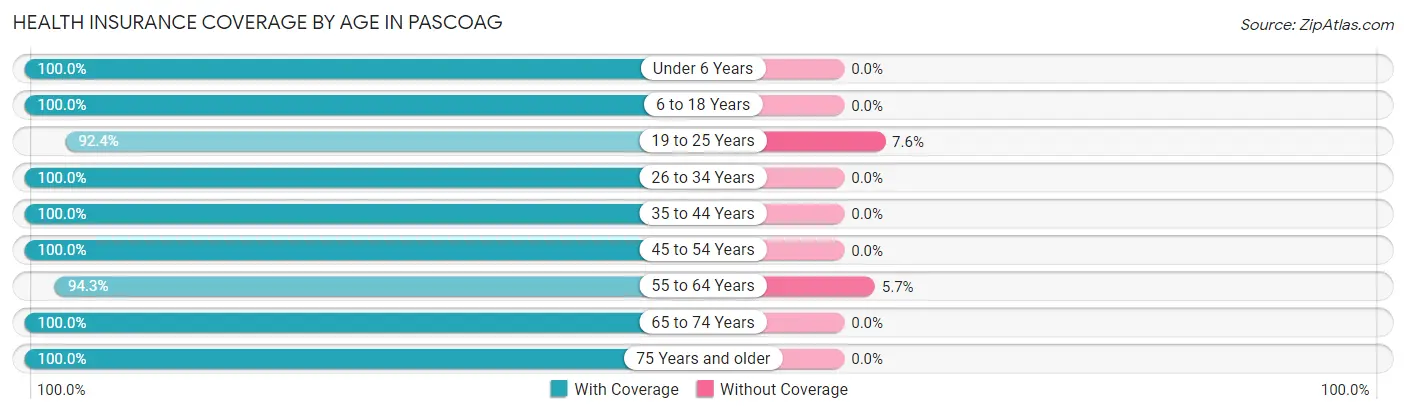
| Age Bracket | With Coverage | Without Coverage |
| Under 6 Years | 433 (100.0%) | 0 (0.0%) |
| 6 to 18 Years | 670 (100.0%) | 0 (0.0%) |
| 19 to 25 Years | 485 (92.4%) | 40 (7.6%) |
| 26 to 34 Years | 602 (100.0%) | 0 (0.0%) |
| 35 to 44 Years | 612 (100.0%) | 0 (0.0%) |
| 45 to 54 Years | 275 (100.0%) | 0 (0.0%) |
| 55 to 64 Years | 564 (94.3%) | 34 (5.7%) |
| 65 to 74 Years | 352 (100.0%) | 0 (0.0%) |
| 75 Years and older | 201 (100.0%) | 0 (0.0%) |
| Total | 4,194 (98.3%) | 74 (1.7%) |
Health Insurance Coverage by Citizenship Status in Pascoag
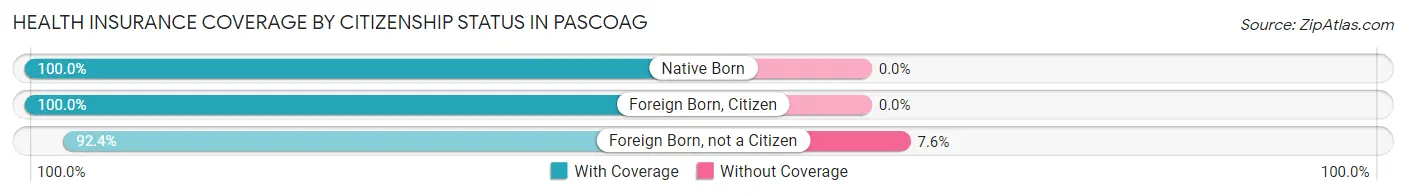
| Citizenship Status | With Coverage | Without Coverage |
| Native Born | 433 (100.0%) | 0 (0.0%) |
| Foreign Born, Citizen | 670 (100.0%) | 0 (0.0%) |
| Foreign Born, not a Citizen | 485 (92.4%) | 40 (7.6%) |
Health Insurance Coverage by Household Income in Pascoag
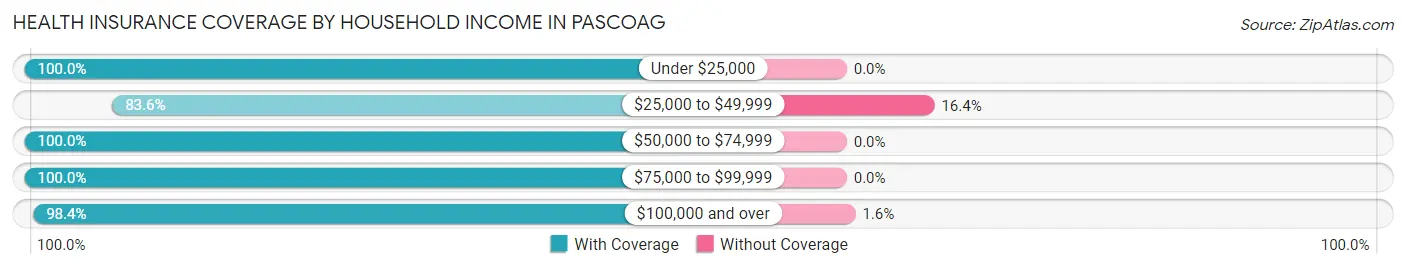
| Household Income | With Coverage | Without Coverage |
| Under $25,000 | 620 (100.0%) | 0 (0.0%) |
| $25,000 to $49,999 | 173 (83.6%) | 34 (16.4%) |
| $50,000 to $74,999 | 509 (100.0%) | 0 (0.0%) |
| $75,000 to $99,999 | 457 (100.0%) | 0 (0.0%) |
| $100,000 and over | 2,435 (98.4%) | 40 (1.6%) |
Public vs Private Health Insurance Coverage by Age in Pascoag
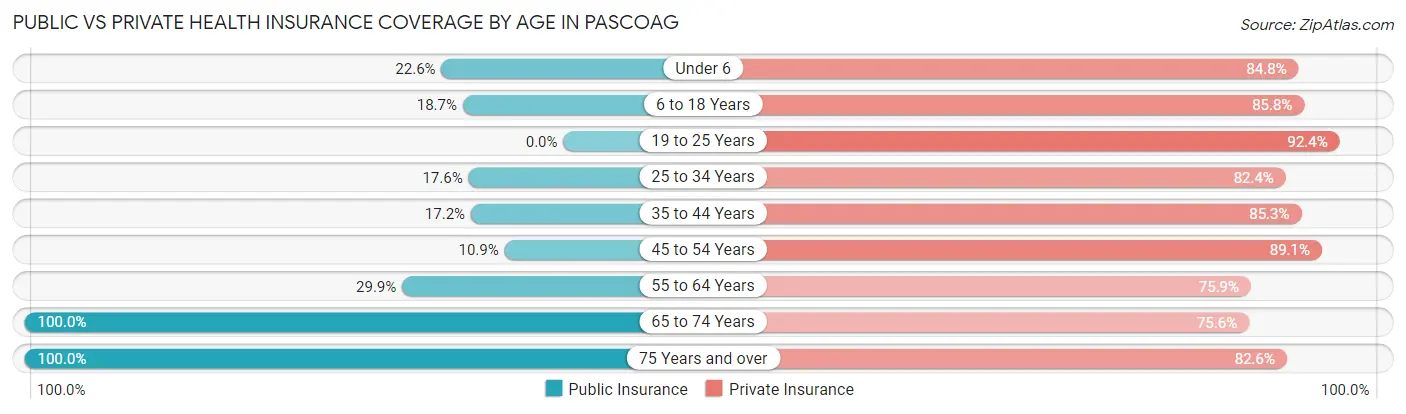
| Age Bracket | Public Insurance | Private Insurance |
| Under 6 | 98 (22.6%) | 367 (84.8%) |
| 6 to 18 Years | 125 (18.7%) | 575 (85.8%) |
| 19 to 25 Years | 0 (0.0%) | 485 (92.4%) |
| 25 to 34 Years | 106 (17.6%) | 496 (82.4%) |
| 35 to 44 Years | 105 (17.2%) | 522 (85.3%) |
| 45 to 54 Years | 30 (10.9%) | 245 (89.1%) |
| 55 to 64 Years | 179 (29.9%) | 454 (75.9%) |
| 65 to 74 Years | 352 (100.0%) | 266 (75.6%) |
| 75 Years and over | 201 (100.0%) | 166 (82.6%) |
| Total | 1,196 (28.0%) | 3,576 (83.8%) |
Disability Status by Sex by Age in Pascoag
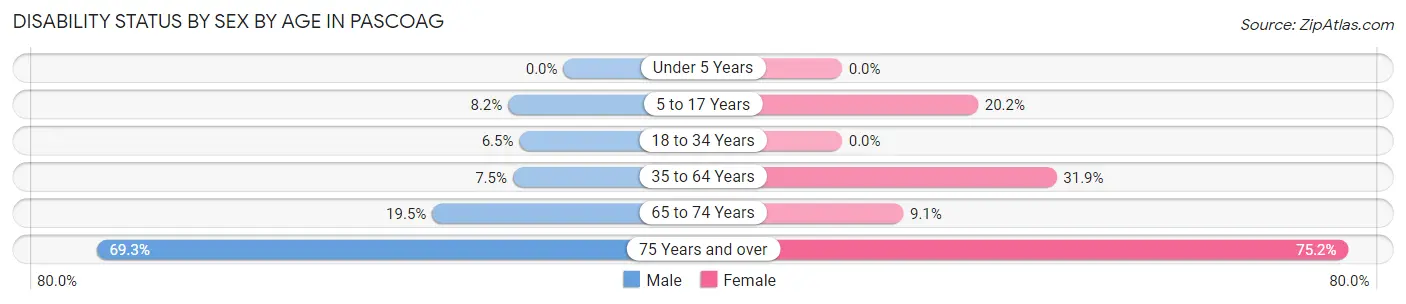
| Age Bracket | Male | Female |
| Under 5 Years | 0 (0.0%) | 0 (0.0%) |
| 5 to 17 Years | 36 (8.2%) | 40 (20.2%) |
| 18 to 34 Years | 52 (6.5%) | 0 (0.0%) |
| 35 to 64 Years | 57 (7.5%) | 231 (31.9%) |
| 65 to 74 Years | 30 (19.5%) | 18 (9.1%) |
| 75 Years and over | 61 (69.3%) | 85 (75.2%) |
Disability Class by Sex by Age in Pascoag
Disability Class: Hearing Difficulty
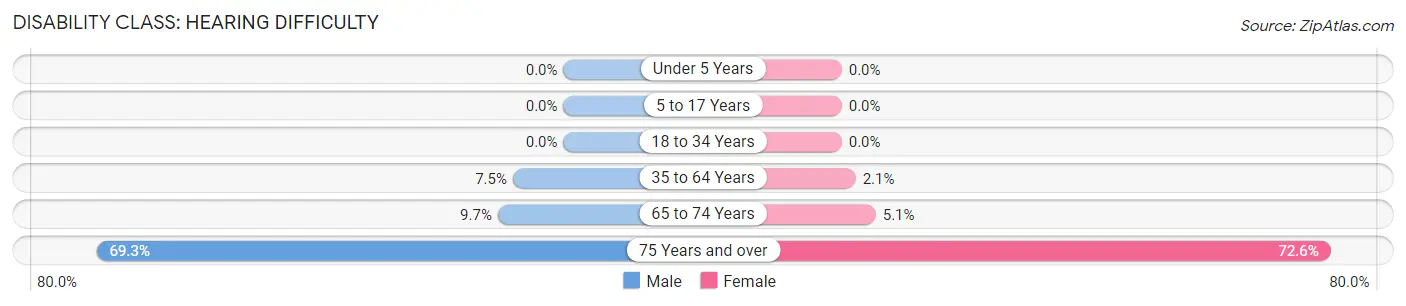
| Age Bracket | Male | Female |
| Under 5 Years | 0 (0.0%) | 0 (0.0%) |
| 5 to 17 Years | 0 (0.0%) | 0 (0.0%) |
| 18 to 34 Years | 0 (0.0%) | 0 (0.0%) |
| 35 to 64 Years | 57 (7.5%) | 15 (2.1%) |
| 65 to 74 Years | 15 (9.7%) | 10 (5.1%) |
| 75 Years and over | 61 (69.3%) | 82 (72.6%) |
Disability Class: Vision Difficulty
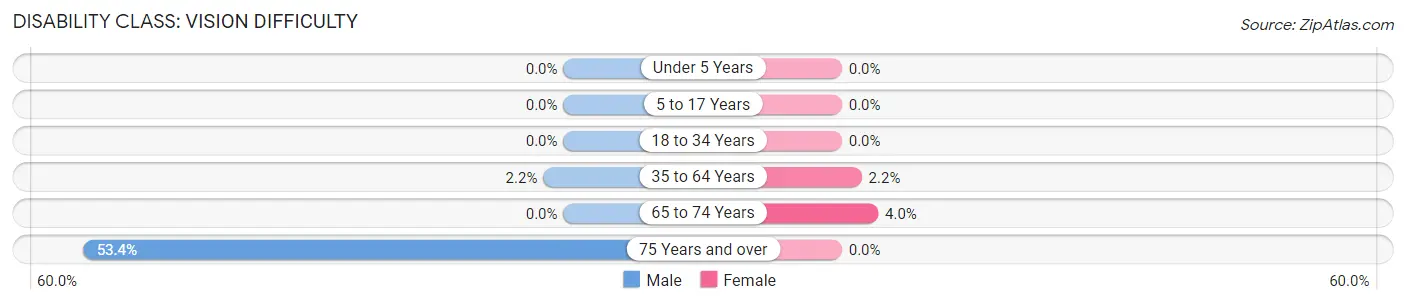
| Age Bracket | Male | Female |
| Under 5 Years | 0 (0.0%) | 0 (0.0%) |
| 5 to 17 Years | 0 (0.0%) | 0 (0.0%) |
| 18 to 34 Years | 0 (0.0%) | 0 (0.0%) |
| 35 to 64 Years | 17 (2.2%) | 16 (2.2%) |
| 65 to 74 Years | 0 (0.0%) | 8 (4.0%) |
| 75 Years and over | 47 (53.4%) | 0 (0.0%) |
Disability Class: Cognitive Difficulty
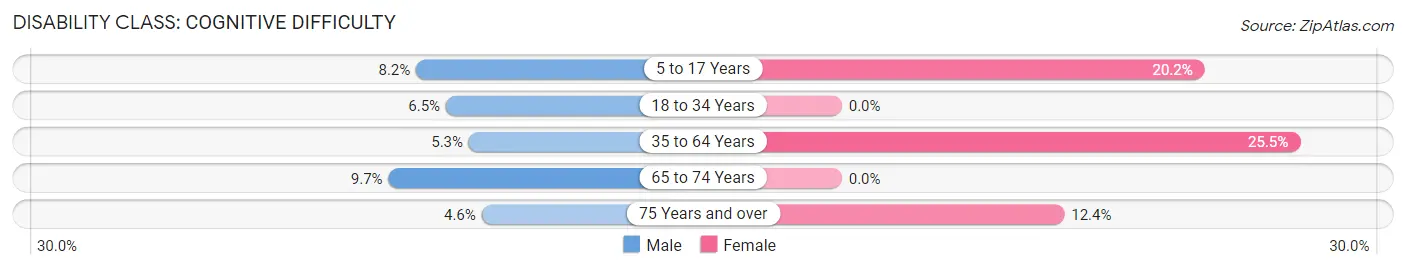
| Age Bracket | Male | Female |
| 5 to 17 Years | 36 (8.2%) | 40 (20.2%) |
| 18 to 34 Years | 52 (6.5%) | 0 (0.0%) |
| 35 to 64 Years | 40 (5.3%) | 185 (25.5%) |
| 65 to 74 Years | 15 (9.7%) | 0 (0.0%) |
| 75 Years and over | 4 (4.5%) | 14 (12.4%) |
Disability Class: Ambulatory Difficulty
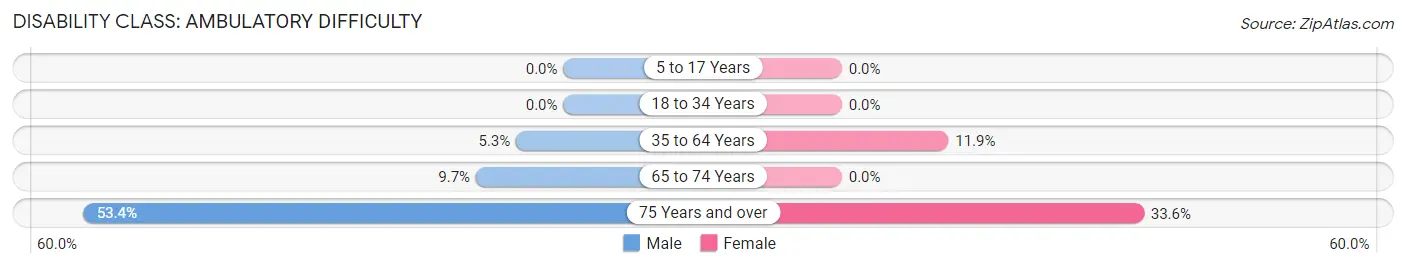
| Age Bracket | Male | Female |
| 5 to 17 Years | 0 (0.0%) | 0 (0.0%) |
| 18 to 34 Years | 0 (0.0%) | 0 (0.0%) |
| 35 to 64 Years | 40 (5.3%) | 86 (11.9%) |
| 65 to 74 Years | 15 (9.7%) | 0 (0.0%) |
| 75 Years and over | 47 (53.4%) | 38 (33.6%) |
Disability Class: Self-Care Difficulty
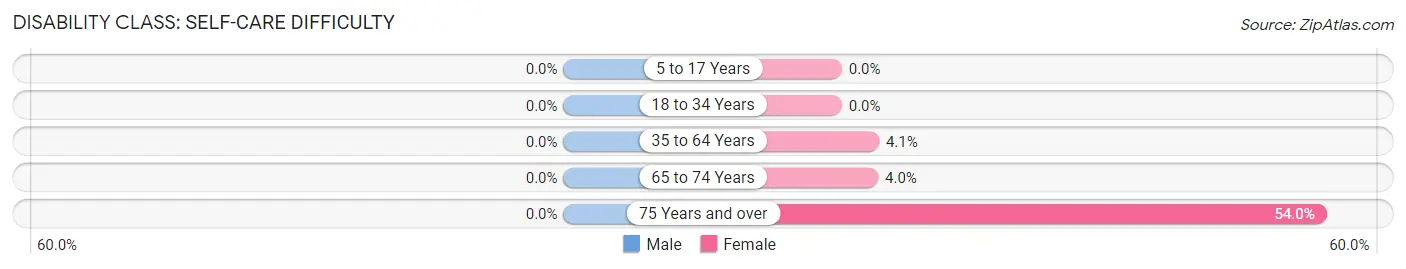
| Age Bracket | Male | Female |
| 5 to 17 Years | 0 (0.0%) | 0 (0.0%) |
| 18 to 34 Years | 0 (0.0%) | 0 (0.0%) |
| 35 to 64 Years | 0 (0.0%) | 30 (4.1%) |
| 65 to 74 Years | 0 (0.0%) | 8 (4.0%) |
| 75 Years and over | 0 (0.0%) | 61 (54.0%) |
Technology Access in Pascoag
Computing Device Access in Pascoag
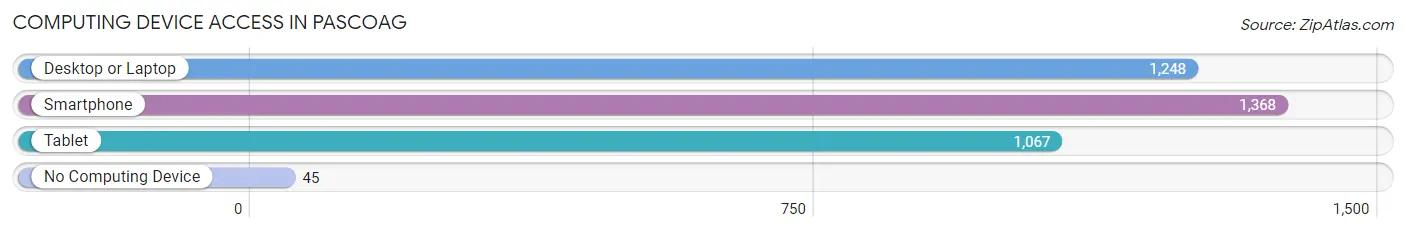
| Device Type | # Households | % Households |
| Desktop or Laptop | 1,248 | 81.9% |
| Smartphone | 1,368 | 89.8% |
| Tablet | 1,067 | 70.0% |
| No Computing Device | 45 | 2.9% |
| Total | 1,524 | 100.0% |
Internet Access in Pascoag
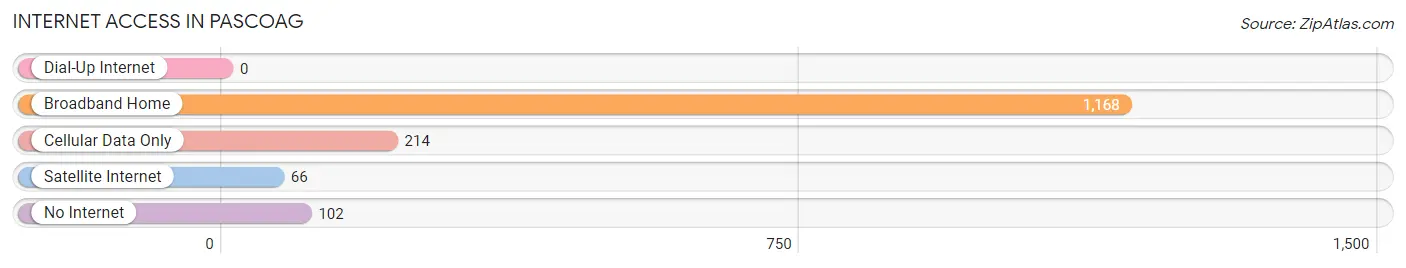
| Internet Type | # Households | % Households |
| Dial-Up Internet | 0 | 0.0% |
| Broadband Home | 1,168 | 76.6% |
| Cellular Data Only | 214 | 14.0% |
| Satellite Internet | 66 | 4.3% |
| No Internet | 102 | 6.7% |
| Total | 1,524 | 100.0% |
Pascoag Summary
Pascoag is a small village located in the town of Burrillville, Rhode Island. It is situated in the northwest corner of the state, near the border of Connecticut. The village is located on the banks of the Pascoag River, which is a tributary of the Blackstone River. The population of Pascoag was 1,845 at the 2010 census.
History
The area that is now Pascoag was originally inhabited by the Nipmuc tribe. The first European settlers arrived in the area in the late 17th century. The village was first known as “Pascoag Plantation” and was part of the town of Glocester. In 1786, the village was incorporated as the town of Pascoag.
The village was an important center of industry in the 19th century. It was home to several mills, including a cotton mill, a woolen mill, and a paper mill. The mills provided employment for many of the residents of the village.
In the early 20th century, the village was home to several summer resorts. The resorts attracted visitors from all over the country, and the village became a popular tourist destination.
Geography
Pascoag is located in the northwest corner of Rhode Island, near the border of Connecticut. The village is situated on the banks of the Pascoag River, which is a tributary of the Blackstone River. The village is surrounded by wooded hills and is located in a rural area.
The climate in Pascoag is humid continental, with warm summers and cold winters. The average annual temperature is around 50°F (10°C). The average annual precipitation is around 40 inches (102 cm).
Economy
The economy of Pascoag is largely based on tourism and manufacturing. The village is home to several small businesses, including restaurants, shops, and a golf course. The village is also home to several manufacturing companies, including a paper mill and a plastics factory.
Demographics
As of the 2010 census, the population of Pascoag was 1,845. The racial makeup of the village was 94.3% White, 1.2% African American, 0.3% Native American, 0.7% Asian, 0.1% Pacific Islander, 1.2% from other races, and 2.3% from two or more races. Hispanic or Latino of any race were 3.2% of the population.
The median income for a household in Pascoag was $50,938, and the median income for a family was $60,938. The per capita income for the village was $22,938. About 8.3% of families and 10.2% of the population were below the poverty line, including 14.2% of those under age 18 and 5.2% of those age 65 or over.
Common Questions
What is Per Capita Income in Pascoag?
Per Capita income in Pascoag is $37,659.
What is the Median Family Income in Pascoag?
Median Family Income in Pascoag is $112,917.
What is the Median Household income in Pascoag?
Median Household Income in Pascoag is $97,064.
What is Income or Wage Gap in Pascoag?
Income or Wage Gap in Pascoag is 36.6%.
Women in Pascoag earn 63.4 cents for every dollar earned by a man.
What is Inequality or Gini Index in Pascoag?
Inequality or Gini Index in Pascoag is 0.38.
What is the Total Population of Pascoag?
Total Population of Pascoag is 4,527.
What is the Total Male Population of Pascoag?
Total Male Population of Pascoag is 2,639.
What is the Total Female Population of Pascoag?
Total Female Population of Pascoag is 1,888.
What is the Ratio of Males per 100 Females in Pascoag?
There are 139.78 Males per 100 Females in Pascoag.
What is the Ratio of Females per 100 Males in Pascoag?
There are 71.54 Females per 100 Males in Pascoag.
What is the Median Population Age in Pascoag?
Median Population Age in Pascoag is 34.7 Years.
What is the Average Family Size in Pascoag
Average Family Size in Pascoag is 3.2 People.
What is the Average Household Size in Pascoag
Average Household Size in Pascoag is 2.8 People.
How Large is the Labor Force in Pascoag?
There are 2,406 People in the Labor Forcein in Pascoag.
What is the Percentage of People in the Labor Force in Pascoag?
64.8% of People are in the Labor Force in Pascoag.
What is the Unemployment Rate in Pascoag?
Unemployment Rate in Pascoag is 7.7%.