Narragansett Pier, RI Map & Demographics
Narragansett Pier Map
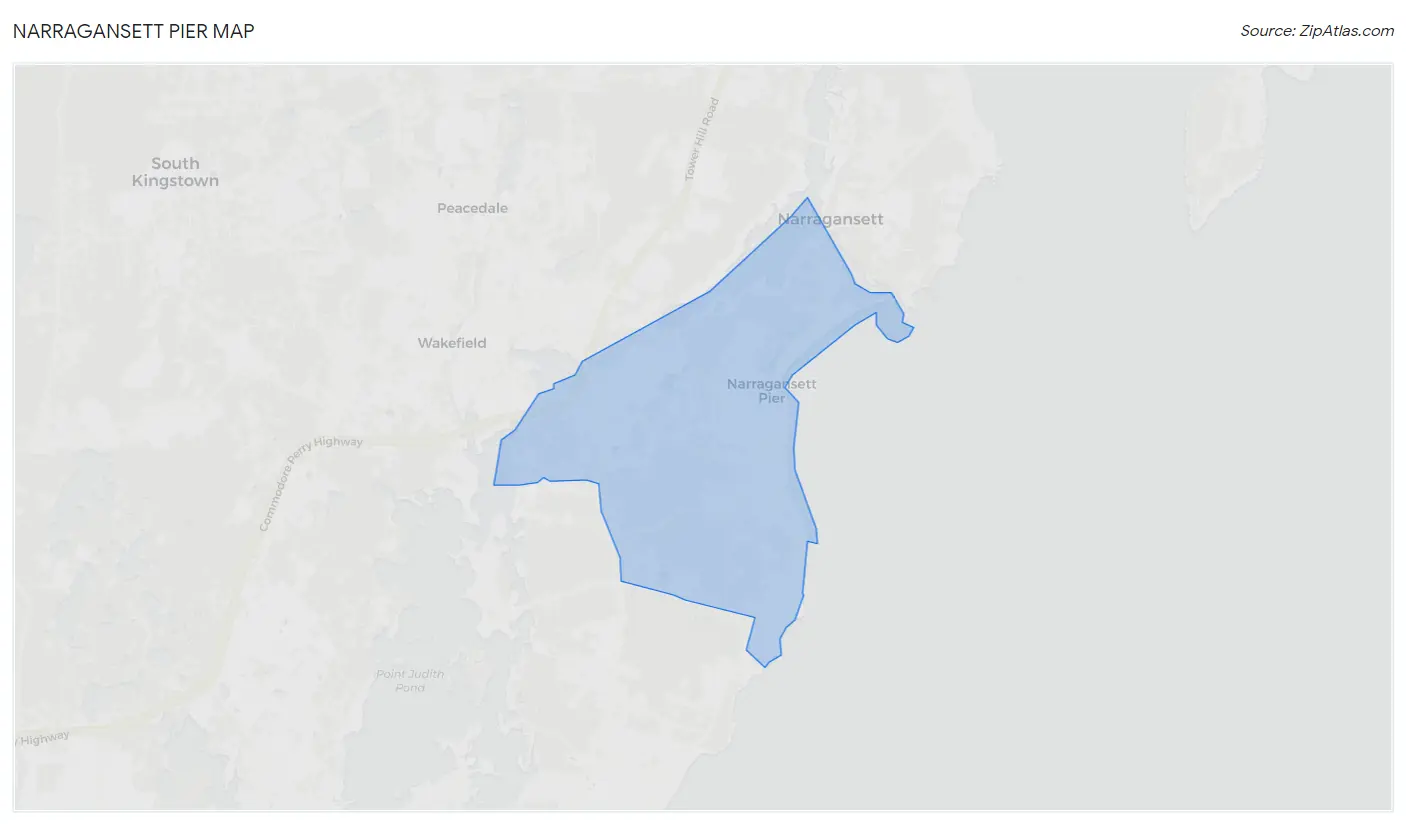
Narragansett Pier Overview
$51,278
PER CAPITA INCOME
$148,571
AVG FAMILY INCOME
$76,528
AVG HOUSEHOLD INCOME
26.0%
WAGE / INCOME GAP [ % ]
74.0¢/ $1
WAGE / INCOME GAP [ $ ]
0.51
INEQUALITY / GINI INDEX
2,805
TOTAL POPULATION
1,327
MALE POPULATION
1,478
FEMALE POPULATION
89.78
MALES / 100 FEMALES
111.38
FEMALES / 100 MALES
54.0
MEDIAN AGE
2.8
AVG FAMILY SIZE
1.9
AVG HOUSEHOLD SIZE
1,518
LABOR FORCE [ PEOPLE ]
58.4%
PERCENT IN LABOR FORCE
11.6%
UNEMPLOYMENT RATE
Income in Narragansett Pier
Income Overview in Narragansett Pier
Per Capita Income in Narragansett Pier is $51,278, while median incomes of families and households are $148,571 and $76,528 respectively.
| Characteristic | Number | Measure |
| Per Capita Income | 2,805 | $51,278 |
| Median Family Income | 632 | $148,571 |
| Mean Family Income | 632 | $162,529 |
| Median Household Income | 1,415 | $76,528 |
| Mean Household Income | 1,415 | $102,476 |
| Income Deficit | 632 | $0 |
| Wage / Income Gap (%) | 2,805 | 26.04% |
| Wage / Income Gap ($) | 2,805 | 73.96¢ per $1 |
| Gini / Inequality Index | 2,805 | 0.51 |
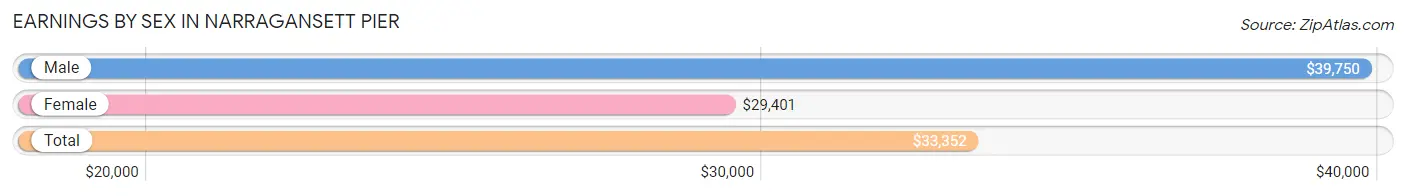
Earnings by Sex in Narragansett Pier
Average Earnings in Narragansett Pier are $33,352, $39,750 for men and $29,401 for women, a difference of 26.0%.
| Sex | Number | Average Earnings |
| Male | 916 (49.4%) | $39,750 |
| Female | 937 (50.6%) | $29,401 |
| Total | 1,853 (100.0%) | $33,352 |
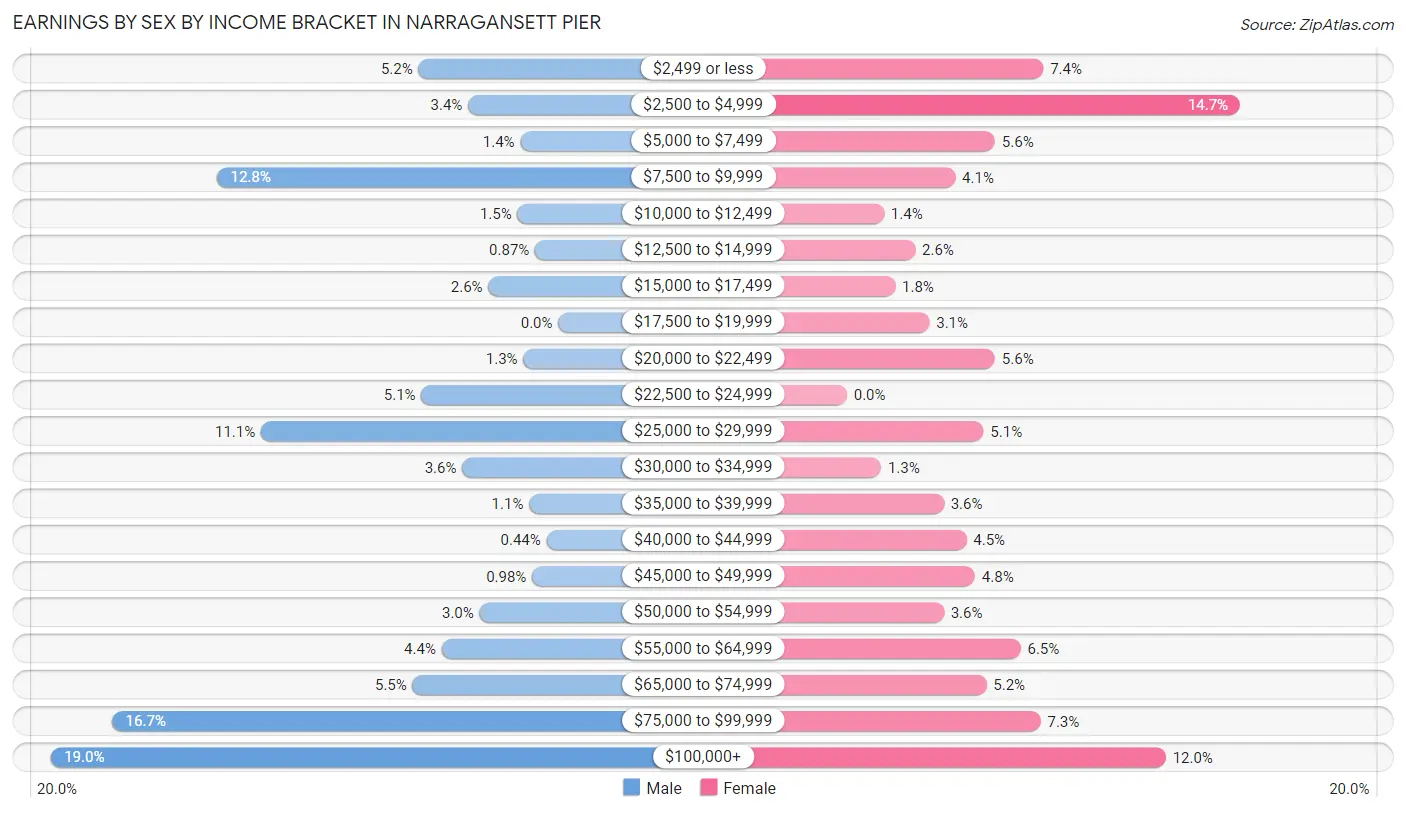
Earnings by Sex by Income Bracket in Narragansett Pier
The most common earnings brackets in Narragansett Pier are $100,000+ for men (174 | 19.0%) and $2,500 to $4,999 for women (138 | 14.7%).
| Income | Male | Female |
| $2,499 or less | 48 (5.2%) | 69 (7.4%) |
| $2,500 to $4,999 | 31 (3.4%) | 138 (14.7%) |
| $5,000 to $7,499 | 13 (1.4%) | 52 (5.6%) |
| $7,500 to $9,999 | 117 (12.8%) | 38 (4.1%) |
| $10,000 to $12,499 | 14 (1.5%) | 13 (1.4%) |
| $12,500 to $14,999 | 8 (0.9%) | 24 (2.6%) |
| $15,000 to $17,499 | 24 (2.6%) | 17 (1.8%) |
| $17,500 to $19,999 | 0 (0.0%) | 29 (3.1%) |
| $20,000 to $22,499 | 12 (1.3%) | 52 (5.6%) |
| $22,500 to $24,999 | 47 (5.1%) | 0 (0.0%) |
| $25,000 to $29,999 | 102 (11.1%) | 48 (5.1%) |
| $30,000 to $34,999 | 33 (3.6%) | 12 (1.3%) |
| $35,000 to $39,999 | 10 (1.1%) | 34 (3.6%) |
| $40,000 to $44,999 | 4 (0.4%) | 42 (4.5%) |
| $45,000 to $49,999 | 9 (1.0%) | 45 (4.8%) |
| $50,000 to $54,999 | 27 (2.9%) | 34 (3.6%) |
| $55,000 to $64,999 | 40 (4.4%) | 61 (6.5%) |
| $65,000 to $74,999 | 50 (5.5%) | 49 (5.2%) |
| $75,000 to $99,999 | 153 (16.7%) | 68 (7.3%) |
| $100,000+ | 174 (19.0%) | 112 (11.9%) |
| Total | 916 (100.0%) | 937 (100.0%) |
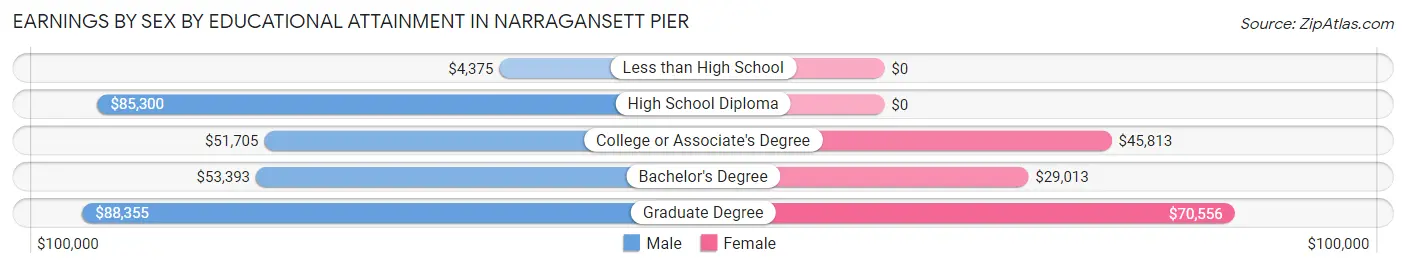
Earnings by Sex by Educational Attainment in Narragansett Pier
Average earnings in Narragansett Pier are $61,750 for men and $44,474 for women, a difference of 28.0%. Men with an educational attainment of graduate degree enjoy the highest average annual earnings of $88,355, while those with less than high school education earn the least with $4,375. Women with an educational attainment of graduate degree earn the most with the average annual earnings of $70,556, while those with bachelor's degree education have the smallest earnings of $29,013.
| Educational Attainment | Male Income | Female Income |
| Less than High School | $4,375 | $0 |
| High School Diploma | $85,300 | $0 |
| College or Associate's Degree | $51,705 | $45,813 |
| Bachelor's Degree | $53,393 | $29,013 |
| Graduate Degree | $88,355 | $70,556 |
| Total | $61,750 | $44,474 |
Family Income in Narragansett Pier
Family Income Brackets in Narragansett Pier
According to the Narragansett Pier family income data, there are 167 families falling into the $200,000+ income range, which is the most common income bracket and makes up 26.4% of all families.
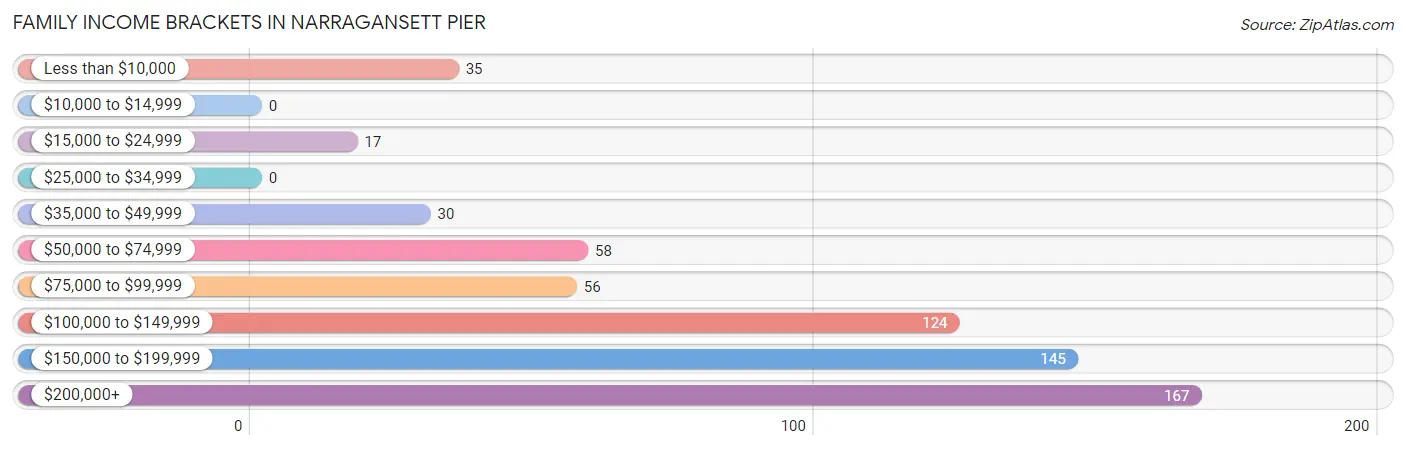
| Income Bracket | # Families | % Families |
| Less than $10,000 | 35 | 5.5% |
| $10,000 to $14,999 | 0 | 0.0% |
| $15,000 to $24,999 | 17 | 2.7% |
| $25,000 to $34,999 | 0 | 0.0% |
| $35,000 to $49,999 | 30 | 4.7% |
| $50,000 to $74,999 | 58 | 9.2% |
| $75,000 to $99,999 | 56 | 8.9% |
| $100,000 to $149,999 | 124 | 19.6% |
| $150,000 to $199,999 | 145 | 22.9% |
| $200,000+ | 167 | 26.4% |
Family Income by Famaliy Size in Narragansett Pier
5-person families (18 | 2.9%) account for the highest median family income in Narragansett Pier with $250,001 per family, while 2-person families (366 | 57.9%) have the highest median income of $80,921 per family member.
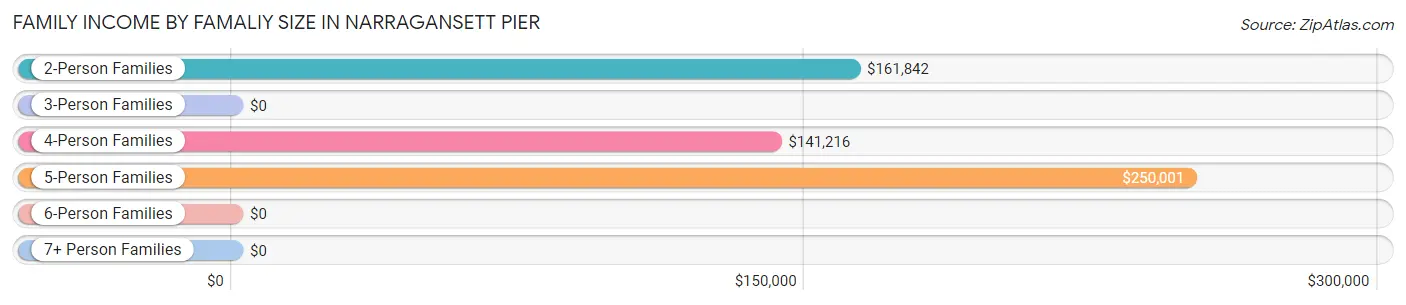
| Income Bracket | # Families | Median Income |
| 2-Person Families | 366 (57.9%) | $161,842 |
| 3-Person Families | 105 (16.6%) | $0 |
| 4-Person Families | 130 (20.6%) | $141,216 |
| 5-Person Families | 18 (2.9%) | $250,001 |
| 6-Person Families | 13 (2.1%) | $0 |
| 7+ Person Families | 0 (0.0%) | $0 |
| Total | 632 (100.0%) | $148,571 |
Family Income by Number of Earners in Narragansett Pier
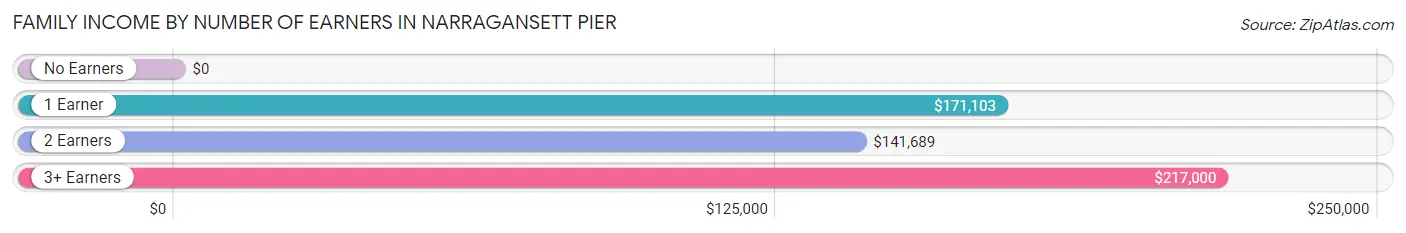
| Number of Earners | # Families | Median Income |
| No Earners | 91 (14.4%) | $0 |
| 1 Earner | 117 (18.5%) | $171,103 |
| 2 Earners | 310 (49.0%) | $141,689 |
| 3+ Earners | 114 (18.0%) | $217,000 |
| Total | 632 (100.0%) | $148,571 |
Household Income in Narragansett Pier
Household Income Brackets in Narragansett Pier
With 214 households falling in the category, the $75,000 to $99,999 income range is the most frequent in Narragansett Pier, accounting for 15.1% of all households. In contrast, only 78 households (5.5%) fall into the $35,000 to $49,999 income bracket, making it the least populous group.
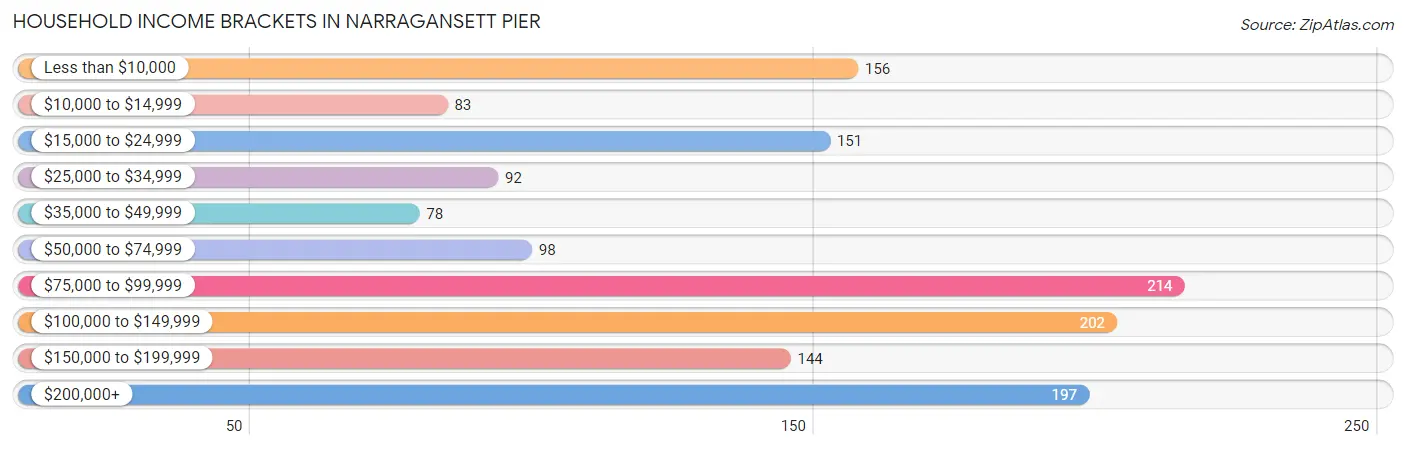
| Income Bracket | # Households | % Households |
| Less than $10,000 | 156 | 11.0% |
| $10,000 to $14,999 | 83 | 5.9% |
| $15,000 to $24,999 | 151 | 10.7% |
| $25,000 to $34,999 | 92 | 6.5% |
| $35,000 to $49,999 | 78 | 5.5% |
| $50,000 to $74,999 | 98 | 6.9% |
| $75,000 to $99,999 | 214 | 15.1% |
| $100,000 to $149,999 | 202 | 14.3% |
| $150,000 to $199,999 | 144 | 10.2% |
| $200,000+ | 197 | 13.9% |
Household Income by Householder Age in Narragansett Pier
The median household income in Narragansett Pier is $76,528, with the highest median household income of $116,406 found in the 45 to 64 years age bracket for the primary householder. A total of 545 households (38.5%) fall into this category. Meanwhile, the 15 to 24 years age bracket for the primary householder has the lowest median household income of $0, with 184 households (13.0%) in this group.
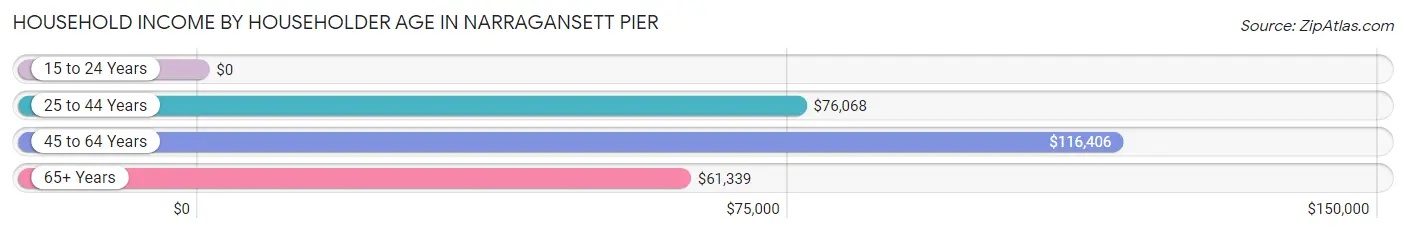
| Income Bracket | # Households | Median Income |
| 15 to 24 Years | 184 (13.0%) | $0 |
| 25 to 44 Years | 185 (13.1%) | $76,068 |
| 45 to 64 Years | 545 (38.5%) | $116,406 |
| 65+ Years | 501 (35.4%) | $61,339 |
| Total | 1,415 (100.0%) | $76,528 |
Poverty in Narragansett Pier
Income Below Poverty by Sex and Age in Narragansett Pier
With 15.4% poverty level for males and 17.0% for females among the residents of Narragansett Pier, 18 to 24 year old males and 18 to 24 year old females are the most vulnerable to poverty, with 80 males (56.3%) and 170 females (82.1%) in their respective age groups living below the poverty level.
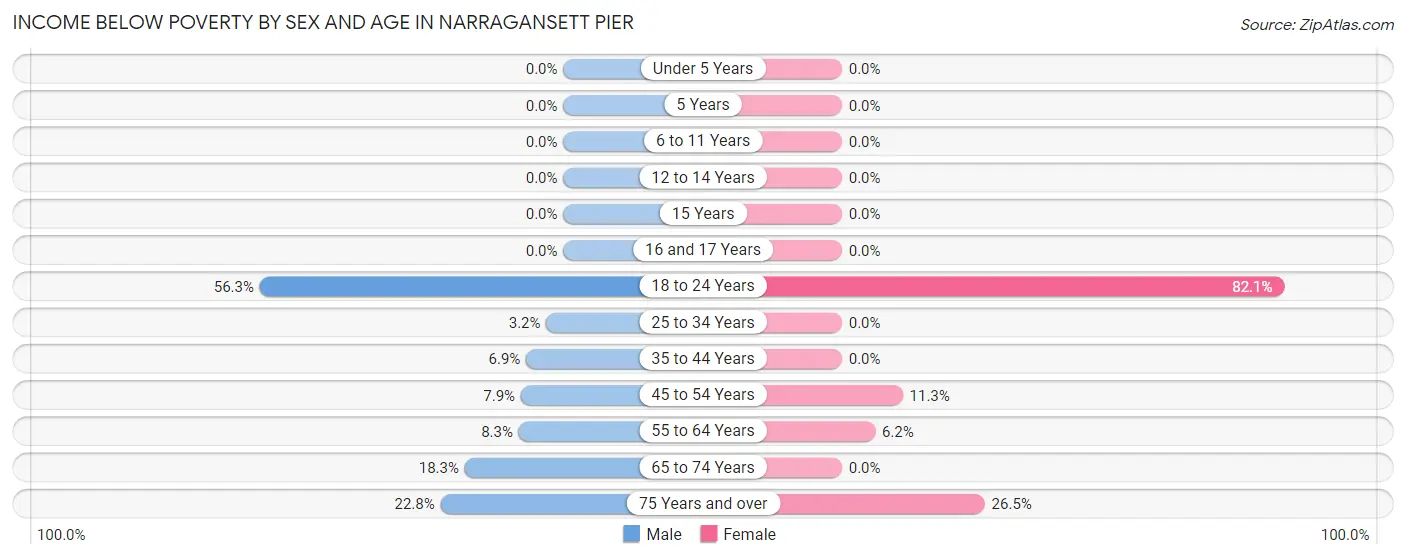
| Age Bracket | Male | Female |
| Under 5 Years | 0 (0.0%) | 0 (0.0%) |
| 5 Years | 0 (0.0%) | 0 (0.0%) |
| 6 to 11 Years | 0 (0.0%) | 0 (0.0%) |
| 12 to 14 Years | 0 (0.0%) | 0 (0.0%) |
| 15 Years | 0 (0.0%) | 0 (0.0%) |
| 16 and 17 Years | 0 (0.0%) | 0 (0.0%) |
| 18 to 24 Years | 80 (56.3%) | 170 (82.1%) |
| 25 to 34 Years | 4 (3.2%) | 0 (0.0%) |
| 35 to 44 Years | 6 (6.9%) | 0 (0.0%) |
| 45 to 54 Years | 7 (7.9%) | 21 (11.3%) |
| 55 to 64 Years | 31 (8.3%) | 12 (6.1%) |
| 65 to 74 Years | 45 (18.3%) | 0 (0.0%) |
| 75 Years and over | 31 (22.8%) | 48 (26.5%) |
| Total | 204 (15.4%) | 251 (17.0%) |
Income Above Poverty by Sex and Age in Narragansett Pier
According to the poverty statistics in Narragansett Pier, males aged under 5 years and females aged under 5 years are the age groups that are most secure financially, with 100.0% of males and 100.0% of females in these age groups living above the poverty line.
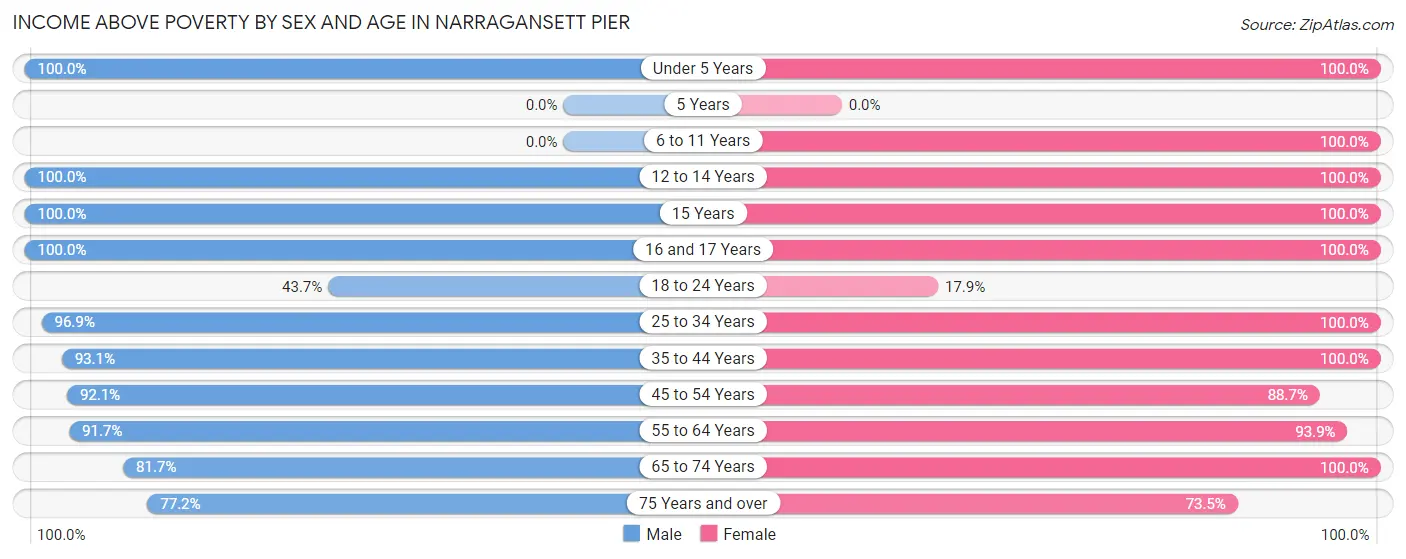
| Age Bracket | Male | Female |
| Under 5 Years | 53 (100.0%) | 37 (100.0%) |
| 5 Years | 0 (0.0%) | 0 (0.0%) |
| 6 to 11 Years | 0 (0.0%) | 61 (100.0%) |
| 12 to 14 Years | 34 (100.0%) | 6 (100.0%) |
| 15 Years | 9 (100.0%) | 6 (100.0%) |
| 16 and 17 Years | 29 (100.0%) | 40 (100.0%) |
| 18 to 24 Years | 62 (43.7%) | 37 (17.9%) |
| 25 to 34 Years | 123 (96.9%) | 259 (100.0%) |
| 35 to 44 Years | 81 (93.1%) | 63 (100.0%) |
| 45 to 54 Years | 82 (92.1%) | 165 (88.7%) |
| 55 to 64 Years | 344 (91.7%) | 183 (93.9%) |
| 65 to 74 Years | 201 (81.7%) | 237 (100.0%) |
| 75 Years and over | 105 (77.2%) | 133 (73.5%) |
| Total | 1,123 (84.6%) | 1,227 (83.0%) |
Income Below Poverty Among Married-Couple Families in Narragansett Pier
The poverty statistics for married-couple families in Narragansett Pier show that 1.8% or 9 of the total 514 families live below the poverty line. Families with no children have the highest poverty rate of 2.6%, comprising of 9 families. On the other hand, families with 1 or 2 children have the lowest poverty rate of 0.0%, which includes 0 families.
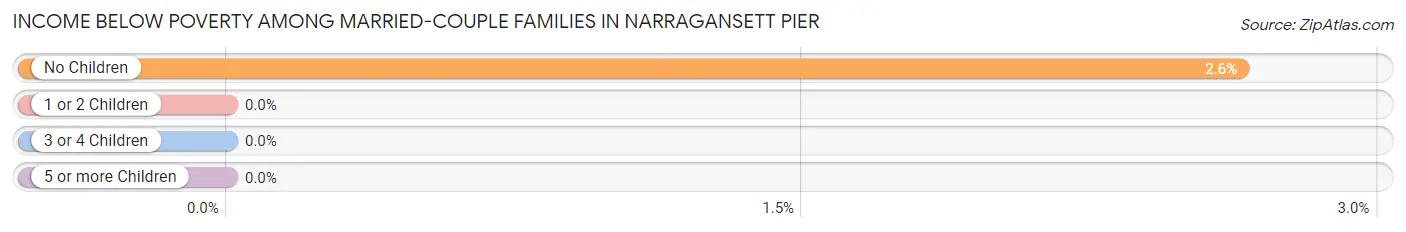
| Children | Above Poverty | Below Poverty |
| No Children | 332 (97.4%) | 9 (2.6%) |
| 1 or 2 Children | 165 (100.0%) | 0 (0.0%) |
| 3 or 4 Children | 8 (100.0%) | 0 (0.0%) |
| 5 or more Children | 0 (0.0%) | 0 (0.0%) |
| Total | 505 (98.3%) | 9 (1.8%) |
Income Below Poverty Among Single-Parent Households in Narragansett Pier
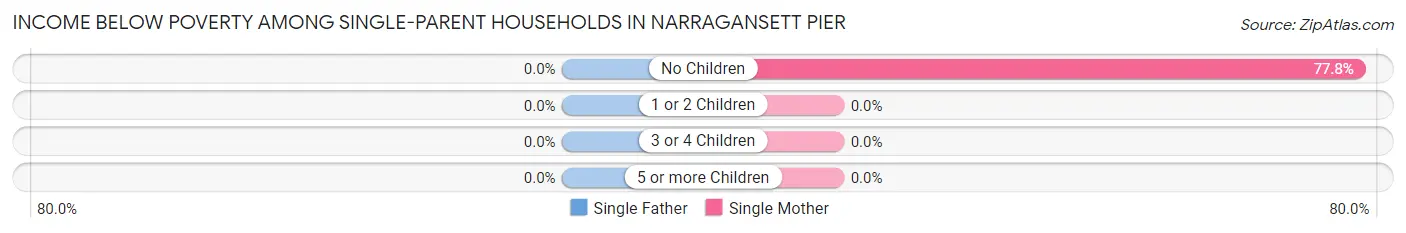
| Children | Single Father | Single Mother |
| No Children | 0 (0.0%) | 35 (77.8%) |
| 1 or 2 Children | 0 (0.0%) | 0 (0.0%) |
| 3 or 4 Children | 0 (0.0%) | 0 (0.0%) |
| 5 or more Children | 0 (0.0%) | 0 (0.0%) |
| Total | 0 (0.0%) | 35 (62.5%) |
Income Below Poverty Among Married-Couple vs Single-Parent Households in Narragansett Pier
The poverty data for Narragansett Pier shows that 9 of the married-couple family households (1.8%) and 35 of the single-parent households (29.7%) are living below the poverty level. Within the married-couple family households, those with no children have the highest poverty rate, with 9 households (2.6%) falling below the poverty line. Among the single-parent households, those with no children have the highest poverty rate, with 35 household (50.0%) living below poverty.
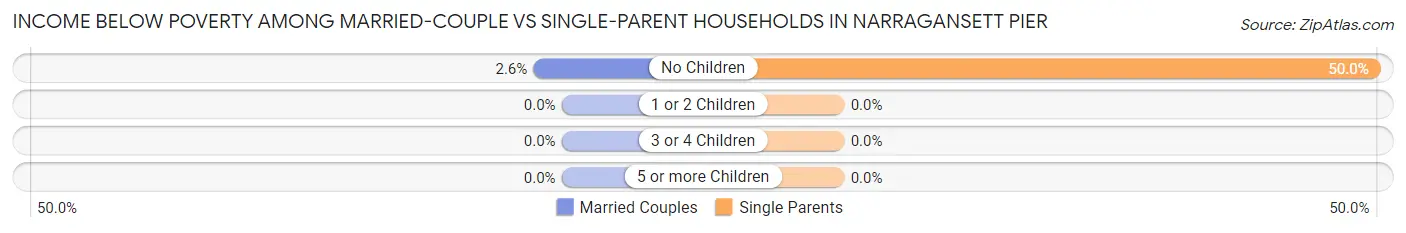
| Children | Married-Couple Families | Single-Parent Households |
| No Children | 9 (2.6%) | 35 (50.0%) |
| 1 or 2 Children | 0 (0.0%) | 0 (0.0%) |
| 3 or 4 Children | 0 (0.0%) | 0 (0.0%) |
| 5 or more Children | 0 (0.0%) | 0 (0.0%) |
| Total | 9 (1.8%) | 35 (29.7%) |
Race in Narragansett Pier
The most populous races in Narragansett Pier are White / Caucasian (2,541 | 90.6%), Hispanic or Latino (179 | 6.4%), and Some other Race (114 | 4.1%).
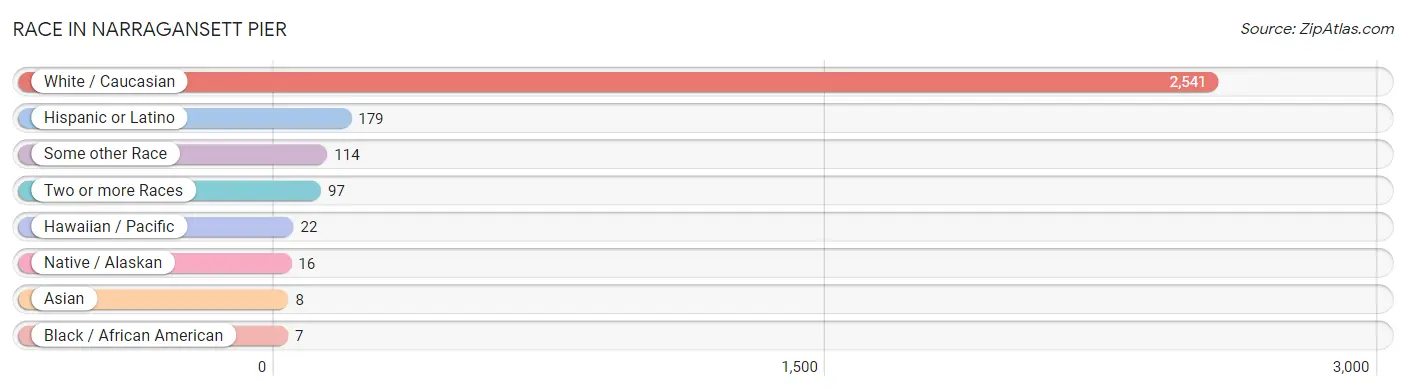
| Race | # Population | % Population |
| Asian | 8 | 0.3% |
| Black / African American | 7 | 0.3% |
| Hawaiian / Pacific | 22 | 0.8% |
| Hispanic or Latino | 179 | 6.4% |
| Native / Alaskan | 16 | 0.6% |
| White / Caucasian | 2,541 | 90.6% |
| Two or more Races | 97 | 3.5% |
| Some other Race | 114 | 4.1% |
| Total | 2,805 | 100.0% |
Ancestry in Narragansett Pier
The most populous ancestries reported in Narragansett Pier are Irish (701 | 25.0%), Italian (623 | 22.2%), English (505 | 18.0%), French (311 | 11.1%), and German (189 | 6.7%), together accounting for 83.0% of all Narragansett Pier residents.
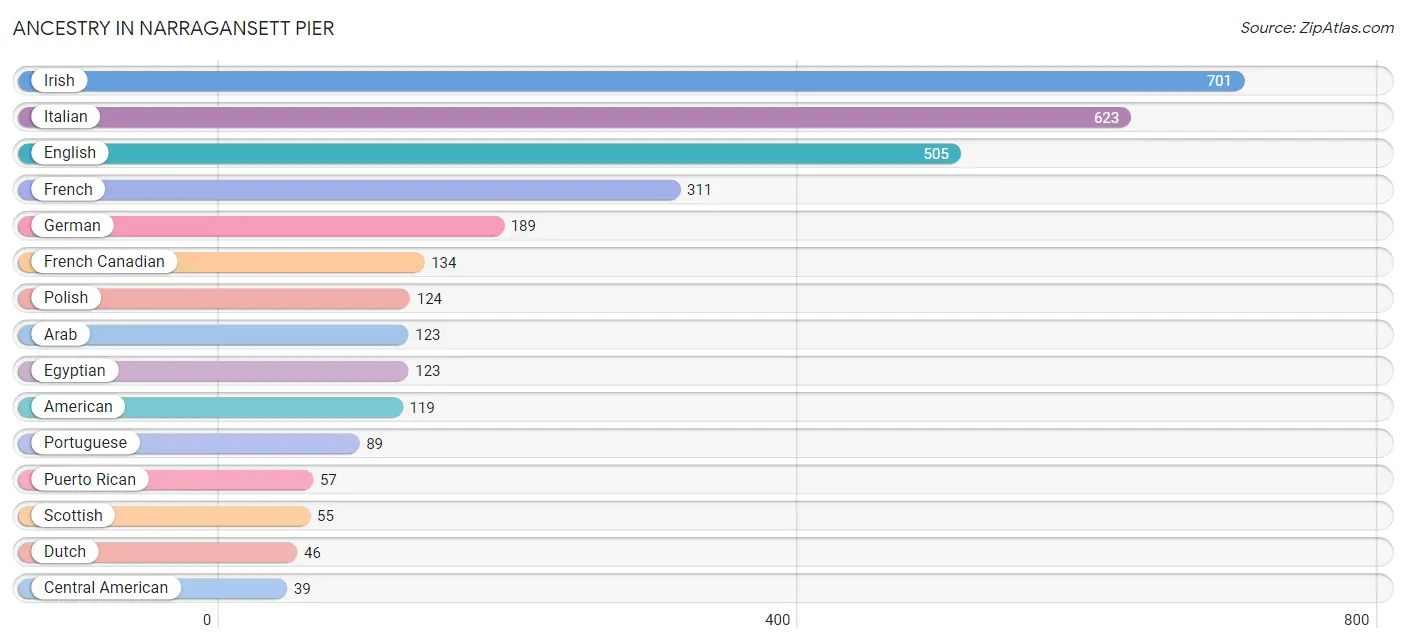
| Ancestry | # Population | % Population |
| American | 119 | 4.2% |
| Arab | 123 | 4.4% |
| Austrian | 4 | 0.1% |
| Brazilian | 5 | 0.2% |
| Canadian | 10 | 0.4% |
| Central American | 39 | 1.4% |
| Colombian | 9 | 0.3% |
| Danish | 10 | 0.4% |
| Dutch | 46 | 1.6% |
| Eastern European | 26 | 0.9% |
| Egyptian | 123 | 4.4% |
| English | 505 | 18.0% |
| European | 13 | 0.5% |
| Finnish | 9 | 0.3% |
| French | 311 | 11.1% |
| French American Indian | 18 | 0.6% |
| French Canadian | 134 | 4.8% |
| German | 189 | 6.7% |
| Greek | 26 | 0.9% |
| Iranian | 10 | 0.4% |
| Irish | 701 | 25.0% |
| Italian | 623 | 22.2% |
| Korean | 17 | 0.6% |
| Lithuanian | 39 | 1.4% |
| Mexican | 27 | 1.0% |
| Native Hawaiian | 22 | 0.8% |
| Nicaraguan | 39 | 1.4% |
| Norwegian | 29 | 1.0% |
| Polish | 124 | 4.4% |
| Portuguese | 89 | 3.2% |
| Puerto Rican | 57 | 2.0% |
| Russian | 8 | 0.3% |
| Scandinavian | 23 | 0.8% |
| Scotch-Irish | 28 | 1.0% |
| Scottish | 55 | 2.0% |
| Slovak | 34 | 1.2% |
| South American | 18 | 0.6% |
| Spaniard | 11 | 0.4% |
| Spanish | 14 | 0.5% |
| Spanish American Indian | 18 | 0.6% |
| Swedish | 12 | 0.4% |
| Swiss | 17 | 0.6% |
| Venezuelan | 9 | 0.3% |
| Welsh | 6 | 0.2% | View All 44 Rows |
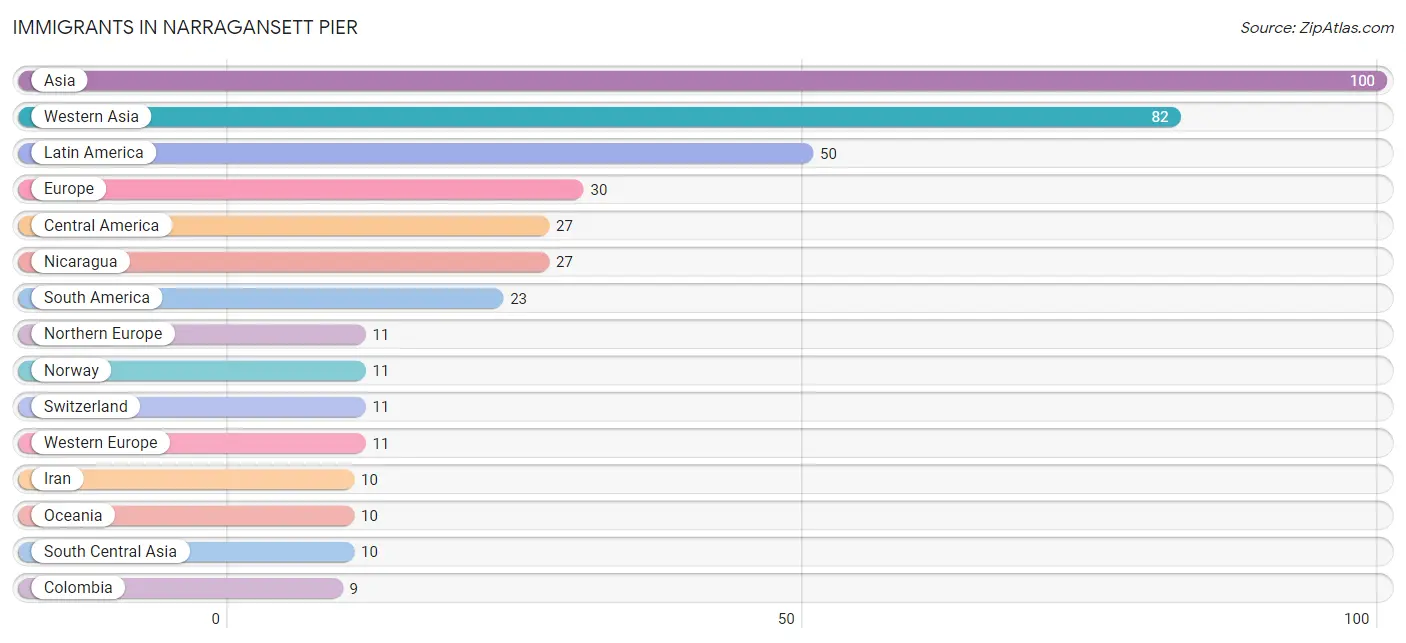
Immigrants in Narragansett Pier
The most numerous immigrant groups reported in Narragansett Pier came from Asia (100 | 3.6%), Western Asia (82 | 2.9%), Latin America (50 | 1.8%), Europe (30 | 1.1%), and Central America (27 | 1.0%), together accounting for 10.3% of all Narragansett Pier residents.
| Immigration Origin | # Population | % Population |
| Africa | 3 | 0.1% |
| Asia | 100 | 3.6% |
| Brazil | 5 | 0.2% |
| Cabo Verde | 3 | 0.1% |
| Central America | 27 | 1.0% |
| Colombia | 9 | 0.3% |
| Eastern Europe | 8 | 0.3% |
| Europe | 30 | 1.1% |
| Iran | 10 | 0.4% |
| Latin America | 50 | 1.8% |
| Nicaragua | 27 | 1.0% |
| Northern Europe | 11 | 0.4% |
| Norway | 11 | 0.4% |
| Oceania | 10 | 0.4% |
| Philippines | 8 | 0.3% |
| Russia | 8 | 0.3% |
| South America | 23 | 0.8% |
| South Central Asia | 10 | 0.4% |
| South Eastern Asia | 8 | 0.3% |
| Switzerland | 11 | 0.4% |
| Venezuela | 9 | 0.3% |
| Western Africa | 3 | 0.1% |
| Western Asia | 82 | 2.9% |
| Western Europe | 11 | 0.4% | View All 24 Rows |
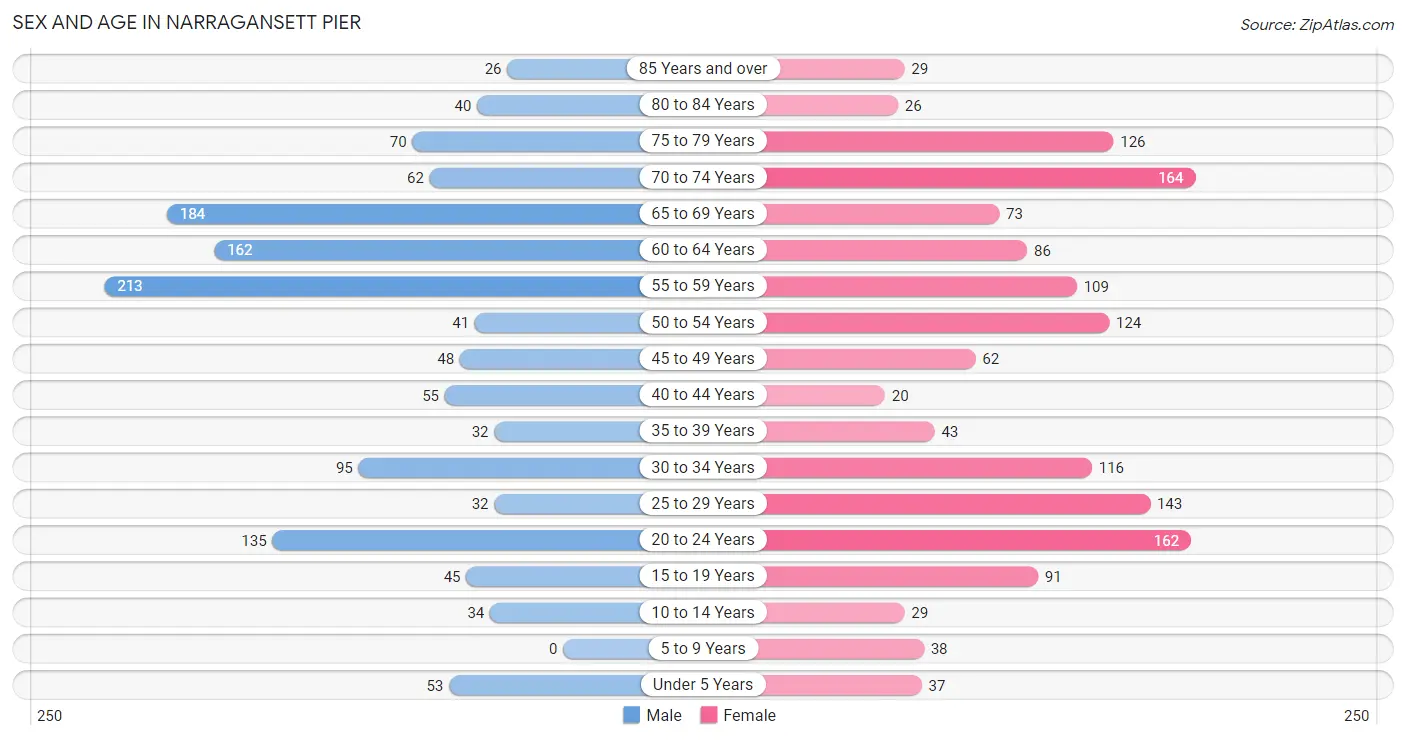
Sex and Age in Narragansett Pier
Sex and Age in Narragansett Pier
The most populous age groups in Narragansett Pier are 55 to 59 Years (213 | 16.1%) for men and 70 to 74 Years (164 | 11.1%) for women.
| Age Bracket | Male | Female |
| Under 5 Years | 53 (4.0%) | 37 (2.5%) |
| 5 to 9 Years | 0 (0.0%) | 38 (2.6%) |
| 10 to 14 Years | 34 (2.6%) | 29 (2.0%) |
| 15 to 19 Years | 45 (3.4%) | 91 (6.2%) |
| 20 to 24 Years | 135 (10.2%) | 162 (11.0%) |
| 25 to 29 Years | 32 (2.4%) | 143 (9.7%) |
| 30 to 34 Years | 95 (7.2%) | 116 (7.9%) |
| 35 to 39 Years | 32 (2.4%) | 43 (2.9%) |
| 40 to 44 Years | 55 (4.1%) | 20 (1.3%) |
| 45 to 49 Years | 48 (3.6%) | 62 (4.2%) |
| 50 to 54 Years | 41 (3.1%) | 124 (8.4%) |
| 55 to 59 Years | 213 (16.1%) | 109 (7.4%) |
| 60 to 64 Years | 162 (12.2%) | 86 (5.8%) |
| 65 to 69 Years | 184 (13.9%) | 73 (4.9%) |
| 70 to 74 Years | 62 (4.7%) | 164 (11.1%) |
| 75 to 79 Years | 70 (5.3%) | 126 (8.5%) |
| 80 to 84 Years | 40 (3.0%) | 26 (1.8%) |
| 85 Years and over | 26 (2.0%) | 29 (2.0%) |
| Total | 1,327 (100.0%) | 1,478 (100.0%) |
Families and Households in Narragansett Pier
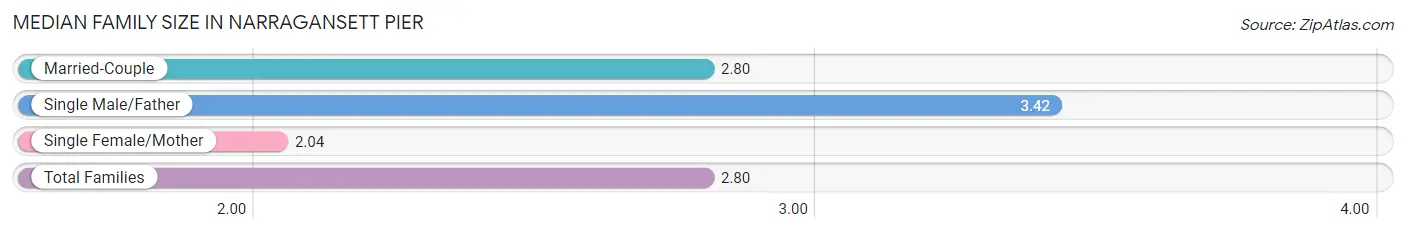
Median Family Size in Narragansett Pier
The median family size in Narragansett Pier is 2.80 persons per family, with single male/father families (62 | 9.8%) accounting for the largest median family size of 3.42 persons per family. On the other hand, single female/mother families (56 | 8.9%) represent the smallest median family size with 2.04 persons per family.
| Family Type | # Families | Family Size |
| Married-Couple | 514 (81.3%) | 2.80 |
| Single Male/Father | 62 (9.8%) | 3.42 |
| Single Female/Mother | 56 (8.9%) | 2.04 |
| Total Families | 632 (100.0%) | 2.80 |
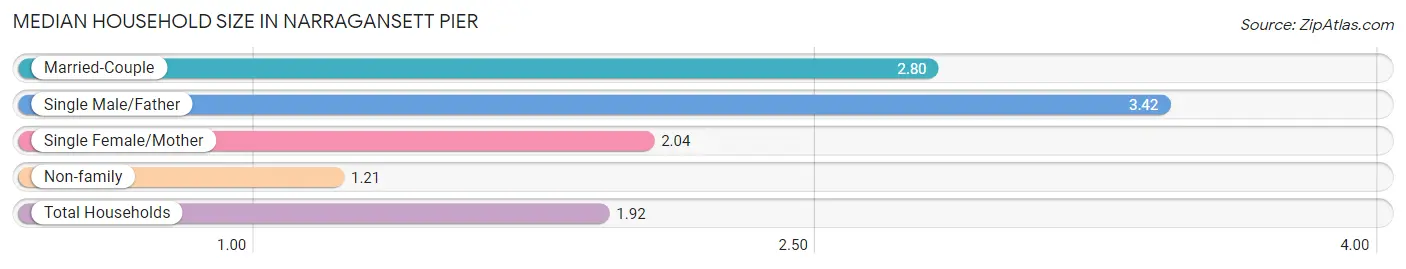
Median Household Size in Narragansett Pier
The median household size in Narragansett Pier is 1.92 persons per household, with single male/father households (62 | 4.4%) accounting for the largest median household size of 3.42 persons per household. non-family households (783 | 55.3%) represent the smallest median household size with 1.21 persons per household.
| Household Type | # Households | Household Size |
| Married-Couple | 514 (36.3%) | 2.80 |
| Single Male/Father | 62 (4.4%) | 3.42 |
| Single Female/Mother | 56 (4.0%) | 2.04 |
| Non-family | 783 (55.3%) | 1.21 |
| Total Households | 1,415 (100.0%) | 1.92 |
Household Size by Marriage Status in Narragansett Pier
Out of a total of 1,415 households in Narragansett Pier, 632 (44.7%) are family households, while 783 (55.3%) are nonfamily households. The most numerous type of family households are 2-person households, comprising 366, and the most common type of nonfamily households are 1-person households, comprising 625.
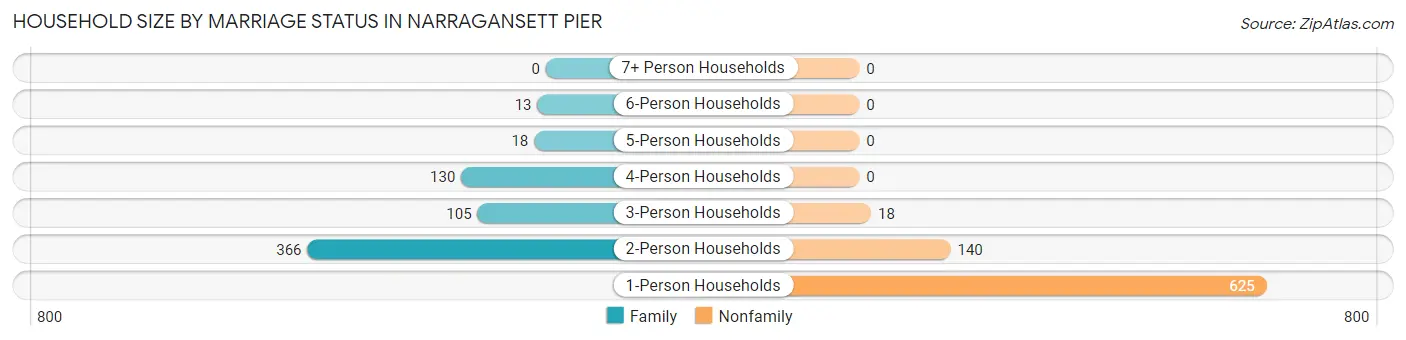
| Household Size | Family Households | Nonfamily Households |
| 1-Person Households | - | 625 (44.2%) |
| 2-Person Households | 366 (25.9%) | 140 (9.9%) |
| 3-Person Households | 105 (7.4%) | 18 (1.3%) |
| 4-Person Households | 130 (9.2%) | 0 (0.0%) |
| 5-Person Households | 18 (1.3%) | 0 (0.0%) |
| 6-Person Households | 13 (0.9%) | 0 (0.0%) |
| 7+ Person Households | 0 (0.0%) | 0 (0.0%) |
| Total | 632 (44.7%) | 783 (55.3%) |
Female Fertility in Narragansett Pier
Fertility by Age in Narragansett Pier
Average fertility rate in Narragansett Pier is 67.0 births per 1,000 women. Women in the age bracket of 20 to 34 years have the highest fertility rate with 107.0 births per 1,000 women. Women in the age bracket of 20 to 34 years acount for 100.0% of all women with births.
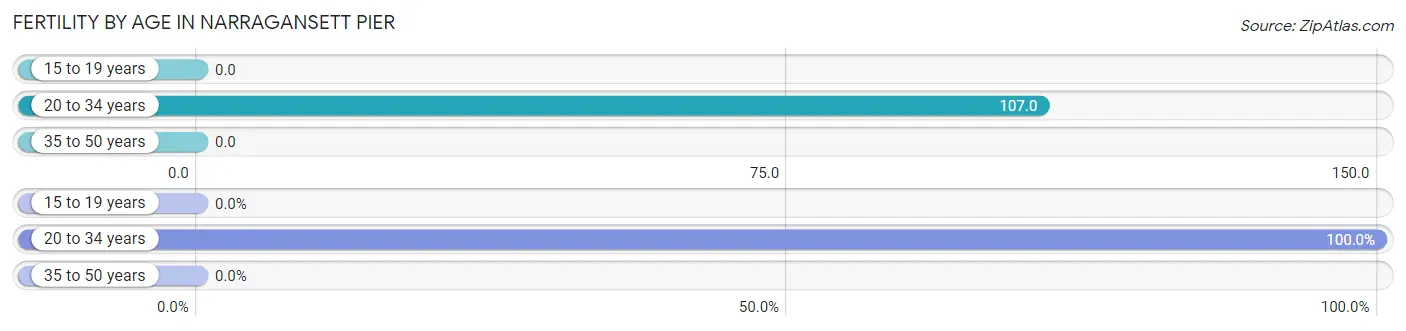
| Age Bracket | Women with Births | Births / 1,000 Women |
| 15 to 19 years | 0 (0.0%) | 0.0 |
| 20 to 34 years | 45 (100.0%) | 107.0 |
| 35 to 50 years | 0 (0.0%) | 0.0 |
| Total | 45 (100.0%) | 67.0 |
Fertility by Age by Marriage Status in Narragansett Pier
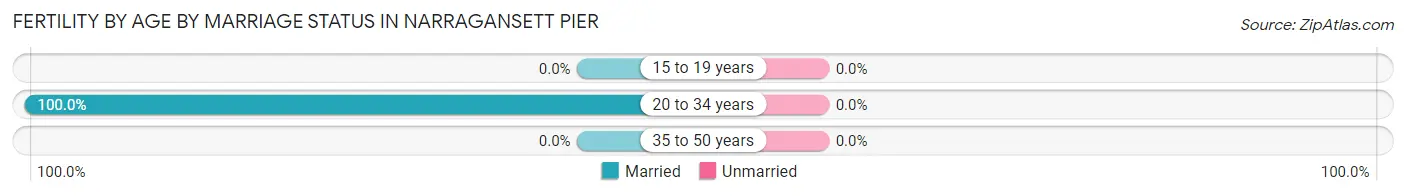
| Age Bracket | Married | Unmarried |
| 15 to 19 years | 0 (0.0%) | 0 (0.0%) |
| 20 to 34 years | 45 (100.0%) | 0 (0.0%) |
| 35 to 50 years | 0 (0.0%) | 0 (0.0%) |
| Total | 45 (100.0%) | 0 (0.0%) |
Fertility by Education in Narragansett Pier
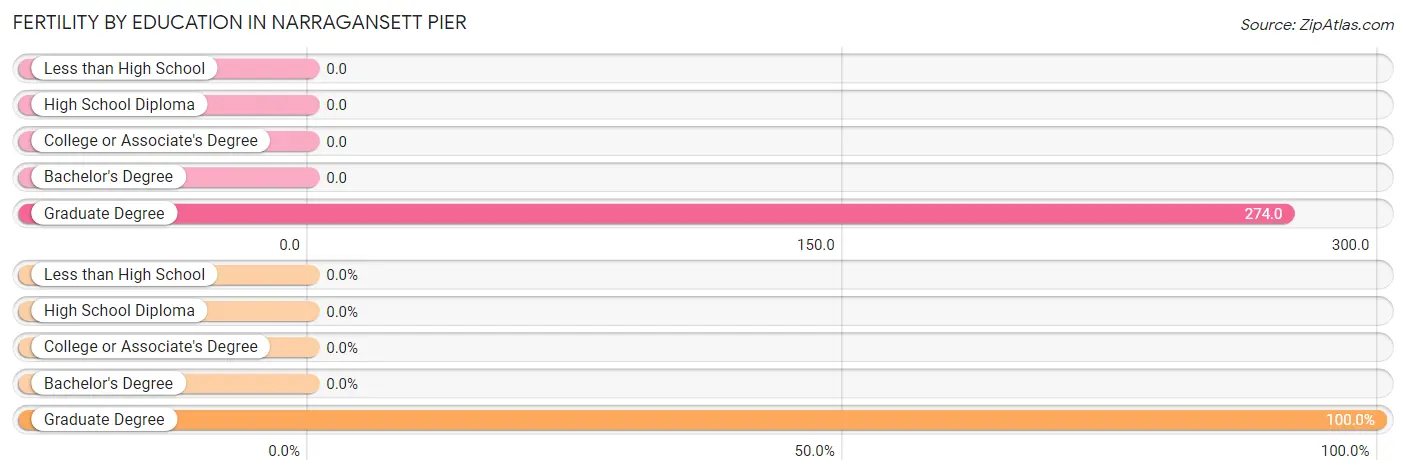
| Educational Attainment | Women with Births | Births / 1,000 Women |
| Less than High School | 0 (0.0%) | 0.0 |
| High School Diploma | 0 (0.0%) | 0.0 |
| College or Associate's Degree | 0 (0.0%) | 0.0 |
| Bachelor's Degree | 0 (0.0%) | 0.0 |
| Graduate Degree | 45 (100.0%) | 274.0 |
| Total | 45 (100.0%) | 67.0 |
Fertility by Education by Marriage Status in Narragansett Pier
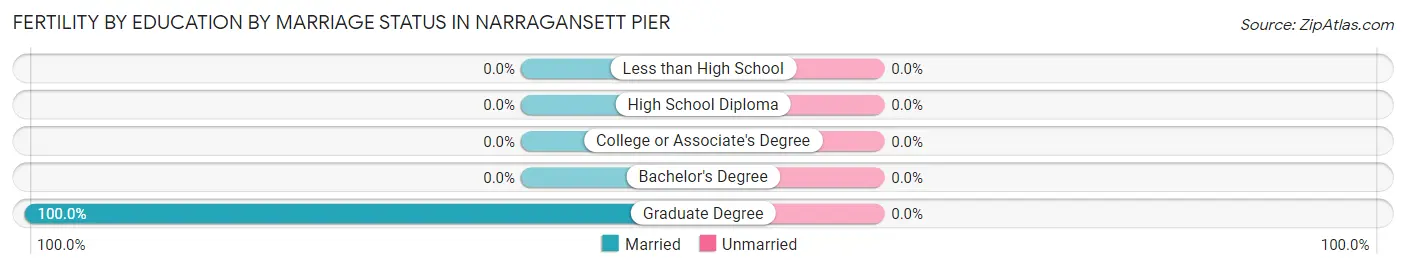
| Educational Attainment | Married | Unmarried |
| Less than High School | 0 (0.0%) | 0 (0.0%) |
| High School Diploma | 0 (0.0%) | 0 (0.0%) |
| College or Associate's Degree | 0 (0.0%) | 0 (0.0%) |
| Bachelor's Degree | 0 (0.0%) | 0 (0.0%) |
| Graduate Degree | 45 (100.0%) | 0 (0.0%) |
| Total | 45 (100.0%) | 0 (0.0%) |
Employment Characteristics in Narragansett Pier
Employment by Class of Employer in Narragansett Pier
Among the 1,325 employed individuals in Narragansett Pier, private company employees (693 | 52.3%), not-for-profit organizations (232 | 17.5%), and state government employees (152 | 11.5%) make up the most common classes of employment.
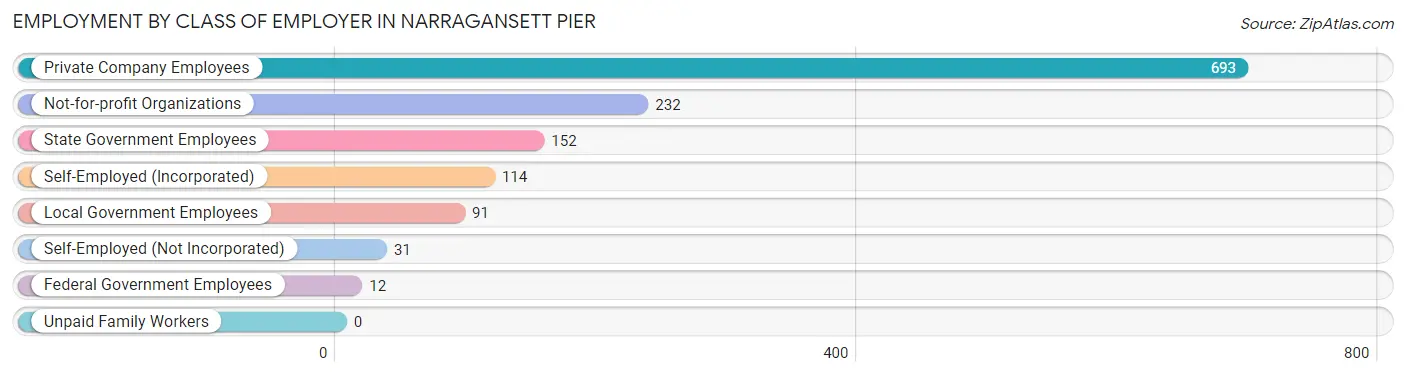
| Employer Class | # Employees | % Employees |
| Private Company Employees | 693 | 52.3% |
| Self-Employed (Incorporated) | 114 | 8.6% |
| Self-Employed (Not Incorporated) | 31 | 2.3% |
| Not-for-profit Organizations | 232 | 17.5% |
| Local Government Employees | 91 | 6.9% |
| State Government Employees | 152 | 11.5% |
| Federal Government Employees | 12 | 0.9% |
| Unpaid Family Workers | 0 | 0.0% |
| Total | 1,325 | 100.0% |
Employment Status by Age in Narragansett Pier
According to the labor force statistics for Narragansett Pier, out of the total population over 16 years of age (2,599), 58.4% or 1,518 individuals are in the labor force, with 11.6% or 176 of them unemployed. The age group with the highest labor force participation rate is 35 to 44 years, with 100.0% or 150 individuals in the labor force. Within the labor force, the 35 to 44 years age range has the highest percentage of unemployed individuals, with 30.0% or 45 of them being unemployed.
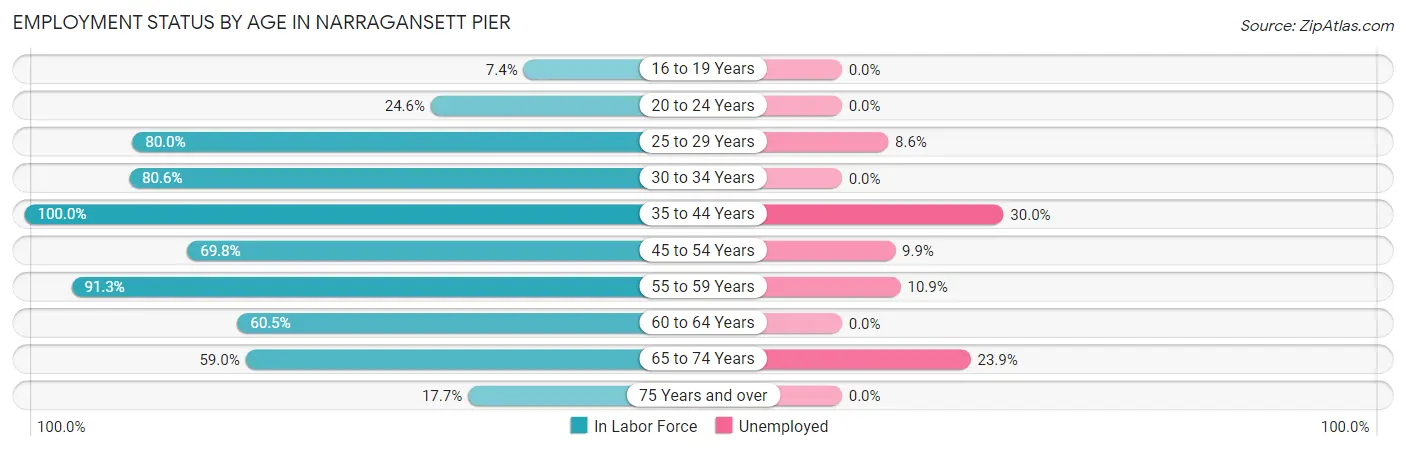
| Age Bracket | In Labor Force | Unemployed |
| 16 to 19 Years | 9 (7.4%) | 0 (0.0%) |
| 20 to 24 Years | 73 (24.6%) | 0 (0.0%) |
| 25 to 29 Years | 140 (80.0%) | 12 (8.6%) |
| 30 to 34 Years | 170 (80.6%) | 0 (0.0%) |
| 35 to 44 Years | 150 (100.0%) | 45 (30.0%) |
| 45 to 54 Years | 192 (69.8%) | 19 (9.9%) |
| 55 to 59 Years | 294 (91.3%) | 32 (10.9%) |
| 60 to 64 Years | 150 (60.5%) | 0 (0.0%) |
| 65 to 74 Years | 285 (59.0%) | 68 (23.9%) |
| 75 Years and over | 56 (17.7%) | 0 (0.0%) |
| Total | 1,518 (58.4%) | 176 (11.6%) |
Employment Status by Educational Attainment in Narragansett Pier
According to labor force statistics for Narragansett Pier, 79.4% of individuals (1,097) out of the total population between 25 and 64 years of age (1,381) are in the labor force, with 9.9% or 109 of them being unemployed. The group with the highest labor force participation rate are those with the educational attainment of bachelor's degree or higher, with 84.4% or 729 individuals in the labor force. Within the labor force, individuals with high school diploma education have the highest percentage of unemployment, with 14.3% or 20 of them being unemployed.
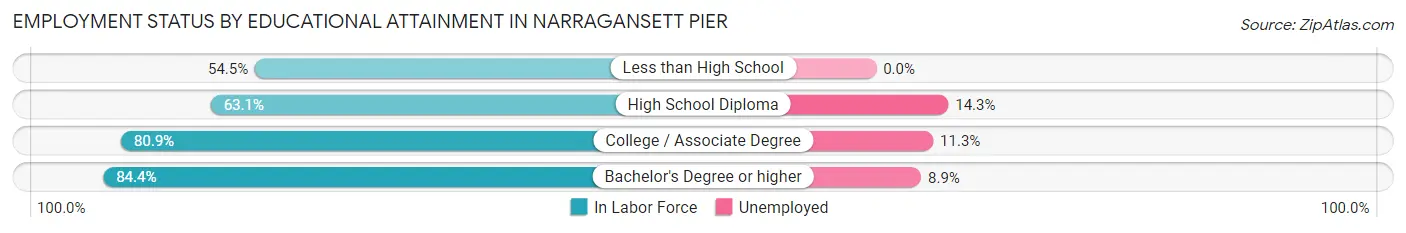
| Educational Attainment | In Labor Force | Unemployed |
| Less than High School | 24 (54.5%) | 0 (0.0%) |
| High School Diploma | 140 (63.1%) | 32 (14.3%) |
| College / Associate Degree | 203 (80.9%) | 28 (11.3%) |
| Bachelor's Degree or higher | 729 (84.4%) | 77 (8.9%) |
| Total | 1,097 (79.4%) | 137 (9.9%) |
Employment Occupations by Sex in Narragansett Pier
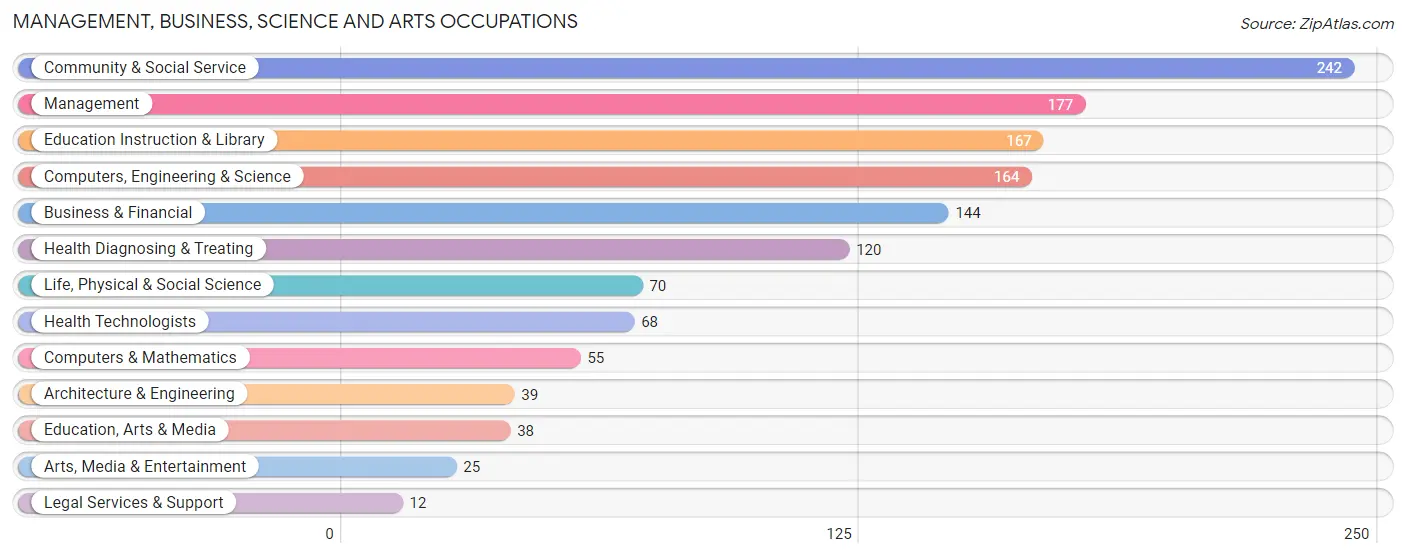
Management, Business, Science and Arts Occupations
The most common Management, Business, Science and Arts occupations in Narragansett Pier are Community & Social Service (242 | 18.0%), Management (177 | 13.2%), Education Instruction & Library (167 | 12.4%), Computers, Engineering & Science (164 | 12.2%), and Business & Financial (144 | 10.7%).
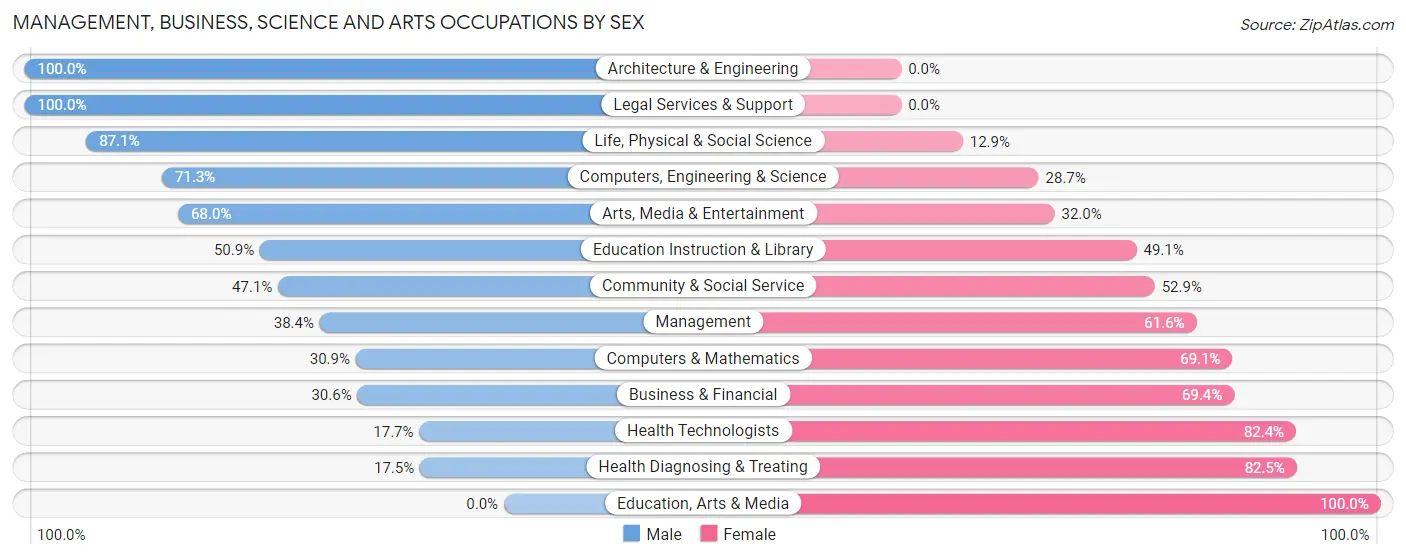
Management, Business, Science and Arts Occupations by Sex
Within the Management, Business, Science and Arts occupations in Narragansett Pier, the most male-oriented occupations are Architecture & Engineering (100.0%), Legal Services & Support (100.0%), and Life, Physical & Social Science (87.1%), while the most female-oriented occupations are Education, Arts & Media (100.0%), Health Diagnosing & Treating (82.5%), and Health Technologists (82.4%).
| Occupation | Male | Female |
| Management | 68 (38.4%) | 109 (61.6%) |
| Business & Financial | 44 (30.6%) | 100 (69.4%) |
| Computers, Engineering & Science | 117 (71.3%) | 47 (28.7%) |
| Computers & Mathematics | 17 (30.9%) | 38 (69.1%) |
| Architecture & Engineering | 39 (100.0%) | 0 (0.0%) |
| Life, Physical & Social Science | 61 (87.1%) | 9 (12.9%) |
| Community & Social Service | 114 (47.1%) | 128 (52.9%) |
| Education, Arts & Media | 0 (0.0%) | 38 (100.0%) |
| Legal Services & Support | 12 (100.0%) | 0 (0.0%) |
| Education Instruction & Library | 85 (50.9%) | 82 (49.1%) |
| Arts, Media & Entertainment | 17 (68.0%) | 8 (32.0%) |
| Health Diagnosing & Treating | 21 (17.5%) | 99 (82.5%) |
| Health Technologists | 12 (17.6%) | 56 (82.4%) |
| Total (Category) | 364 (43.0%) | 483 (57.0%) |
| Total (Overall) | 619 (46.1%) | 724 (53.9%) |
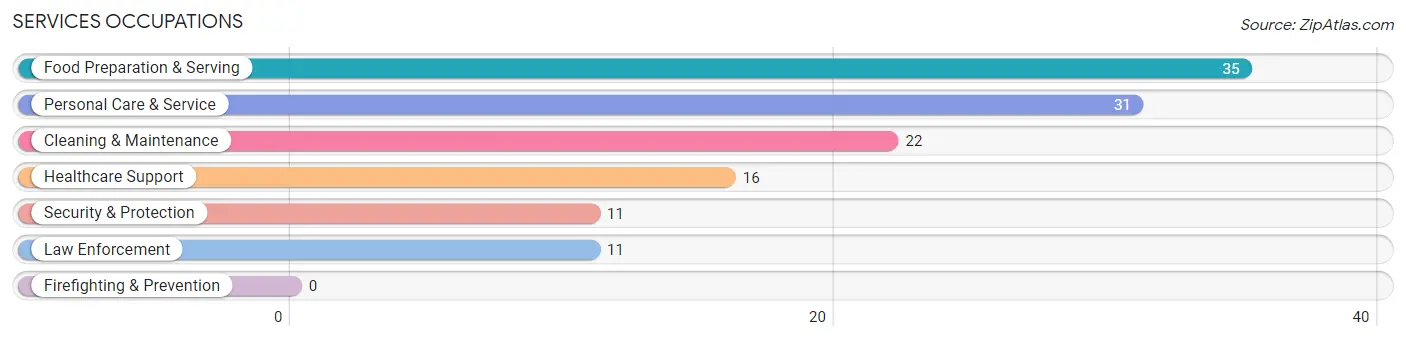
Services Occupations
The most common Services occupations in Narragansett Pier are Food Preparation & Serving (35 | 2.6%), Personal Care & Service (31 | 2.3%), Cleaning & Maintenance (22 | 1.6%), Healthcare Support (16 | 1.2%), and Security & Protection (11 | 0.8%).
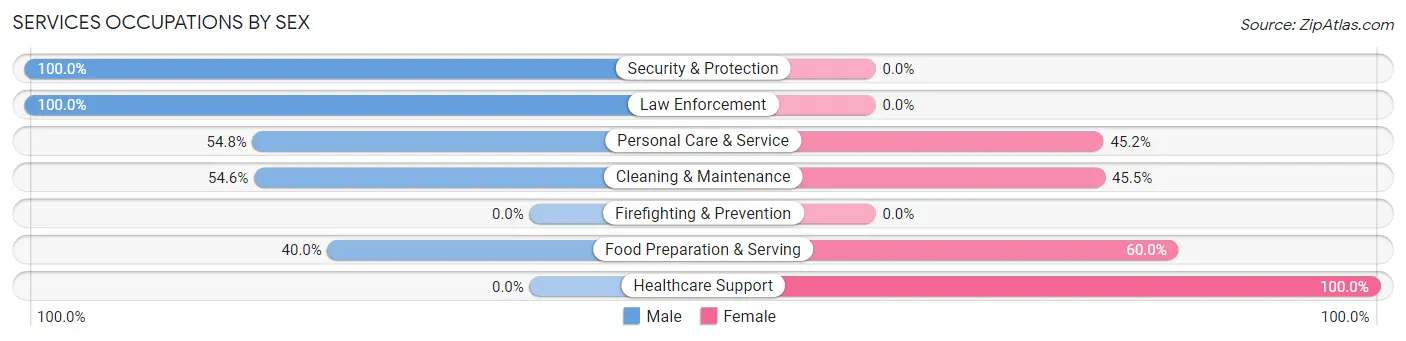
Services Occupations by Sex
Within the Services occupations in Narragansett Pier, the most male-oriented occupations are Security & Protection (100.0%), Law Enforcement (100.0%), and Personal Care & Service (54.8%), while the most female-oriented occupations are Healthcare Support (100.0%), Food Preparation & Serving (60.0%), and Cleaning & Maintenance (45.5%).
| Occupation | Male | Female |
| Healthcare Support | 0 (0.0%) | 16 (100.0%) |
| Security & Protection | 11 (100.0%) | 0 (0.0%) |
| Firefighting & Prevention | 0 (0.0%) | 0 (0.0%) |
| Law Enforcement | 11 (100.0%) | 0 (0.0%) |
| Food Preparation & Serving | 14 (40.0%) | 21 (60.0%) |
| Cleaning & Maintenance | 12 (54.5%) | 10 (45.5%) |
| Personal Care & Service | 17 (54.8%) | 14 (45.2%) |
| Total (Category) | 54 (47.0%) | 61 (53.0%) |
| Total (Overall) | 619 (46.1%) | 724 (53.9%) |
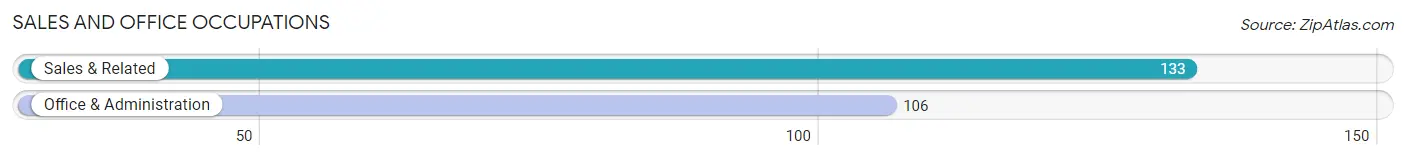
Sales and Office Occupations
The most common Sales and Office occupations in Narragansett Pier are Sales & Related (133 | 9.9%), and Office & Administration (106 | 7.9%).
Sales and Office Occupations by Sex
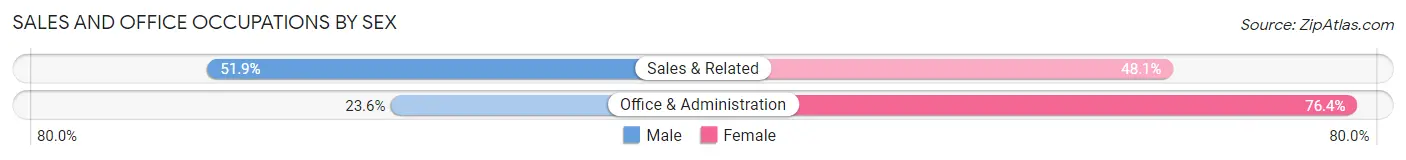
| Occupation | Male | Female |
| Sales & Related | 69 (51.9%) | 64 (48.1%) |
| Office & Administration | 25 (23.6%) | 81 (76.4%) |
| Total (Category) | 94 (39.3%) | 145 (60.7%) |
| Total (Overall) | 619 (46.1%) | 724 (53.9%) |
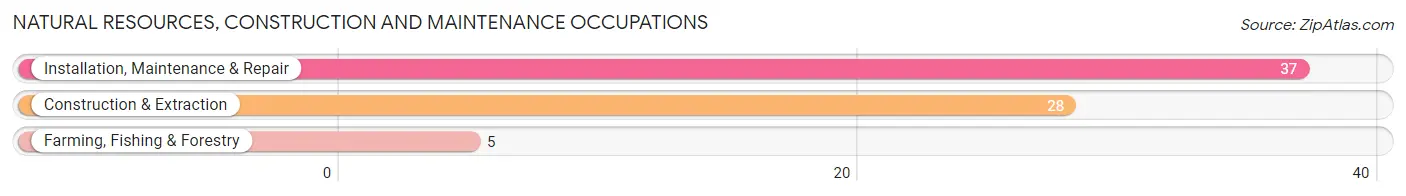
Natural Resources, Construction and Maintenance Occupations
The most common Natural Resources, Construction and Maintenance occupations in Narragansett Pier are Installation, Maintenance & Repair (37 | 2.8%), Construction & Extraction (28 | 2.1%), and Farming, Fishing & Forestry (5 | 0.4%).
Natural Resources, Construction and Maintenance Occupations by Sex
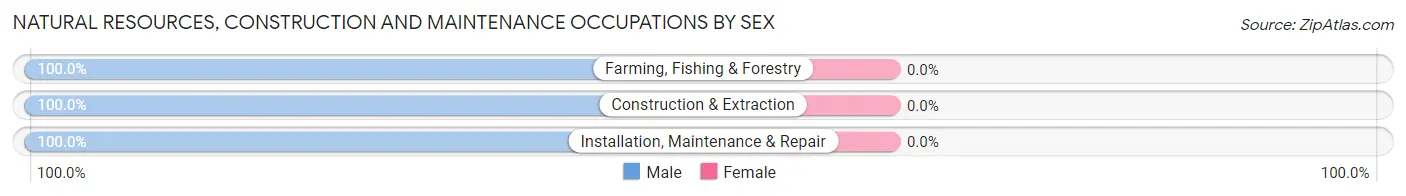
| Occupation | Male | Female |
| Farming, Fishing & Forestry | 5 (100.0%) | 0 (0.0%) |
| Construction & Extraction | 28 (100.0%) | 0 (0.0%) |
| Installation, Maintenance & Repair | 37 (100.0%) | 0 (0.0%) |
| Total (Category) | 70 (100.0%) | 0 (0.0%) |
| Total (Overall) | 619 (46.1%) | 724 (53.9%) |
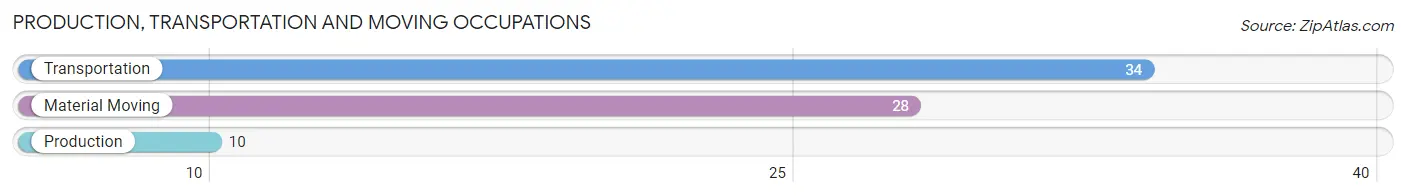
Production, Transportation and Moving Occupations
The most common Production, Transportation and Moving occupations in Narragansett Pier are Transportation (34 | 2.5%), Material Moving (28 | 2.1%), and Production (10 | 0.7%).
Production, Transportation and Moving Occupations by Sex
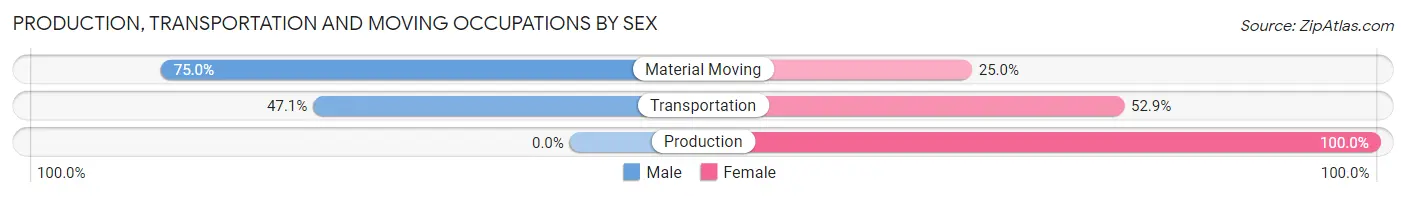
| Occupation | Male | Female |
| Production | 0 (0.0%) | 10 (100.0%) |
| Transportation | 16 (47.1%) | 18 (52.9%) |
| Material Moving | 21 (75.0%) | 7 (25.0%) |
| Total (Category) | 37 (51.4%) | 35 (48.6%) |
| Total (Overall) | 619 (46.1%) | 724 (53.9%) |
Employment Industries by Sex in Narragansett Pier
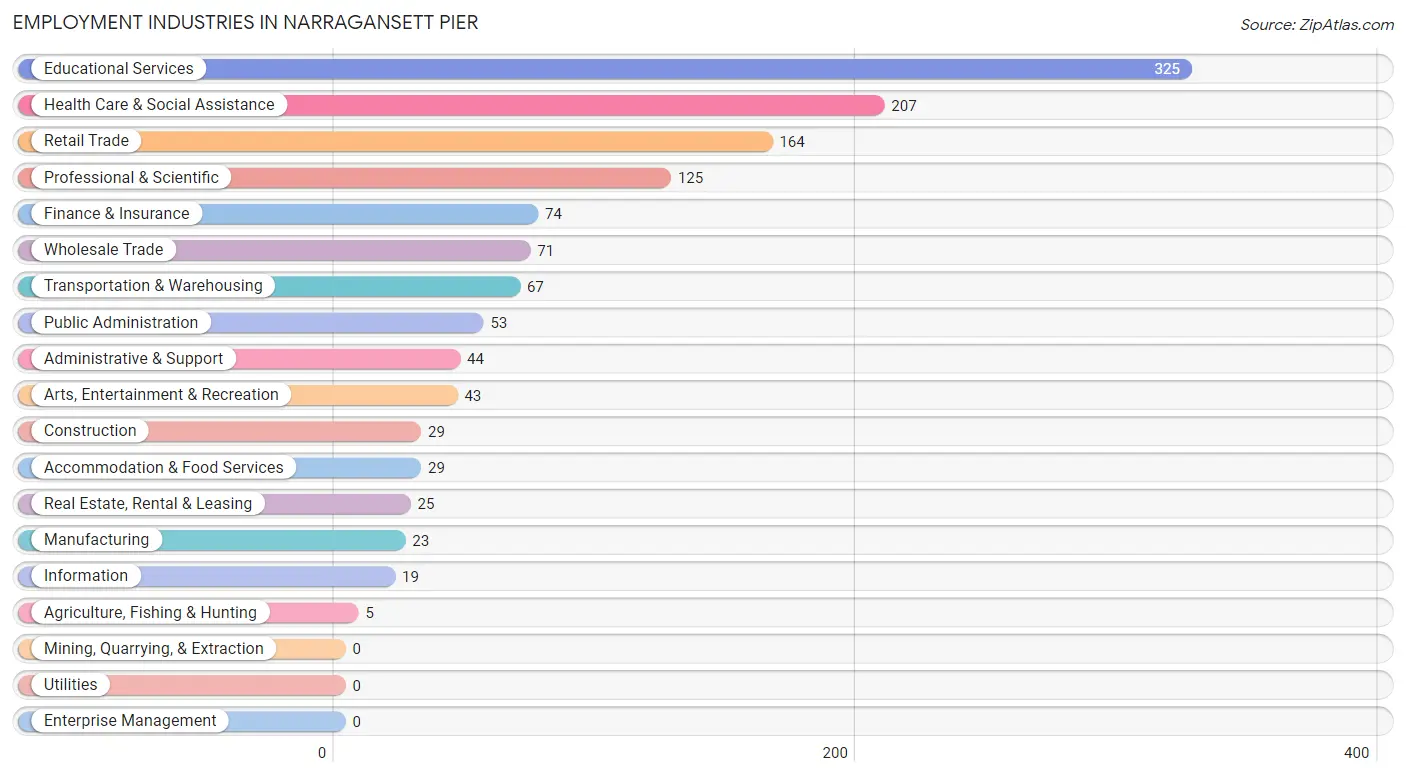
Employment Industries in Narragansett Pier
The major employment industries in Narragansett Pier include Educational Services (325 | 24.2%), Health Care & Social Assistance (207 | 15.4%), Retail Trade (164 | 12.2%), Professional & Scientific (125 | 9.3%), and Finance & Insurance (74 | 5.5%).
Employment Industries by Sex in Narragansett Pier
The Narragansett Pier industries that see more men than women are Agriculture, Fishing & Hunting (100.0%), Construction (100.0%), and Manufacturing (100.0%), whereas the industries that tend to have a higher number of women are Information (100.0%), Administrative & Support (72.7%), and Accommodation & Food Services (72.4%).
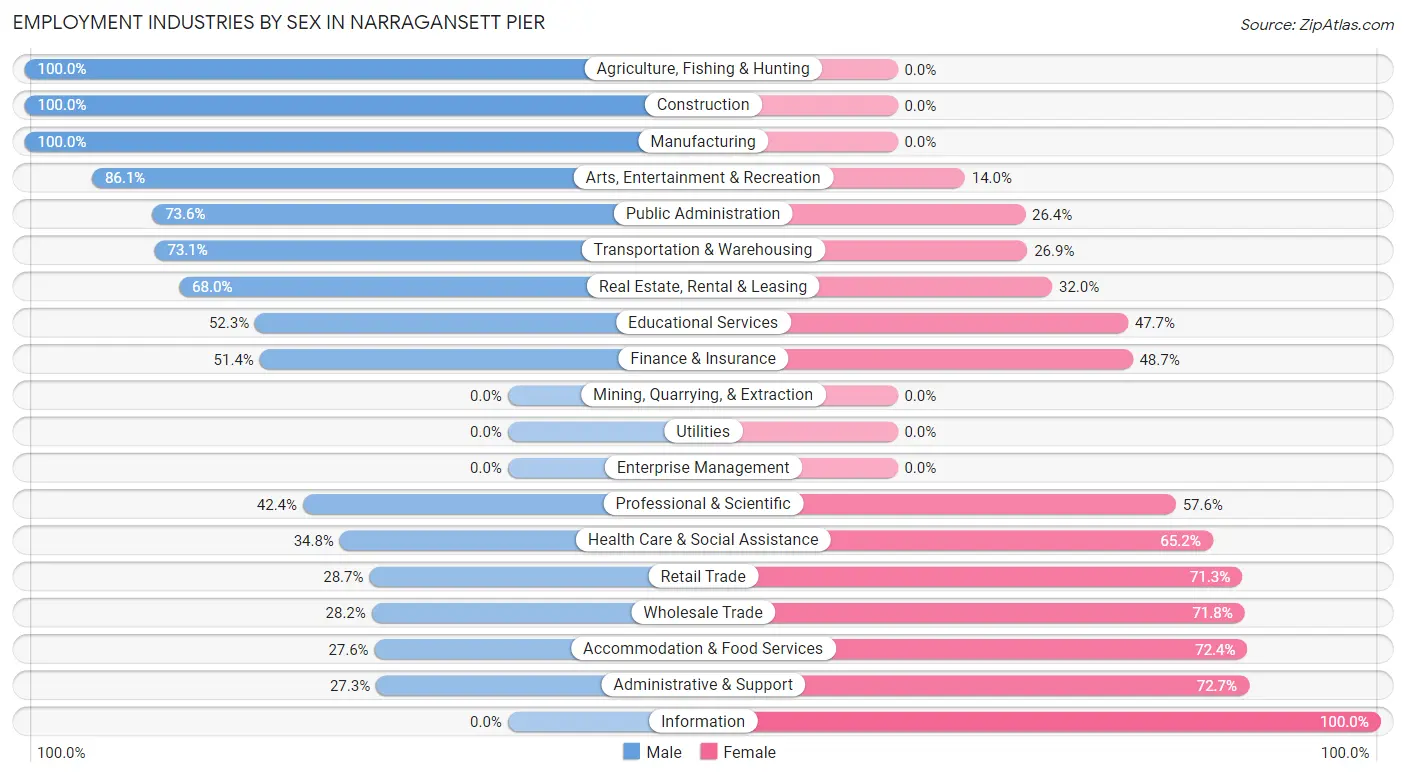
| Industry | Male | Female |
| Agriculture, Fishing & Hunting | 5 (100.0%) | 0 (0.0%) |
| Mining, Quarrying, & Extraction | 0 (0.0%) | 0 (0.0%) |
| Construction | 29 (100.0%) | 0 (0.0%) |
| Manufacturing | 23 (100.0%) | 0 (0.0%) |
| Wholesale Trade | 20 (28.2%) | 51 (71.8%) |
| Retail Trade | 47 (28.7%) | 117 (71.3%) |
| Transportation & Warehousing | 49 (73.1%) | 18 (26.9%) |
| Utilities | 0 (0.0%) | 0 (0.0%) |
| Information | 0 (0.0%) | 19 (100.0%) |
| Finance & Insurance | 38 (51.3%) | 36 (48.6%) |
| Real Estate, Rental & Leasing | 17 (68.0%) | 8 (32.0%) |
| Professional & Scientific | 53 (42.4%) | 72 (57.6%) |
| Enterprise Management | 0 (0.0%) | 0 (0.0%) |
| Administrative & Support | 12 (27.3%) | 32 (72.7%) |
| Educational Services | 170 (52.3%) | 155 (47.7%) |
| Health Care & Social Assistance | 72 (34.8%) | 135 (65.2%) |
| Arts, Entertainment & Recreation | 37 (86.1%) | 6 (14.0%) |
| Accommodation & Food Services | 8 (27.6%) | 21 (72.4%) |
| Public Administration | 39 (73.6%) | 14 (26.4%) |
| Total | 619 (46.1%) | 724 (53.9%) |
Education in Narragansett Pier
School Enrollment in Narragansett Pier
The most common levels of schooling among the 646 students in Narragansett Pier are college / undergraduate (306 | 47.4%), high school (102 | 15.8%), and graduate / professional (92 | 14.2%).
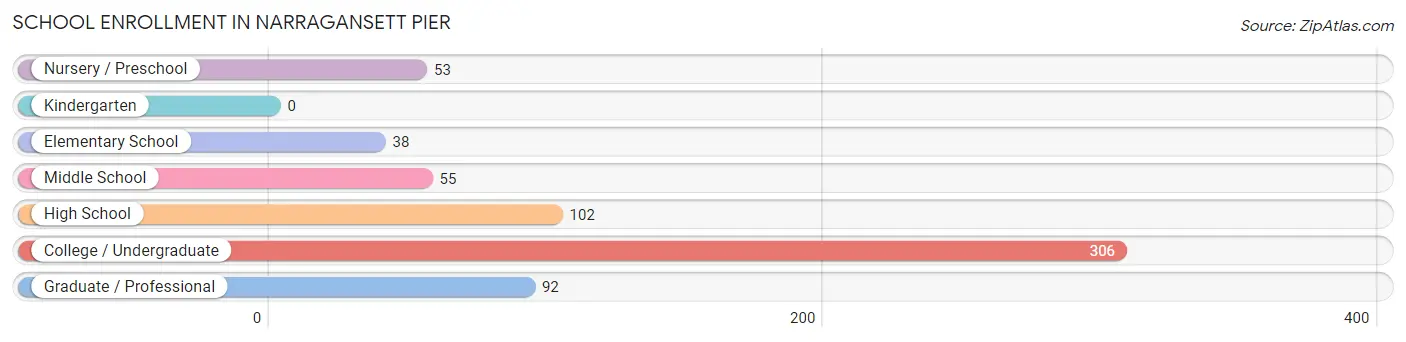
| School Level | # Students | % Students |
| Nursery / Preschool | 53 | 8.2% |
| Kindergarten | 0 | 0.0% |
| Elementary School | 38 | 5.9% |
| Middle School | 55 | 8.5% |
| High School | 102 | 15.8% |
| College / Undergraduate | 306 | 47.4% |
| Graduate / Professional | 92 | 14.2% |
| Total | 646 | 100.0% |
School Enrollment by Age by Funding Source in Narragansett Pier
Out of a total of 646 students who are enrolled in schools in Narragansett Pier, 57 (8.8%) attend a private institution, while the remaining 589 (91.2%) are enrolled in public schools. The age group of 25 to 34 year olds has the highest likelihood of being enrolled in private schools, with 6 (100.0% in the age bracket) enrolled. Conversely, the age group of 3 to 4 year olds has the lowest likelihood of being enrolled in a private school, with 53 (100.0% in the age bracket) attending a public institution.
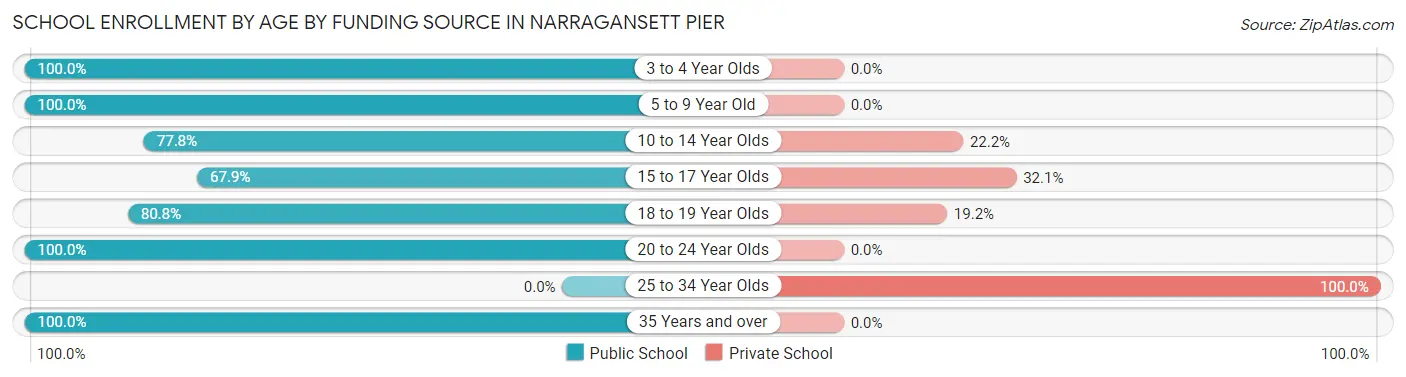
| Age Bracket | Public School | Private School |
| 3 to 4 Year Olds | 53 (100.0%) | 0 (0.0%) |
| 5 to 9 Year Old | 38 (100.0%) | 0 (0.0%) |
| 10 to 14 Year Olds | 49 (77.8%) | 14 (22.2%) |
| 15 to 17 Year Olds | 57 (67.9%) | 27 (32.1%) |
| 18 to 19 Year Olds | 42 (80.8%) | 10 (19.2%) |
| 20 to 24 Year Olds | 277 (100.0%) | 0 (0.0%) |
| 25 to 34 Year Olds | 0 (0.0%) | 6 (100.0%) |
| 35 Years and over | 73 (100.0%) | 0 (0.0%) |
| Total | 589 (91.2%) | 57 (8.8%) |
Educational Attainment by Field of Study in Narragansett Pier
Business (183 | 13.9%), engineering (157 | 11.9%), education (135 | 10.3%), science & technology (132 | 10.1%), and social sciences (121 | 9.2%) are the most common fields of study among 1,314 individuals in Narragansett Pier who have obtained a bachelor's degree or higher.
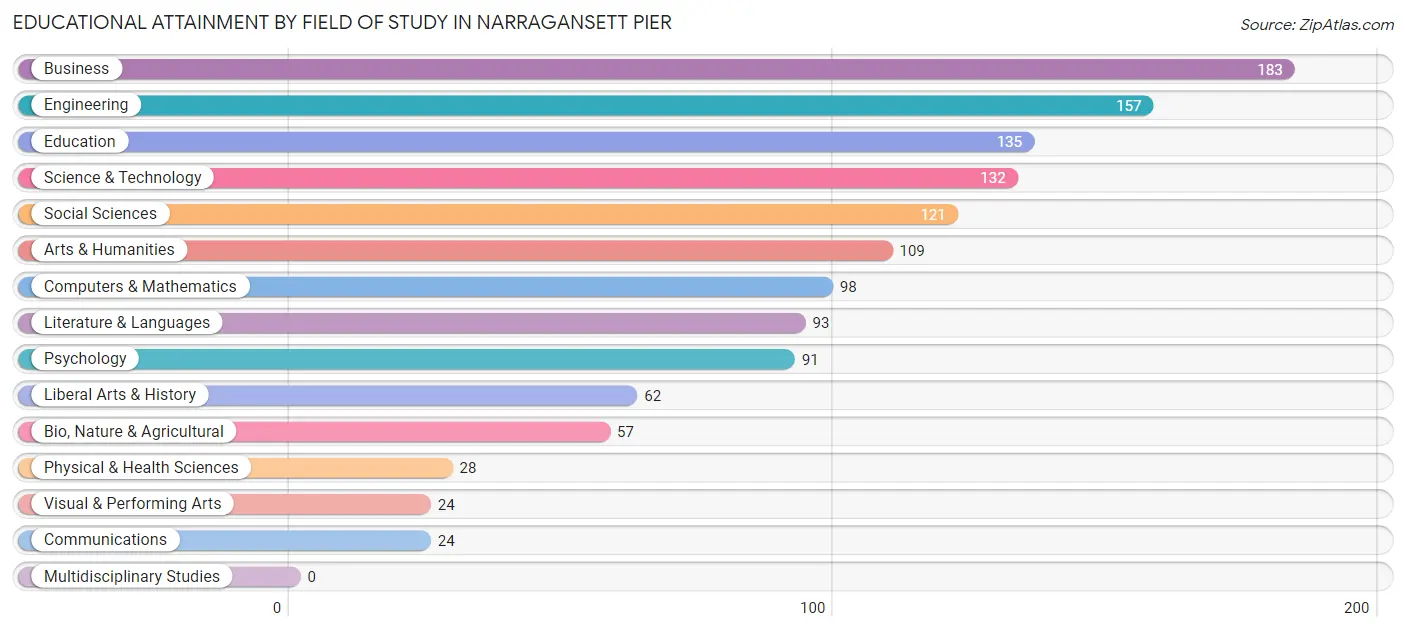
| Field of Study | # Graduates | % Graduates |
| Computers & Mathematics | 98 | 7.5% |
| Bio, Nature & Agricultural | 57 | 4.3% |
| Physical & Health Sciences | 28 | 2.1% |
| Psychology | 91 | 6.9% |
| Social Sciences | 121 | 9.2% |
| Engineering | 157 | 11.9% |
| Multidisciplinary Studies | 0 | 0.0% |
| Science & Technology | 132 | 10.1% |
| Business | 183 | 13.9% |
| Education | 135 | 10.3% |
| Literature & Languages | 93 | 7.1% |
| Liberal Arts & History | 62 | 4.7% |
| Visual & Performing Arts | 24 | 1.8% |
| Communications | 24 | 1.8% |
| Arts & Humanities | 109 | 8.3% |
| Total | 1,314 | 100.0% |
Transportation & Commute in Narragansett Pier
Vehicle Availability by Sex in Narragansett Pier
The most prevalent vehicle ownership categories in Narragansett Pier are males with 2 vehicles (224, accounting for 39.0%) and females with 2 vehicles (288, making up 31.2%).
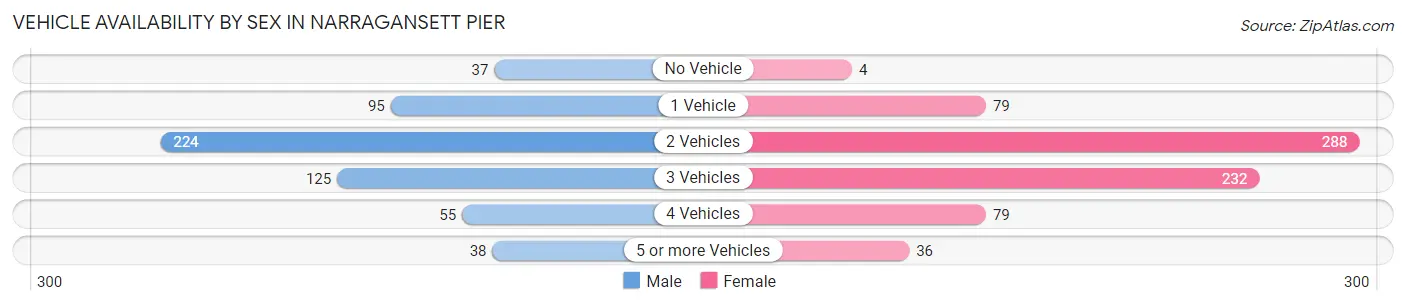
| Vehicles Available | Male | Female |
| No Vehicle | 37 (6.5%) | 4 (0.6%) |
| 1 Vehicle | 95 (16.6%) | 79 (11.0%) |
| 2 Vehicles | 224 (39.0%) | 288 (40.1%) |
| 3 Vehicles | 125 (21.8%) | 232 (32.3%) |
| 4 Vehicles | 55 (9.6%) | 79 (11.0%) |
| 5 or more Vehicles | 38 (6.6%) | 36 (5.0%) |
| Total | 574 (100.0%) | 718 (100.0%) |
Commute Time in Narragansett Pier
The most frequently occuring commute durations in Narragansett Pier are 5 to 9 minutes (236 commuters, 20.4%), 10 to 14 minutes (196 commuters, 16.9%), and 20 to 24 minutes (185 commuters, 16.0%).
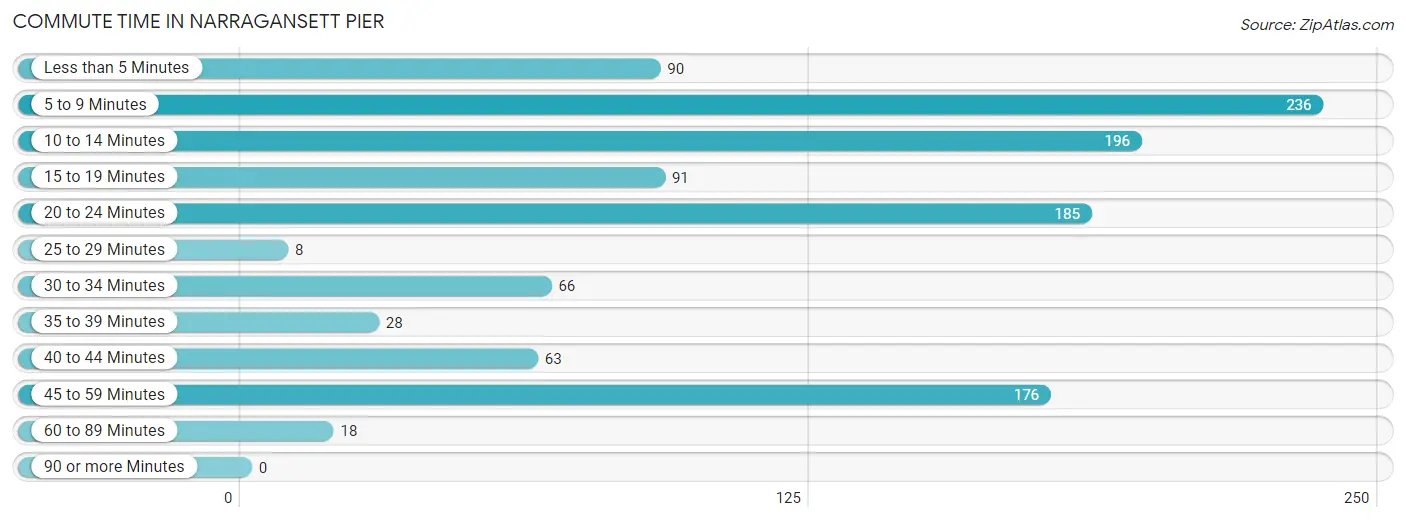
| Commute Time | # Commuters | % Commuters |
| Less than 5 Minutes | 90 | 7.8% |
| 5 to 9 Minutes | 236 | 20.4% |
| 10 to 14 Minutes | 196 | 16.9% |
| 15 to 19 Minutes | 91 | 7.9% |
| 20 to 24 Minutes | 185 | 16.0% |
| 25 to 29 Minutes | 8 | 0.7% |
| 30 to 34 Minutes | 66 | 5.7% |
| 35 to 39 Minutes | 28 | 2.4% |
| 40 to 44 Minutes | 63 | 5.4% |
| 45 to 59 Minutes | 176 | 15.2% |
| 60 to 89 Minutes | 18 | 1.6% |
| 90 or more Minutes | 0 | 0.0% |
Commute Time by Sex in Narragansett Pier
The most common commute times in Narragansett Pier are 45 to 59 minutes (151 commuters, 27.3%) for males and 5 to 9 minutes (168 commuters, 27.9%) for females.
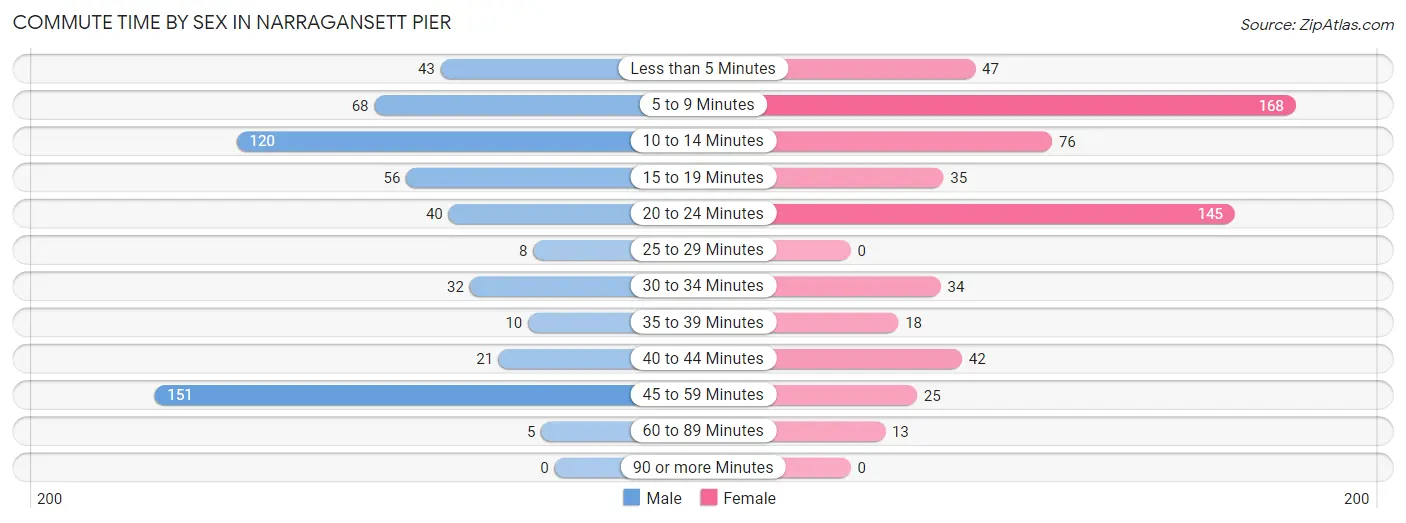
| Commute Time | Male | Female |
| Less than 5 Minutes | 43 (7.8%) | 47 (7.8%) |
| 5 to 9 Minutes | 68 (12.3%) | 168 (27.9%) |
| 10 to 14 Minutes | 120 (21.7%) | 76 (12.6%) |
| 15 to 19 Minutes | 56 (10.1%) | 35 (5.8%) |
| 20 to 24 Minutes | 40 (7.2%) | 145 (24.0%) |
| 25 to 29 Minutes | 8 (1.4%) | 0 (0.0%) |
| 30 to 34 Minutes | 32 (5.8%) | 34 (5.6%) |
| 35 to 39 Minutes | 10 (1.8%) | 18 (3.0%) |
| 40 to 44 Minutes | 21 (3.8%) | 42 (7.0%) |
| 45 to 59 Minutes | 151 (27.3%) | 25 (4.2%) |
| 60 to 89 Minutes | 5 (0.9%) | 13 (2.2%) |
| 90 or more Minutes | 0 (0.0%) | 0 (0.0%) |
Time of Departure to Work by Sex in Narragansett Pier
The most frequent times of departure to work in Narragansett Pier are 7:30 AM to 7:59 AM (123, 22.2%) for males and 9:00 AM to 9:59 AM (104, 17.2%) for females.
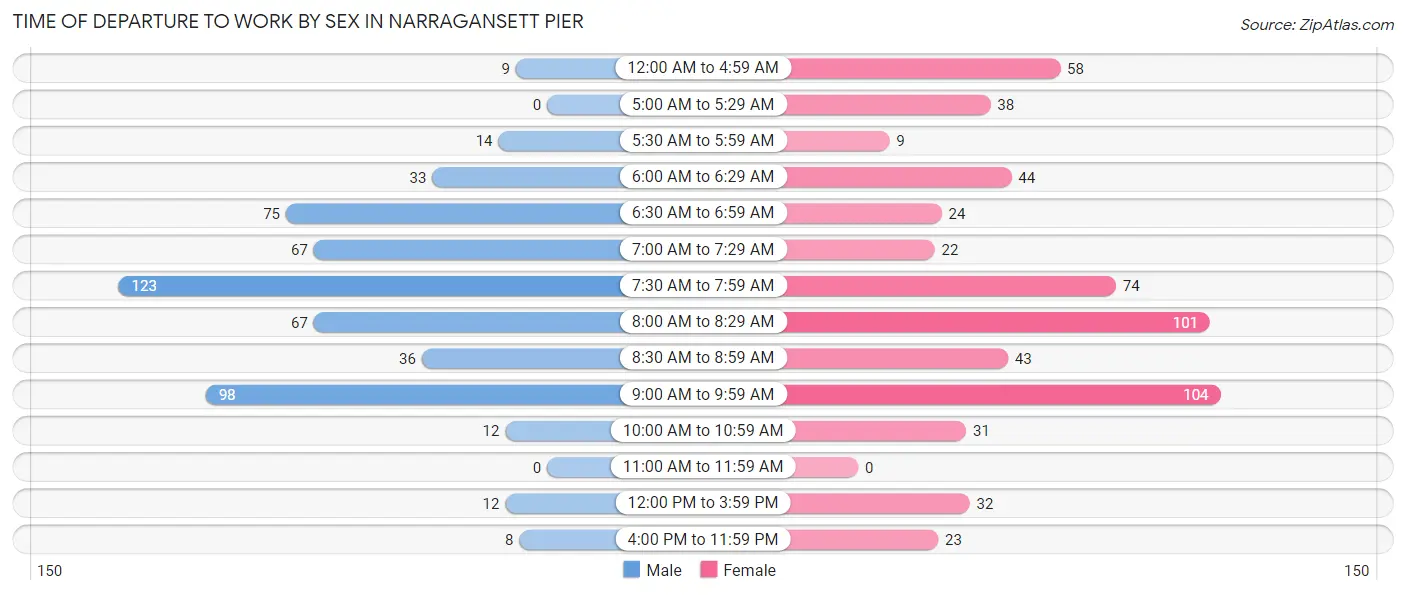
| Time of Departure | Male | Female |
| 12:00 AM to 4:59 AM | 9 (1.6%) | 58 (9.6%) |
| 5:00 AM to 5:29 AM | 0 (0.0%) | 38 (6.3%) |
| 5:30 AM to 5:59 AM | 14 (2.5%) | 9 (1.5%) |
| 6:00 AM to 6:29 AM | 33 (6.0%) | 44 (7.3%) |
| 6:30 AM to 6:59 AM | 75 (13.5%) | 24 (4.0%) |
| 7:00 AM to 7:29 AM | 67 (12.1%) | 22 (3.6%) |
| 7:30 AM to 7:59 AM | 123 (22.2%) | 74 (12.3%) |
| 8:00 AM to 8:29 AM | 67 (12.1%) | 101 (16.8%) |
| 8:30 AM to 8:59 AM | 36 (6.5%) | 43 (7.1%) |
| 9:00 AM to 9:59 AM | 98 (17.7%) | 104 (17.2%) |
| 10:00 AM to 10:59 AM | 12 (2.2%) | 31 (5.1%) |
| 11:00 AM to 11:59 AM | 0 (0.0%) | 0 (0.0%) |
| 12:00 PM to 3:59 PM | 12 (2.2%) | 32 (5.3%) |
| 4:00 PM to 11:59 PM | 8 (1.4%) | 23 (3.8%) |
| Total | 554 (100.0%) | 603 (100.0%) |
Housing Occupancy in Narragansett Pier
Occupancy by Ownership in Narragansett Pier
Of the total 1,415 dwellings in Narragansett Pier, owner-occupied units account for 799 (56.5%), while renter-occupied units make up 616 (43.5%).
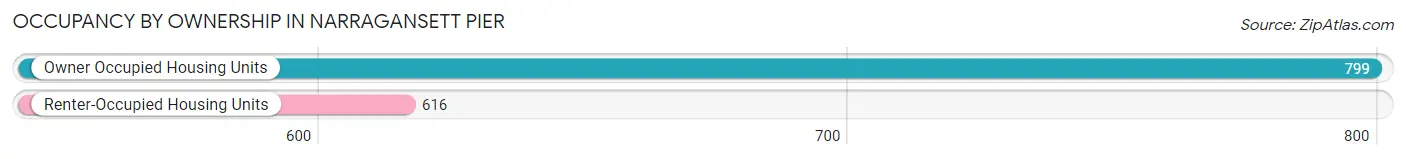
| Occupancy | # Housing Units | % Housing Units |
| Owner Occupied Housing Units | 799 | 56.5% |
| Renter-Occupied Housing Units | 616 | 43.5% |
| Total Occupied Housing Units | 1,415 | 100.0% |
Occupancy by Household Size in Narragansett Pier
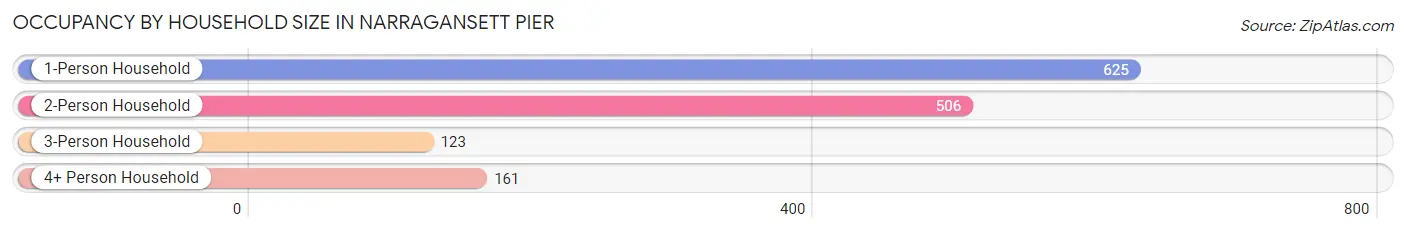
| Household Size | # Housing Units | % Housing Units |
| 1-Person Household | 625 | 44.2% |
| 2-Person Household | 506 | 35.8% |
| 3-Person Household | 123 | 8.7% |
| 4+ Person Household | 161 | 11.4% |
| Total Housing Units | 1,415 | 100.0% |
Occupancy by Ownership by Household Size in Narragansett Pier
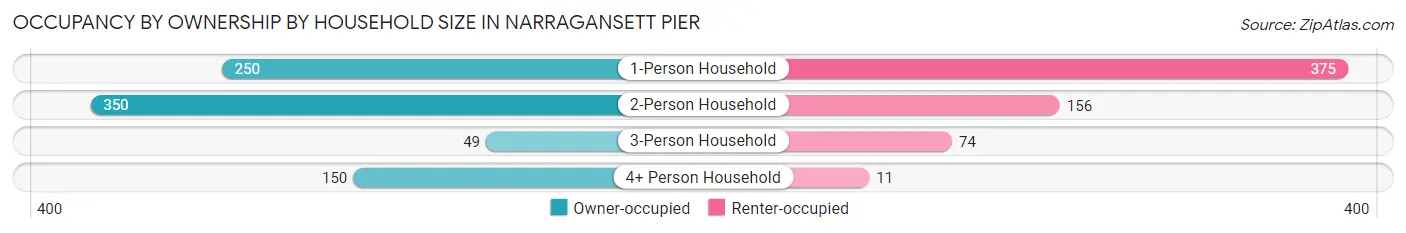
| Household Size | Owner-occupied | Renter-occupied |
| 1-Person Household | 250 (40.0%) | 375 (60.0%) |
| 2-Person Household | 350 (69.2%) | 156 (30.8%) |
| 3-Person Household | 49 (39.8%) | 74 (60.2%) |
| 4+ Person Household | 150 (93.2%) | 11 (6.8%) |
| Total Housing Units | 799 (56.5%) | 616 (43.5%) |
Occupancy by Educational Attainment in Narragansett Pier
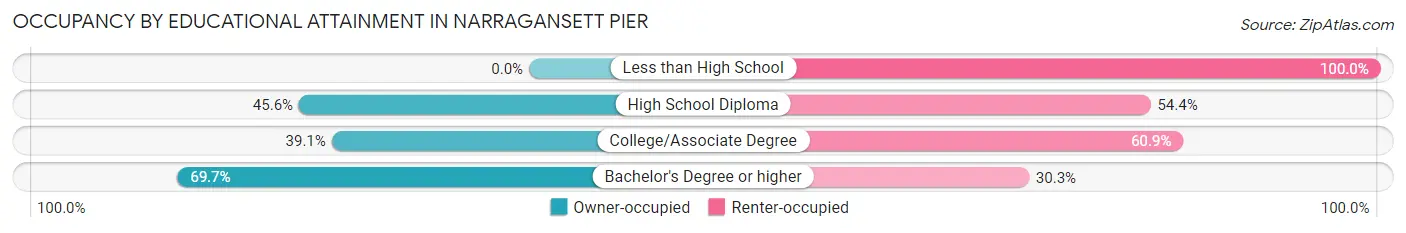
| Household Size | Owner-occupied | Renter-occupied |
| Less than High School | 0 (0.0%) | 9 (100.0%) |
| High School Diploma | 130 (45.6%) | 155 (54.4%) |
| College/Associate Degree | 144 (39.1%) | 224 (60.9%) |
| Bachelor's Degree or higher | 525 (69.7%) | 228 (30.3%) |
Occupancy by Age of Householder in Narragansett Pier
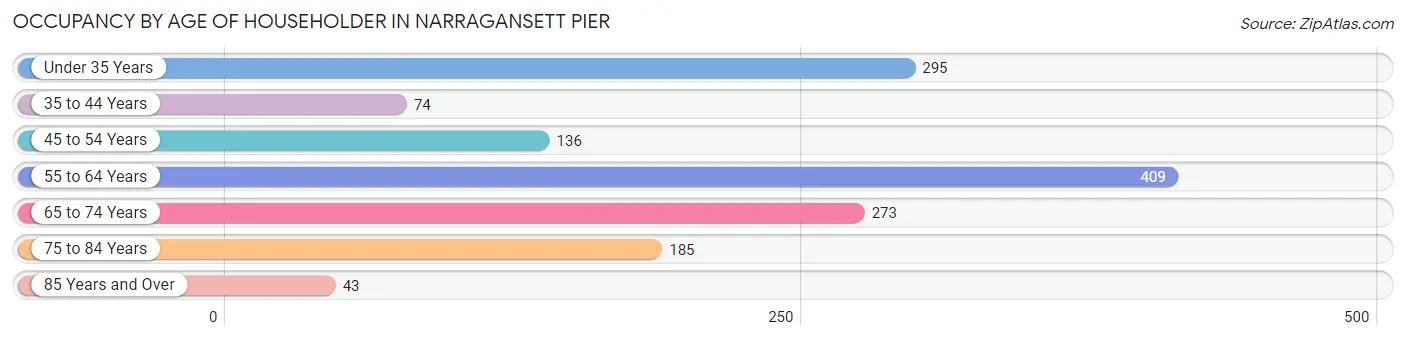
| Age Bracket | # Households | % Households |
| Under 35 Years | 295 | 20.8% |
| 35 to 44 Years | 74 | 5.2% |
| 45 to 54 Years | 136 | 9.6% |
| 55 to 64 Years | 409 | 28.9% |
| 65 to 74 Years | 273 | 19.3% |
| 75 to 84 Years | 185 | 13.1% |
| 85 Years and Over | 43 | 3.0% |
| Total | 1,415 | 100.0% |
Housing Finances in Narragansett Pier
Median Income by Occupancy in Narragansett Pier
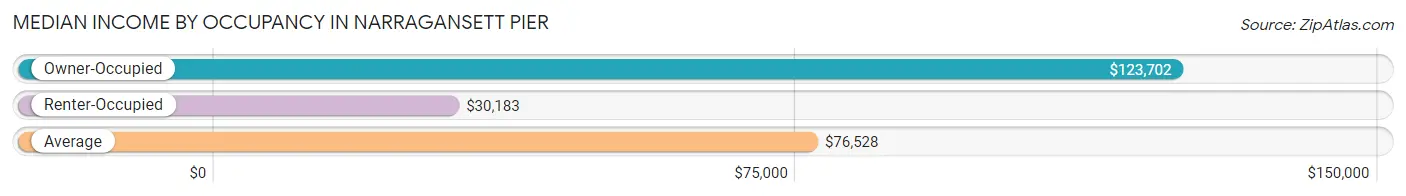
| Occupancy Type | # Households | Median Income |
| Owner-Occupied | 799 (56.5%) | $123,702 |
| Renter-Occupied | 616 (43.5%) | $30,183 |
| Average | 1,415 (100.0%) | $76,528 |
Occupancy by Householder Income Bracket in Narragansett Pier
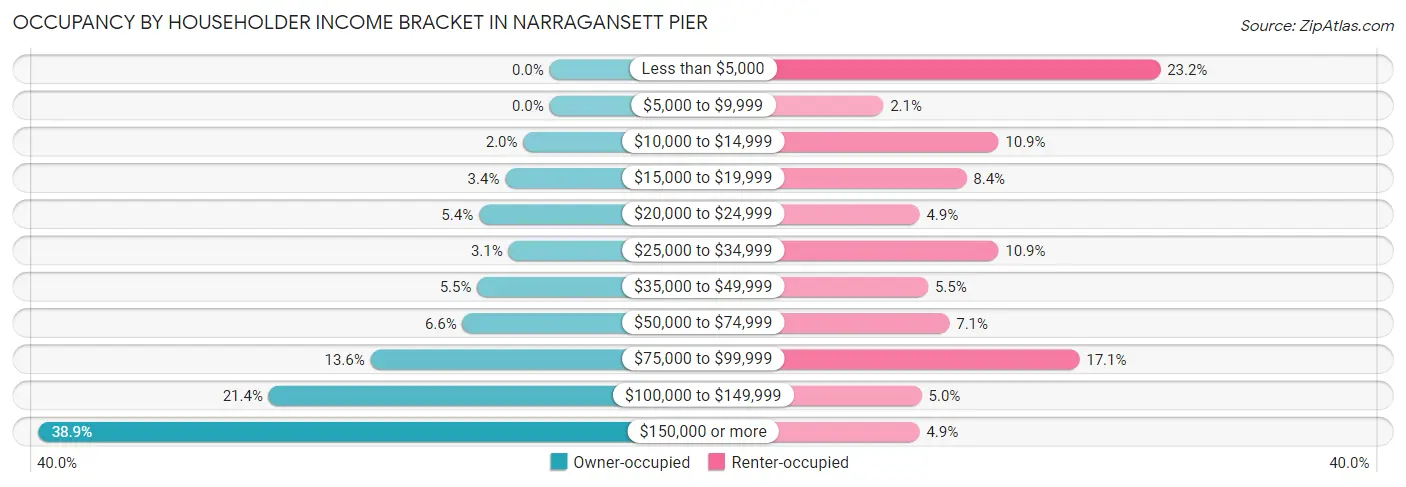
| Income Bracket | Owner-occupied | Renter-occupied |
| Less than $5,000 | 0 (0.0%) | 143 (23.2%) |
| $5,000 to $9,999 | 0 (0.0%) | 13 (2.1%) |
| $10,000 to $14,999 | 16 (2.0%) | 67 (10.9%) |
| $15,000 to $19,999 | 27 (3.4%) | 52 (8.4%) |
| $20,000 to $24,999 | 43 (5.4%) | 30 (4.9%) |
| $25,000 to $34,999 | 25 (3.1%) | 67 (10.9%) |
| $35,000 to $49,999 | 44 (5.5%) | 34 (5.5%) |
| $50,000 to $74,999 | 53 (6.6%) | 44 (7.1%) |
| $75,000 to $99,999 | 109 (13.6%) | 105 (17.1%) |
| $100,000 to $149,999 | 171 (21.4%) | 31 (5.0%) |
| $150,000 or more | 311 (38.9%) | 30 (4.9%) |
| Total | 799 (100.0%) | 616 (100.0%) |
Monthly Housing Cost Tiers in Narragansett Pier
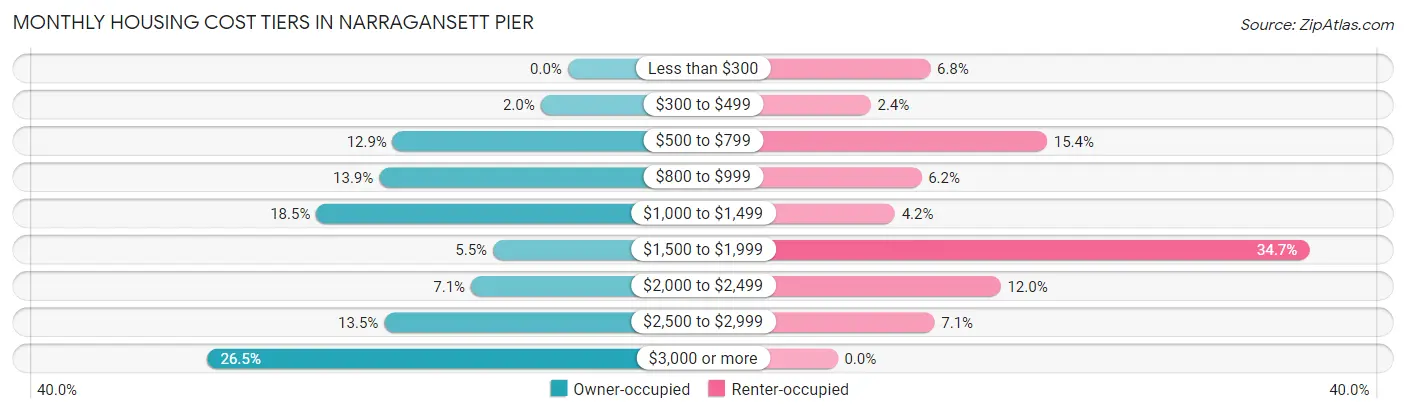
| Monthly Cost | Owner-occupied | Renter-occupied |
| Less than $300 | 0 (0.0%) | 42 (6.8%) |
| $300 to $499 | 16 (2.0%) | 15 (2.4%) |
| $500 to $799 | 103 (12.9%) | 95 (15.4%) |
| $800 to $999 | 111 (13.9%) | 38 (6.2%) |
| $1,000 to $1,499 | 148 (18.5%) | 26 (4.2%) |
| $1,500 to $1,999 | 44 (5.5%) | 214 (34.7%) |
| $2,000 to $2,499 | 57 (7.1%) | 74 (12.0%) |
| $2,500 to $2,999 | 108 (13.5%) | 44 (7.1%) |
| $3,000 or more | 212 (26.5%) | 0 (0.0%) |
| Total | 799 (100.0%) | 616 (100.0%) |
Physical Housing Characteristics in Narragansett Pier
Housing Structures in Narragansett Pier
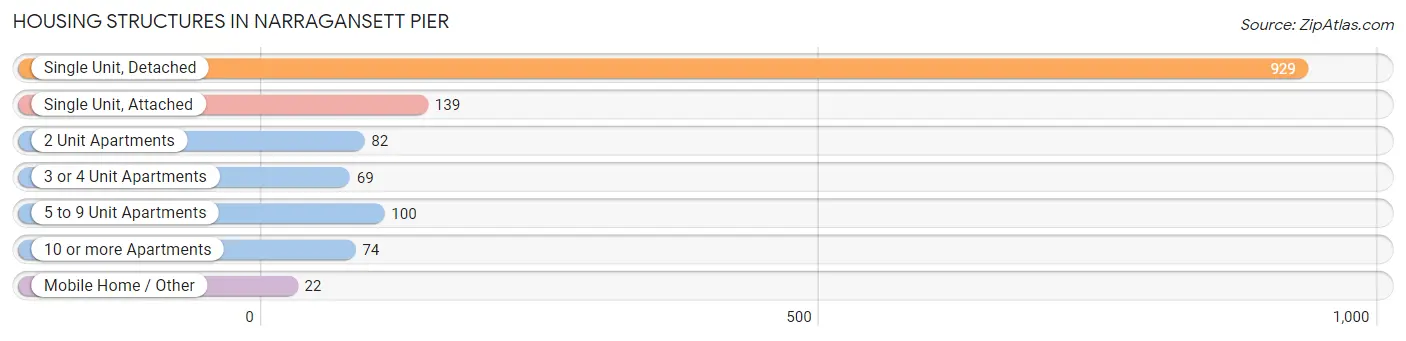
| Structure Type | # Housing Units | % Housing Units |
| Single Unit, Detached | 929 | 65.6% |
| Single Unit, Attached | 139 | 9.8% |
| 2 Unit Apartments | 82 | 5.8% |
| 3 or 4 Unit Apartments | 69 | 4.9% |
| 5 to 9 Unit Apartments | 100 | 7.1% |
| 10 or more Apartments | 74 | 5.2% |
| Mobile Home / Other | 22 | 1.5% |
| Total | 1,415 | 100.0% |
Housing Structures by Occupancy in Narragansett Pier
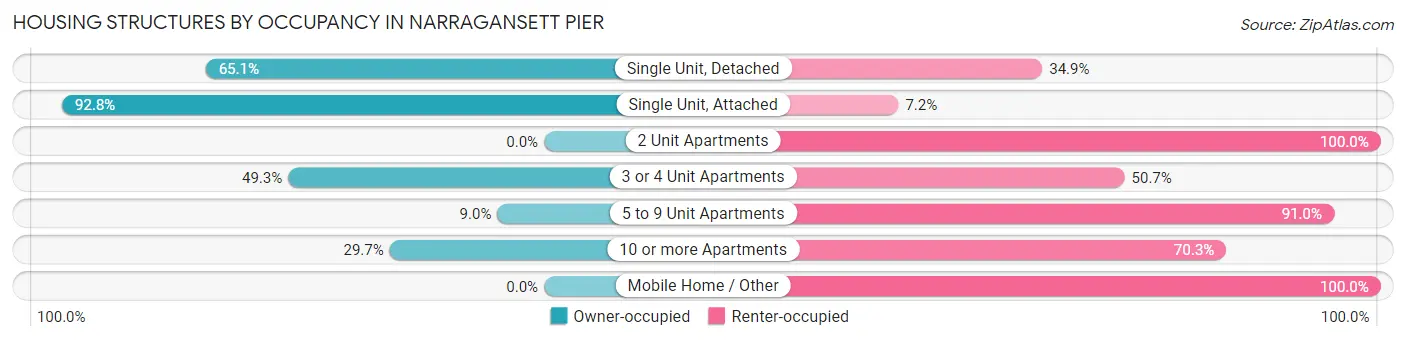
| Structure Type | Owner-occupied | Renter-occupied |
| Single Unit, Detached | 605 (65.1%) | 324 (34.9%) |
| Single Unit, Attached | 129 (92.8%) | 10 (7.2%) |
| 2 Unit Apartments | 0 (0.0%) | 82 (100.0%) |
| 3 or 4 Unit Apartments | 34 (49.3%) | 35 (50.7%) |
| 5 to 9 Unit Apartments | 9 (9.0%) | 91 (91.0%) |
| 10 or more Apartments | 22 (29.7%) | 52 (70.3%) |
| Mobile Home / Other | 0 (0.0%) | 22 (100.0%) |
| Total | 799 (56.5%) | 616 (43.5%) |
Housing Structures by Number of Rooms in Narragansett Pier
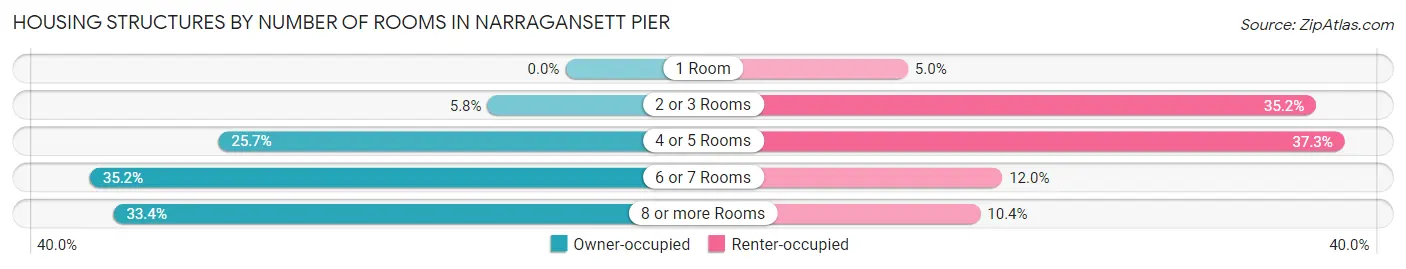
| Number of Rooms | Owner-occupied | Renter-occupied |
| 1 Room | 0 (0.0%) | 31 (5.0%) |
| 2 or 3 Rooms | 46 (5.8%) | 217 (35.2%) |
| 4 or 5 Rooms | 205 (25.7%) | 230 (37.3%) |
| 6 or 7 Rooms | 281 (35.2%) | 74 (12.0%) |
| 8 or more Rooms | 267 (33.4%) | 64 (10.4%) |
| Total | 799 (100.0%) | 616 (100.0%) |
Housing Structure by Heating Type in Narragansett Pier
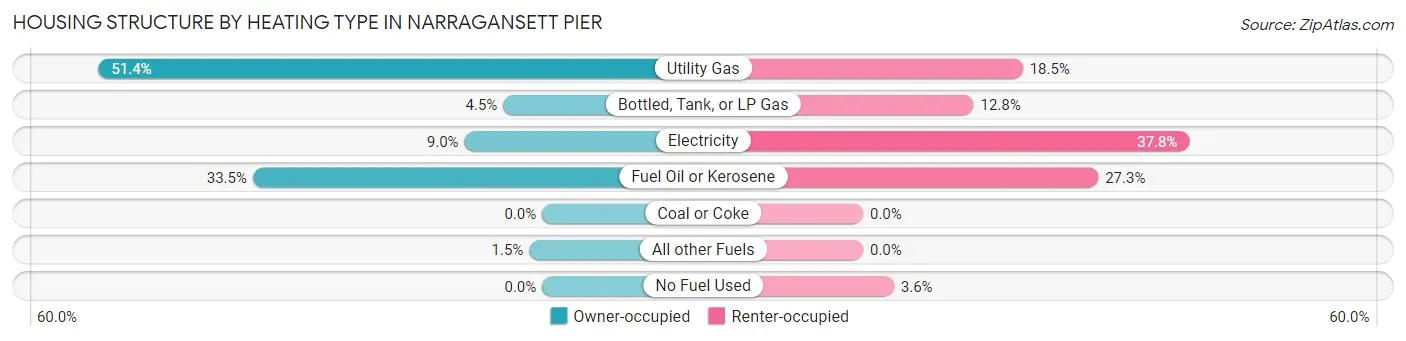
| Heating Type | Owner-occupied | Renter-occupied |
| Utility Gas | 411 (51.4%) | 114 (18.5%) |
| Bottled, Tank, or LP Gas | 36 (4.5%) | 79 (12.8%) |
| Electricity | 72 (9.0%) | 233 (37.8%) |
| Fuel Oil or Kerosene | 268 (33.5%) | 168 (27.3%) |
| Coal or Coke | 0 (0.0%) | 0 (0.0%) |
| All other Fuels | 12 (1.5%) | 0 (0.0%) |
| No Fuel Used | 0 (0.0%) | 22 (3.6%) |
| Total | 799 (100.0%) | 616 (100.0%) |
Household Vehicle Usage in Narragansett Pier
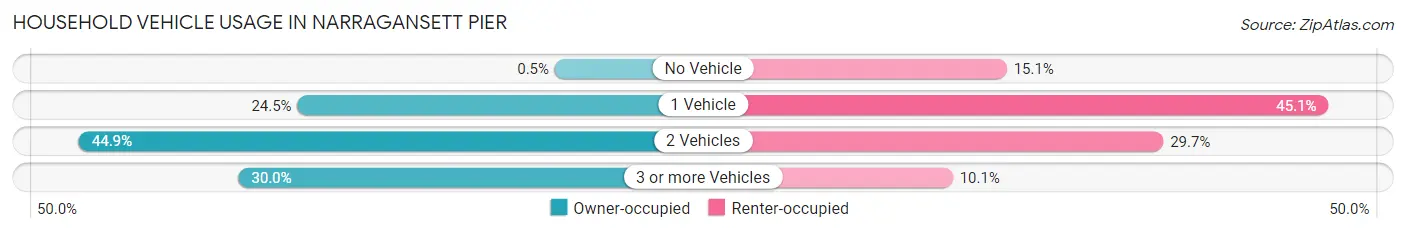
| Vehicles per Household | Owner-occupied | Renter-occupied |
| No Vehicle | 4 (0.5%) | 93 (15.1%) |
| 1 Vehicle | 196 (24.5%) | 278 (45.1%) |
| 2 Vehicles | 359 (44.9%) | 183 (29.7%) |
| 3 or more Vehicles | 240 (30.0%) | 62 (10.1%) |
| Total | 799 (100.0%) | 616 (100.0%) |
Real Estate & Mortgages in Narragansett Pier
Real Estate and Mortgage Overview in Narragansett Pier
| Characteristic | Without Mortgage | With Mortgage |
| Housing Units | 287 | 512 |
| Median Property Value | $608,100 | $765,200 |
| Median Household Income | $97,031 | $213 |
| Monthly Housing Costs | $918 | $208 |
| Real Estate Taxes | $4,257 | $0 |
Property Value by Mortgage Status in Narragansett Pier
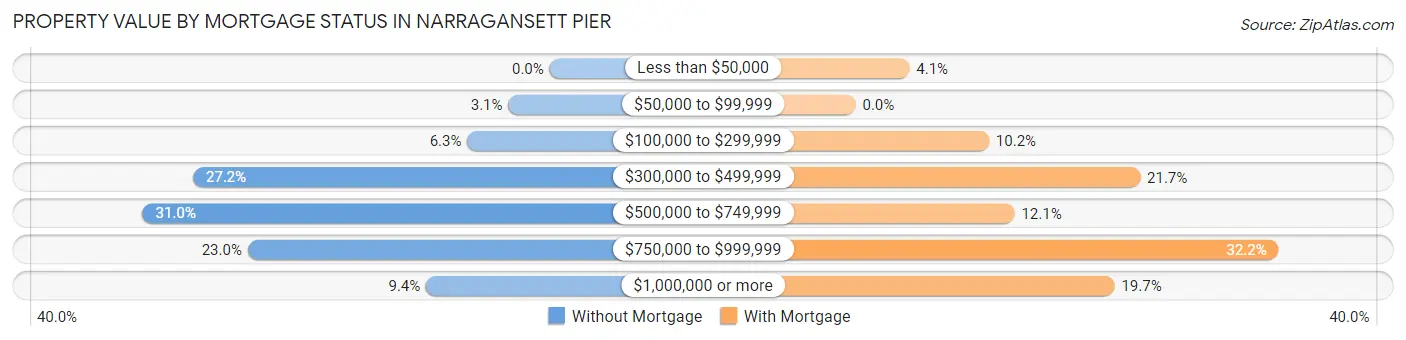
| Property Value | Without Mortgage | With Mortgage |
| Less than $50,000 | 0 (0.0%) | 21 (4.1%) |
| $50,000 to $99,999 | 9 (3.1%) | 0 (0.0%) |
| $100,000 to $299,999 | 18 (6.3%) | 52 (10.2%) |
| $300,000 to $499,999 | 78 (27.2%) | 111 (21.7%) |
| $500,000 to $749,999 | 89 (31.0%) | 62 (12.1%) |
| $750,000 to $999,999 | 66 (23.0%) | 165 (32.2%) |
| $1,000,000 or more | 27 (9.4%) | 101 (19.7%) |
| Total | 287 (100.0%) | 512 (100.0%) |
Household Income by Mortgage Status in Narragansett Pier
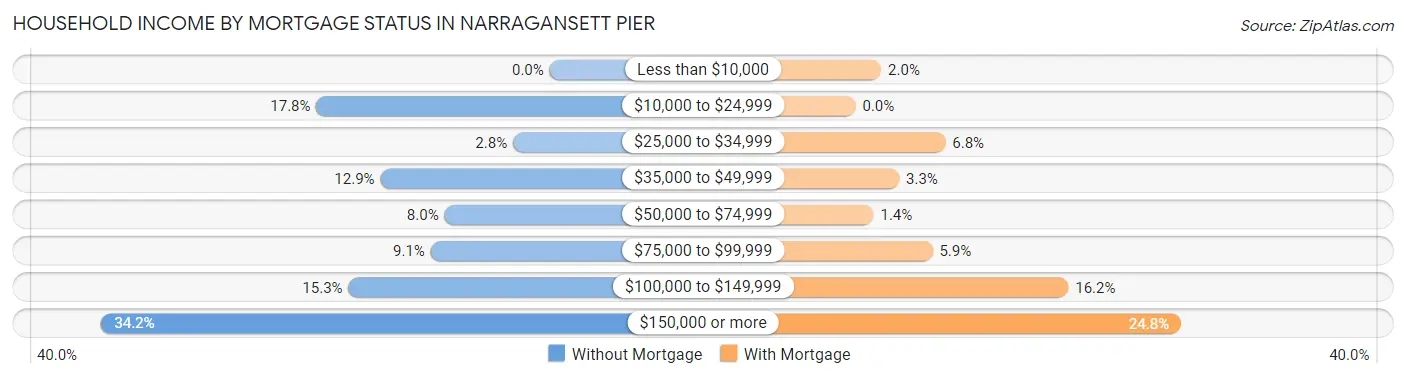
| Household Income | Without Mortgage | With Mortgage |
| Less than $10,000 | 0 (0.0%) | 10 (1.9%) |
| $10,000 to $24,999 | 51 (17.8%) | 0 (0.0%) |
| $25,000 to $34,999 | 8 (2.8%) | 35 (6.8%) |
| $35,000 to $49,999 | 37 (12.9%) | 17 (3.3%) |
| $50,000 to $74,999 | 23 (8.0%) | 7 (1.4%) |
| $75,000 to $99,999 | 26 (9.1%) | 30 (5.9%) |
| $100,000 to $149,999 | 44 (15.3%) | 83 (16.2%) |
| $150,000 or more | 98 (34.2%) | 127 (24.8%) |
| Total | 287 (100.0%) | 512 (100.0%) |
Property Value to Household Income Ratio in Narragansett Pier
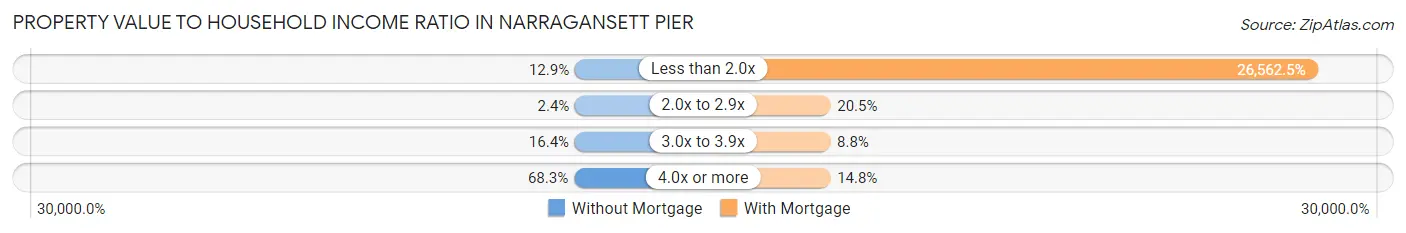
| Value-to-Income Ratio | Without Mortgage | With Mortgage |
| Less than 2.0x | 37 (12.9%) | 136,000 (26,562.5%) |
| 2.0x to 2.9x | 7 (2.4%) | 105 (20.5%) |
| 3.0x to 3.9x | 47 (16.4%) | 45 (8.8%) |
| 4.0x or more | 196 (68.3%) | 76 (14.8%) |
| Total | 287 (100.0%) | 512 (100.0%) |
Real Estate Taxes by Mortgage Status in Narragansett Pier
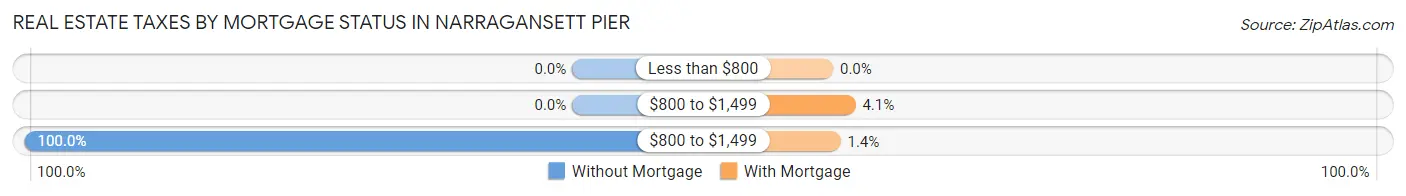
| Property Taxes | Without Mortgage | With Mortgage |
| Less than $800 | 0 (0.0%) | 0 (0.0%) |
| $800 to $1,499 | 0 (0.0%) | 21 (4.1%) |
| $800 to $1,499 | 287 (100.0%) | 7 (1.4%) |
| Total | 287 (100.0%) | 512 (100.0%) |
Health & Disability in Narragansett Pier
Health Insurance Coverage by Age in Narragansett Pier
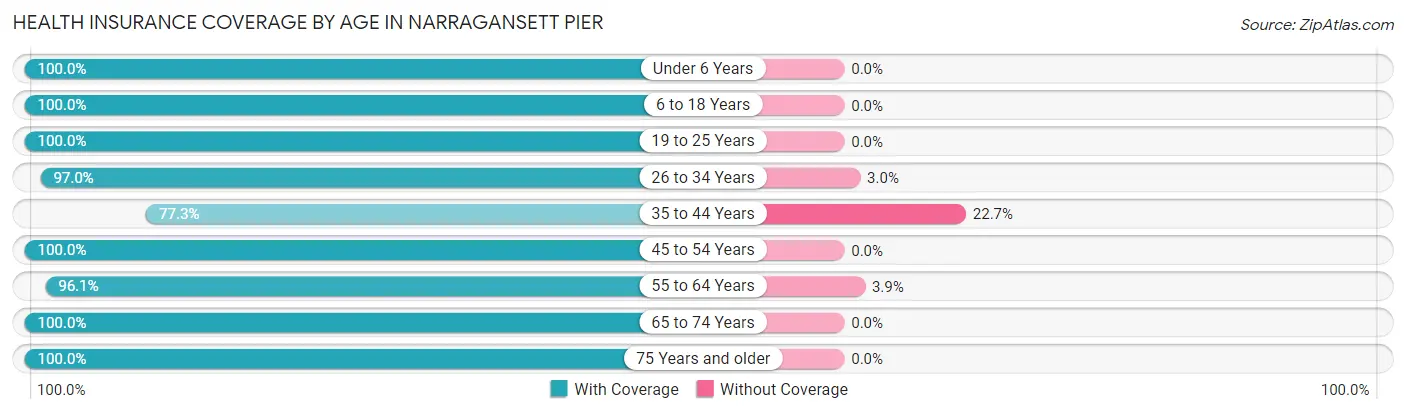
| Age Bracket | With Coverage | Without Coverage |
| Under 6 Years | 90 (100.0%) | 0 (0.0%) |
| 6 to 18 Years | 230 (100.0%) | 0 (0.0%) |
| 19 to 25 Years | 352 (100.0%) | 0 (0.0%) |
| 26 to 34 Years | 328 (97.0%) | 10 (3.0%) |
| 35 to 44 Years | 116 (77.3%) | 34 (22.7%) |
| 45 to 54 Years | 275 (100.0%) | 0 (0.0%) |
| 55 to 64 Years | 548 (96.1%) | 22 (3.9%) |
| 65 to 74 Years | 483 (100.0%) | 0 (0.0%) |
| 75 Years and older | 317 (100.0%) | 0 (0.0%) |
| Total | 2,739 (97.7%) | 66 (2.4%) |
Health Insurance Coverage by Citizenship Status in Narragansett Pier
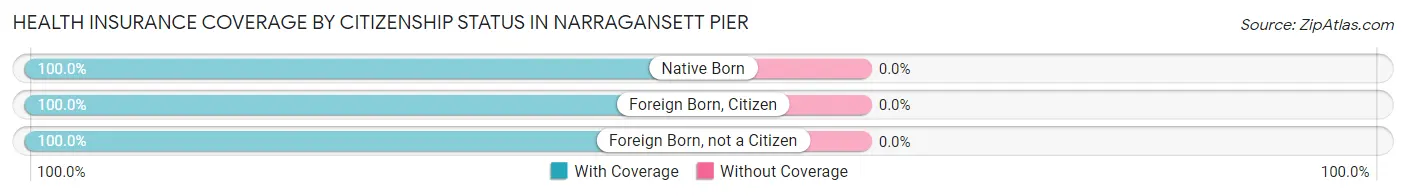
| Citizenship Status | With Coverage | Without Coverage |
| Native Born | 90 (100.0%) | 0 (0.0%) |
| Foreign Born, Citizen | 230 (100.0%) | 0 (0.0%) |
| Foreign Born, not a Citizen | 352 (100.0%) | 0 (0.0%) |
Health Insurance Coverage by Household Income in Narragansett Pier
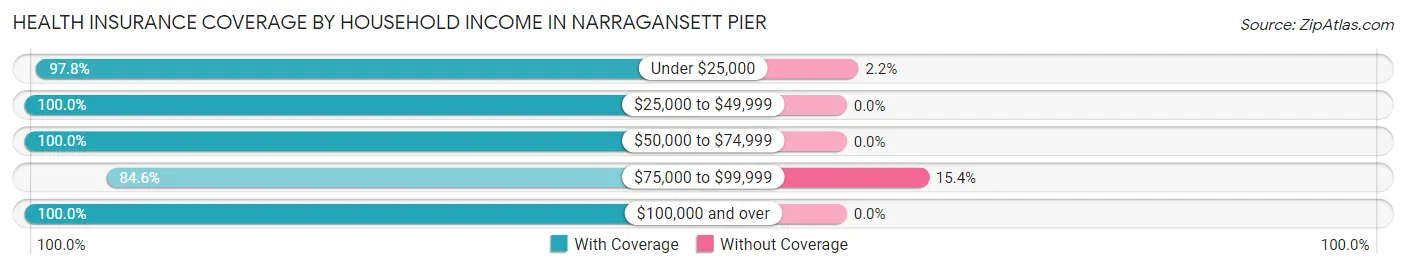
| Household Income | With Coverage | Without Coverage |
| Under $25,000 | 444 (97.8%) | 10 (2.2%) |
| $25,000 to $49,999 | 259 (100.0%) | 0 (0.0%) |
| $50,000 to $74,999 | 201 (100.0%) | 0 (0.0%) |
| $75,000 to $99,999 | 308 (84.6%) | 56 (15.4%) |
| $100,000 and over | 1,437 (100.0%) | 0 (0.0%) |
Public vs Private Health Insurance Coverage by Age in Narragansett Pier
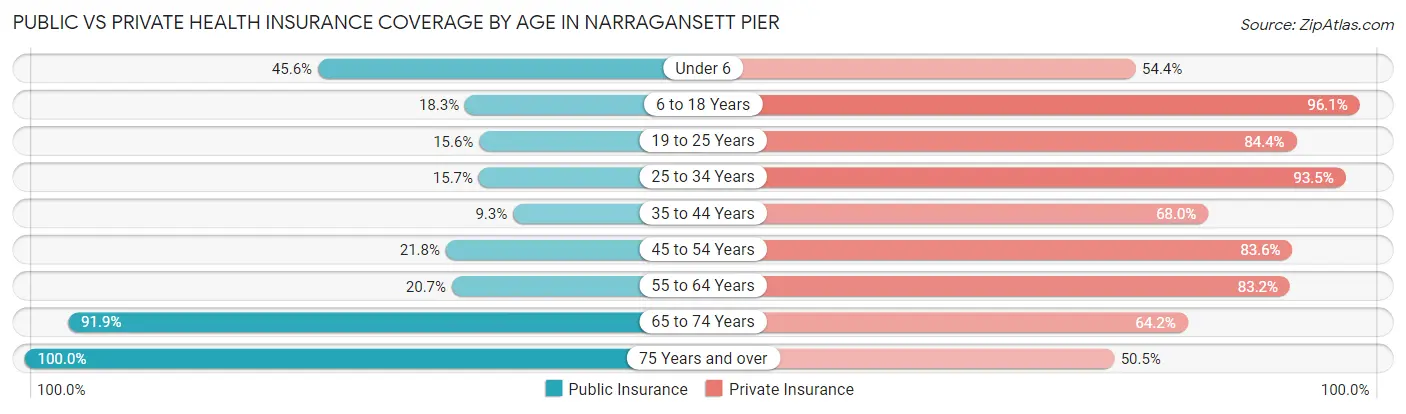
| Age Bracket | Public Insurance | Private Insurance |
| Under 6 | 41 (45.6%) | 49 (54.4%) |
| 6 to 18 Years | 42 (18.3%) | 221 (96.1%) |
| 19 to 25 Years | 55 (15.6%) | 297 (84.4%) |
| 25 to 34 Years | 53 (15.7%) | 316 (93.5%) |
| 35 to 44 Years | 14 (9.3%) | 102 (68.0%) |
| 45 to 54 Years | 60 (21.8%) | 230 (83.6%) |
| 55 to 64 Years | 118 (20.7%) | 474 (83.2%) |
| 65 to 74 Years | 444 (91.9%) | 310 (64.2%) |
| 75 Years and over | 317 (100.0%) | 160 (50.5%) |
| Total | 1,144 (40.8%) | 2,159 (77.0%) |
Disability Status by Sex by Age in Narragansett Pier
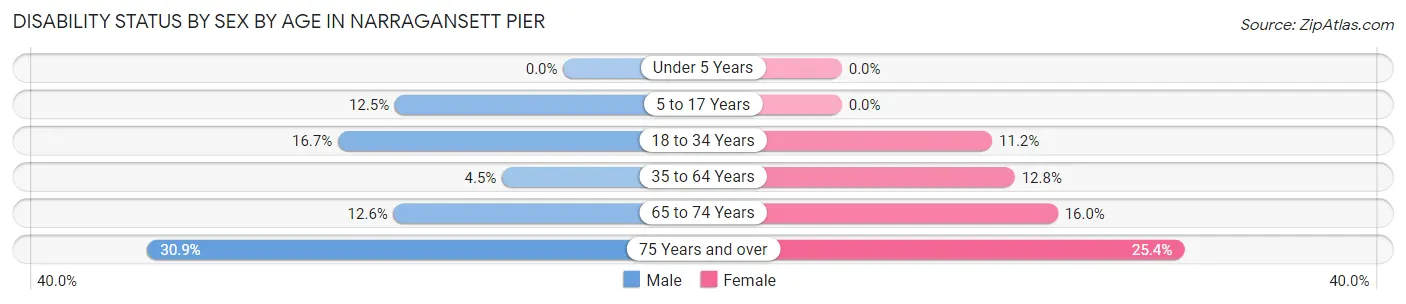
| Age Bracket | Male | Female |
| Under 5 Years | 0 (0.0%) | 0 (0.0%) |
| 5 to 17 Years | 9 (12.5%) | 0 (0.0%) |
| 18 to 34 Years | 45 (16.7%) | 52 (11.2%) |
| 35 to 64 Years | 25 (4.5%) | 57 (12.8%) |
| 65 to 74 Years | 31 (12.6%) | 38 (16.0%) |
| 75 Years and over | 42 (30.9%) | 46 (25.4%) |
Disability Class by Sex by Age in Narragansett Pier
Disability Class: Hearing Difficulty
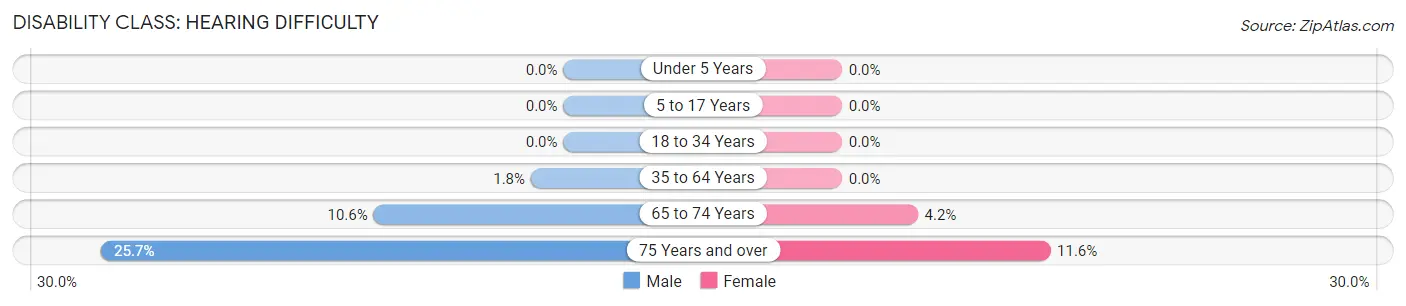
| Age Bracket | Male | Female |
| Under 5 Years | 0 (0.0%) | 0 (0.0%) |
| 5 to 17 Years | 0 (0.0%) | 0 (0.0%) |
| 18 to 34 Years | 0 (0.0%) | 0 (0.0%) |
| 35 to 64 Years | 10 (1.8%) | 0 (0.0%) |
| 65 to 74 Years | 26 (10.6%) | 10 (4.2%) |
| 75 Years and over | 35 (25.7%) | 21 (11.6%) |
Disability Class: Vision Difficulty
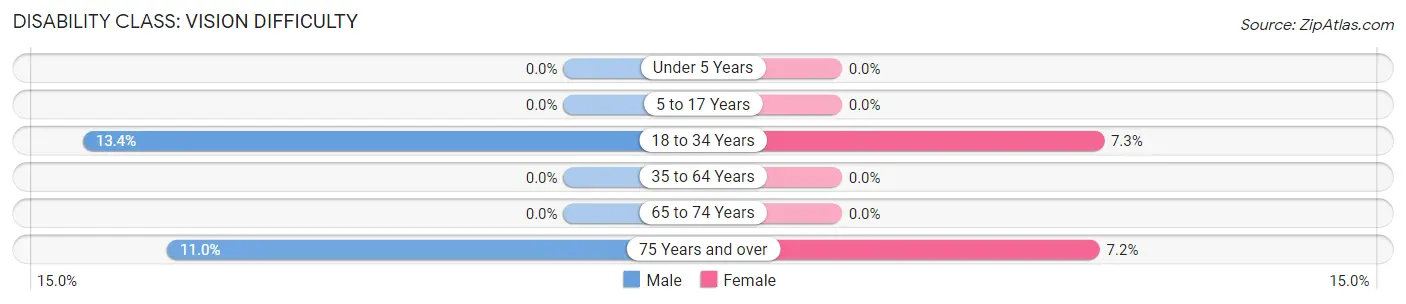
| Age Bracket | Male | Female |
| Under 5 Years | 0 (0.0%) | 0 (0.0%) |
| 5 to 17 Years | 0 (0.0%) | 0 (0.0%) |
| 18 to 34 Years | 36 (13.4%) | 34 (7.3%) |
| 35 to 64 Years | 0 (0.0%) | 0 (0.0%) |
| 65 to 74 Years | 0 (0.0%) | 0 (0.0%) |
| 75 Years and over | 15 (11.0%) | 13 (7.2%) |
Disability Class: Cognitive Difficulty
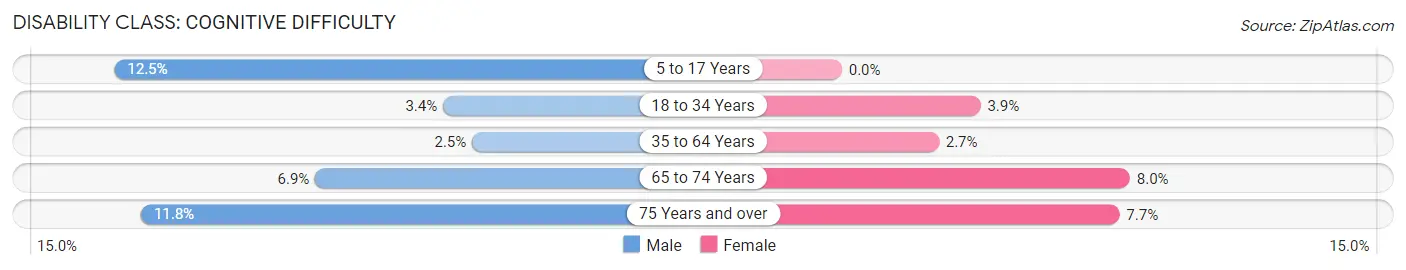
| Age Bracket | Male | Female |
| 5 to 17 Years | 9 (12.5%) | 0 (0.0%) |
| 18 to 34 Years | 9 (3.4%) | 18 (3.9%) |
| 35 to 64 Years | 14 (2.5%) | 12 (2.7%) |
| 65 to 74 Years | 17 (6.9%) | 19 (8.0%) |
| 75 Years and over | 16 (11.8%) | 14 (7.7%) |
Disability Class: Ambulatory Difficulty
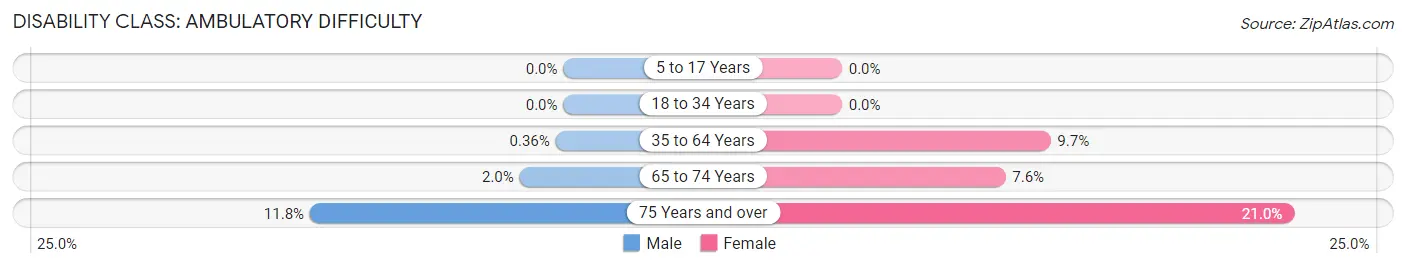
| Age Bracket | Male | Female |
| 5 to 17 Years | 0 (0.0%) | 0 (0.0%) |
| 18 to 34 Years | 0 (0.0%) | 0 (0.0%) |
| 35 to 64 Years | 2 (0.4%) | 43 (9.7%) |
| 65 to 74 Years | 5 (2.0%) | 18 (7.6%) |
| 75 Years and over | 16 (11.8%) | 38 (21.0%) |
Disability Class: Self-Care Difficulty
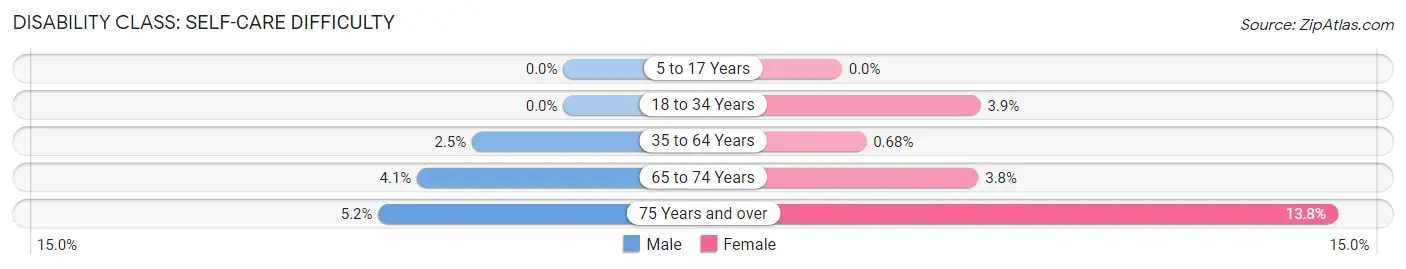
| Age Bracket | Male | Female |
| 5 to 17 Years | 0 (0.0%) | 0 (0.0%) |
| 18 to 34 Years | 0 (0.0%) | 18 (3.9%) |
| 35 to 64 Years | 14 (2.5%) | 3 (0.7%) |
| 65 to 74 Years | 10 (4.1%) | 9 (3.8%) |
| 75 Years and over | 7 (5.1%) | 25 (13.8%) |
Technology Access in Narragansett Pier
Computing Device Access in Narragansett Pier
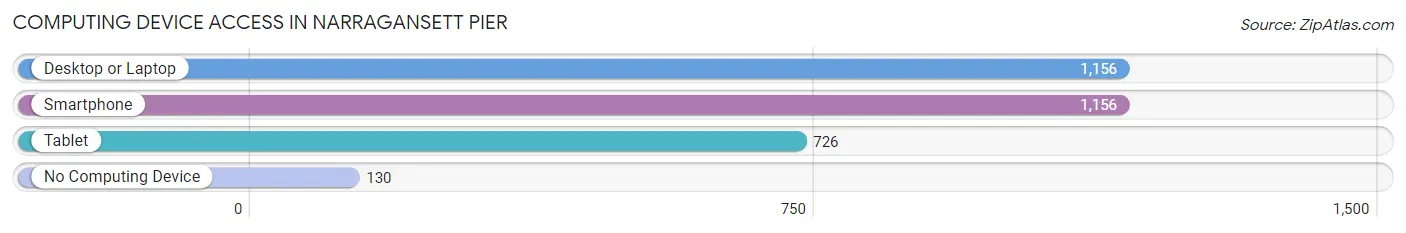
| Device Type | # Households | % Households |
| Desktop or Laptop | 1,156 | 81.7% |
| Smartphone | 1,156 | 81.7% |
| Tablet | 726 | 51.3% |
| No Computing Device | 130 | 9.2% |
| Total | 1,415 | 100.0% |
Internet Access in Narragansett Pier
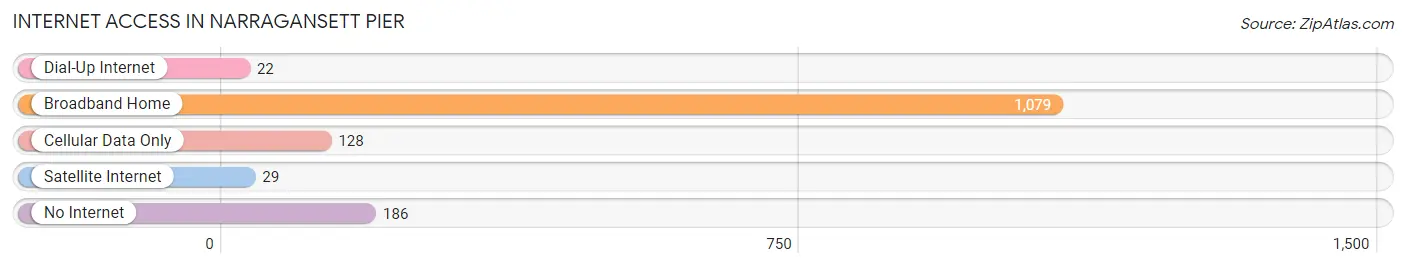
| Internet Type | # Households | % Households |
| Dial-Up Internet | 22 | 1.5% |
| Broadband Home | 1,079 | 76.2% |
| Cellular Data Only | 128 | 9.0% |
| Satellite Internet | 29 | 2.1% |
| No Internet | 186 | 13.1% |
| Total | 1,415 | 100.0% |
Narragansett Pier Summary
Narragansett Pier, Rhode Island is a small coastal town located in Washington County, Rhode Island. It is situated on the western shore of Narragansett Bay, approximately 10 miles south of Providence. The town has a population of approximately 1,500 people and covers an area of 1.3 square miles.
History
The area that is now Narragansett Pier was originally inhabited by the Narragansett Native American tribe. The first European settlers arrived in the area in the 1630s and established a fishing village. The town was officially incorporated in 1722 and was named after the Narragansett tribe.
In the late 19th century, Narragansett Pier became a popular summer resort destination for wealthy families from Providence and Boston. The town was home to several grand hotels, including the Narragansett Pier Hotel, which was built in 1883 and was one of the largest hotels in the state.
The town was also home to several amusement parks, including the Narragansett Pier Amusement Park, which opened in 1895 and was one of the first amusement parks in the country. The park featured a roller coaster, a carousel, and a ferris wheel.
In the early 20th century, the town began to decline as a resort destination. The Narragansett Pier Hotel closed in 1915 and the amusement park closed in 1925. The town continued to decline until the 1970s, when it began to experience a resurgence as a residential community.
Geography
Narragansett Pier is located on the western shore of Narragansett Bay, approximately 10 miles south of Providence. The town is bordered by the towns of South Kingstown to the north, Narragansett to the east, and Charlestown to the south.
The town is situated on a peninsula, with the Atlantic Ocean to the south and east and Narragansett Bay to the north and west. The town is home to several beaches, including Scarborough State Beach, which is one of the most popular beaches in the state.
Economy
The economy of Narragansett Pier is largely based on tourism and the service industry. The town is home to several restaurants, bars, and shops, as well as several hotels and bed and breakfasts. The town is also home to several marinas, which provide services to boaters and fishermen.
The town is also home to several businesses, including a boatyard, a seafood processing plant, and a seafood market. The town is also home to several art galleries and studios, as well as a number of antique shops.
Demographics
As of the 2010 census, the population of Narragansett Pier was 1,521. The racial makeup of the town was 94.3% White, 1.7% African American, 0.3% Native American, 1.2% Asian, 0.1% Pacific Islander, 0.7% from other races, and 1.9% from two or more races. Hispanic or Latino of any race were 2.2% of the population.
The median household income in Narragansett Pier was $60,938, and the median family income was $71,250. The per capita income for the town was $35,945. About 5.3% of families and 7.2% of the population were below the poverty line, including 8.3% of those under age 18 and 4.2% of those age 65 or over.
Common Questions
What is Per Capita Income in Narragansett Pier?
Per Capita income in Narragansett Pier is $51,278.
What is the Median Family Income in Narragansett Pier?
Median Family Income in Narragansett Pier is $148,571.
What is the Median Household income in Narragansett Pier?
Median Household Income in Narragansett Pier is $76,528.
What is Income or Wage Gap in Narragansett Pier?
Income or Wage Gap in Narragansett Pier is 26.0%.
Women in Narragansett Pier earn 74.0 cents for every dollar earned by a man.
What is Inequality or Gini Index in Narragansett Pier?
Inequality or Gini Index in Narragansett Pier is 0.51.
What is the Total Population of Narragansett Pier?
Total Population of Narragansett Pier is 2,805.
What is the Total Male Population of Narragansett Pier?
Total Male Population of Narragansett Pier is 1,327.
What is the Total Female Population of Narragansett Pier?
Total Female Population of Narragansett Pier is 1,478.
What is the Ratio of Males per 100 Females in Narragansett Pier?
There are 89.78 Males per 100 Females in Narragansett Pier.
What is the Ratio of Females per 100 Males in Narragansett Pier?
There are 111.38 Females per 100 Males in Narragansett Pier.
What is the Median Population Age in Narragansett Pier?
Median Population Age in Narragansett Pier is 54.0 Years.
What is the Average Family Size in Narragansett Pier
Average Family Size in Narragansett Pier is 2.8 People.
What is the Average Household Size in Narragansett Pier
Average Household Size in Narragansett Pier is 1.9 People.
How Large is the Labor Force in Narragansett Pier?
There are 1,518 People in the Labor Forcein in Narragansett Pier.
What is the Percentage of People in the Labor Force in Narragansett Pier?
58.4% of People are in the Labor Force in Narragansett Pier.
What is the Unemployment Rate in Narragansett Pier?
Unemployment Rate in Narragansett Pier is 11.6%.