Ashaway, RI Map & Demographics
Ashaway Map
Ashaway Overview
$36,954
PER CAPITA INCOME
$96,756
AVG FAMILY INCOME
$98,875
AVG HOUSEHOLD INCOME
0.5%
WAGE / INCOME GAP [ % ]
99.5¢/ $1
WAGE / INCOME GAP [ $ ]
0.27
INEQUALITY / GINI INDEX
1,662
TOTAL POPULATION
741
MALE POPULATION
921
FEMALE POPULATION
80.46
MALES / 100 FEMALES
124.29
FEMALES / 100 MALES
34.1
MEDIAN AGE
3.2
AVG FAMILY SIZE
3.1
AVG HOUSEHOLD SIZE
1,031
LABOR FORCE [ PEOPLE ]
85.2%
PERCENT IN LABOR FORCE
Ashaway Zip Codes
Ashaway Area Codes
Income in Ashaway
Income Overview in Ashaway
Per Capita Income in Ashaway is $36,954, while median incomes of families and households are $96,756 and $98,875 respectively.
| Characteristic | Number | Measure |
| Per Capita Income | 1,662 | $36,954 |
| Median Family Income | 441 | $96,756 |
| Mean Family Income | 441 | $111,744 |
| Median Household Income | 529 | $98,875 |
| Mean Household Income | 529 | $113,757 |
| Income Deficit | 441 | $0 |
| Wage / Income Gap (%) | 1,662 | 0.49% |
| Wage / Income Gap ($) | 1,662 | 99.51¢ per $1 |
| Gini / Inequality Index | 1,662 | 0.27 |
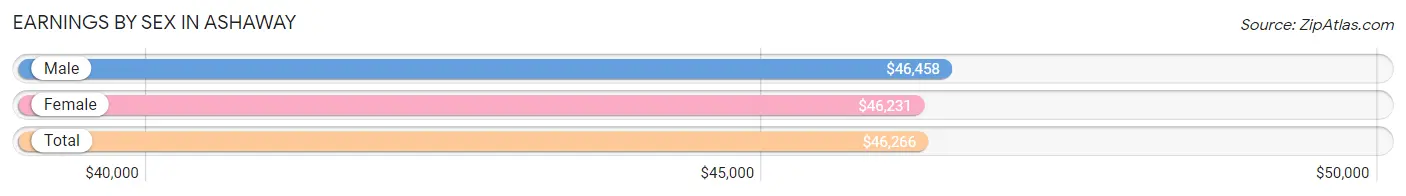
Earnings by Sex in Ashaway
Average Earnings in Ashaway are $46,266, $46,458 for men and $46,231 for women, a difference of 0.5%.
| Sex | Number | Average Earnings |
| Male | 530 (51.4%) | $46,458 |
| Female | 501 (48.6%) | $46,231 |
| Total | 1,031 (100.0%) | $46,266 |
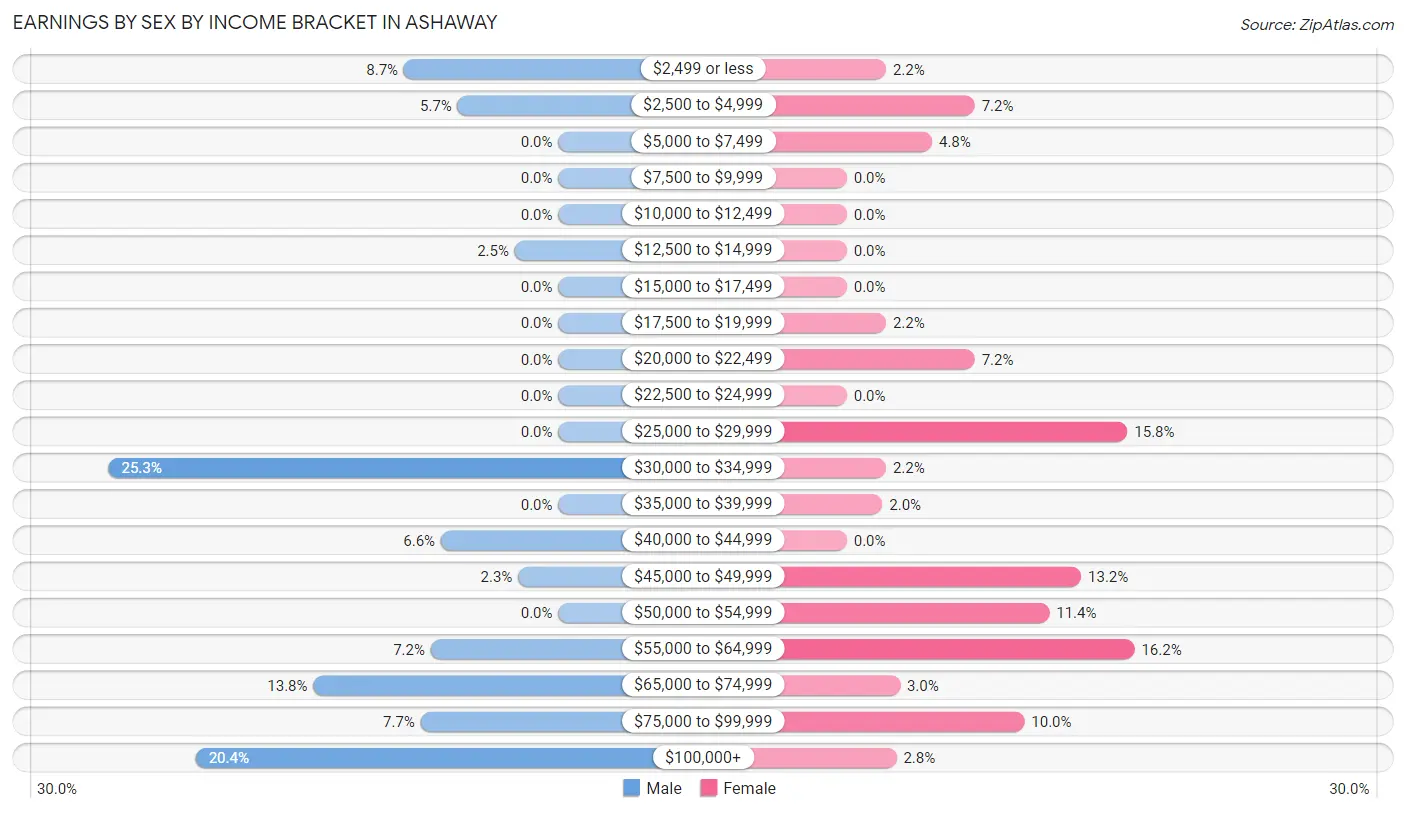
Earnings by Sex by Income Bracket in Ashaway
The most common earnings brackets in Ashaway are $30,000 to $34,999 for men (134 | 25.3%) and $55,000 to $64,999 for women (81 | 16.2%).
| Income | Male | Female |
| $2,499 or less | 46 (8.7%) | 11 (2.2%) |
| $2,500 to $4,999 | 30 (5.7%) | 36 (7.2%) |
| $5,000 to $7,499 | 0 (0.0%) | 24 (4.8%) |
| $7,500 to $9,999 | 0 (0.0%) | 0 (0.0%) |
| $10,000 to $12,499 | 0 (0.0%) | 0 (0.0%) |
| $12,500 to $14,999 | 13 (2.5%) | 0 (0.0%) |
| $15,000 to $17,499 | 0 (0.0%) | 0 (0.0%) |
| $17,500 to $19,999 | 0 (0.0%) | 11 (2.2%) |
| $20,000 to $22,499 | 0 (0.0%) | 36 (7.2%) |
| $22,500 to $24,999 | 0 (0.0%) | 0 (0.0%) |
| $25,000 to $29,999 | 0 (0.0%) | 79 (15.8%) |
| $30,000 to $34,999 | 134 (25.3%) | 11 (2.2%) |
| $35,000 to $39,999 | 0 (0.0%) | 10 (2.0%) |
| $40,000 to $44,999 | 35 (6.6%) | 0 (0.0%) |
| $45,000 to $49,999 | 12 (2.3%) | 66 (13.2%) |
| $50,000 to $54,999 | 0 (0.0%) | 57 (11.4%) |
| $55,000 to $64,999 | 38 (7.2%) | 81 (16.2%) |
| $65,000 to $74,999 | 73 (13.8%) | 15 (3.0%) |
| $75,000 to $99,999 | 41 (7.7%) | 50 (10.0%) |
| $100,000+ | 108 (20.4%) | 14 (2.8%) |
| Total | 530 (100.0%) | 501 (100.0%) |
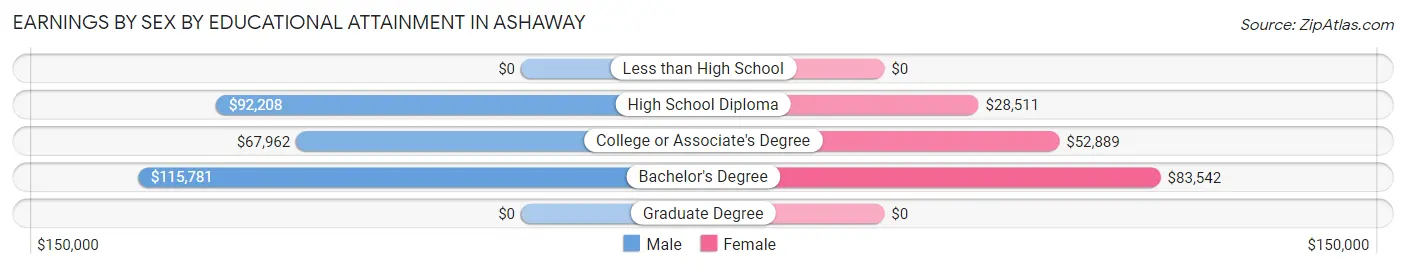
Earnings by Sex by Educational Attainment in Ashaway
Average earnings in Ashaway are $69,110 for men and $51,667 for women, a difference of 25.2%. Men with an educational attainment of bachelor's degree enjoy the highest average annual earnings of $115,781, while those with college or associate's degree education earn the least with $67,962. Women with an educational attainment of bachelor's degree earn the most with the average annual earnings of $83,542, while those with high school diploma education have the smallest earnings of $28,511.
| Educational Attainment | Male Income | Female Income |
| Less than High School | - | - |
| High School Diploma | $92,208 | $28,511 |
| College or Associate's Degree | $67,962 | $52,889 |
| Bachelor's Degree | $115,781 | $83,542 |
| Graduate Degree | - | - |
| Total | $69,110 | $51,667 |
Family Income in Ashaway
Family Income Brackets in Ashaway
According to the Ashaway family income data, there are 171 families falling into the $50,000 to $74,999 income range, which is the most common income bracket and makes up 38.8% of all families.
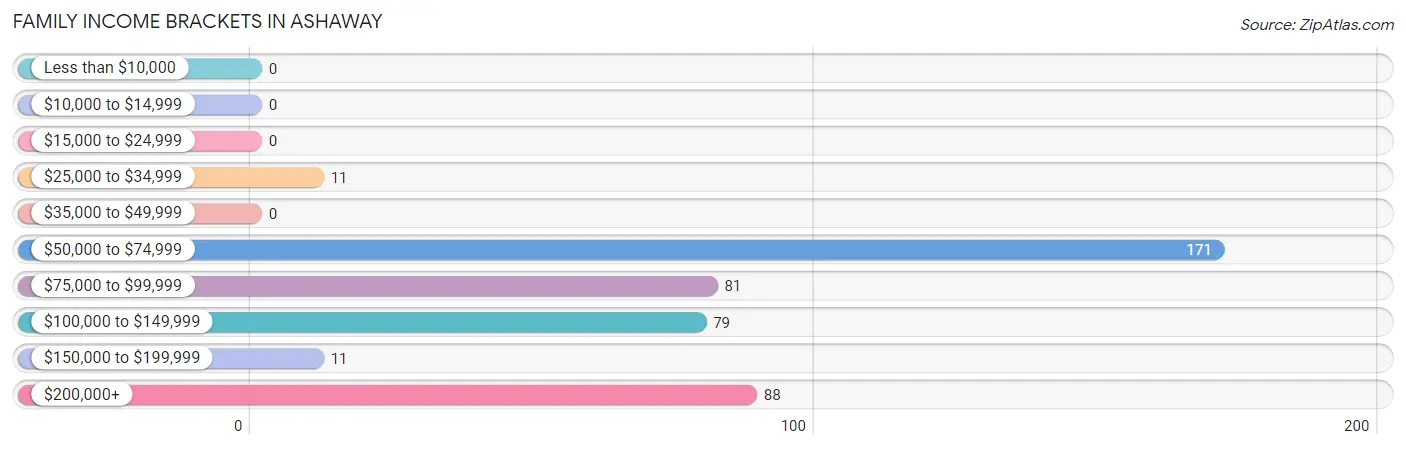
| Income Bracket | # Families | % Families |
| Less than $10,000 | 0 | 0.0% |
| $10,000 to $14,999 | 0 | 0.0% |
| $15,000 to $24,999 | 0 | 0.0% |
| $25,000 to $34,999 | 11 | 2.5% |
| $35,000 to $49,999 | 0 | 0.0% |
| $50,000 to $74,999 | 171 | 38.8% |
| $75,000 to $99,999 | 81 | 18.4% |
| $100,000 to $149,999 | 79 | 17.9% |
| $150,000 to $199,999 | 11 | 2.5% |
| $200,000+ | 88 | 20.0% |
Family Income by Famaliy Size in Ashaway
5-person families (31 | 7.0%) account for the highest median family income in Ashaway with $206,705 per family, while 5-person families (31 | 7.0%) have the highest median income of $41,341 per family member.
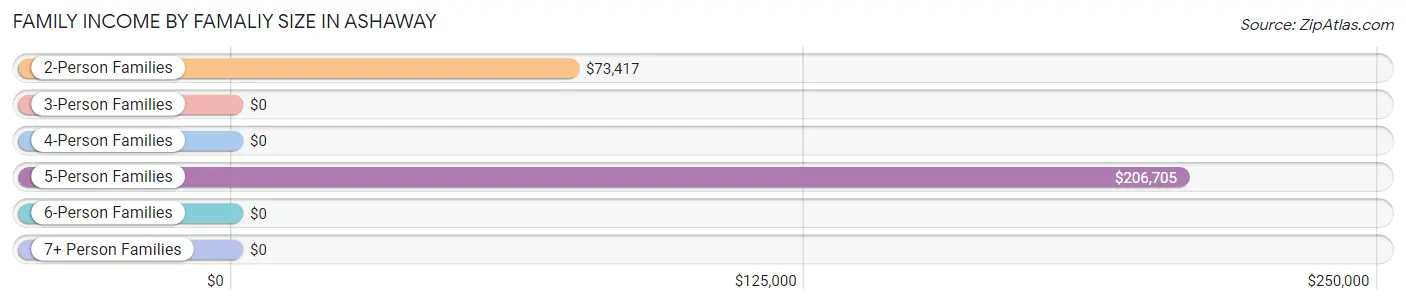
| Income Bracket | # Families | Median Income |
| 2-Person Families | 171 (38.8%) | $73,417 |
| 3-Person Families | 110 (24.9%) | $0 |
| 4-Person Families | 107 (24.3%) | $0 |
| 5-Person Families | 31 (7.0%) | $206,705 |
| 6-Person Families | 12 (2.7%) | $0 |
| 7+ Person Families | 10 (2.3%) | $0 |
| Total | 441 (100.0%) | $96,756 |
Family Income by Number of Earners in Ashaway
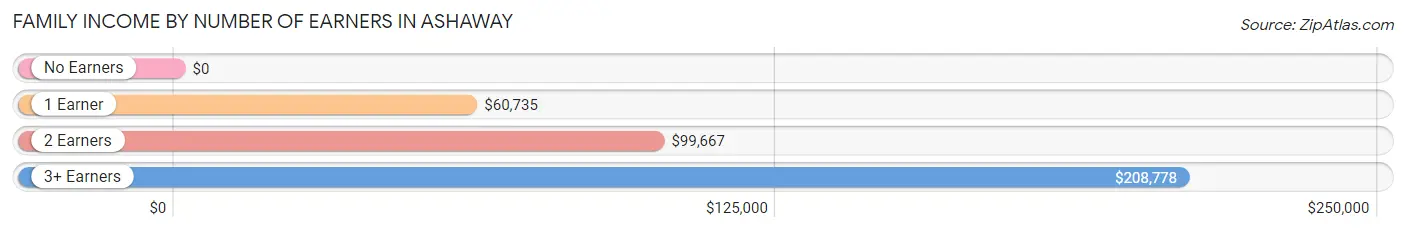
| Number of Earners | # Families | Median Income |
| No Earners | 23 (5.2%) | $0 |
| 1 Earner | 172 (39.0%) | $60,735 |
| 2 Earners | 178 (40.4%) | $99,667 |
| 3+ Earners | 68 (15.4%) | $208,778 |
| Total | 441 (100.0%) | $96,756 |
Household Income in Ashaway
Household Income Brackets in Ashaway
With 186 households falling in the category, the $50,000 to $74,999 income range is the most frequent in Ashaway, accounting for 35.2% of all households.
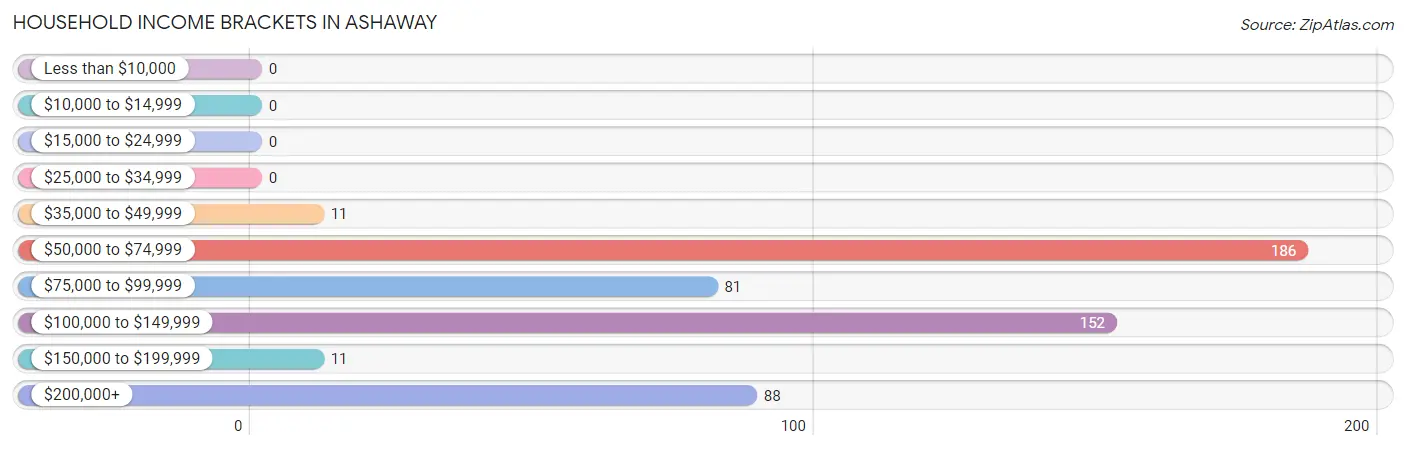
| Income Bracket | # Households | % Households |
| Less than $10,000 | 0 | 0.0% |
| $10,000 to $14,999 | 0 | 0.0% |
| $15,000 to $24,999 | 0 | 0.0% |
| $25,000 to $34,999 | 0 | 0.0% |
| $35,000 to $49,999 | 11 | 2.1% |
| $50,000 to $74,999 | 186 | 35.2% |
| $75,000 to $99,999 | 81 | 15.3% |
| $100,000 to $149,999 | 152 | 28.7% |
| $150,000 to $199,999 | 11 | 2.1% |
| $200,000+ | 88 | 16.6% |
Household Income by Householder Age in Ashaway
The median household income in Ashaway is $98,875, with the highest median household income of $132,819 found in the 45 to 64 years age bracket for the primary householder. A total of 300 households (56.7%) fall into this category.
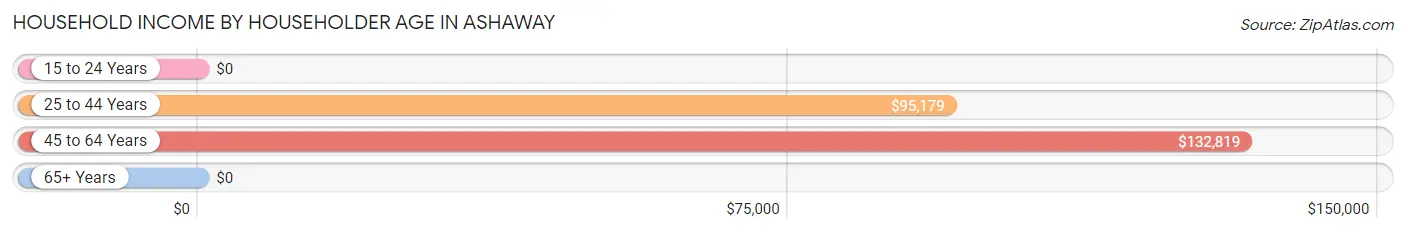
| Income Bracket | # Households | Median Income |
| 15 to 24 Years | 0 (0.0%) | $0 |
| 25 to 44 Years | 206 (38.9%) | $95,179 |
| 45 to 64 Years | 300 (56.7%) | $132,819 |
| 65+ Years | 23 (4.3%) | $0 |
| Total | 529 (100.0%) | $98,875 |
Poverty in Ashaway
Income Below Poverty by Sex and Age in Ashaway
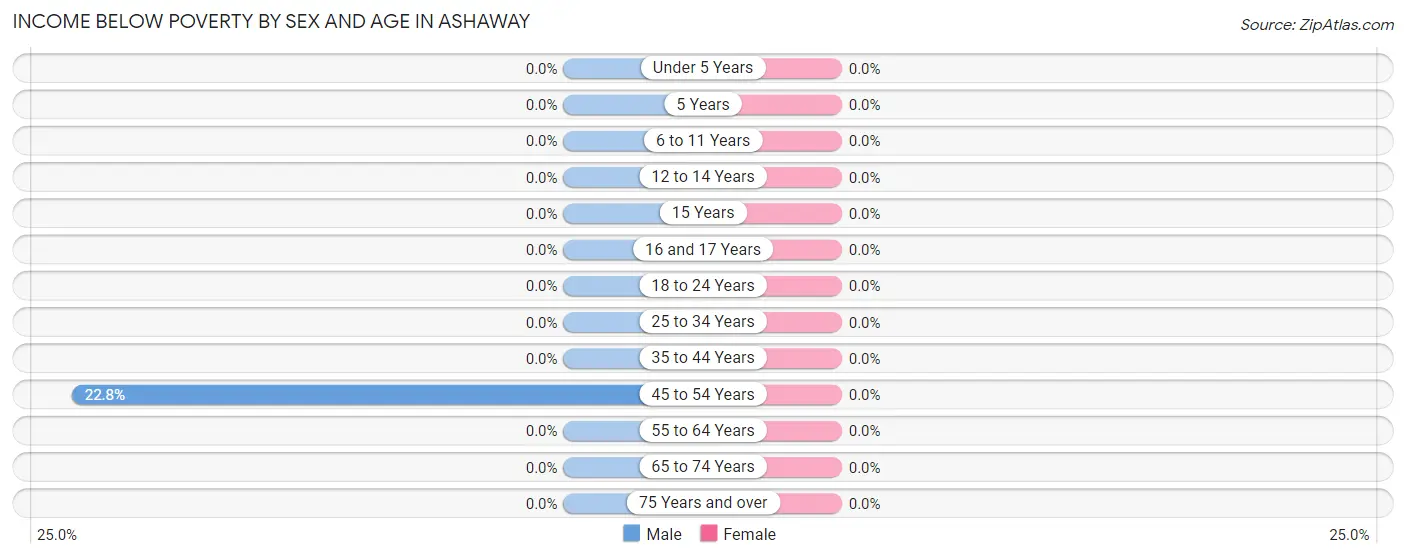
| Age Bracket | Male | Female |
| Under 5 Years | 0 (0.0%) | 0 (0.0%) |
| 5 Years | 0 (0.0%) | 0 (0.0%) |
| 6 to 11 Years | 0 (0.0%) | 0 (0.0%) |
| 12 to 14 Years | 0 (0.0%) | 0 (0.0%) |
| 15 Years | 0 (0.0%) | 0 (0.0%) |
| 16 and 17 Years | 0 (0.0%) | 0 (0.0%) |
| 18 to 24 Years | 0 (0.0%) | 0 (0.0%) |
| 25 to 34 Years | 0 (0.0%) | 0 (0.0%) |
| 35 to 44 Years | 0 (0.0%) | 0 (0.0%) |
| 45 to 54 Years | 13 (22.8%) | 0 (0.0%) |
| 55 to 64 Years | 0 (0.0%) | 0 (0.0%) |
| 65 to 74 Years | 0 (0.0%) | 0 (0.0%) |
| 75 Years and over | 0 (0.0%) | 0 (0.0%) |
| Total | 13 (1.8%) | 0 (0.0%) |
Income Above Poverty by Sex and Age in Ashaway
According to the poverty statistics in Ashaway, males aged under 5 years and females aged under 5 years are the age groups that are most secure financially, with 100.0% of males and 100.0% of females in these age groups living above the poverty line.
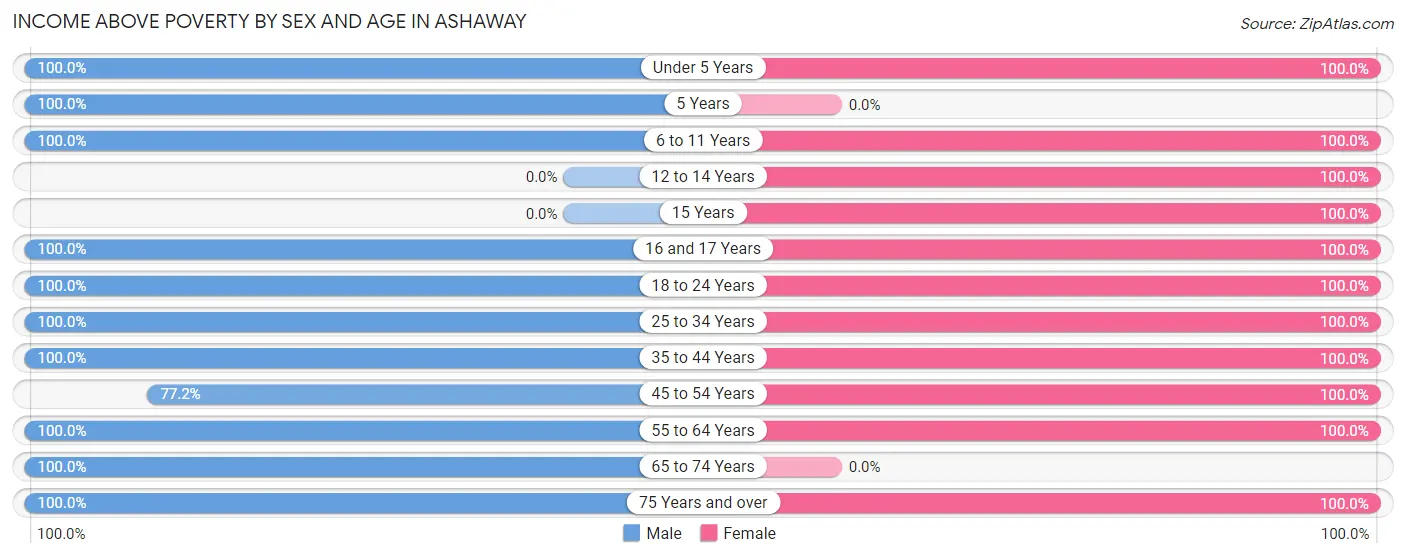
| Age Bracket | Male | Female |
| Under 5 Years | 31 (100.0%) | 49 (100.0%) |
| 5 Years | 20 (100.0%) | 0 (0.0%) |
| 6 to 11 Years | 60 (100.0%) | 166 (100.0%) |
| 12 to 14 Years | 0 (0.0%) | 55 (100.0%) |
| 15 Years | 0 (0.0%) | 8 (100.0%) |
| 16 and 17 Years | 30 (100.0%) | 11 (100.0%) |
| 18 to 24 Years | 186 (100.0%) | 72 (100.0%) |
| 25 to 34 Years | 13 (100.0%) | 76 (100.0%) |
| 35 to 44 Years | 104 (100.0%) | 121 (100.0%) |
| 45 to 54 Years | 44 (77.2%) | 169 (100.0%) |
| 55 to 64 Years | 176 (100.0%) | 105 (100.0%) |
| 65 to 74 Years | 43 (100.0%) | 0 (0.0%) |
| 75 Years and over | 21 (100.0%) | 26 (100.0%) |
| Total | 728 (98.3%) | 858 (100.0%) |
Income Below Poverty Among Married-Couple Families in Ashaway
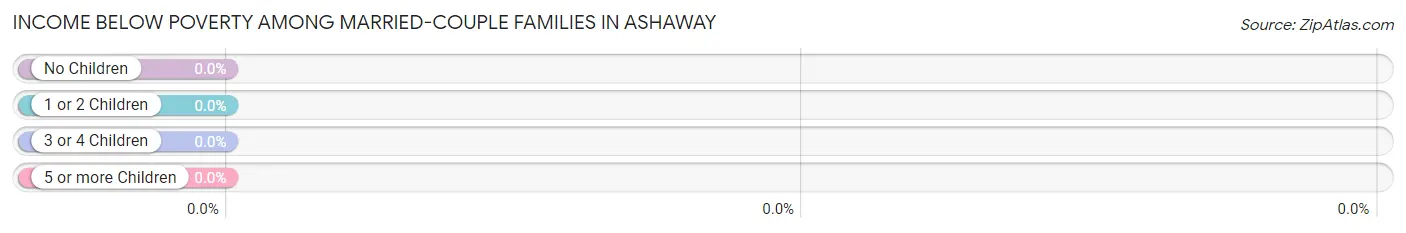
| Children | Above Poverty | Below Poverty |
| No Children | 154 (100.0%) | 0 (0.0%) |
| 1 or 2 Children | 142 (100.0%) | 0 (0.0%) |
| 3 or 4 Children | 20 (100.0%) | 0 (0.0%) |
| 5 or more Children | 10 (100.0%) | 0 (0.0%) |
| Total | 326 (100.0%) | 0 (0.0%) |
Income Below Poverty Among Single-Parent Households in Ashaway
| Children | Single Father | Single Mother |
| No Children | 0 (0.0%) | 0 (0.0%) |
| 1 or 2 Children | 0 (0.0%) | 0 (0.0%) |
| 3 or 4 Children | 0 (0.0%) | 0 (0.0%) |
| 5 or more Children | 0 (0.0%) | 0 (0.0%) |
| Total | 0 (0.0%) | 0 (0.0%) |
Income Below Poverty Among Married-Couple vs Single-Parent Households in Ashaway
| Children | Married-Couple Families | Single-Parent Households |
| No Children | 0 (0.0%) | 0 (0.0%) |
| 1 or 2 Children | 0 (0.0%) | 0 (0.0%) |
| 3 or 4 Children | 0 (0.0%) | 0 (0.0%) |
| 5 or more Children | 0 (0.0%) | 0 (0.0%) |
| Total | 0 (0.0%) | 0 (0.0%) |
Race in Ashaway
The most populous races in Ashaway are White / Caucasian (1,497 | 90.1%), Two or more Races (150 | 9.0%), and Hispanic or Latino (46 | 2.8%).
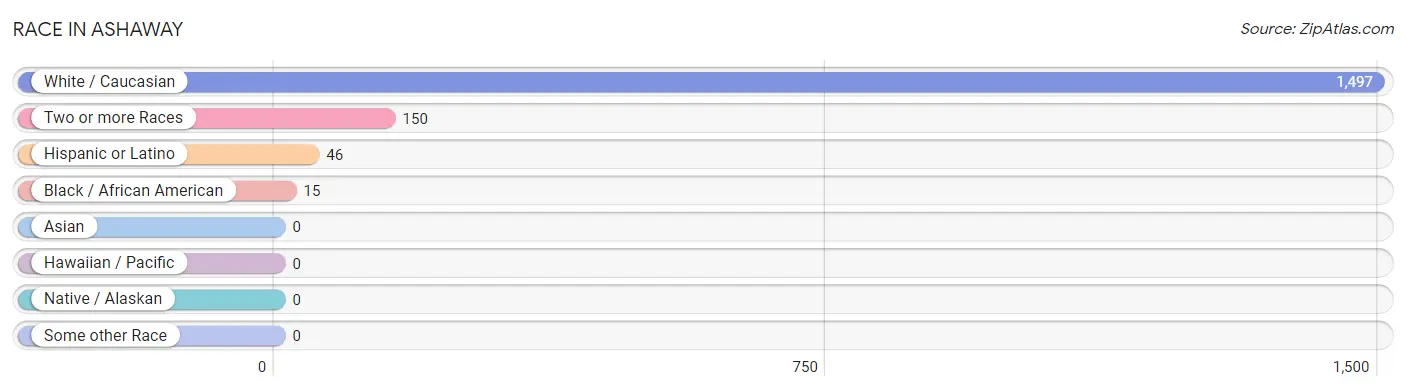
| Race | # Population | % Population |
| Asian | 0 | 0.0% |
| Black / African American | 15 | 0.9% |
| Hawaiian / Pacific | 0 | 0.0% |
| Hispanic or Latino | 46 | 2.8% |
| Native / Alaskan | 0 | 0.0% |
| White / Caucasian | 1,497 | 90.1% |
| Two or more Races | 150 | 9.0% |
| Some other Race | 0 | 0.0% |
| Total | 1,662 | 100.0% |
Ancestry in Ashaway
The most populous ancestries reported in Ashaway are English (419 | 25.2%), German (401 | 24.1%), French (355 | 21.4%), Italian (263 | 15.8%), and Irish (222 | 13.4%), together accounting for 99.9% of all Ashaway residents.
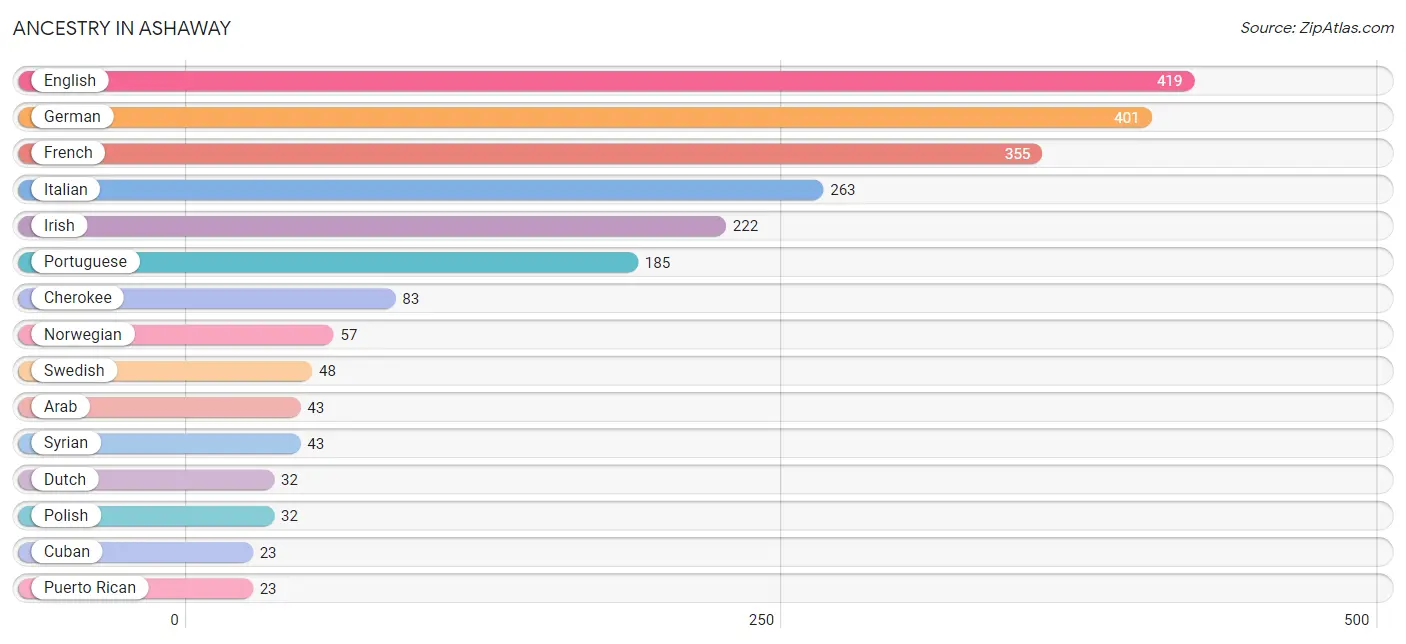
| Ancestry | # Population | % Population |
| American | 15 | 0.9% |
| Arab | 43 | 2.6% |
| Cherokee | 83 | 5.0% |
| Cuban | 23 | 1.4% |
| Dutch | 32 | 1.9% |
| English | 419 | 25.2% |
| French | 355 | 21.4% |
| French Canadian | 12 | 0.7% |
| German | 401 | 24.1% |
| Irish | 222 | 13.4% |
| Italian | 263 | 15.8% |
| Norwegian | 57 | 3.4% |
| Polish | 32 | 1.9% |
| Portuguese | 185 | 11.1% |
| Puerto Rican | 23 | 1.4% |
| Russian | 8 | 0.5% |
| Scottish | 20 | 1.2% |
| Swedish | 48 | 2.9% |
| Syrian | 43 | 2.6% |
| Welsh | 12 | 0.7% | View All 20 Rows |
Immigrants in Ashaway

| Immigration Origin | # Population | % Population | View All 0 Rows |
Sex and Age in Ashaway
Sex and Age in Ashaway
The most populous age groups in Ashaway are 20 to 24 Years (186 | 25.1%) for men and 5 to 9 Years (166 | 18.0%) for women.
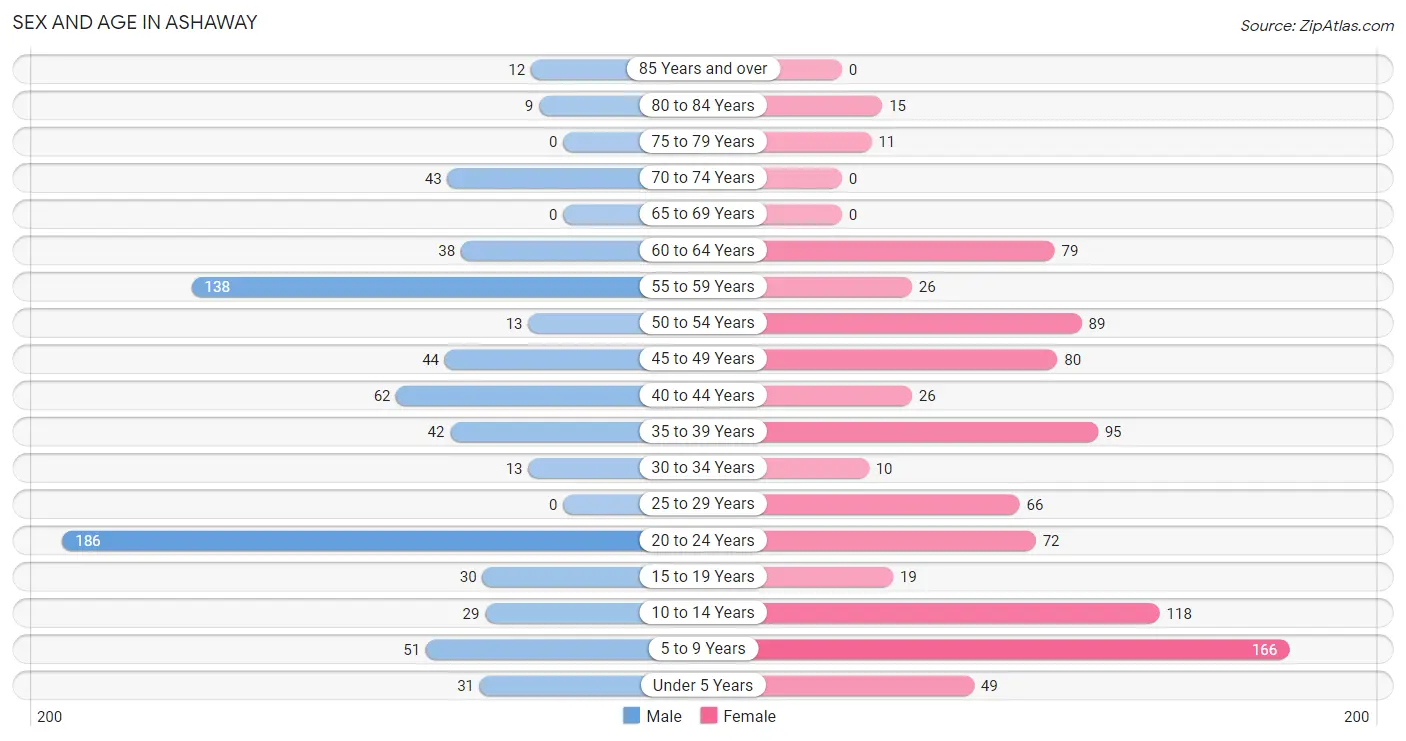
| Age Bracket | Male | Female |
| Under 5 Years | 31 (4.2%) | 49 (5.3%) |
| 5 to 9 Years | 51 (6.9%) | 166 (18.0%) |
| 10 to 14 Years | 29 (3.9%) | 118 (12.8%) |
| 15 to 19 Years | 30 (4.1%) | 19 (2.1%) |
| 20 to 24 Years | 186 (25.1%) | 72 (7.8%) |
| 25 to 29 Years | 0 (0.0%) | 66 (7.2%) |
| 30 to 34 Years | 13 (1.8%) | 10 (1.1%) |
| 35 to 39 Years | 42 (5.7%) | 95 (10.3%) |
| 40 to 44 Years | 62 (8.4%) | 26 (2.8%) |
| 45 to 49 Years | 44 (5.9%) | 80 (8.7%) |
| 50 to 54 Years | 13 (1.8%) | 89 (9.7%) |
| 55 to 59 Years | 138 (18.6%) | 26 (2.8%) |
| 60 to 64 Years | 38 (5.1%) | 79 (8.6%) |
| 65 to 69 Years | 0 (0.0%) | 0 (0.0%) |
| 70 to 74 Years | 43 (5.8%) | 0 (0.0%) |
| 75 to 79 Years | 0 (0.0%) | 11 (1.2%) |
| 80 to 84 Years | 9 (1.2%) | 15 (1.6%) |
| 85 Years and over | 12 (1.6%) | 0 (0.0%) |
| Total | 741 (100.0%) | 921 (100.0%) |
Families and Households in Ashaway
Median Family Size in Ashaway
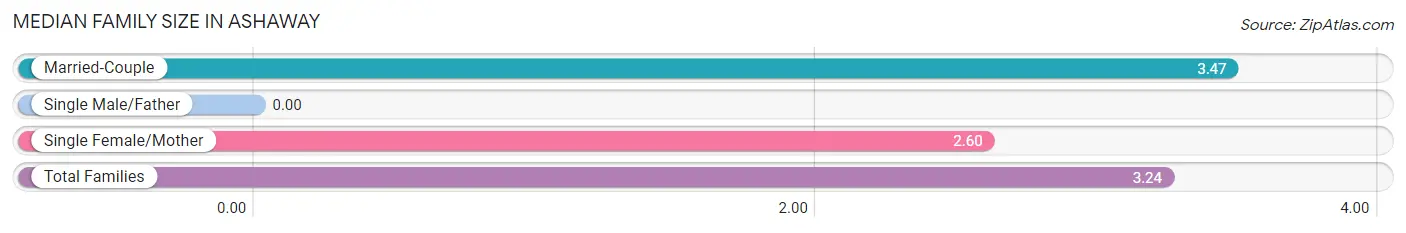
| Family Type | # Families | Family Size |
| Married-Couple | 326 (73.9%) | 3.47 |
| Single Male/Father | 0 (0.0%) | - |
| Single Female/Mother | 115 (26.1%) | 2.60 |
| Total Families | 441 (100.0%) | 3.24 |
Median Household Size in Ashaway
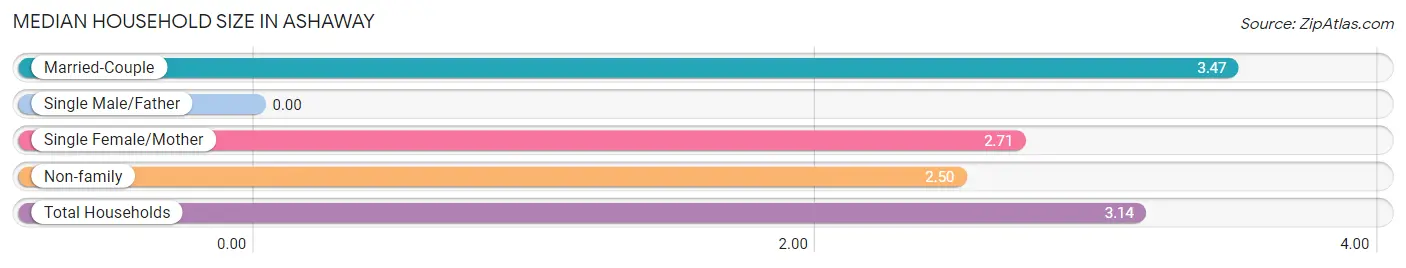
| Household Type | # Households | Household Size |
| Married-Couple | 326 (61.6%) | 3.47 |
| Single Male/Father | 0 (0.0%) | - |
| Single Female/Mother | 115 (21.7%) | 2.71 |
| Non-family | 88 (16.6%) | 2.50 |
| Total Households | 529 (100.0%) | 3.14 |
Household Size by Marriage Status in Ashaway
Out of a total of 529 households in Ashaway, 441 (83.4%) are family households, while 88 (16.6%) are nonfamily households. The most numerous type of family households are 2-person households, comprising 171, and the most common type of nonfamily households are 3-person households, comprising 73.
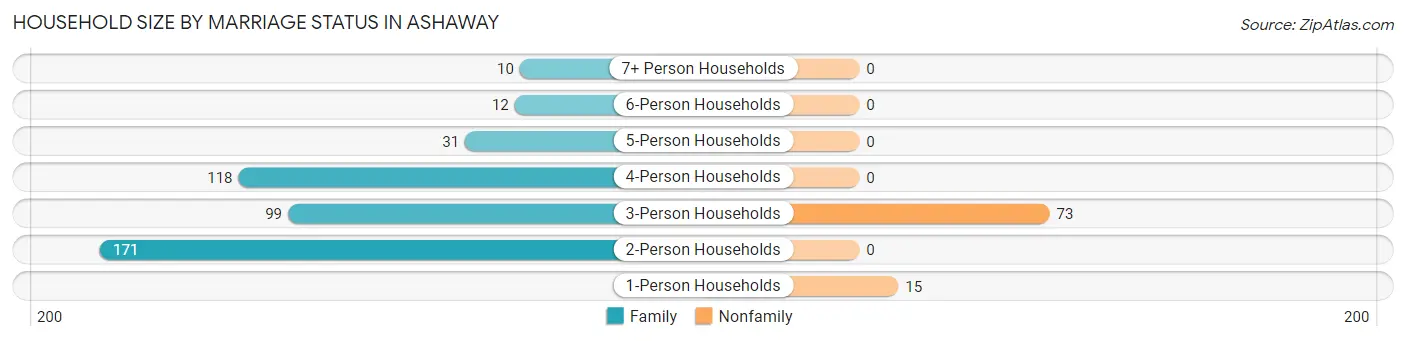
| Household Size | Family Households | Nonfamily Households |
| 1-Person Households | - | 15 (2.8%) |
| 2-Person Households | 171 (32.3%) | 0 (0.0%) |
| 3-Person Households | 99 (18.7%) | 73 (13.8%) |
| 4-Person Households | 118 (22.3%) | 0 (0.0%) |
| 5-Person Households | 31 (5.9%) | 0 (0.0%) |
| 6-Person Households | 12 (2.3%) | 0 (0.0%) |
| 7+ Person Households | 10 (1.9%) | 0 (0.0%) |
| Total | 441 (83.4%) | 88 (16.6%) |
Female Fertility in Ashaway
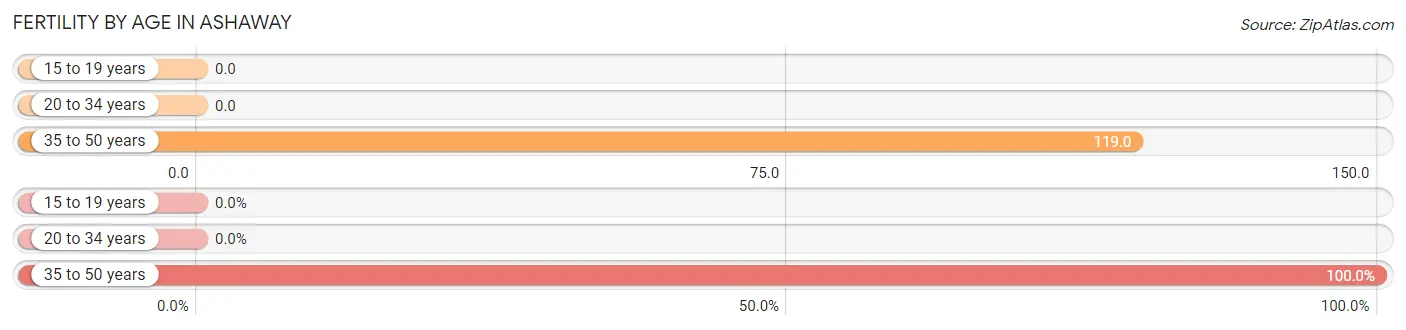
Fertility by Age in Ashaway
Average fertility rate in Ashaway is 65.0 births per 1,000 women. Women in the age bracket of 35 to 50 years have the highest fertility rate with 119.0 births per 1,000 women. Women in the age bracket of 35 to 50 years acount for 100.0% of all women with births.
| Age Bracket | Women with Births | Births / 1,000 Women |
| 15 to 19 years | 0 (0.0%) | 0.0 |
| 20 to 34 years | 0 (0.0%) | 0.0 |
| 35 to 50 years | 24 (100.0%) | 119.0 |
| Total | 24 (100.0%) | 65.0 |
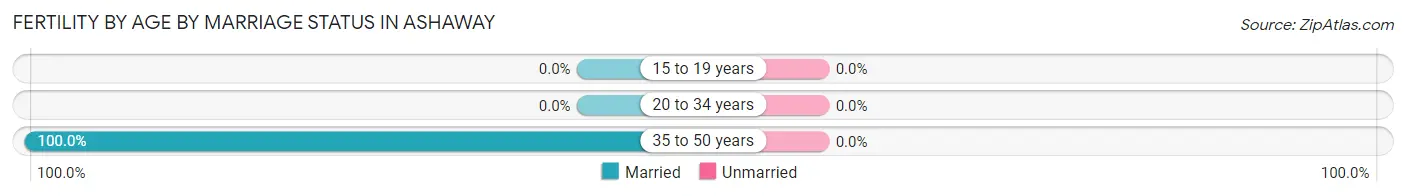
Fertility by Age by Marriage Status in Ashaway
| Age Bracket | Married | Unmarried |
| 15 to 19 years | 0 (0.0%) | 0 (0.0%) |
| 20 to 34 years | 0 (0.0%) | 0 (0.0%) |
| 35 to 50 years | 24 (100.0%) | 0 (0.0%) |
| Total | 24 (100.0%) | 0 (0.0%) |
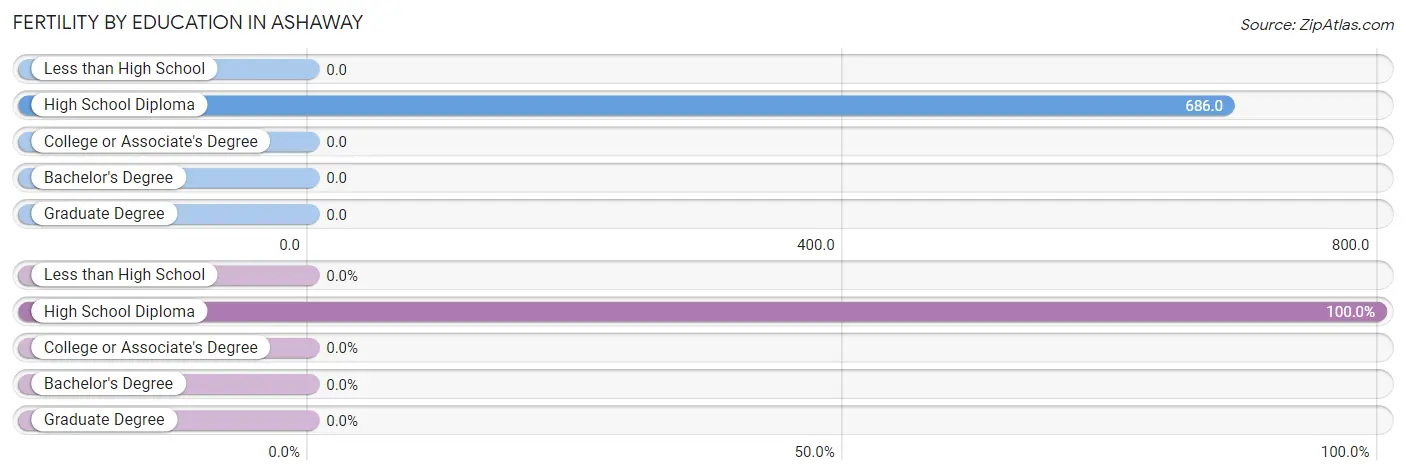
Fertility by Education in Ashaway
| Educational Attainment | Women with Births | Births / 1,000 Women |
| Less than High School | 0 (0.0%) | 0.0 |
| High School Diploma | 24 (100.0%) | 686.0 |
| College or Associate's Degree | 0 (0.0%) | 0.0 |
| Bachelor's Degree | 0 (0.0%) | 0.0 |
| Graduate Degree | 0 (0.0%) | 0.0 |
| Total | 24 (100.0%) | 65.0 |
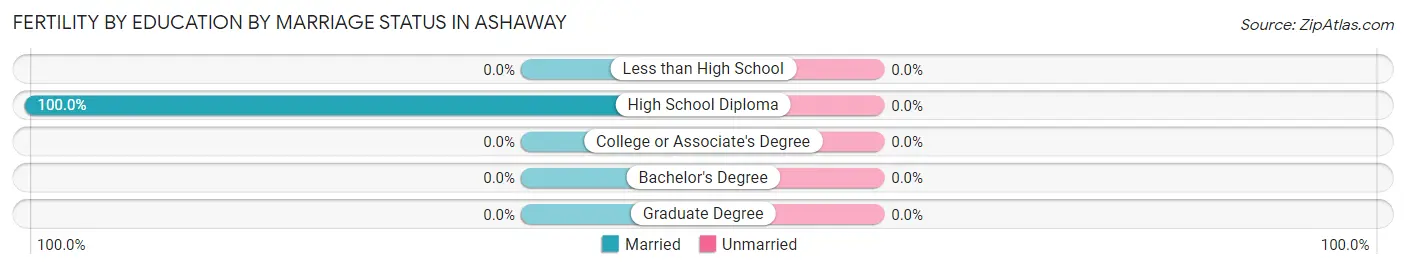
Fertility by Education by Marriage Status in Ashaway
| Educational Attainment | Married | Unmarried |
| Less than High School | 0 (0.0%) | 0 (0.0%) |
| High School Diploma | 24 (100.0%) | 0 (0.0%) |
| College or Associate's Degree | 0 (0.0%) | 0 (0.0%) |
| Bachelor's Degree | 0 (0.0%) | 0 (0.0%) |
| Graduate Degree | 0 (0.0%) | 0 (0.0%) |
| Total | 24 (100.0%) | 0 (0.0%) |
Employment Characteristics in Ashaway
Employment by Class of Employer in Ashaway
Among the 1,020 employed individuals in Ashaway, private company employees (826 | 81.0%), not-for-profit organizations (117 | 11.5%), and self-employed (not incorporated) (24 | 2.4%) make up the most common classes of employment.
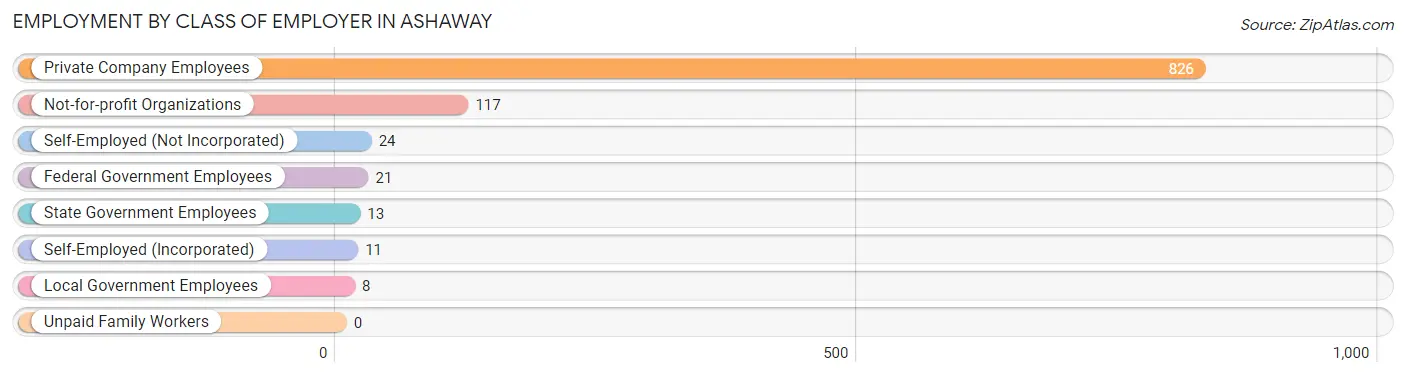
| Employer Class | # Employees | % Employees |
| Private Company Employees | 826 | 81.0% |
| Self-Employed (Incorporated) | 11 | 1.1% |
| Self-Employed (Not Incorporated) | 24 | 2.4% |
| Not-for-profit Organizations | 117 | 11.5% |
| Local Government Employees | 8 | 0.8% |
| State Government Employees | 13 | 1.3% |
| Federal Government Employees | 21 | 2.1% |
| Unpaid Family Workers | 0 | 0.0% |
| Total | 1,020 | 100.0% |
Employment Status by Age in Ashaway
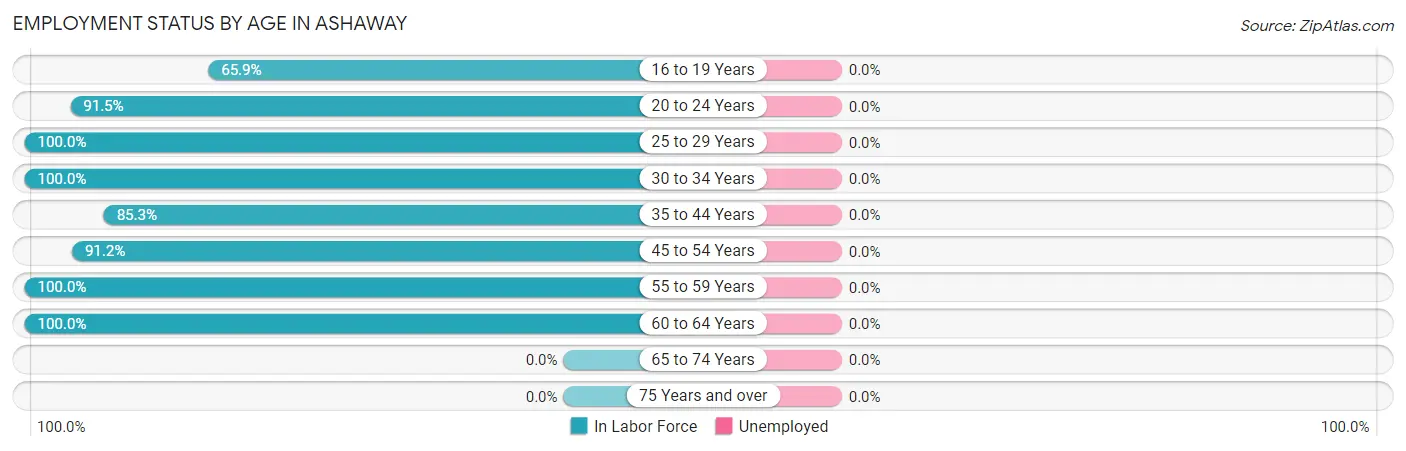
| Age Bracket | In Labor Force | Unemployed |
| 16 to 19 Years | 27 (65.9%) | 0 (0.0%) |
| 20 to 24 Years | 236 (91.5%) | 0 (0.0%) |
| 25 to 29 Years | 66 (100.0%) | 0 (0.0%) |
| 30 to 34 Years | 23 (100.0%) | 0 (0.0%) |
| 35 to 44 Years | 192 (85.3%) | 0 (0.0%) |
| 45 to 54 Years | 206 (91.2%) | 0 (0.0%) |
| 55 to 59 Years | 164 (100.0%) | 0 (0.0%) |
| 60 to 64 Years | 117 (100.0%) | 0 (0.0%) |
| 65 to 74 Years | 0 (0.0%) | 0 (0.0%) |
| 75 Years and over | 0 (0.0%) | 0 (0.0%) |
| Total | 1,031 (85.2%) | 0 (0.0%) |
Employment Status by Educational Attainment in Ashaway
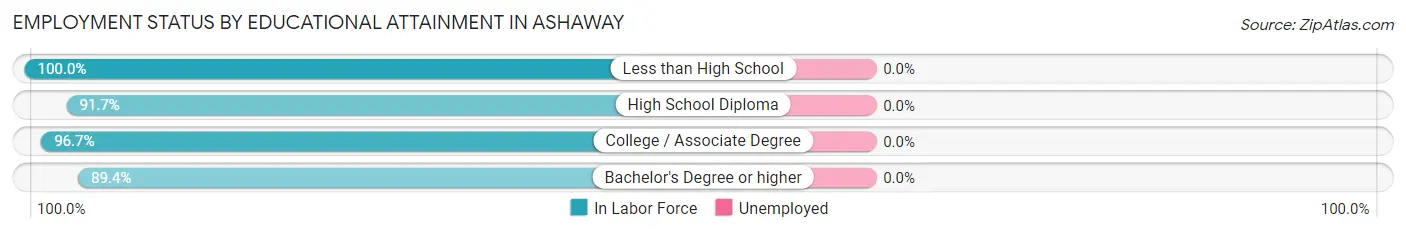
| Educational Attainment | In Labor Force | Unemployed |
| Less than High School | 13 (100.0%) | 0 (0.0%) |
| High School Diploma | 222 (91.7%) | 0 (0.0%) |
| College / Associate Degree | 355 (96.7%) | 0 (0.0%) |
| Bachelor's Degree or higher | 178 (89.4%) | 0 (0.0%) |
| Total | 768 (93.5%) | 0 (0.0%) |
Employment Occupations by Sex in Ashaway
Management, Business, Science and Arts Occupations
The most common Management, Business, Science and Arts occupations in Ashaway are Management (139 | 13.5%), Community & Social Service (104 | 10.1%), Health Diagnosing & Treating (92 | 8.9%), Health Technologists (92 | 8.9%), and Legal Services & Support (45 | 4.4%).
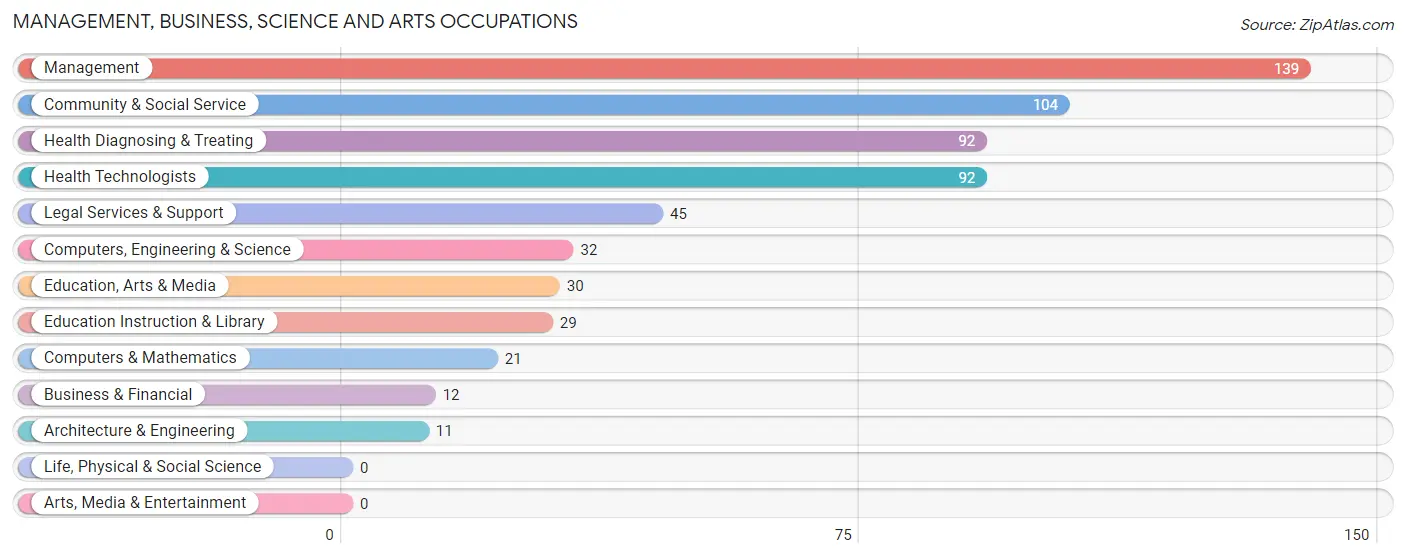
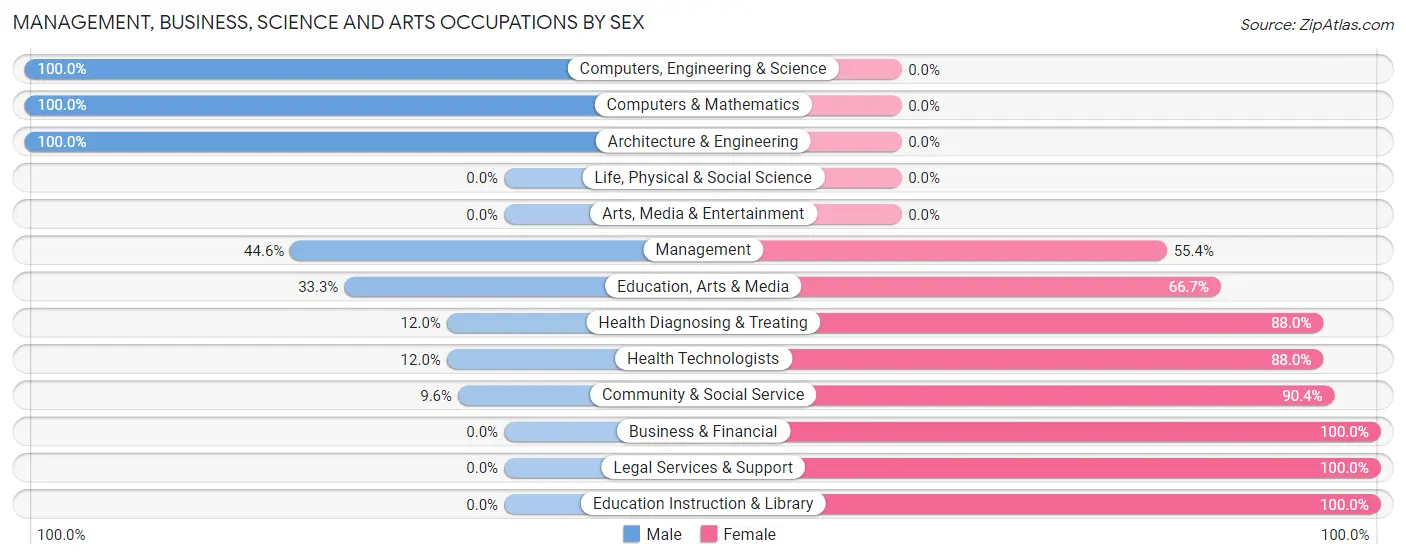
Management, Business, Science and Arts Occupations by Sex
Within the Management, Business, Science and Arts occupations in Ashaway, the most male-oriented occupations are Computers, Engineering & Science (100.0%), Computers & Mathematics (100.0%), and Architecture & Engineering (100.0%), while the most female-oriented occupations are Business & Financial (100.0%), Legal Services & Support (100.0%), and Education Instruction & Library (100.0%).
| Occupation | Male | Female |
| Management | 62 (44.6%) | 77 (55.4%) |
| Business & Financial | 0 (0.0%) | 12 (100.0%) |
| Computers, Engineering & Science | 32 (100.0%) | 0 (0.0%) |
| Computers & Mathematics | 21 (100.0%) | 0 (0.0%) |
| Architecture & Engineering | 11 (100.0%) | 0 (0.0%) |
| Life, Physical & Social Science | 0 (0.0%) | 0 (0.0%) |
| Community & Social Service | 10 (9.6%) | 94 (90.4%) |
| Education, Arts & Media | 10 (33.3%) | 20 (66.7%) |
| Legal Services & Support | 0 (0.0%) | 45 (100.0%) |
| Education Instruction & Library | 0 (0.0%) | 29 (100.0%) |
| Arts, Media & Entertainment | 0 (0.0%) | 0 (0.0%) |
| Health Diagnosing & Treating | 11 (12.0%) | 81 (88.0%) |
| Health Technologists | 11 (12.0%) | 81 (88.0%) |
| Total (Category) | 115 (30.3%) | 264 (69.7%) |
| Total (Overall) | 530 (51.4%) | 501 (48.6%) |
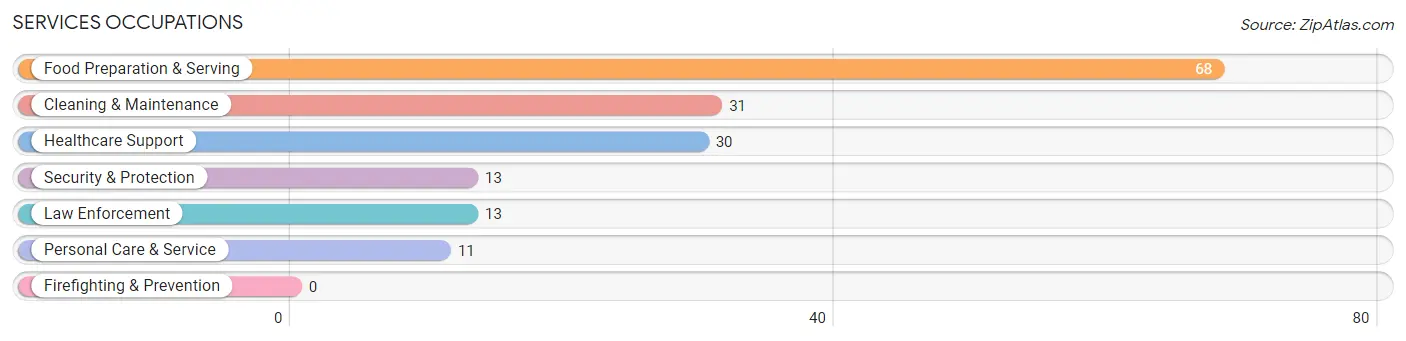
Services Occupations
The most common Services occupations in Ashaway are Food Preparation & Serving (68 | 6.6%), Cleaning & Maintenance (31 | 3.0%), Healthcare Support (30 | 2.9%), Security & Protection (13 | 1.3%), and Law Enforcement (13 | 1.3%).
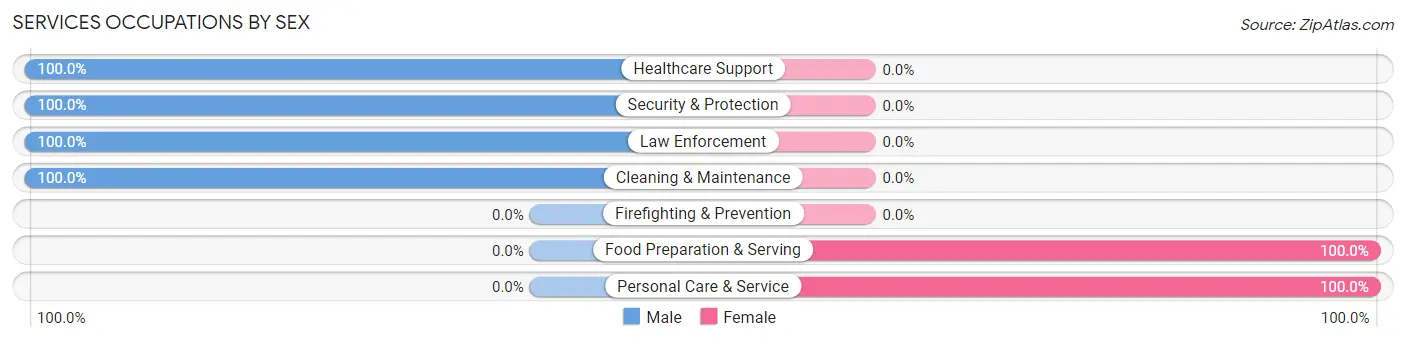
Services Occupations by Sex
Within the Services occupations in Ashaway, the most male-oriented occupations are Healthcare Support (100.0%), Security & Protection (100.0%), and Law Enforcement (100.0%), while the most female-oriented occupations are Food Preparation & Serving (100.0%), and Personal Care & Service (100.0%).
| Occupation | Male | Female |
| Healthcare Support | 30 (100.0%) | 0 (0.0%) |
| Security & Protection | 13 (100.0%) | 0 (0.0%) |
| Firefighting & Prevention | 0 (0.0%) | 0 (0.0%) |
| Law Enforcement | 13 (100.0%) | 0 (0.0%) |
| Food Preparation & Serving | 0 (0.0%) | 68 (100.0%) |
| Cleaning & Maintenance | 31 (100.0%) | 0 (0.0%) |
| Personal Care & Service | 0 (0.0%) | 11 (100.0%) |
| Total (Category) | 74 (48.4%) | 79 (51.6%) |
| Total (Overall) | 530 (51.4%) | 501 (48.6%) |
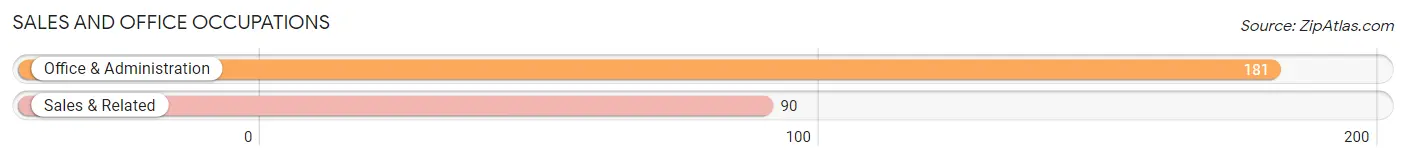
Sales and Office Occupations
The most common Sales and Office occupations in Ashaway are Office & Administration (181 | 17.6%), and Sales & Related (90 | 8.7%).
Sales and Office Occupations by Sex
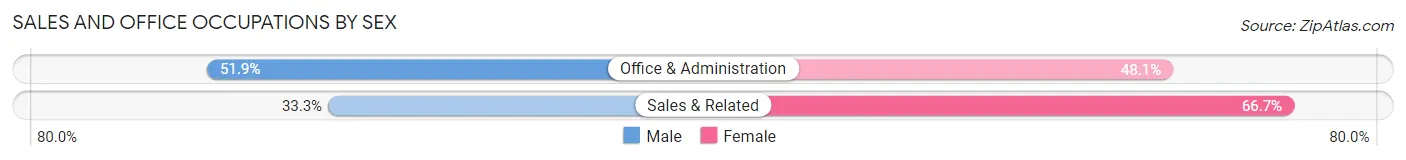
| Occupation | Male | Female |
| Sales & Related | 30 (33.3%) | 60 (66.7%) |
| Office & Administration | 94 (51.9%) | 87 (48.1%) |
| Total (Category) | 124 (45.8%) | 147 (54.2%) |
| Total (Overall) | 530 (51.4%) | 501 (48.6%) |
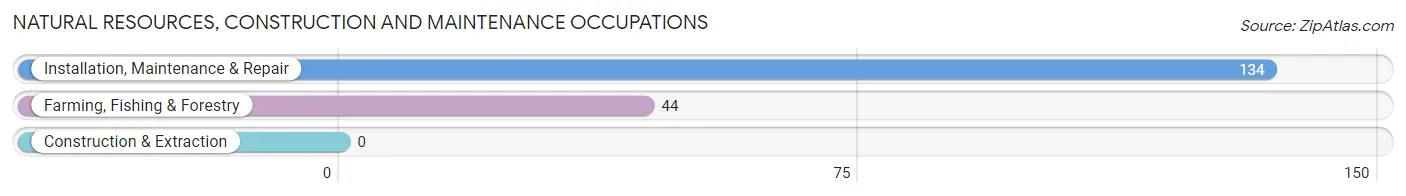
Natural Resources, Construction and Maintenance Occupations
The most common Natural Resources, Construction and Maintenance occupations in Ashaway are Installation, Maintenance & Repair (134 | 13.0%), and Farming, Fishing & Forestry (44 | 4.3%).
Natural Resources, Construction and Maintenance Occupations by Sex
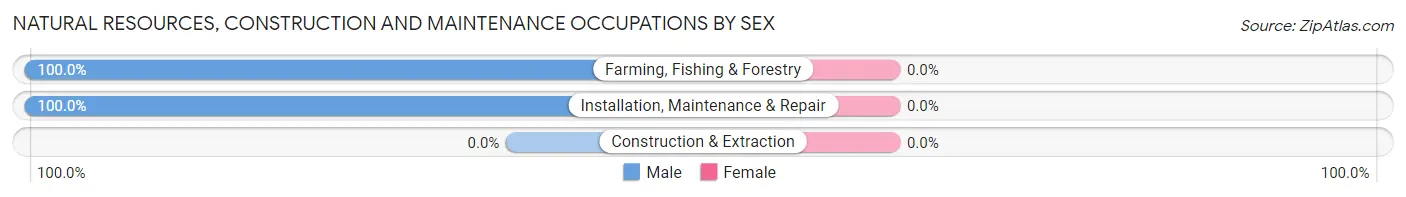
| Occupation | Male | Female |
| Farming, Fishing & Forestry | 44 (100.0%) | 0 (0.0%) |
| Construction & Extraction | 0 (0.0%) | 0 (0.0%) |
| Installation, Maintenance & Repair | 134 (100.0%) | 0 (0.0%) |
| Total (Category) | 178 (100.0%) | 0 (0.0%) |
| Total (Overall) | 530 (51.4%) | 501 (48.6%) |
Production, Transportation and Moving Occupations
The most common Production, Transportation and Moving occupations in Ashaway are Production (36 | 3.5%), and Transportation (14 | 1.4%).
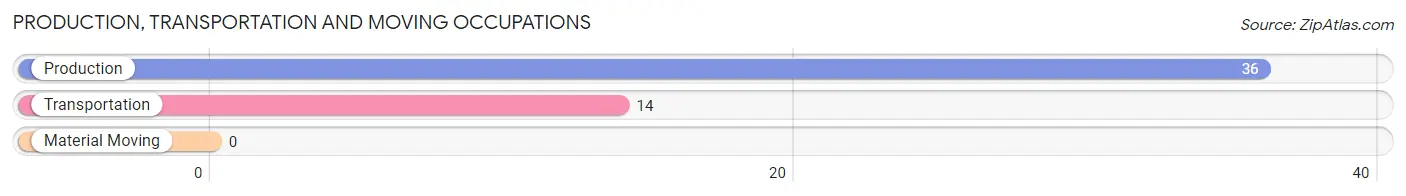
Production, Transportation and Moving Occupations by Sex
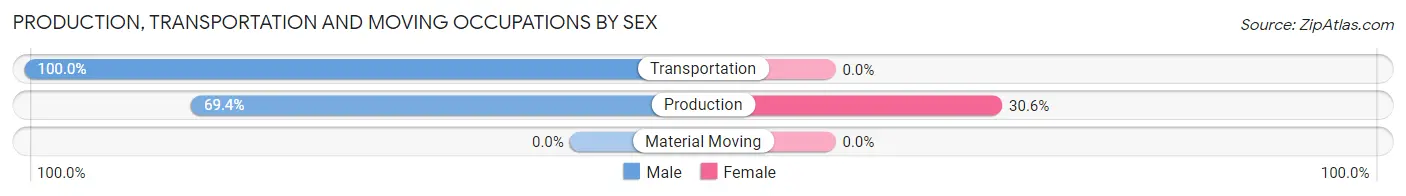
| Occupation | Male | Female |
| Production | 25 (69.4%) | 11 (30.6%) |
| Transportation | 14 (100.0%) | 0 (0.0%) |
| Material Moving | 0 (0.0%) | 0 (0.0%) |
| Total (Category) | 39 (78.0%) | 11 (22.0%) |
| Total (Overall) | 530 (51.4%) | 501 (48.6%) |
Employment Industries by Sex in Ashaway
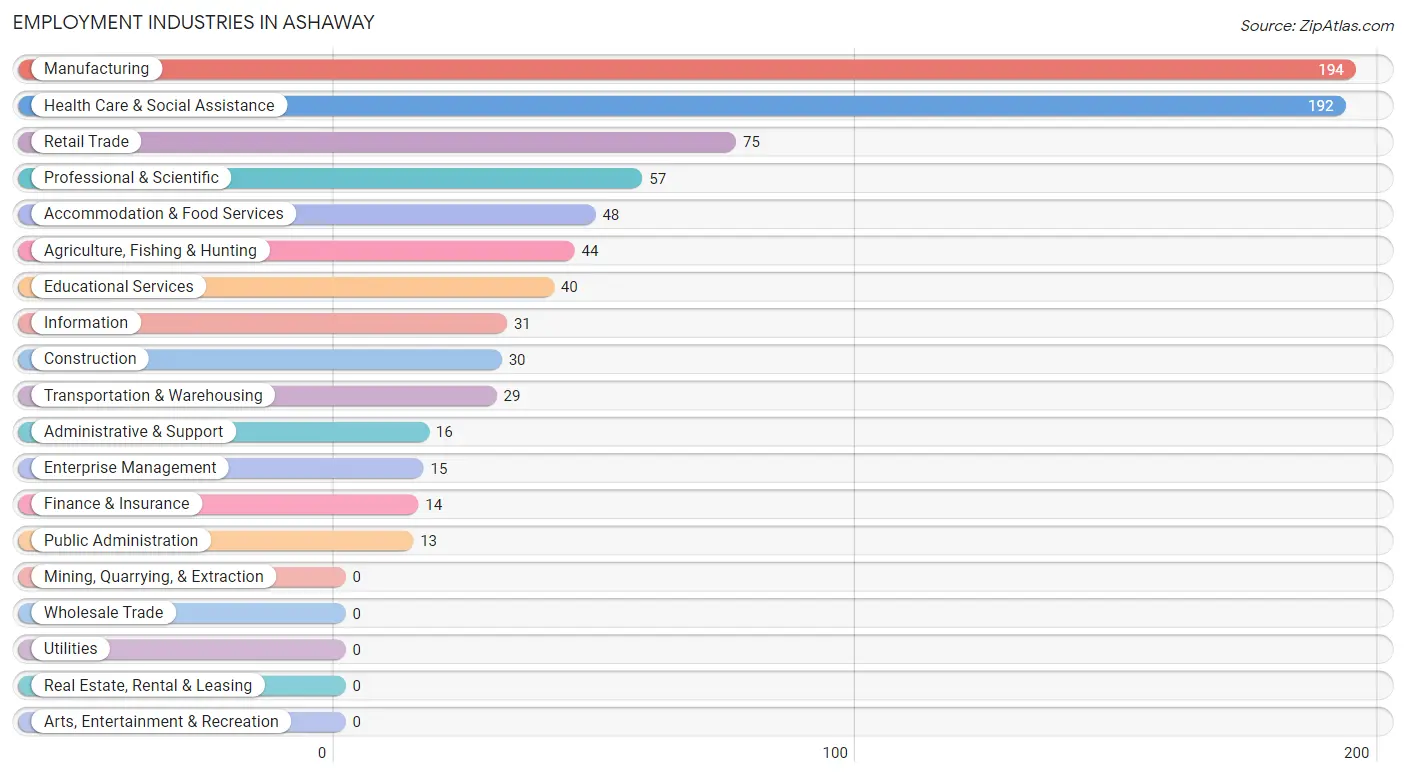
Employment Industries in Ashaway
The major employment industries in Ashaway include Manufacturing (194 | 18.8%), Health Care & Social Assistance (192 | 18.6%), Retail Trade (75 | 7.3%), Professional & Scientific (57 | 5.5%), and Accommodation & Food Services (48 | 4.7%).
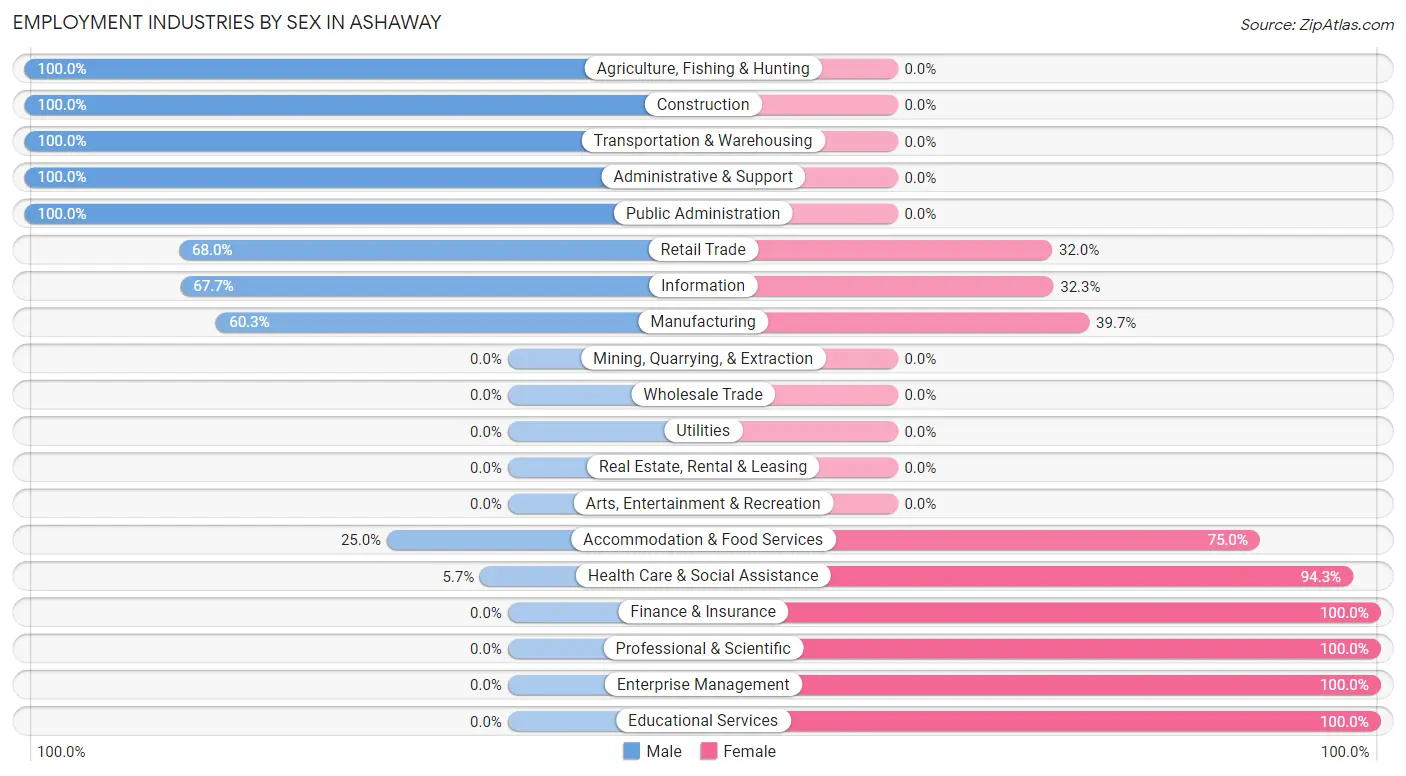
Employment Industries by Sex in Ashaway
The Ashaway industries that see more men than women are Agriculture, Fishing & Hunting (100.0%), Construction (100.0%), and Transportation & Warehousing (100.0%), whereas the industries that tend to have a higher number of women are Finance & Insurance (100.0%), Professional & Scientific (100.0%), and Enterprise Management (100.0%).
| Industry | Male | Female |
| Agriculture, Fishing & Hunting | 44 (100.0%) | 0 (0.0%) |
| Mining, Quarrying, & Extraction | 0 (0.0%) | 0 (0.0%) |
| Construction | 30 (100.0%) | 0 (0.0%) |
| Manufacturing | 117 (60.3%) | 77 (39.7%) |
| Wholesale Trade | 0 (0.0%) | 0 (0.0%) |
| Retail Trade | 51 (68.0%) | 24 (32.0%) |
| Transportation & Warehousing | 29 (100.0%) | 0 (0.0%) |
| Utilities | 0 (0.0%) | 0 (0.0%) |
| Information | 21 (67.7%) | 10 (32.3%) |
| Finance & Insurance | 0 (0.0%) | 14 (100.0%) |
| Real Estate, Rental & Leasing | 0 (0.0%) | 0 (0.0%) |
| Professional & Scientific | 0 (0.0%) | 57 (100.0%) |
| Enterprise Management | 0 (0.0%) | 15 (100.0%) |
| Administrative & Support | 16 (100.0%) | 0 (0.0%) |
| Educational Services | 0 (0.0%) | 40 (100.0%) |
| Health Care & Social Assistance | 11 (5.7%) | 181 (94.3%) |
| Arts, Entertainment & Recreation | 0 (0.0%) | 0 (0.0%) |
| Accommodation & Food Services | 12 (25.0%) | 36 (75.0%) |
| Public Administration | 13 (100.0%) | 0 (0.0%) |
| Total | 530 (51.4%) | 501 (48.6%) |
Education in Ashaway
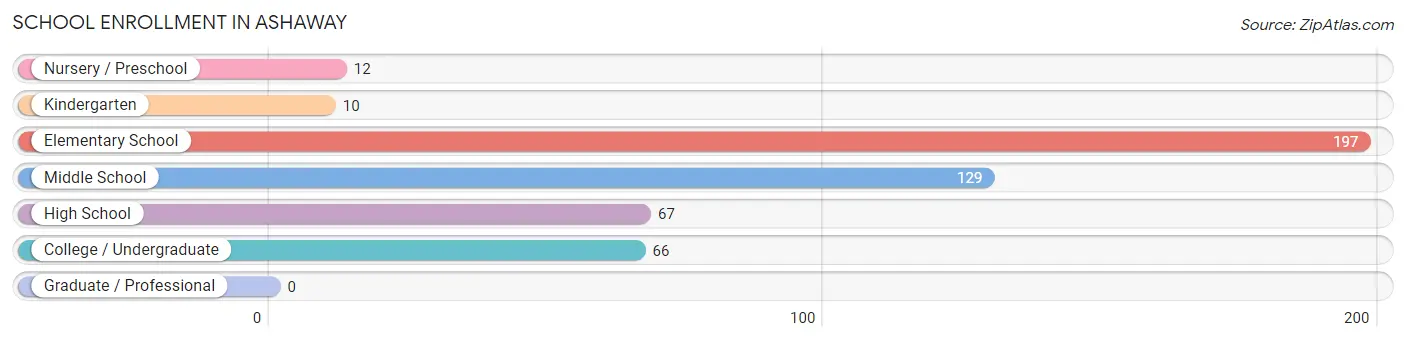
School Enrollment in Ashaway
The most common levels of schooling among the 481 students in Ashaway are elementary school (197 | 41.0%), middle school (129 | 26.8%), and high school (67 | 13.9%).
| School Level | # Students | % Students |
| Nursery / Preschool | 12 | 2.5% |
| Kindergarten | 10 | 2.1% |
| Elementary School | 197 | 41.0% |
| Middle School | 129 | 26.8% |
| High School | 67 | 13.9% |
| College / Undergraduate | 66 | 13.7% |
| Graduate / Professional | 0 | 0.0% |
| Total | 481 | 100.0% |
School Enrollment by Age by Funding Source in Ashaway
Out of a total of 481 students who are enrolled in schools in Ashaway, 65 (13.5%) attend a private institution, while the remaining 416 (86.5%) are enrolled in public schools. The age group of 15 to 17 year olds has the highest likelihood of being enrolled in private schools, with 27 (55.1% in the age bracket) enrolled. Conversely, the age group of 3 to 4 year olds has the lowest likelihood of being enrolled in a private school, with 12 (100.0% in the age bracket) attending a public institution.
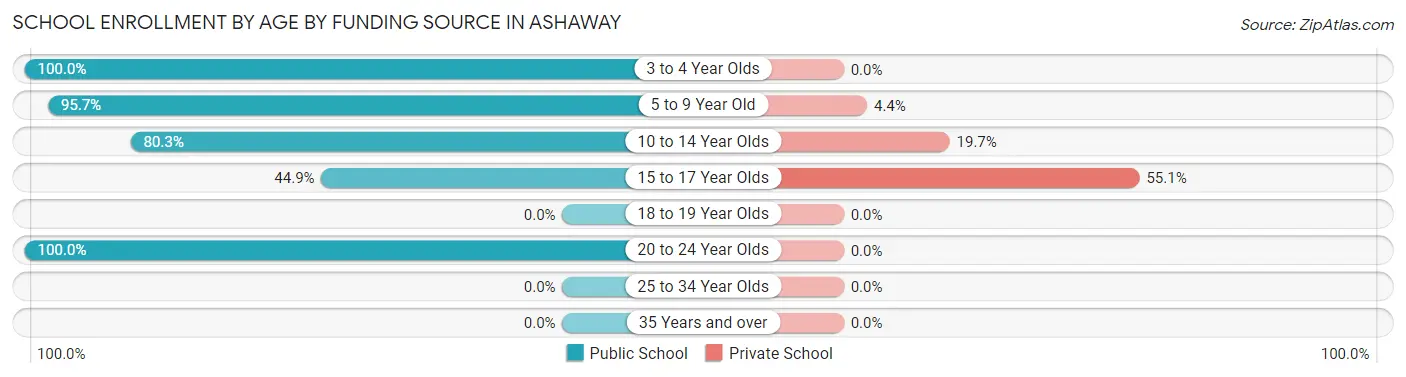
| Age Bracket | Public School | Private School |
| 3 to 4 Year Olds | 12 (100.0%) | 0 (0.0%) |
| 5 to 9 Year Old | 198 (95.7%) | 9 (4.3%) |
| 10 to 14 Year Olds | 118 (80.3%) | 29 (19.7%) |
| 15 to 17 Year Olds | 22 (44.9%) | 27 (55.1%) |
| 18 to 19 Year Olds | 0 (0.0%) | 0 (0.0%) |
| 20 to 24 Year Olds | 66 (100.0%) | 0 (0.0%) |
| 25 to 34 Year Olds | 0 (0.0%) | 0 (0.0%) |
| 35 Years and over | 0 (0.0%) | 0 (0.0%) |
| Total | 416 (86.5%) | 65 (13.5%) |
Educational Attainment by Field of Study in Ashaway
Business (62 | 28.3%), science & technology (33 | 15.1%), arts & humanities (29 | 13.2%), social sciences (23 | 10.5%), and psychology (15 | 6.9%) are the most common fields of study among 219 individuals in Ashaway who have obtained a bachelor's degree or higher.
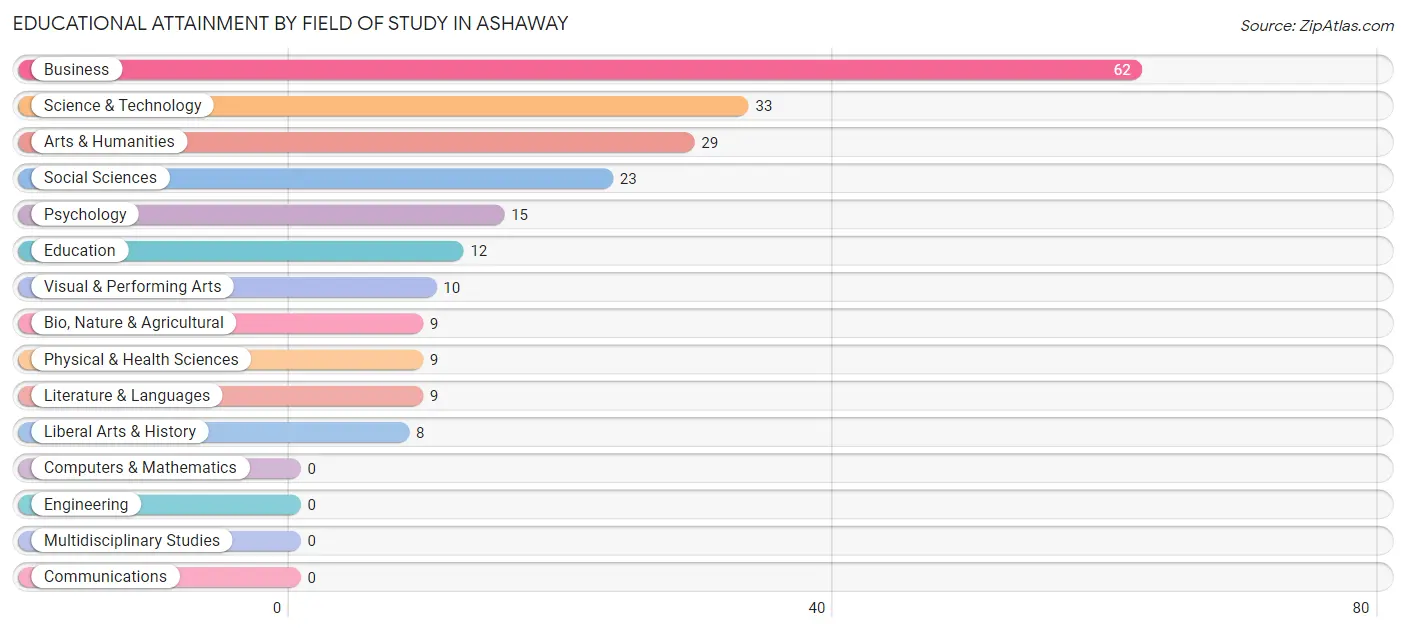
| Field of Study | # Graduates | % Graduates |
| Computers & Mathematics | 0 | 0.0% |
| Bio, Nature & Agricultural | 9 | 4.1% |
| Physical & Health Sciences | 9 | 4.1% |
| Psychology | 15 | 6.9% |
| Social Sciences | 23 | 10.5% |
| Engineering | 0 | 0.0% |
| Multidisciplinary Studies | 0 | 0.0% |
| Science & Technology | 33 | 15.1% |
| Business | 62 | 28.3% |
| Education | 12 | 5.5% |
| Literature & Languages | 9 | 4.1% |
| Liberal Arts & History | 8 | 3.6% |
| Visual & Performing Arts | 10 | 4.6% |
| Communications | 0 | 0.0% |
| Arts & Humanities | 29 | 13.2% |
| Total | 219 | 100.0% |
Transportation & Commute in Ashaway
Vehicle Availability by Sex in Ashaway
The most prevalent vehicle ownership categories in Ashaway are males with 3 vehicles (265, accounting for 50.0%) and females with 3 vehicles (195, making up 54.1%).
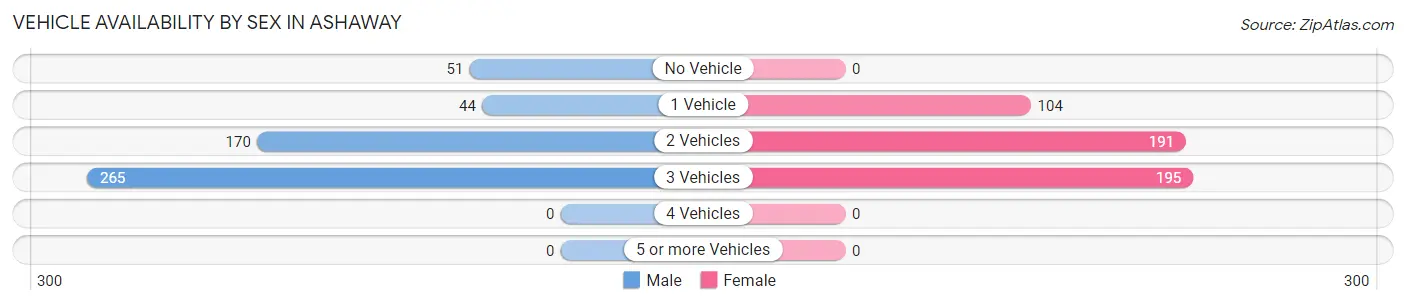
| Vehicles Available | Male | Female |
| No Vehicle | 51 (9.6%) | 0 (0.0%) |
| 1 Vehicle | 44 (8.3%) | 104 (21.2%) |
| 2 Vehicles | 170 (32.1%) | 191 (39.0%) |
| 3 Vehicles | 265 (50.0%) | 195 (39.8%) |
| 4 Vehicles | 0 (0.0%) | 0 (0.0%) |
| 5 or more Vehicles | 0 (0.0%) | 0 (0.0%) |
| Total | 530 (100.0%) | 490 (100.0%) |
Commute Time in Ashaway
The most frequently occuring commute durations in Ashaway are 10 to 14 minutes (281 commuters, 28.1%), 30 to 34 minutes (195 commuters, 19.5%), and 45 to 59 minutes (192 commuters, 19.2%).
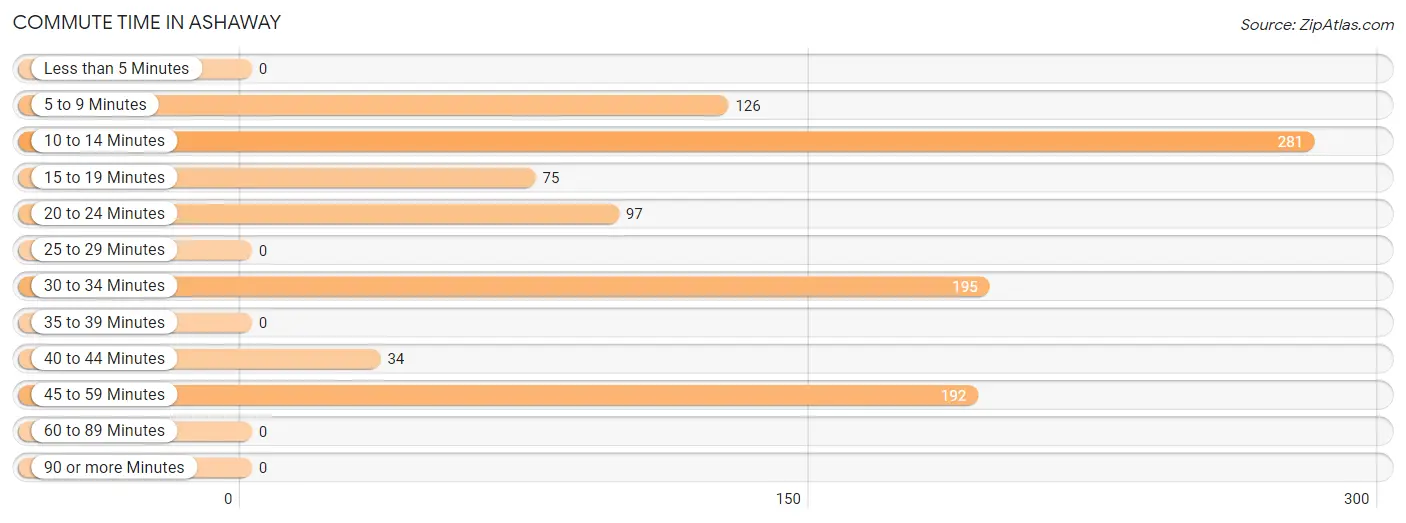
| Commute Time | # Commuters | % Commuters |
| Less than 5 Minutes | 0 | 0.0% |
| 5 to 9 Minutes | 126 | 12.6% |
| 10 to 14 Minutes | 281 | 28.1% |
| 15 to 19 Minutes | 75 | 7.5% |
| 20 to 24 Minutes | 97 | 9.7% |
| 25 to 29 Minutes | 0 | 0.0% |
| 30 to 34 Minutes | 195 | 19.5% |
| 35 to 39 Minutes | 0 | 0.0% |
| 40 to 44 Minutes | 34 | 3.4% |
| 45 to 59 Minutes | 192 | 19.2% |
| 60 to 89 Minutes | 0 | 0.0% |
| 90 or more Minutes | 0 | 0.0% |
Commute Time by Sex in Ashaway
The most common commute times in Ashaway are 45 to 59 minutes (181 commuters, 34.7%) for males and 10 to 14 minutes (227 commuters, 47.5%) for females.
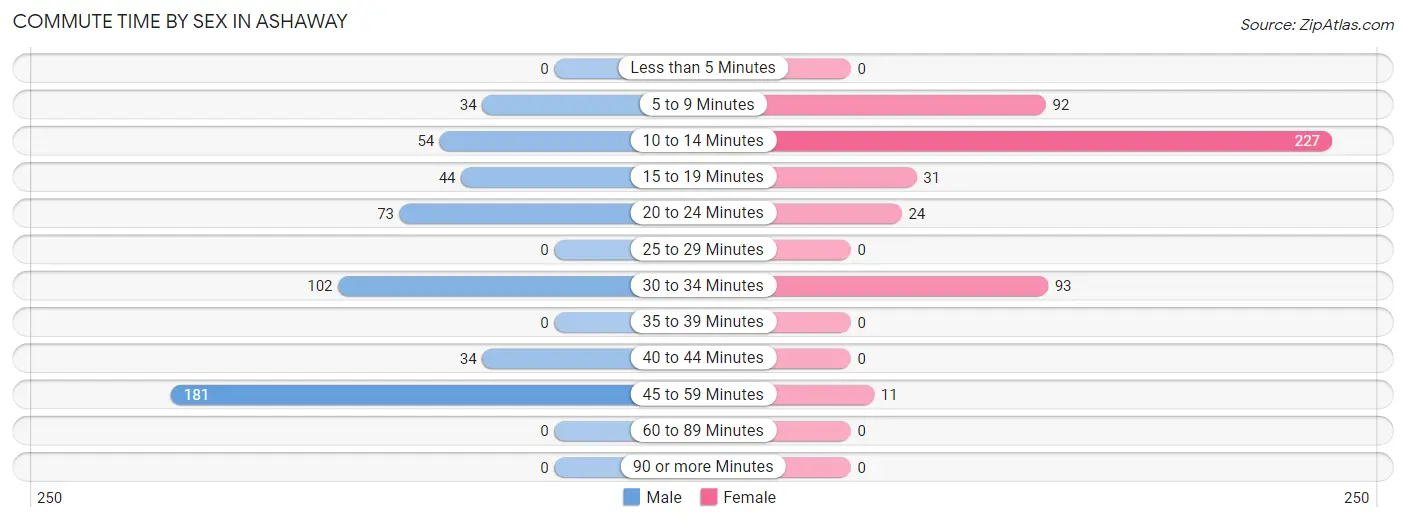
| Commute Time | Male | Female |
| Less than 5 Minutes | 0 (0.0%) | 0 (0.0%) |
| 5 to 9 Minutes | 34 (6.5%) | 92 (19.3%) |
| 10 to 14 Minutes | 54 (10.3%) | 227 (47.5%) |
| 15 to 19 Minutes | 44 (8.4%) | 31 (6.5%) |
| 20 to 24 Minutes | 73 (14.0%) | 24 (5.0%) |
| 25 to 29 Minutes | 0 (0.0%) | 0 (0.0%) |
| 30 to 34 Minutes | 102 (19.5%) | 93 (19.5%) |
| 35 to 39 Minutes | 0 (0.0%) | 0 (0.0%) |
| 40 to 44 Minutes | 34 (6.5%) | 0 (0.0%) |
| 45 to 59 Minutes | 181 (34.7%) | 11 (2.3%) |
| 60 to 89 Minutes | 0 (0.0%) | 0 (0.0%) |
| 90 or more Minutes | 0 (0.0%) | 0 (0.0%) |
Time of Departure to Work by Sex in Ashaway
The most frequent times of departure to work in Ashaway are 12:00 PM to 3:59 PM (194, 37.2%) for males and 9:00 AM to 9:59 AM (147, 30.7%) for females.
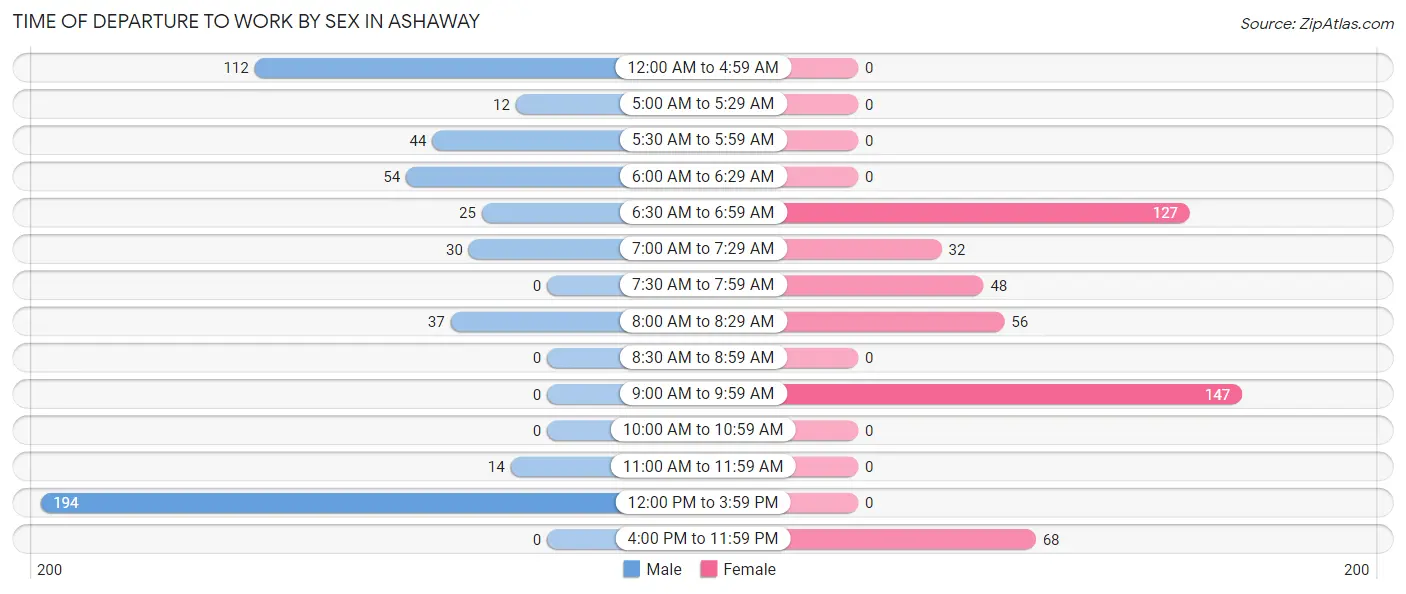
| Time of Departure | Male | Female |
| 12:00 AM to 4:59 AM | 112 (21.5%) | 0 (0.0%) |
| 5:00 AM to 5:29 AM | 12 (2.3%) | 0 (0.0%) |
| 5:30 AM to 5:59 AM | 44 (8.4%) | 0 (0.0%) |
| 6:00 AM to 6:29 AM | 54 (10.3%) | 0 (0.0%) |
| 6:30 AM to 6:59 AM | 25 (4.8%) | 127 (26.6%) |
| 7:00 AM to 7:29 AM | 30 (5.8%) | 32 (6.7%) |
| 7:30 AM to 7:59 AM | 0 (0.0%) | 48 (10.0%) |
| 8:00 AM to 8:29 AM | 37 (7.1%) | 56 (11.7%) |
| 8:30 AM to 8:59 AM | 0 (0.0%) | 0 (0.0%) |
| 9:00 AM to 9:59 AM | 0 (0.0%) | 147 (30.7%) |
| 10:00 AM to 10:59 AM | 0 (0.0%) | 0 (0.0%) |
| 11:00 AM to 11:59 AM | 14 (2.7%) | 0 (0.0%) |
| 12:00 PM to 3:59 PM | 194 (37.2%) | 0 (0.0%) |
| 4:00 PM to 11:59 PM | 0 (0.0%) | 68 (14.2%) |
| Total | 522 (100.0%) | 478 (100.0%) |
Housing Occupancy in Ashaway
Occupancy by Ownership in Ashaway
Of the total 529 dwellings in Ashaway, owner-occupied units account for 331 (62.6%), while renter-occupied units make up 198 (37.4%).
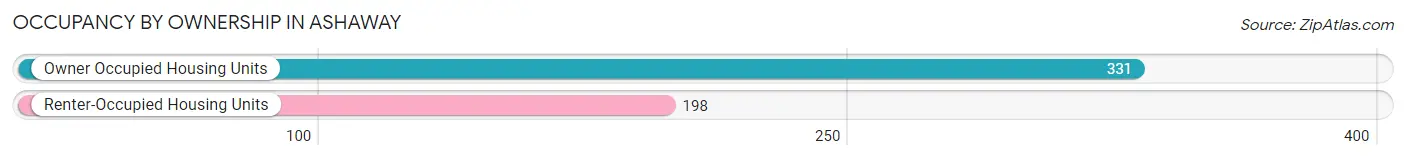
| Occupancy | # Housing Units | % Housing Units |
| Owner Occupied Housing Units | 331 | 62.6% |
| Renter-Occupied Housing Units | 198 | 37.4% |
| Total Occupied Housing Units | 529 | 100.0% |
Occupancy by Household Size in Ashaway
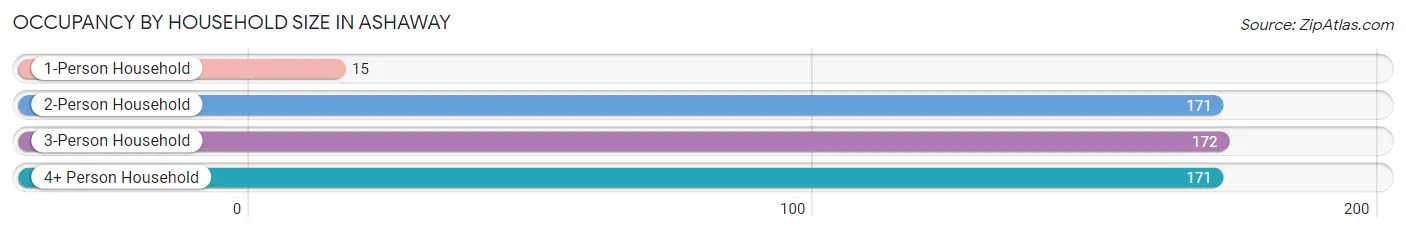
| Household Size | # Housing Units | % Housing Units |
| 1-Person Household | 15 | 2.8% |
| 2-Person Household | 171 | 32.3% |
| 3-Person Household | 172 | 32.5% |
| 4+ Person Household | 171 | 32.3% |
| Total Housing Units | 529 | 100.0% |
Occupancy by Ownership by Household Size in Ashaway
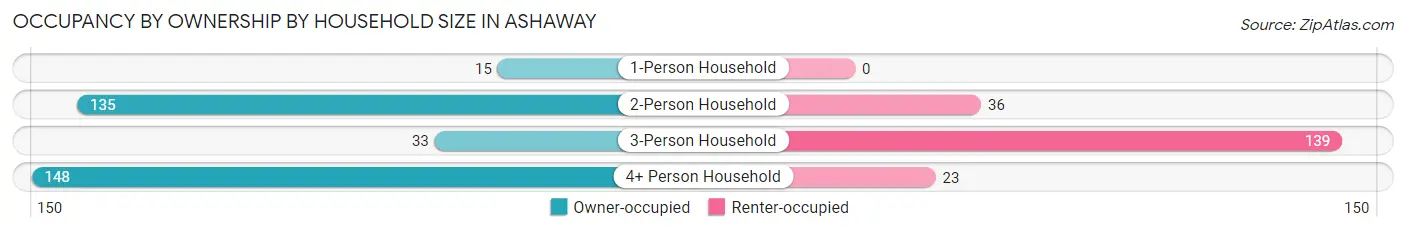
| Household Size | Owner-occupied | Renter-occupied |
| 1-Person Household | 15 (100.0%) | 0 (0.0%) |
| 2-Person Household | 135 (78.9%) | 36 (21.0%) |
| 3-Person Household | 33 (19.2%) | 139 (80.8%) |
| 4+ Person Household | 148 (86.6%) | 23 (13.5%) |
| Total Housing Units | 331 (62.6%) | 198 (37.4%) |
Occupancy by Educational Attainment in Ashaway
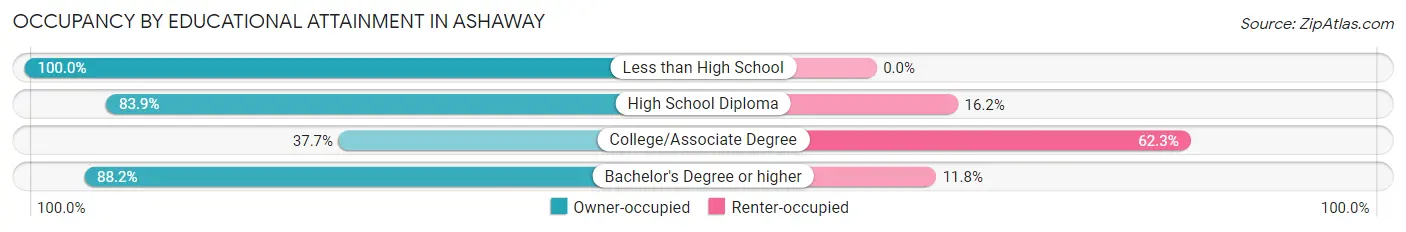
| Household Size | Owner-occupied | Renter-occupied |
| Less than High School | 12 (100.0%) | 0 (0.0%) |
| High School Diploma | 109 (83.9%) | 21 (16.2%) |
| College/Associate Degree | 98 (37.7%) | 162 (62.3%) |
| Bachelor's Degree or higher | 112 (88.2%) | 15 (11.8%) |
Occupancy by Age of Householder in Ashaway
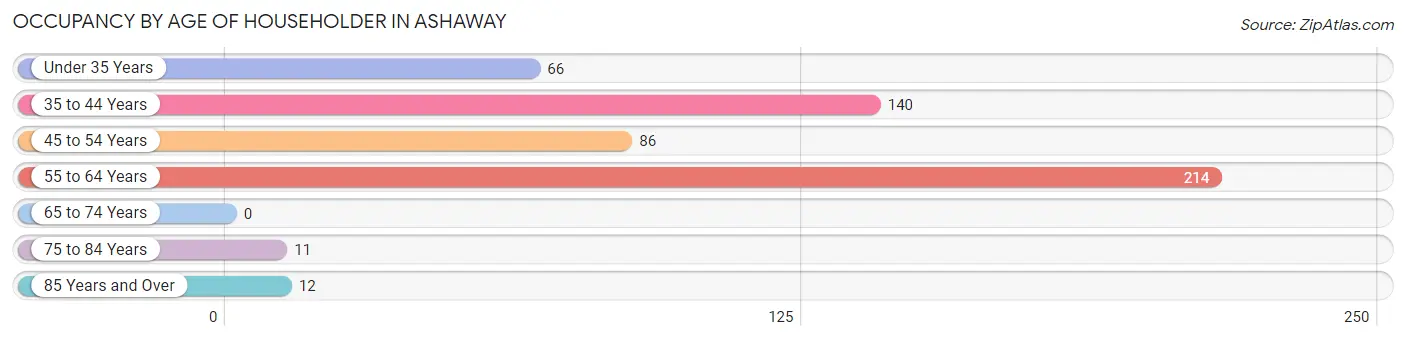
| Age Bracket | # Households | % Households |
| Under 35 Years | 66 | 12.5% |
| 35 to 44 Years | 140 | 26.5% |
| 45 to 54 Years | 86 | 16.3% |
| 55 to 64 Years | 214 | 40.5% |
| 65 to 74 Years | 0 | 0.0% |
| 75 to 84 Years | 11 | 2.1% |
| 85 Years and Over | 12 | 2.3% |
| Total | 529 | 100.0% |
Housing Finances in Ashaway
Median Income by Occupancy in Ashaway
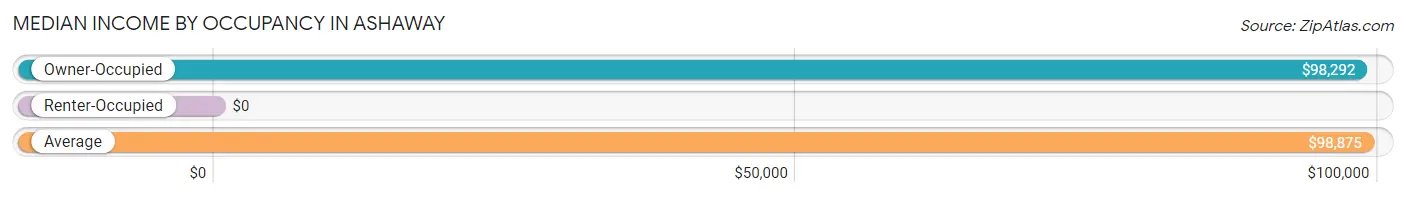
| Occupancy Type | # Households | Median Income |
| Owner-Occupied | 331 (62.6%) | $98,292 |
| Renter-Occupied | 198 (37.4%) | $0 |
| Average | 529 (100.0%) | $98,875 |
Occupancy by Householder Income Bracket in Ashaway
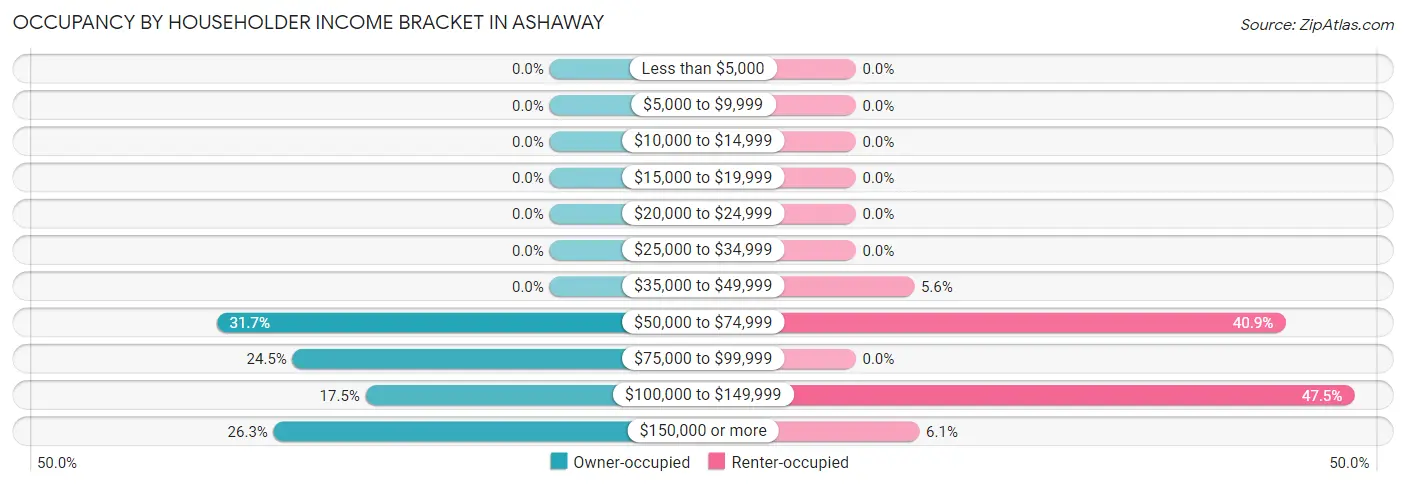
| Income Bracket | Owner-occupied | Renter-occupied |
| Less than $5,000 | 0 (0.0%) | 0 (0.0%) |
| $5,000 to $9,999 | 0 (0.0%) | 0 (0.0%) |
| $10,000 to $14,999 | 0 (0.0%) | 0 (0.0%) |
| $15,000 to $19,999 | 0 (0.0%) | 0 (0.0%) |
| $20,000 to $24,999 | 0 (0.0%) | 0 (0.0%) |
| $25,000 to $34,999 | 0 (0.0%) | 0 (0.0%) |
| $35,000 to $49,999 | 0 (0.0%) | 11 (5.6%) |
| $50,000 to $74,999 | 105 (31.7%) | 81 (40.9%) |
| $75,000 to $99,999 | 81 (24.5%) | 0 (0.0%) |
| $100,000 to $149,999 | 58 (17.5%) | 94 (47.5%) |
| $150,000 or more | 87 (26.3%) | 12 (6.1%) |
| Total | 331 (100.0%) | 198 (100.0%) |
Monthly Housing Cost Tiers in Ashaway
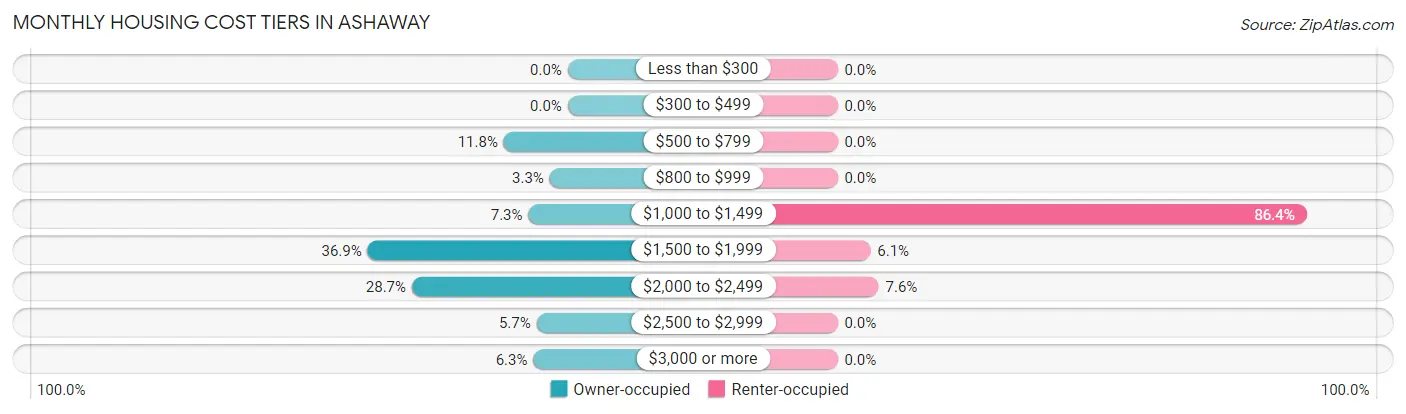
| Monthly Cost | Owner-occupied | Renter-occupied |
| Less than $300 | 0 (0.0%) | 0 (0.0%) |
| $300 to $499 | 0 (0.0%) | 0 (0.0%) |
| $500 to $799 | 39 (11.8%) | 0 (0.0%) |
| $800 to $999 | 11 (3.3%) | 0 (0.0%) |
| $1,000 to $1,499 | 24 (7.2%) | 171 (86.4%) |
| $1,500 to $1,999 | 122 (36.9%) | 12 (6.1%) |
| $2,000 to $2,499 | 95 (28.7%) | 15 (7.6%) |
| $2,500 to $2,999 | 19 (5.7%) | 0 (0.0%) |
| $3,000 or more | 21 (6.3%) | 0 (0.0%) |
| Total | 331 (100.0%) | 198 (100.0%) |
Physical Housing Characteristics in Ashaway
Housing Structures in Ashaway
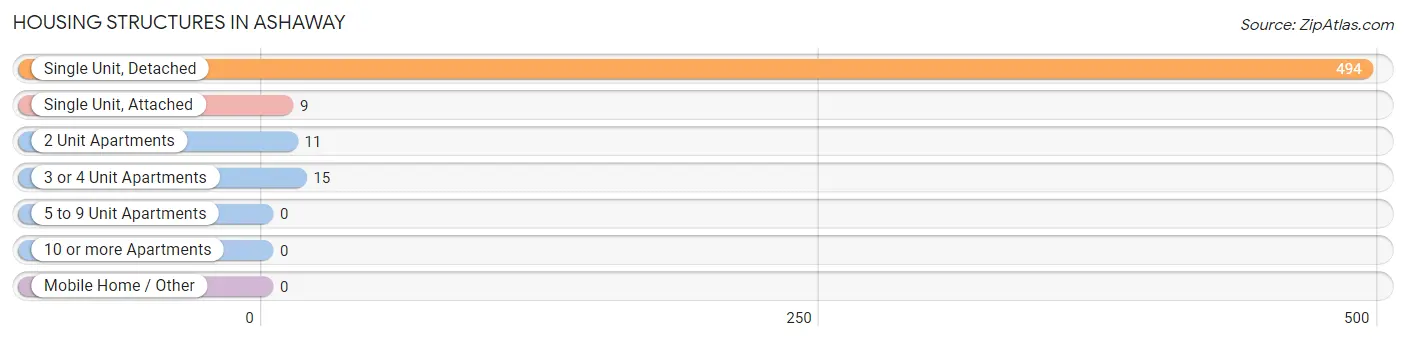
| Structure Type | # Housing Units | % Housing Units |
| Single Unit, Detached | 494 | 93.4% |
| Single Unit, Attached | 9 | 1.7% |
| 2 Unit Apartments | 11 | 2.1% |
| 3 or 4 Unit Apartments | 15 | 2.8% |
| 5 to 9 Unit Apartments | 0 | 0.0% |
| 10 or more Apartments | 0 | 0.0% |
| Mobile Home / Other | 0 | 0.0% |
| Total | 529 | 100.0% |
Housing Structures by Occupancy in Ashaway
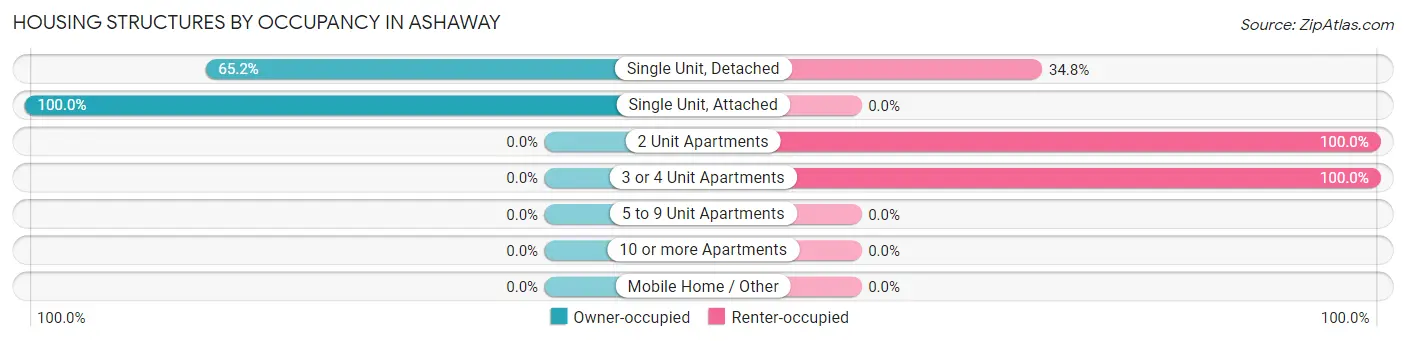
| Structure Type | Owner-occupied | Renter-occupied |
| Single Unit, Detached | 322 (65.2%) | 172 (34.8%) |
| Single Unit, Attached | 9 (100.0%) | 0 (0.0%) |
| 2 Unit Apartments | 0 (0.0%) | 11 (100.0%) |
| 3 or 4 Unit Apartments | 0 (0.0%) | 15 (100.0%) |
| 5 to 9 Unit Apartments | 0 (0.0%) | 0 (0.0%) |
| 10 or more Apartments | 0 (0.0%) | 0 (0.0%) |
| Mobile Home / Other | 0 (0.0%) | 0 (0.0%) |
| Total | 331 (62.6%) | 198 (37.4%) |
Housing Structures by Number of Rooms in Ashaway
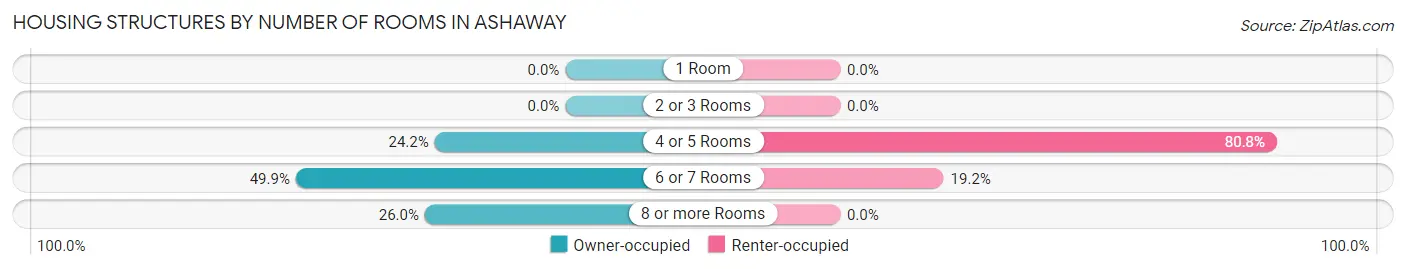
| Number of Rooms | Owner-occupied | Renter-occupied |
| 1 Room | 0 (0.0%) | 0 (0.0%) |
| 2 or 3 Rooms | 0 (0.0%) | 0 (0.0%) |
| 4 or 5 Rooms | 80 (24.2%) | 160 (80.8%) |
| 6 or 7 Rooms | 165 (49.8%) | 38 (19.2%) |
| 8 or more Rooms | 86 (26.0%) | 0 (0.0%) |
| Total | 331 (100.0%) | 198 (100.0%) |
Housing Structure by Heating Type in Ashaway
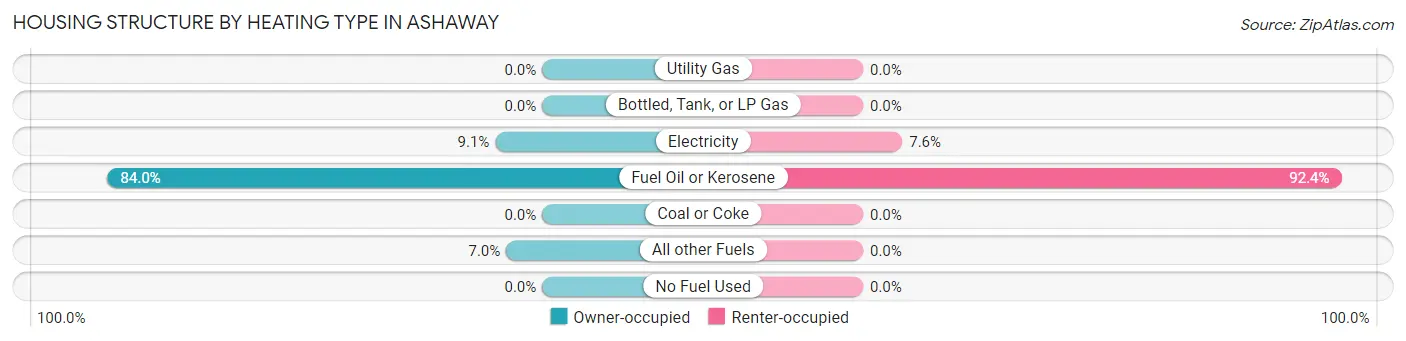
| Heating Type | Owner-occupied | Renter-occupied |
| Utility Gas | 0 (0.0%) | 0 (0.0%) |
| Bottled, Tank, or LP Gas | 0 (0.0%) | 0 (0.0%) |
| Electricity | 30 (9.1%) | 15 (7.6%) |
| Fuel Oil or Kerosene | 278 (84.0%) | 183 (92.4%) |
| Coal or Coke | 0 (0.0%) | 0 (0.0%) |
| All other Fuels | 23 (7.0%) | 0 (0.0%) |
| No Fuel Used | 0 (0.0%) | 0 (0.0%) |
| Total | 331 (100.0%) | 198 (100.0%) |
Household Vehicle Usage in Ashaway
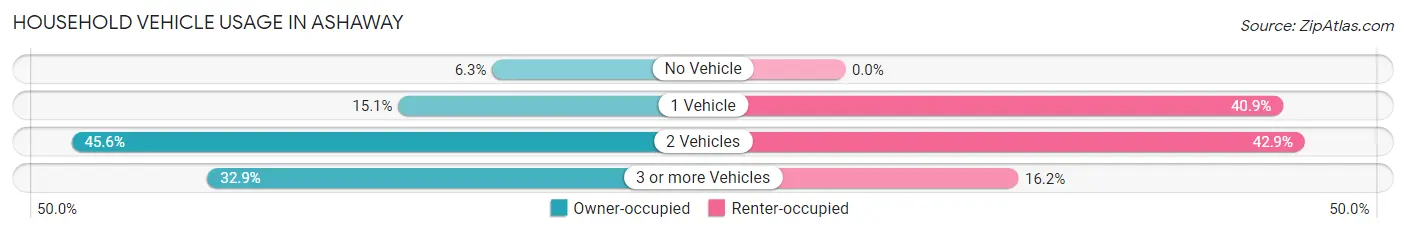
| Vehicles per Household | Owner-occupied | Renter-occupied |
| No Vehicle | 21 (6.3%) | 0 (0.0%) |
| 1 Vehicle | 50 (15.1%) | 81 (40.9%) |
| 2 Vehicles | 151 (45.6%) | 85 (42.9%) |
| 3 or more Vehicles | 109 (32.9%) | 32 (16.2%) |
| Total | 331 (100.0%) | 198 (100.0%) |
Real Estate & Mortgages in Ashaway
Real Estate and Mortgage Overview in Ashaway
| Characteristic | Without Mortgage | With Mortgage |
| Housing Units | 50 | 281 |
| Median Property Value | $334,200 | $280,000 |
| Median Household Income | - | - |
| Monthly Housing Costs | $693 | $21 |
| Real Estate Taxes | $4,167 | $0 |
Property Value by Mortgage Status in Ashaway
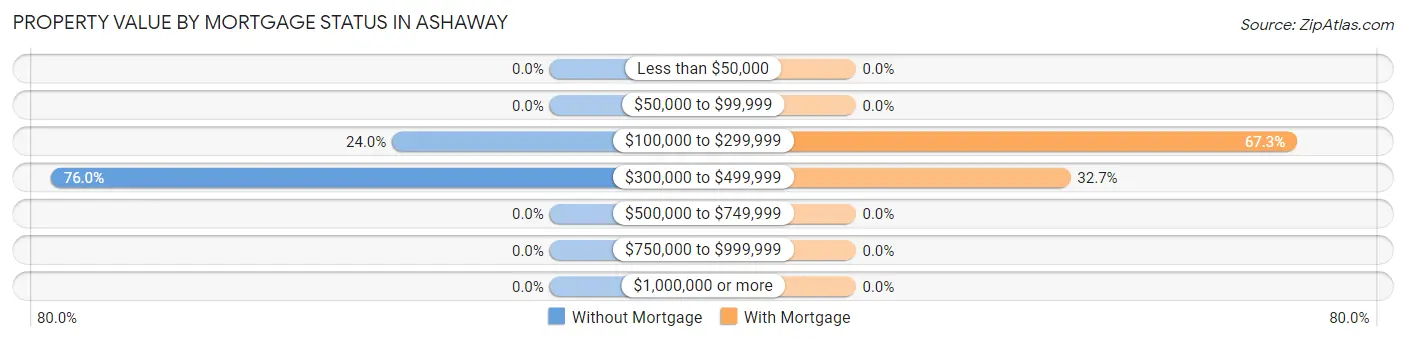
| Property Value | Without Mortgage | With Mortgage |
| Less than $50,000 | 0 (0.0%) | 0 (0.0%) |
| $50,000 to $99,999 | 0 (0.0%) | 0 (0.0%) |
| $100,000 to $299,999 | 12 (24.0%) | 189 (67.3%) |
| $300,000 to $499,999 | 38 (76.0%) | 92 (32.7%) |
| $500,000 to $749,999 | 0 (0.0%) | 0 (0.0%) |
| $750,000 to $999,999 | 0 (0.0%) | 0 (0.0%) |
| $1,000,000 or more | 0 (0.0%) | 0 (0.0%) |
| Total | 50 (100.0%) | 281 (100.0%) |
Household Income by Mortgage Status in Ashaway
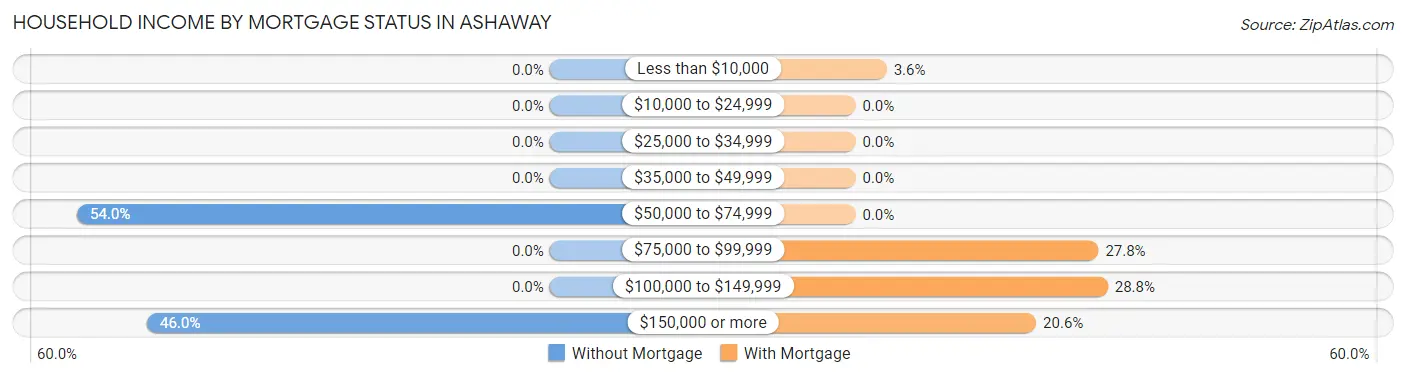
| Household Income | Without Mortgage | With Mortgage |
| Less than $10,000 | 0 (0.0%) | 10 (3.6%) |
| $10,000 to $24,999 | 0 (0.0%) | 0 (0.0%) |
| $25,000 to $34,999 | 0 (0.0%) | 0 (0.0%) |
| $35,000 to $49,999 | 0 (0.0%) | 0 (0.0%) |
| $50,000 to $74,999 | 27 (54.0%) | 0 (0.0%) |
| $75,000 to $99,999 | 0 (0.0%) | 78 (27.8%) |
| $100,000 to $149,999 | 0 (0.0%) | 81 (28.8%) |
| $150,000 or more | 23 (46.0%) | 58 (20.6%) |
| Total | 50 (100.0%) | 281 (100.0%) |
Property Value to Household Income Ratio in Ashaway
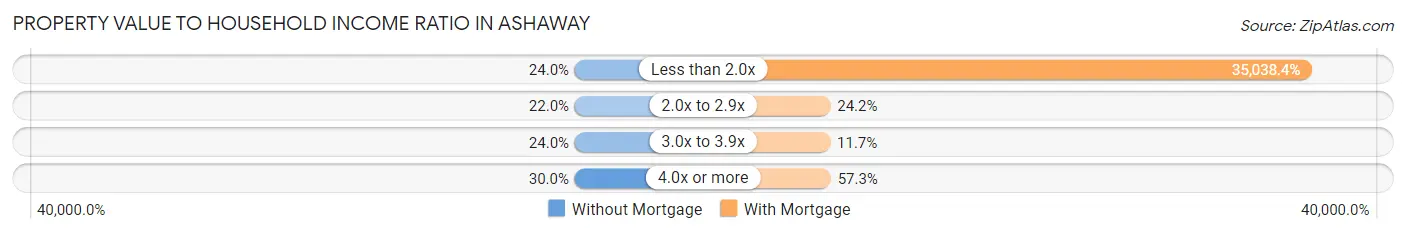
| Value-to-Income Ratio | Without Mortgage | With Mortgage |
| Less than 2.0x | 12 (24.0%) | 98,458 (35,038.4%) |
| 2.0x to 2.9x | 11 (22.0%) | 68 (24.2%) |
| 3.0x to 3.9x | 12 (24.0%) | 33 (11.7%) |
| 4.0x or more | 15 (30.0%) | 161 (57.3%) |
| Total | 50 (100.0%) | 281 (100.0%) |
Real Estate Taxes by Mortgage Status in Ashaway
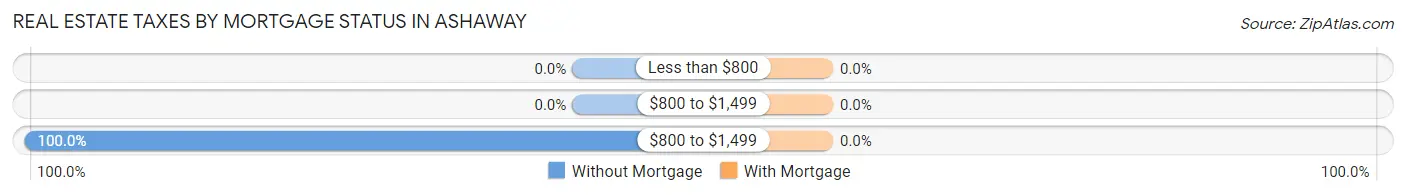
| Property Taxes | Without Mortgage | With Mortgage |
| Less than $800 | 0 (0.0%) | 0 (0.0%) |
| $800 to $1,499 | 0 (0.0%) | 0 (0.0%) |
| $800 to $1,499 | 50 (100.0%) | 0 (0.0%) |
| Total | 50 (100.0%) | 281 (100.0%) |
Health & Disability in Ashaway
Health Insurance Coverage by Age in Ashaway
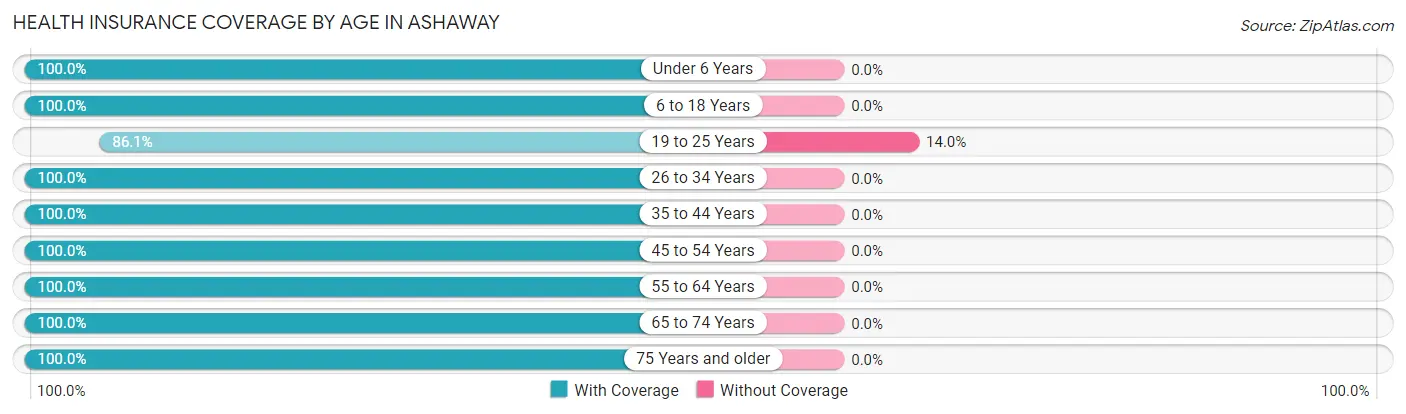
| Age Bracket | With Coverage | Without Coverage |
| Under 6 Years | 100 (100.0%) | 0 (0.0%) |
| 6 to 18 Years | 393 (100.0%) | 0 (0.0%) |
| 19 to 25 Years | 222 (86.1%) | 36 (14.0%) |
| 26 to 34 Years | 89 (100.0%) | 0 (0.0%) |
| 35 to 44 Years | 225 (100.0%) | 0 (0.0%) |
| 45 to 54 Years | 226 (100.0%) | 0 (0.0%) |
| 55 to 64 Years | 281 (100.0%) | 0 (0.0%) |
| 65 to 74 Years | 43 (100.0%) | 0 (0.0%) |
| 75 Years and older | 47 (100.0%) | 0 (0.0%) |
| Total | 1,626 (97.8%) | 36 (2.2%) |
Health Insurance Coverage by Citizenship Status in Ashaway
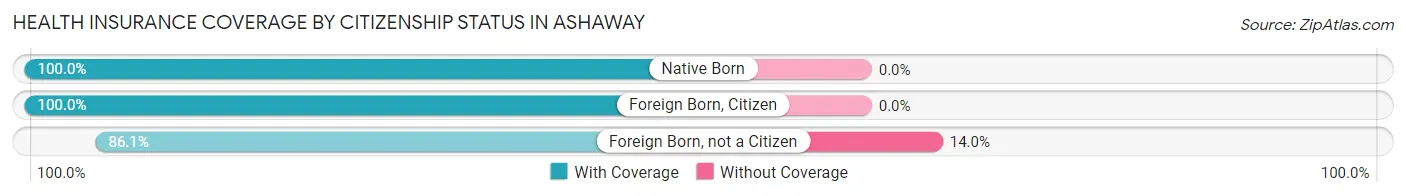
| Citizenship Status | With Coverage | Without Coverage |
| Native Born | 100 (100.0%) | 0 (0.0%) |
| Foreign Born, Citizen | 393 (100.0%) | 0 (0.0%) |
| Foreign Born, not a Citizen | 222 (86.1%) | 36 (14.0%) |
Health Insurance Coverage by Household Income in Ashaway
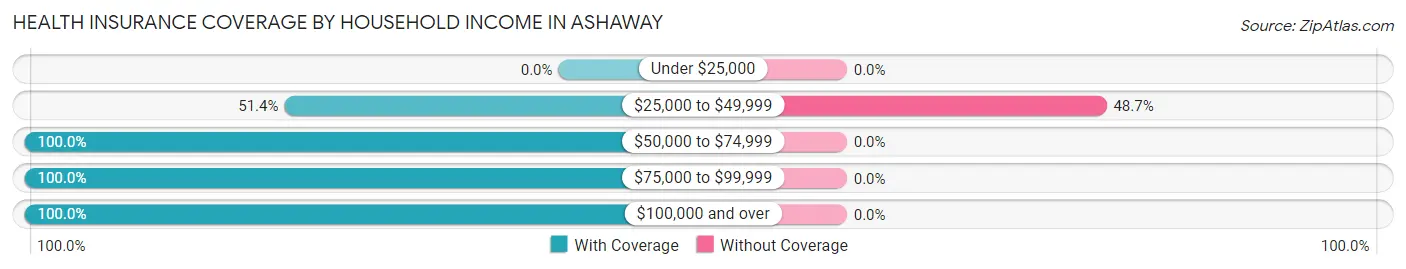
| Household Income | With Coverage | Without Coverage |
| Under $25,000 | 0 (0.0%) | 0 (0.0%) |
| $25,000 to $49,999 | 38 (51.3%) | 36 (48.6%) |
| $50,000 to $74,999 | 398 (100.0%) | 0 (0.0%) |
| $75,000 to $99,999 | 254 (100.0%) | 0 (0.0%) |
| $100,000 and over | 936 (100.0%) | 0 (0.0%) |
Public vs Private Health Insurance Coverage by Age in Ashaway
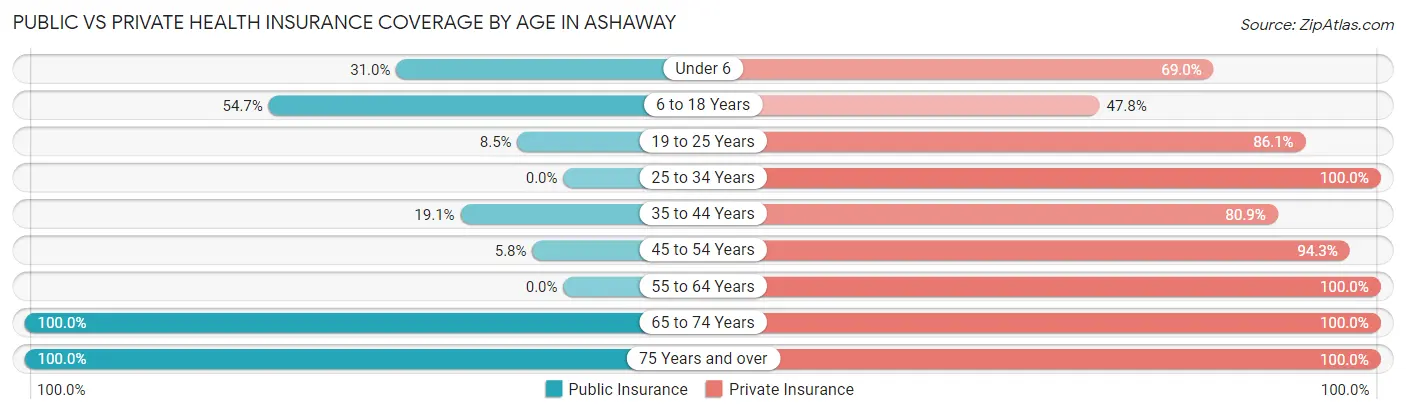
| Age Bracket | Public Insurance | Private Insurance |
| Under 6 | 31 (31.0%) | 69 (69.0%) |
| 6 to 18 Years | 215 (54.7%) | 188 (47.8%) |
| 19 to 25 Years | 22 (8.5%) | 222 (86.1%) |
| 25 to 34 Years | 0 (0.0%) | 89 (100.0%) |
| 35 to 44 Years | 43 (19.1%) | 182 (80.9%) |
| 45 to 54 Years | 13 (5.8%) | 213 (94.3%) |
| 55 to 64 Years | 0 (0.0%) | 281 (100.0%) |
| 65 to 74 Years | 43 (100.0%) | 43 (100.0%) |
| 75 Years and over | 47 (100.0%) | 47 (100.0%) |
| Total | 414 (24.9%) | 1,334 (80.3%) |
Disability Status by Sex by Age in Ashaway
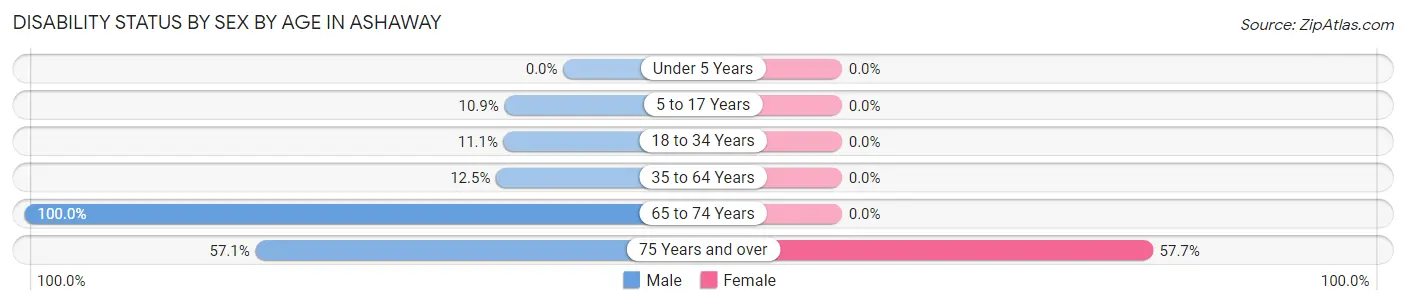
| Age Bracket | Male | Female |
| Under 5 Years | 0 (0.0%) | 0 (0.0%) |
| 5 to 17 Years | 12 (10.9%) | 0 (0.0%) |
| 18 to 34 Years | 22 (11.1%) | 0 (0.0%) |
| 35 to 64 Years | 42 (12.5%) | 0 (0.0%) |
| 65 to 74 Years | 43 (100.0%) | 0 (0.0%) |
| 75 Years and over | 12 (57.1%) | 15 (57.7%) |
Disability Class by Sex by Age in Ashaway
Disability Class: Hearing Difficulty
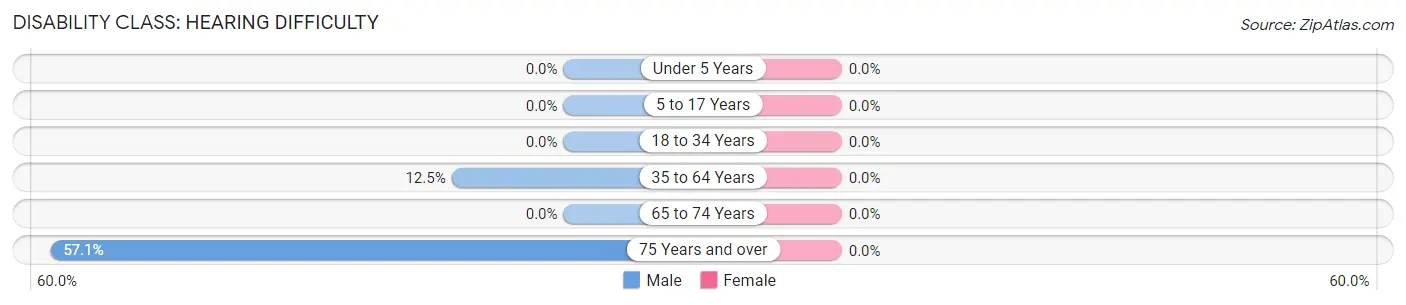
| Age Bracket | Male | Female |
| Under 5 Years | 0 (0.0%) | 0 (0.0%) |
| 5 to 17 Years | 0 (0.0%) | 0 (0.0%) |
| 18 to 34 Years | 0 (0.0%) | 0 (0.0%) |
| 35 to 64 Years | 42 (12.5%) | 0 (0.0%) |
| 65 to 74 Years | 0 (0.0%) | 0 (0.0%) |
| 75 Years and over | 12 (57.1%) | 0 (0.0%) |
Disability Class: Vision Difficulty
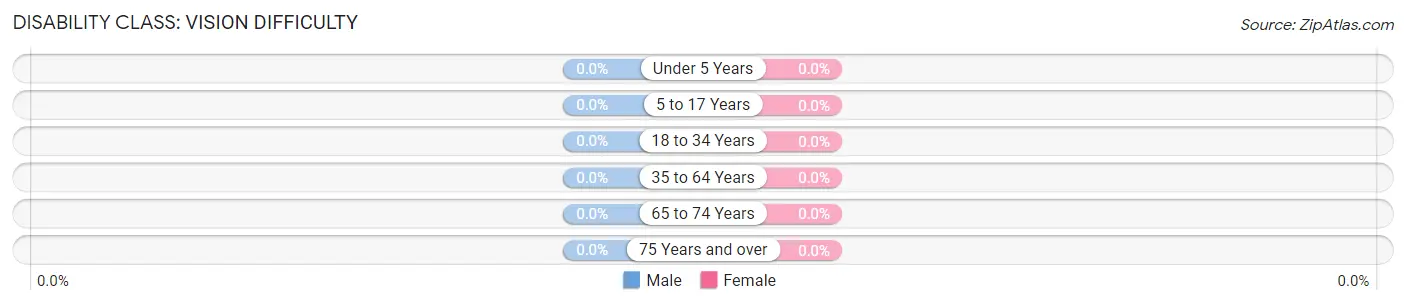
| Age Bracket | Male | Female |
| Under 5 Years | 0 (0.0%) | 0 (0.0%) |
| 5 to 17 Years | 0 (0.0%) | 0 (0.0%) |
| 18 to 34 Years | 0 (0.0%) | 0 (0.0%) |
| 35 to 64 Years | 0 (0.0%) | 0 (0.0%) |
| 65 to 74 Years | 0 (0.0%) | 0 (0.0%) |
| 75 Years and over | 0 (0.0%) | 0 (0.0%) |
Disability Class: Cognitive Difficulty
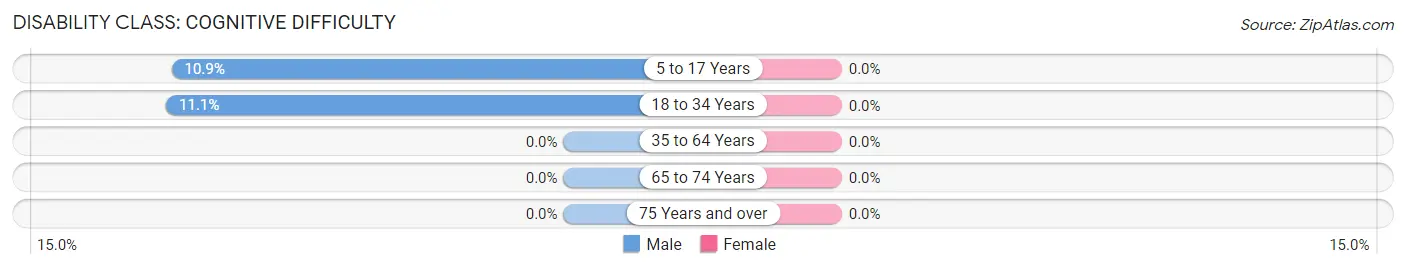
| Age Bracket | Male | Female |
| 5 to 17 Years | 12 (10.9%) | 0 (0.0%) |
| 18 to 34 Years | 22 (11.1%) | 0 (0.0%) |
| 35 to 64 Years | 0 (0.0%) | 0 (0.0%) |
| 65 to 74 Years | 0 (0.0%) | 0 (0.0%) |
| 75 Years and over | 0 (0.0%) | 0 (0.0%) |
Disability Class: Ambulatory Difficulty
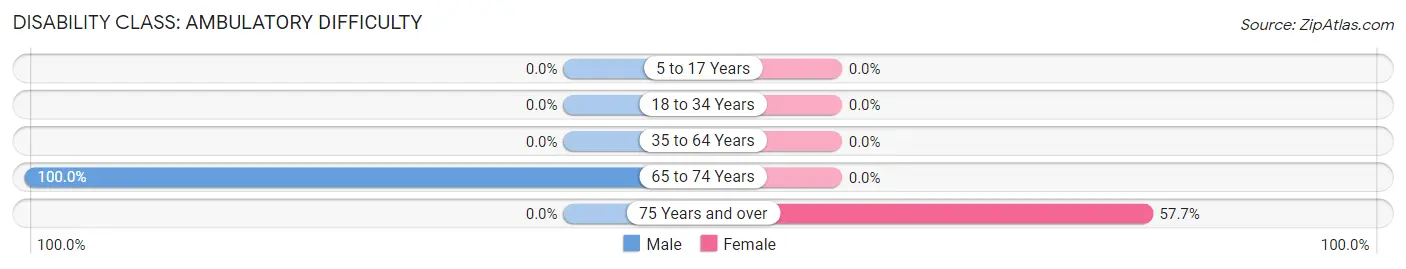
| Age Bracket | Male | Female |
| 5 to 17 Years | 0 (0.0%) | 0 (0.0%) |
| 18 to 34 Years | 0 (0.0%) | 0 (0.0%) |
| 35 to 64 Years | 0 (0.0%) | 0 (0.0%) |
| 65 to 74 Years | 43 (100.0%) | 0 (0.0%) |
| 75 Years and over | 0 (0.0%) | 15 (57.7%) |
Disability Class: Self-Care Difficulty
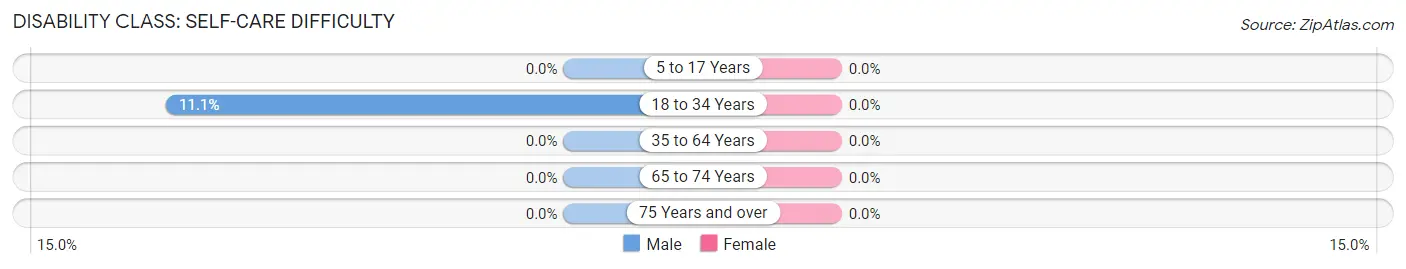
| Age Bracket | Male | Female |
| 5 to 17 Years | 0 (0.0%) | 0 (0.0%) |
| 18 to 34 Years | 22 (11.1%) | 0 (0.0%) |
| 35 to 64 Years | 0 (0.0%) | 0 (0.0%) |
| 65 to 74 Years | 0 (0.0%) | 0 (0.0%) |
| 75 Years and over | 0 (0.0%) | 0 (0.0%) |
Technology Access in Ashaway
Computing Device Access in Ashaway
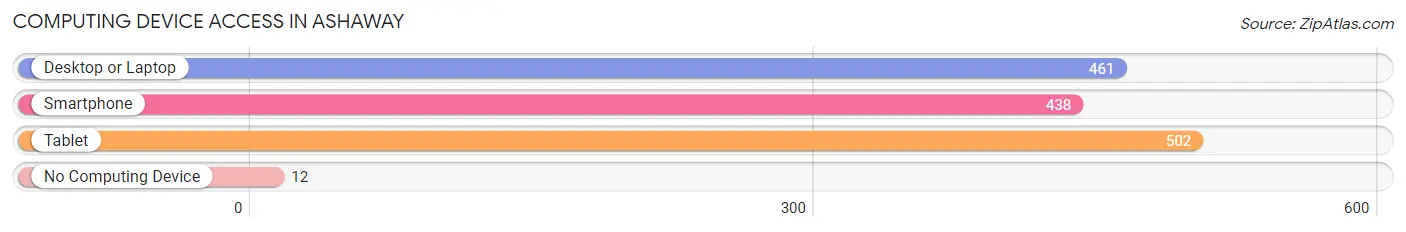
| Device Type | # Households | % Households |
| Desktop or Laptop | 461 | 87.2% |
| Smartphone | 438 | 82.8% |
| Tablet | 502 | 94.9% |
| No Computing Device | 12 | 2.3% |
| Total | 529 | 100.0% |
Internet Access in Ashaway
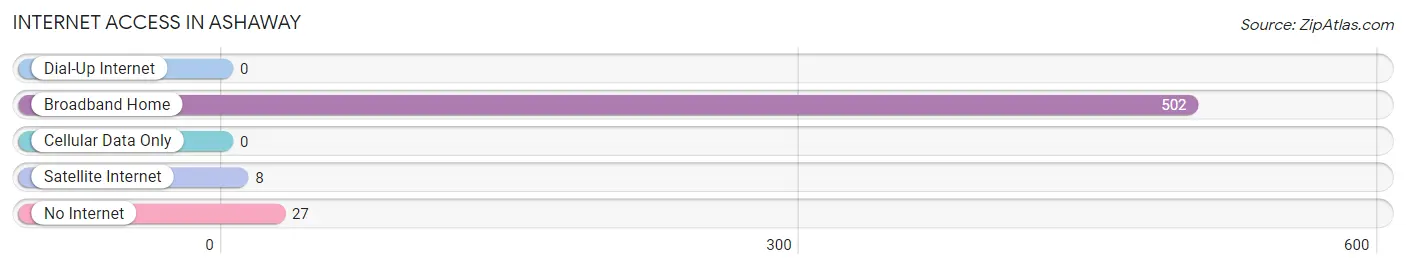
| Internet Type | # Households | % Households |
| Dial-Up Internet | 0 | 0.0% |
| Broadband Home | 502 | 94.9% |
| Cellular Data Only | 0 | 0.0% |
| Satellite Internet | 8 | 1.5% |
| No Internet | 27 | 5.1% |
| Total | 529 | 100.0% |
Ashaway Summary
Ashaway, Rhode Island is a small village located in the southwestern corner of the state. It is situated in the town of Hopkinton, and is bordered by the Pawcatuck River to the east and the Wood River to the west. The village is home to approximately 1,000 people, and is a popular destination for tourists and outdoor enthusiasts alike.
History
The area that is now Ashaway was first settled in the early 1700s by English colonists. The village was originally known as “Ashaway Landing”, and was a major port for the shipping of goods and supplies to and from the nearby towns of Westerly and Stonington. In 1809, the village was officially incorporated as the town of Ashaway.
The village was an important center of industry in the 19th century, with several mills and factories located in the area. The most prominent of these was the Ashaway Manufacturing Company, which was founded in 1824 and produced a variety of textiles, including woolen and cotton fabrics. The company was a major employer in the area, and its products were shipped all over the world.
The village was also home to a number of other businesses, including a blacksmith shop, a tannery, a grist mill, and a sawmill. In the late 19th century, the village was home to a number of summer resorts, which attracted visitors from all over the country.
Geography
Ashaway is located in the southwestern corner of Rhode Island, and is bordered by the Pawcatuck River to the east and the Wood River to the west. The village is situated on a hill overlooking the Pawcatuck River, and is surrounded by rolling hills and forests. The village is located approximately 10 miles from the Connecticut border, and is about an hour’s drive from Providence and Boston.
The village is home to several parks and recreational areas, including the Ashaway River State Park, which offers camping, fishing, and hiking opportunities. The village is also home to a number of historic sites, including the Ashaway Free Library, which was built in 1876, and the Ashaway Historic District, which is listed on the National Register of Historic Places.
Economy
The economy of Ashaway is largely based on tourism and outdoor recreation. The village is home to several bed and breakfasts, as well as a number of restaurants and shops. The village is also home to a number of small businesses, including a hardware store, a grocery store, and a pharmacy.
The village is also home to a number of manufacturing companies, including the Ashaway Manufacturing Company, which produces a variety of textiles. The village is also home to a number of small farms, which produce a variety of fruits and vegetables.
Demographics
As of the 2010 census, the population of Ashaway was 1,000. The racial makeup of the village was 97.2% White, 0.7% African American, 0.3% Native American, 0.3% Asian, and 1.5% from two or more races. The median household income was $50,000, and the median age was 44.
The village is home to a number of churches, including the Ashaway Congregational Church, which was founded in 1809. The village is also home to a number of schools, including the Ashaway Elementary School, which serves students in grades K-6.
Conclusion
Ashaway, Rhode Island is a small village located in the southwestern corner of the state. It is home to approximately 1,000 people, and is a popular destination for tourists and outdoor enthusiasts alike. The village is home to a number of historic sites, parks, and recreational areas, as well as a number of small businesses and manufacturing companies. The village is also home to a number of churches and schools, and has a median household income of $50,000.
Common Questions
What is Per Capita Income in Ashaway?
Per Capita income in Ashaway is $36,954.
What is the Median Family Income in Ashaway?
Median Family Income in Ashaway is $96,756.
What is the Median Household income in Ashaway?
Median Household Income in Ashaway is $98,875.
What is Income or Wage Gap in Ashaway?
Income or Wage Gap in Ashaway is 0.5%.
Women in Ashaway earn 99.5 cents for every dollar earned by a man.
What is Inequality or Gini Index in Ashaway?
Inequality or Gini Index in Ashaway is 0.27.
What is the Total Population of Ashaway?
Total Population of Ashaway is 1,662.
What is the Total Male Population of Ashaway?
Total Male Population of Ashaway is 741.
What is the Total Female Population of Ashaway?
Total Female Population of Ashaway is 921.
What is the Ratio of Males per 100 Females in Ashaway?
There are 80.46 Males per 100 Females in Ashaway.
What is the Ratio of Females per 100 Males in Ashaway?
There are 124.29 Females per 100 Males in Ashaway.
What is the Median Population Age in Ashaway?
Median Population Age in Ashaway is 34.1 Years.
What is the Average Family Size in Ashaway
Average Family Size in Ashaway is 3.2 People.
What is the Average Household Size in Ashaway
Average Household Size in Ashaway is 3.1 People.
How Large is the Labor Force in Ashaway?
There are 1,031 People in the Labor Forcein in Ashaway.
What is the Percentage of People in the Labor Force in Ashaway?
85.2% of People are in the Labor Force in Ashaway.