Zip Codes with the Highest Percentage of Population Employed in Transportation & Warehousing in Scranton, PA
RELATED REPORTS & OPTIONS
Transportation & Warehousing
Scranton
Compare Zip Codes
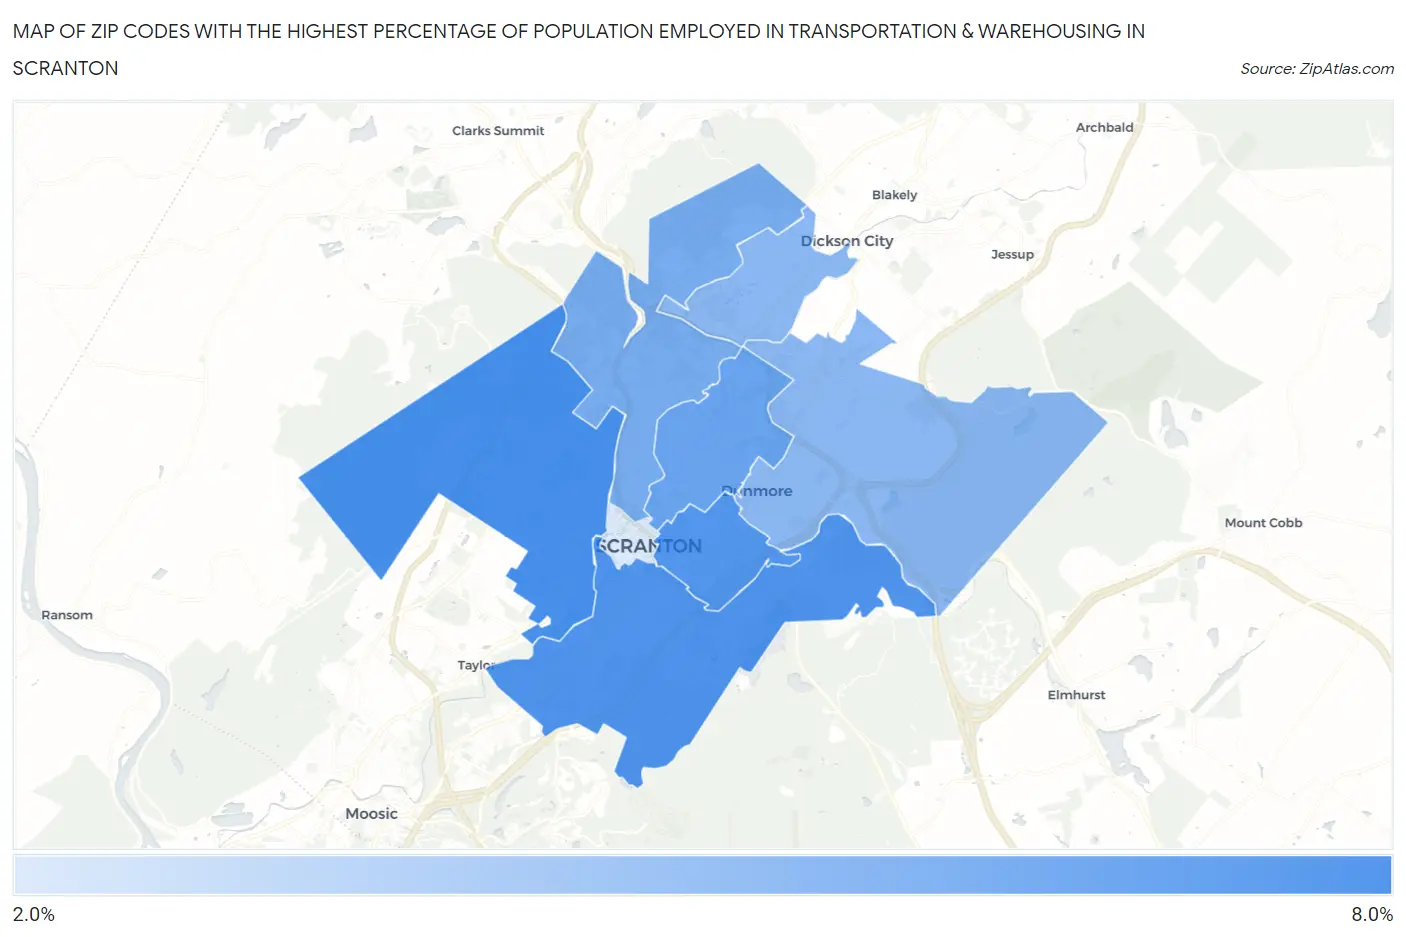
Map of Zip Codes with the Highest Percentage of Population Employed in Transportation & Warehousing in Scranton
2.4%
6.6%
Zip Codes with the Highest Percentage of Population Employed in Transportation & Warehousing in Scranton, PA
| Zip Code | % Employed | vs State | vs National | |
| 1. | 18504 | 6.6% | 5.0%(+1.64)#499 | 4.9%(+1.68)#7,321 |
| 2. | 18505 | 6.4% | 5.0%(+1.45)#532 | 4.9%(+1.50)#7,698 |
| 3. | 18510 | 6.3% | 5.0%(+1.34)#558 | 4.9%(+1.38)#7,982 |
| 4. | 18509 | 5.6% | 5.0%(+0.643)#660 | 4.9%(+0.688)#9,847 |
| 5. | 18508 | 5.3% | 5.0%(+0.279)#747 | 4.9%(+0.324)#11,000 |
| 6. | 18512 | 4.7% | 5.0%(-0.277)#852 | 4.9%(-0.232)#12,984 |
| 7. | 18519 | 4.7% | 5.0%(-0.289)#853 | 4.9%(-0.244)#13,018 |
| 8. | 18503 | 2.4% | 5.0%(-2.56)#1,329 | 4.9%(-2.52)#22,713 |
1
Common Questions
What are the Top 5 Zip Codes with the Highest Percentage of Population Employed in Transportation & Warehousing in Scranton, PA?
Top 5 Zip Codes with the Highest Percentage of Population Employed in Transportation & Warehousing in Scranton, PA are:
What zip code has the Highest Percentage of Population Employed in Transportation & Warehousing in Scranton, PA?
18504 has the Highest Percentage of Population Employed in Transportation & Warehousing in Scranton, PA with 6.6%.
What is the Percentage of Population Employed in Transportation & Warehousing in Scranton, PA?
Percentage of Population Employed in Transportation & Warehousing in Scranton is 6.0%.
What is the Percentage of Population Employed in Transportation & Warehousing in Pennsylvania?
Percentage of Population Employed in Transportation & Warehousing in Pennsylvania is 5.0%.
What is the Percentage of Population Employed in Transportation & Warehousing in the United States?
Percentage of Population Employed in Transportation & Warehousing in the United States is 4.9%.