Zip Codes with the Highest Percentage of Population Employed in Professional & Scientific Services in Scranton, PA
RELATED REPORTS & OPTIONS
Professional & Scientific Services
Scranton
Compare Zip Codes
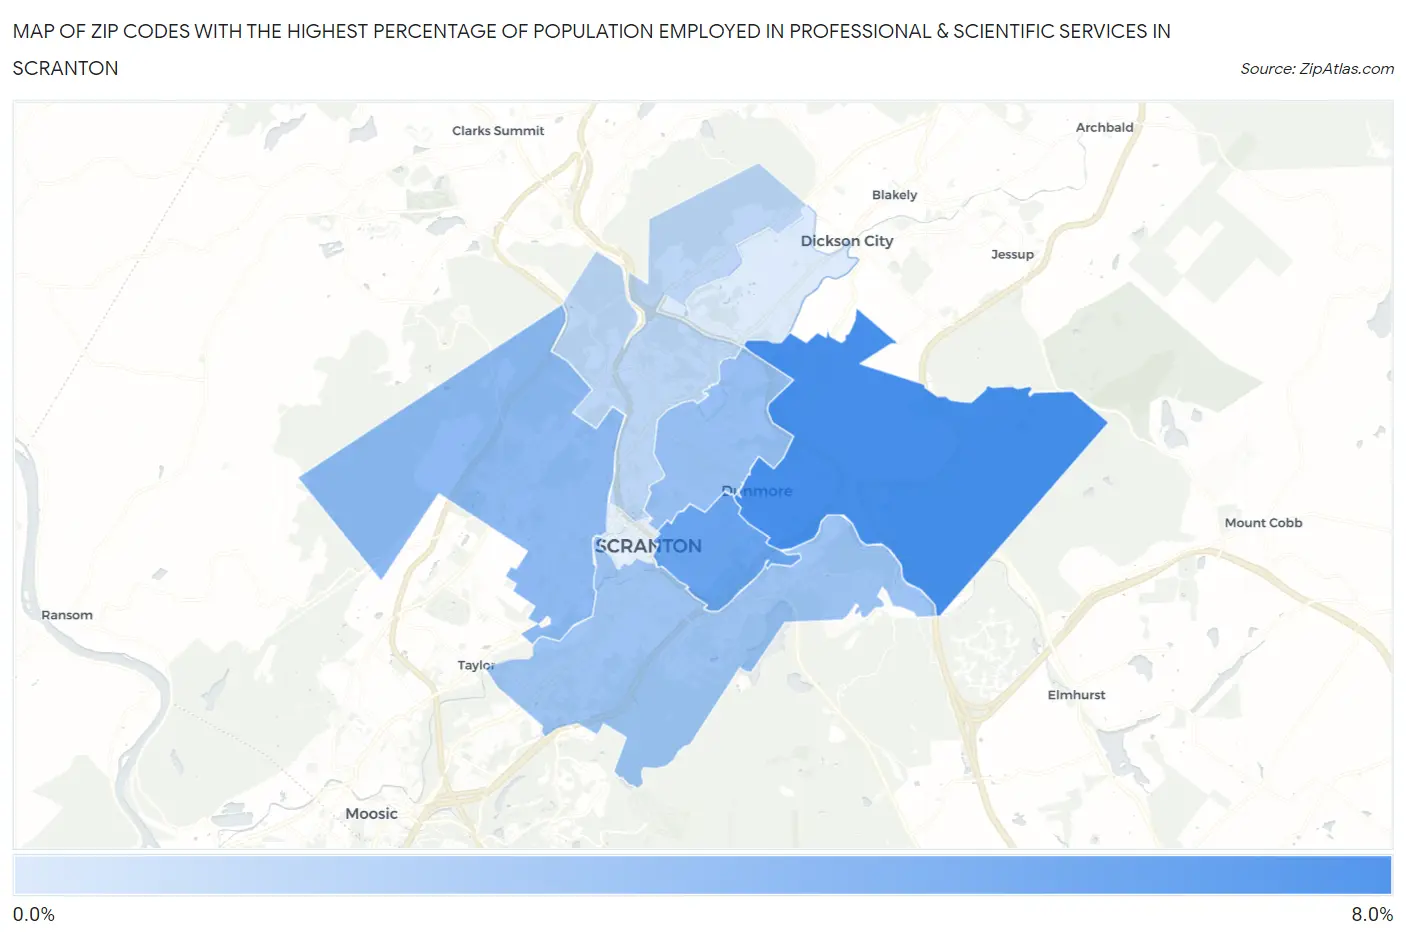
Map of Zip Codes with the Highest Percentage of Population Employed in Professional & Scientific Services in Scranton
1.5%
6.8%
Zip Codes with the Highest Percentage of Population Employed in Professional & Scientific Services in Scranton, PA
| Zip Code | % Employed | vs State | vs National | |
| 1. | 18512 | 6.8% | 7.1%(-0.362)#429 | 7.8%(-1.08)#8,535 |
| 2. | 18510 | 5.5% | 7.1%(-1.61)#584 | 7.8%(-2.33)#11,040 |
| 3. | 18504 | 4.2% | 7.1%(-2.94)#785 | 7.8%(-3.65)#14,556 |
| 4. | 18509 | 3.9% | 7.1%(-3.21)#823 | 7.8%(-3.93)#15,359 |
| 5. | 18505 | 3.7% | 7.1%(-3.45)#871 | 7.8%(-4.16)#16,098 |
| 6. | 18508 | 2.7% | 7.1%(-4.48)#1,093 | 7.8%(-5.19)#19,653 |
| 7. | 18519 | 1.5% | 7.1%(-5.62)#1,315 | 7.8%(-6.34)#23,498 |
1
Common Questions
What are the Top 5 Zip Codes with the Highest Percentage of Population Employed in Professional & Scientific Services in Scranton, PA?
Top 5 Zip Codes with the Highest Percentage of Population Employed in Professional & Scientific Services in Scranton, PA are:
What zip code has the Highest Percentage of Population Employed in Professional & Scientific Services in Scranton, PA?
18512 has the Highest Percentage of Population Employed in Professional & Scientific Services in Scranton, PA with 6.8%.
What is the Percentage of Population Employed in Professional & Scientific Services in Scranton, PA?
Percentage of Population Employed in Professional & Scientific Services in Scranton is 3.5%.
What is the Percentage of Population Employed in Professional & Scientific Services in Pennsylvania?
Percentage of Population Employed in Professional & Scientific Services in Pennsylvania is 7.1%.
What is the Percentage of Population Employed in Professional & Scientific Services in the United States?
Percentage of Population Employed in Professional & Scientific Services in the United States is 7.8%.