Zip Codes with the Highest Percentage of Population Employed in Farming, Fishing & Forestry in Scranton, PA
RELATED REPORTS & OPTIONS
Farming, Fishing & Forestry
Scranton
Compare Zip Codes
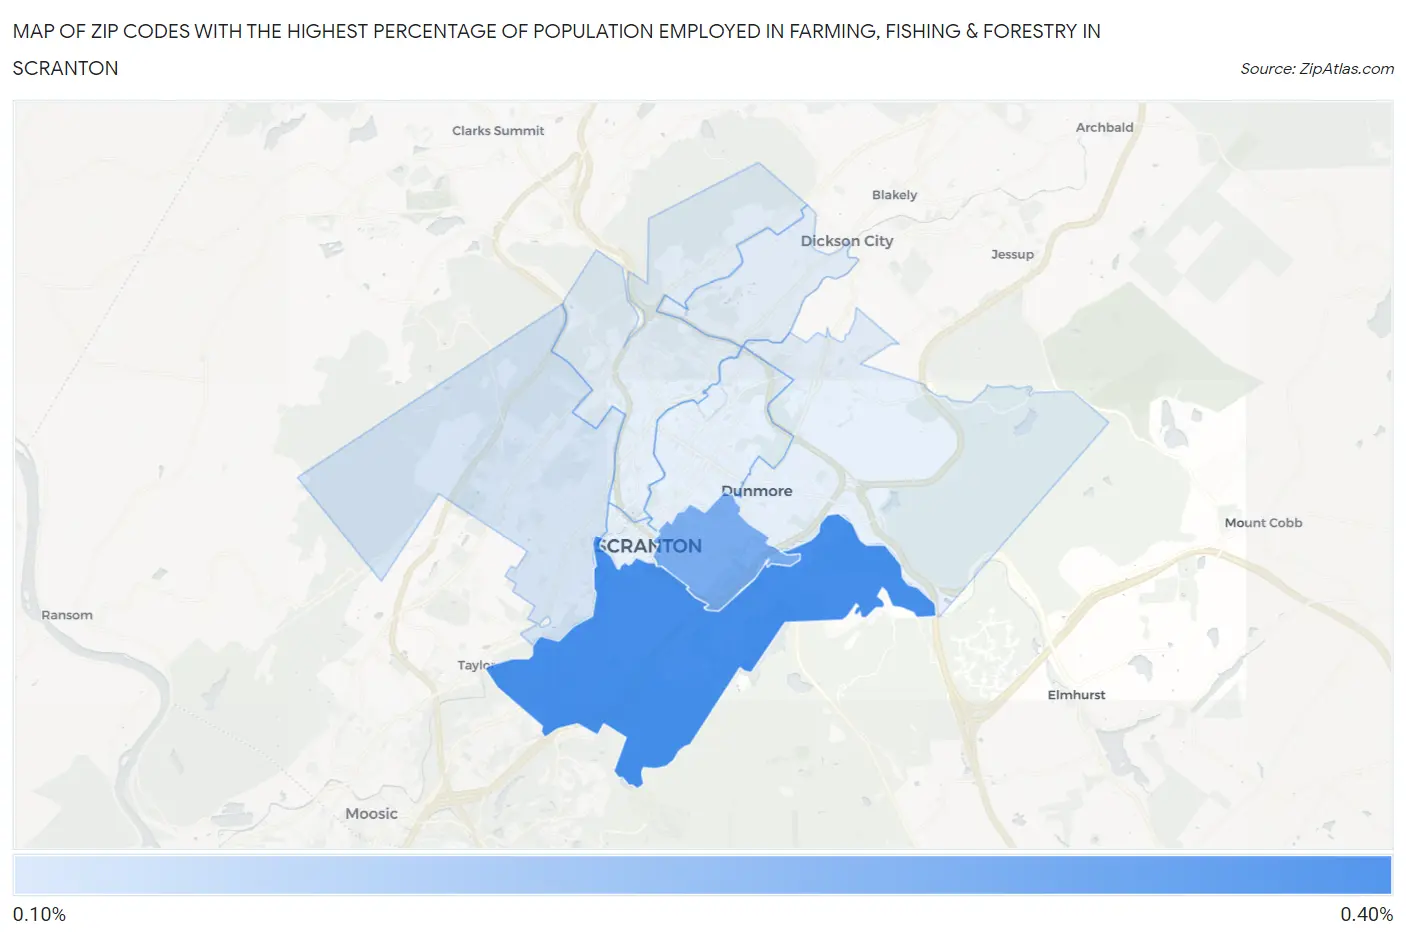
Map of Zip Codes with the Highest Percentage of Population Employed in Farming, Fishing & Forestry in Scranton
0.0%
0.40%
Zip Codes with the Highest Percentage of Population Employed in Farming, Fishing & Forestry in Scranton, PA
| Zip Code | % Employed | vs State | vs National | |
| 1. | 18505 | 0.30% | 0.41%(-0.101)#612 | 0.61%(-0.301)#14,769 |
| 2. | 18510 | 0.24% | 0.41%(-0.164)#651 | 0.61%(-0.363)#15,518 |
| 3. | 18504 | 0.12% | 0.41%(-0.289)#752 | 0.61%(-0.489)#17,485 |
1
Common Questions
What are the Top 5 Zip Codes with the Highest Percentage of Population Employed in Farming, Fishing & Forestry in Scranton, PA?
Top 5 Zip Codes with the Highest Percentage of Population Employed in Farming, Fishing & Forestry in Scranton, PA are:
What zip code has the Highest Percentage of Population Employed in Farming, Fishing & Forestry in Scranton, PA?
18505 has the Highest Percentage of Population Employed in Farming, Fishing & Forestry in Scranton, PA with 0.30%.
What is the Percentage of Population Employed in Farming, Fishing & Forestry in Scranton, PA?
Percentage of Population Employed in Farming, Fishing & Forestry in Scranton is 0.17%.
What is the Percentage of Population Employed in Farming, Fishing & Forestry in Pennsylvania?
Percentage of Population Employed in Farming, Fishing & Forestry in Pennsylvania is 0.41%.
What is the Percentage of Population Employed in Farming, Fishing & Forestry in the United States?
Percentage of Population Employed in Farming, Fishing & Forestry in the United States is 0.61%.