Zip Codes with the Highest Percentage of Population Employed in Legal Services & Support in Lorain, OH
RELATED REPORTS & OPTIONS
Legal Services & Support
Lorain
Compare Zip Codes
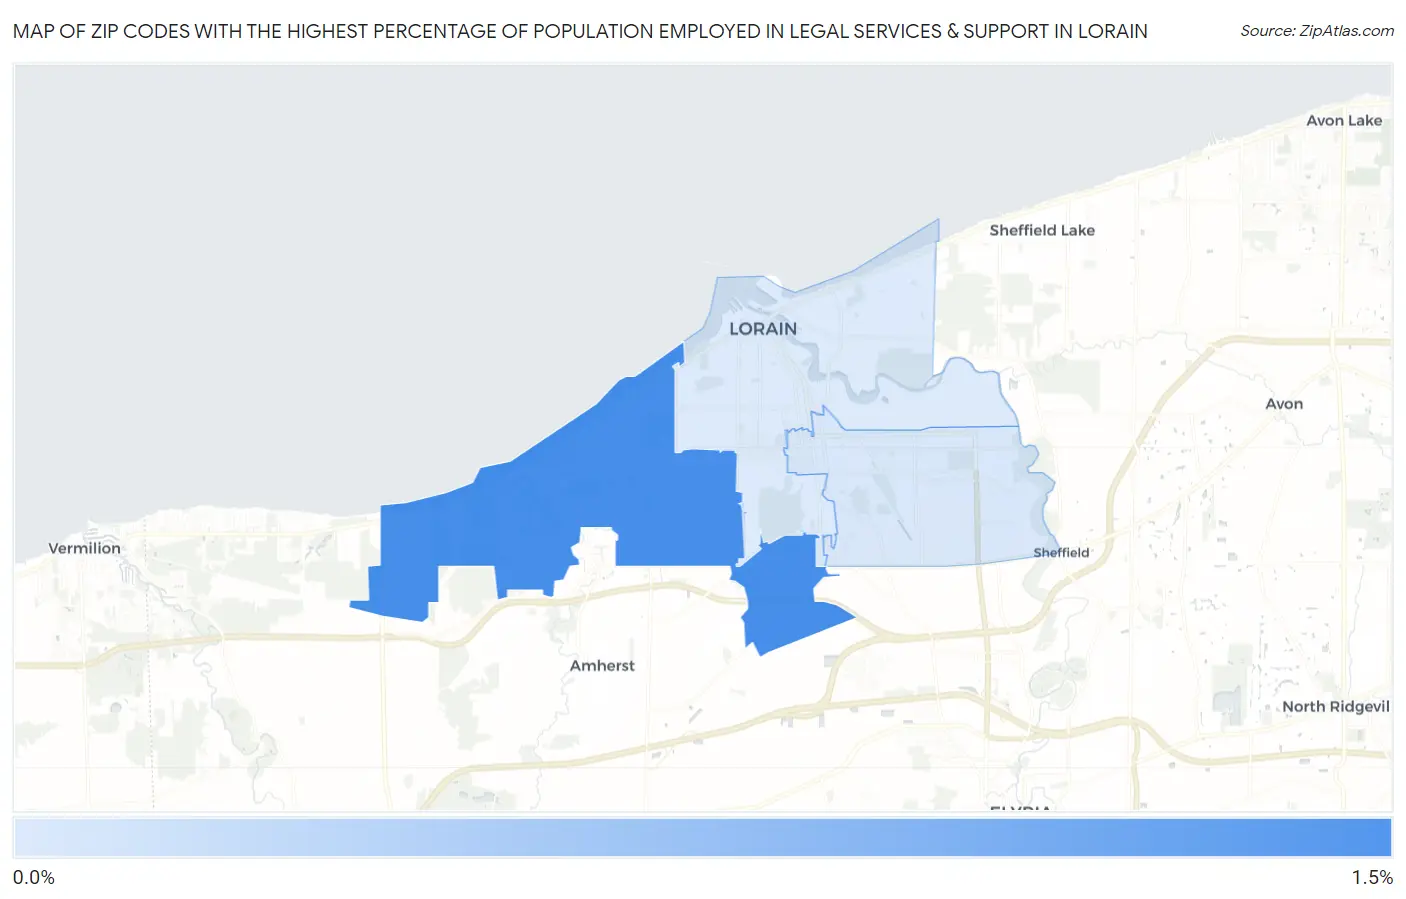
Map of Zip Codes with the Highest Percentage of Population Employed in Legal Services & Support in Lorain
0.057%
1.4%
Zip Codes with the Highest Percentage of Population Employed in Legal Services & Support in Lorain, OH
| Zip Code | % Employed | vs State | vs National | |
| 1. | 44053 | 1.4% | 0.92%(+0.437)#157 | 1.2%(+0.178)#5,647 |
| 2. | 44055 | 0.097% | 0.92%(-0.827)#626 | 1.2%(-1.09)#17,147 |
| 3. | 44052 | 0.057% | 0.92%(-0.868)#641 | 1.2%(-1.13)#17,404 |
1
Common Questions
What are the Top Zip Codes with the Highest Percentage of Population Employed in Legal Services & Support in Lorain, OH?
Top Zip Codes with the Highest Percentage of Population Employed in Legal Services & Support in Lorain, OH are:
What zip code has the Highest Percentage of Population Employed in Legal Services & Support in Lorain, OH?
44053 has the Highest Percentage of Population Employed in Legal Services & Support in Lorain, OH with 1.4%.
What is the Percentage of Population Employed in Legal Services & Support in Lorain, OH?
Percentage of Population Employed in Legal Services & Support in Lorain is 0.56%.
What is the Percentage of Population Employed in Legal Services & Support in Ohio?
Percentage of Population Employed in Legal Services & Support in Ohio is 0.92%.
What is the Percentage of Population Employed in Legal Services & Support in the United States?
Percentage of Population Employed in Legal Services & Support in the United States is 1.2%.