Zip Codes with the Highest Percentage of Population Employed in Legal Services & Support in Cincinnati, OH
RELATED REPORTS & OPTIONS
Legal Services & Support
Cincinnati
Compare Zip Codes
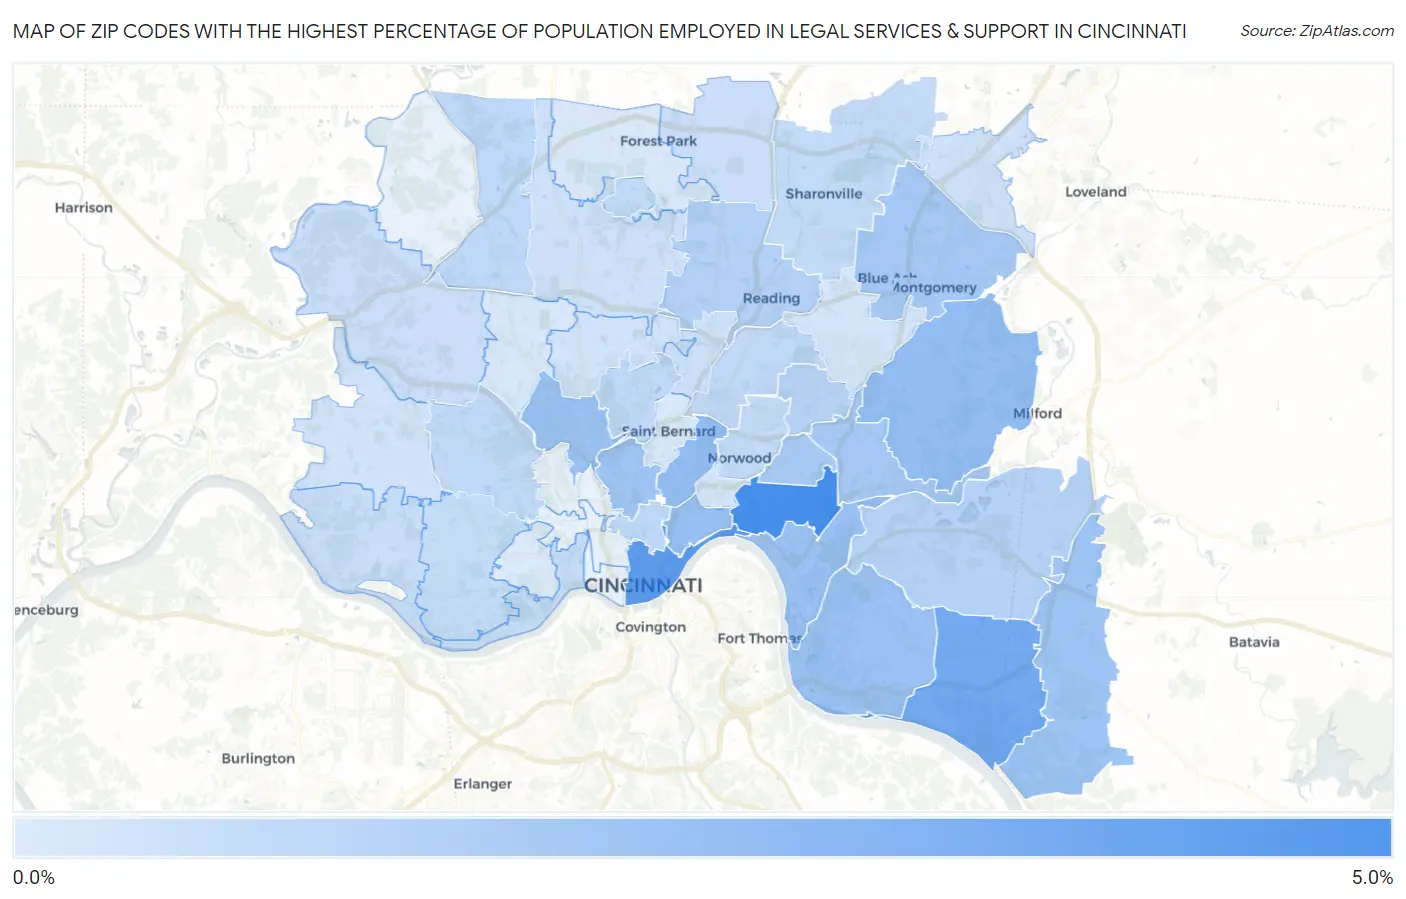
Map of Zip Codes with the Highest Percentage of Population Employed in Legal Services & Support in Cincinnati
0.083%
4.0%
Zip Codes with the Highest Percentage of Population Employed in Legal Services & Support in Cincinnati, OH
| Zip Code | % Employed | vs State | vs National | |
| 1. | 45208 | 4.0% | 0.92%(+3.11)#20 | 1.2%(+2.85)#1,108 |
| 2. | 45202 | 3.5% | 0.92%(+2.58)#30 | 1.2%(+2.32)#1,431 |
| 3. | 45255 | 2.9% | 0.92%(+1.95)#49 | 1.2%(+1.69)#2,000 |
| 4. | 45229 | 2.0% | 0.92%(+1.09)#84 | 1.2%(+0.829)#3,444 |
| 5. | 45243 | 2.0% | 0.92%(+1.06)#86 | 1.2%(+0.803)#3,513 |
| 6. | 45206 | 1.9% | 0.92%(+0.938)#97 | 1.2%(+0.679)#3,831 |
| 7. | 45226 | 1.8% | 0.92%(+0.863)#107 | 1.2%(+0.604)#4,035 |
| 8. | 45230 | 1.8% | 0.92%(+0.830)#111 | 1.2%(+0.571)#4,123 |
| 9. | 45223 | 1.8% | 0.92%(+0.829)#112 | 1.2%(+0.570)#4,132 |
| 10. | 45245 | 1.7% | 0.92%(+0.804)#115 | 1.2%(+0.545)#4,211 |
| 11. | 45220 | 1.7% | 0.92%(+0.747)#118 | 1.2%(+0.488)#4,415 |
| 12. | 45242 | 1.5% | 0.92%(+0.589)#139 | 1.2%(+0.331)#4,987 |
| 13. | 45227 | 1.5% | 0.92%(+0.575)#141 | 1.2%(+0.317)#5,055 |
| 14. | 45209 | 1.5% | 0.92%(+0.533)#144 | 1.2%(+0.274)#5,224 |
| 15. | 45215 | 1.2% | 0.92%(+0.264)#188 | 1.2%(+0.005)#6,577 |
| 16. | 45244 | 1.1% | 0.92%(+0.206)#202 | 1.2%(-0.053)#6,934 |
| 17. | 45213 | 1.1% | 0.92%(+0.130)#218 | 1.2%(-0.129)#7,455 |
| 18. | 45219 | 0.86% | 0.92%(-0.070)#274 | 1.2%(-0.329)#8,973 |
| 19. | 45251 | 0.84% | 0.92%(-0.086)#276 | 1.2%(-0.344)#9,109 |
| 20. | 45237 | 0.82% | 0.92%(-0.107)#278 | 1.2%(-0.366)#9,292 |
| 21. | 45211 | 0.78% | 0.92%(-0.148)#296 | 1.2%(-0.406)#9,667 |
| 22. | 45232 | 0.77% | 0.92%(-0.153)#299 | 1.2%(-0.412)#9,734 |
| 23. | 45241 | 0.75% | 0.92%(-0.178)#309 | 1.2%(-0.437)#9,957 |
| 24. | 45218 | 0.74% | 0.92%(-0.186)#314 | 1.2%(-0.445)#10,023 |
| 25. | 45212 | 0.73% | 0.92%(-0.195)#318 | 1.2%(-0.454)#10,101 |
| 26. | 45204 | 0.69% | 0.92%(-0.230)#331 | 1.2%(-0.489)#10,463 |
| 27. | 45238 | 0.66% | 0.92%(-0.268)#349 | 1.2%(-0.527)#10,859 |
| 28. | 45233 | 0.59% | 0.92%(-0.332)#375 | 1.2%(-0.591)#11,538 |
| 29. | 45246 | 0.59% | 0.92%(-0.339)#378 | 1.2%(-0.598)#11,611 |
| 30. | 45247 | 0.54% | 0.92%(-0.380)#399 | 1.2%(-0.639)#12,115 |
| 31. | 45216 | 0.51% | 0.92%(-0.419)#413 | 1.2%(-0.678)#12,552 |
| 32. | 45231 | 0.47% | 0.92%(-0.454)#433 | 1.2%(-0.713)#12,999 |
| 33. | 45249 | 0.42% | 0.92%(-0.507)#460 | 1.2%(-0.766)#13,629 |
| 34. | 45248 | 0.41% | 0.92%(-0.514)#466 | 1.2%(-0.773)#13,725 |
| 35. | 45224 | 0.36% | 0.92%(-0.568)#496 | 1.2%(-0.827)#14,377 |
| 36. | 45236 | 0.34% | 0.92%(-0.583)#501 | 1.2%(-0.842)#14,561 |
| 37. | 45207 | 0.30% | 0.92%(-0.622)#522 | 1.2%(-0.881)#15,002 |
| 38. | 45239 | 0.21% | 0.92%(-0.714)#579 | 1.2%(-0.973)#16,085 |
| 39. | 45217 | 0.18% | 0.92%(-0.745)#593 | 1.2%(-1.00)#16,404 |
| 40. | 45240 | 0.18% | 0.92%(-0.748)#594 | 1.2%(-1.01)#16,436 |
| 41. | 45205 | 0.083% | 0.92%(-0.842)#631 | 1.2%(-1.10)#17,251 |
1
Common Questions
What are the Top 10 Zip Codes with the Highest Percentage of Population Employed in Legal Services & Support in Cincinnati, OH?
Top 10 Zip Codes with the Highest Percentage of Population Employed in Legal Services & Support in Cincinnati, OH are:
What zip code has the Highest Percentage of Population Employed in Legal Services & Support in Cincinnati, OH?
45208 has the Highest Percentage of Population Employed in Legal Services & Support in Cincinnati, OH with 4.0%.
What is the Percentage of Population Employed in Legal Services & Support in Cincinnati, OH?
Percentage of Population Employed in Legal Services & Support in Cincinnati is 1.3%.
What is the Percentage of Population Employed in Legal Services & Support in Ohio?
Percentage of Population Employed in Legal Services & Support in Ohio is 0.92%.
What is the Percentage of Population Employed in Legal Services & Support in the United States?
Percentage of Population Employed in Legal Services & Support in the United States is 1.2%.