Zip Codes with the Highest Percentage of Households with Income Below $10,000 in Schenectady, NY
RELATED REPORTS & OPTIONS
Household Income | $0-10k
Schenectady
Compare Zip Codes
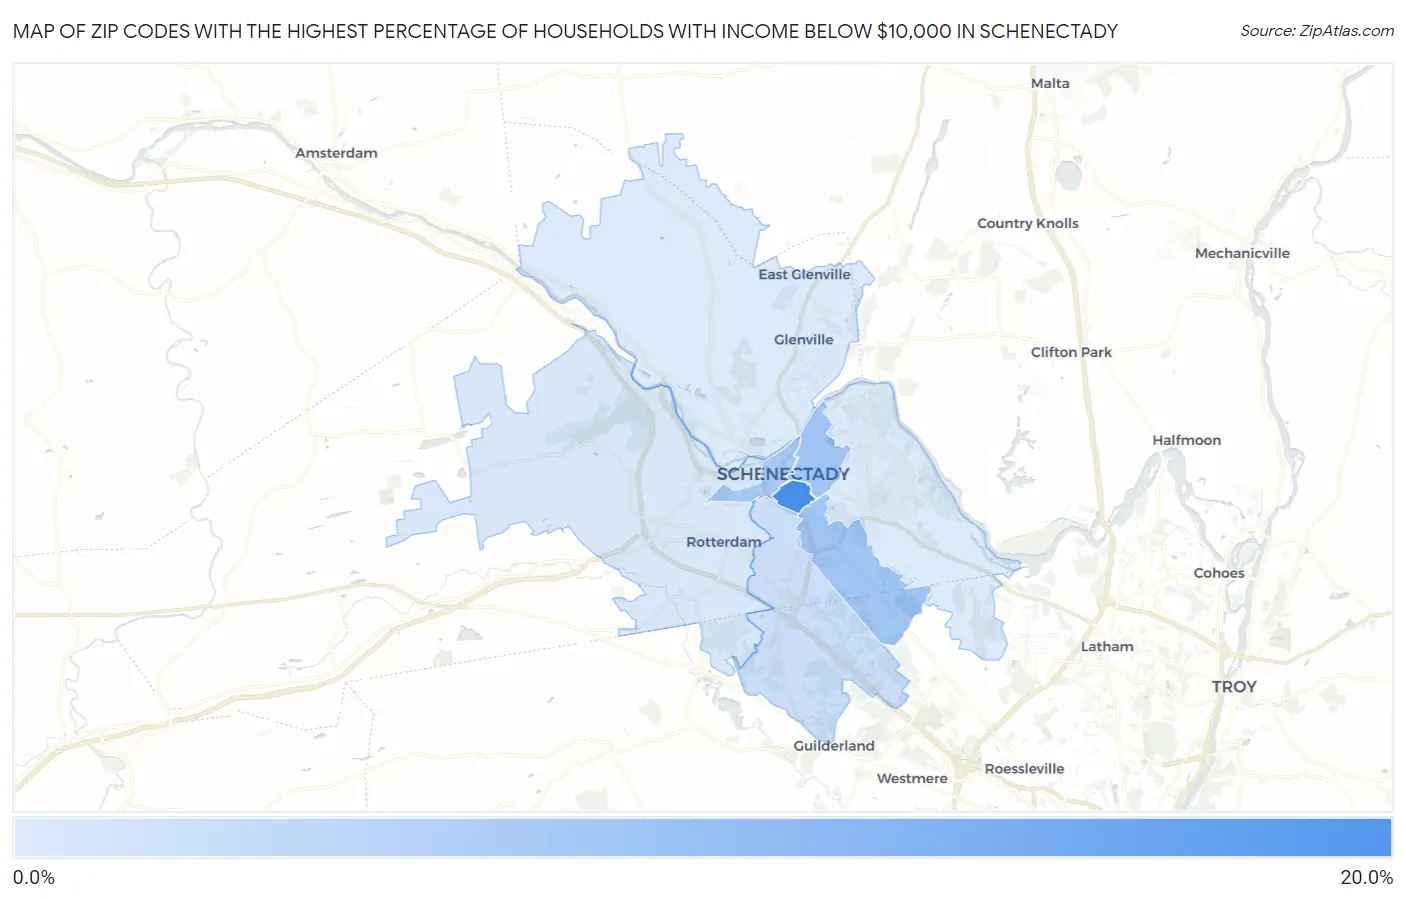
Map of Zip Codes with the Highest Percentage of Households with Income Below $10,000 in Schenectady
1.9%
16.4%
Zip Codes with the Highest Percentage of Households with Income Below $10,000 in Schenectady, NY
| Zip Code | Households with Income < $10k | vs State | vs National | |
| 1. | 12307 | 16.4% | 5.6%(+10.8)#43 | 4.9%(+11.5)#1,260 |
| 2. | 12308 | 7.5% | 5.6%(+1.90)#279 | 4.9%(+2.60)#6,228 |
| 3. | 12304 | 7.4% | 5.6%(+1.80)#286 | 4.9%(+2.50)#6,361 |
| 4. | 12305 | 6.9% | 5.6%(+1.30)#332 | 4.9%(+2.00)#7,171 |
| 5. | 12303 | 3.6% | 5.6%(-2.00)#821 | 4.9%(-1.30)#16,845 |
| 6. | 12306 | 2.4% | 5.6%(-3.20)#1,107 | 4.9%(-2.50)#22,038 |
| 7. | 12309 | 1.9% | 5.6%(-3.70)#1,209 | 4.9%(-3.00)#23,990 |
| 8. | 12302 | 1.9% | 5.6%(-3.70)#1,212 | 4.9%(-3.00)#24,006 |
1
Common Questions
What are the Top 5 Zip Codes with the Highest Percentage of Households with Income Below $10,000 in Schenectady, NY?
Top 5 Zip Codes with the Highest Percentage of Households with Income Below $10,000 in Schenectady, NY are:
What zip code has the Highest Percentage of Households with Income Below $10,000 in Schenectady, NY?
12307 has the Highest Percentage of Households with Income Below $10,000 in Schenectady, NY with 16.4%.
What is the Percentage of Households with Income Below $10,000 in Schenectady, NY?
Percentage of Households with Income Below $10,000 in Schenectady is 8.1%.
What is the Percentage of Households with Income Below $10,000 in New York?
Percentage of Households with Income Below $10,000 in New York is 5.6%.
What is the Percentage of Households with Income Below $10,000 in the United States?
Percentage of Households with Income Below $10,000 in the United States is 4.9%.