Zip Codes with the Highest Percentage of Households with Income Below $10,000 in Keeseville, NY
RELATED REPORTS & OPTIONS
Household Income | $0-10k
Keeseville
Compare Zip Codes
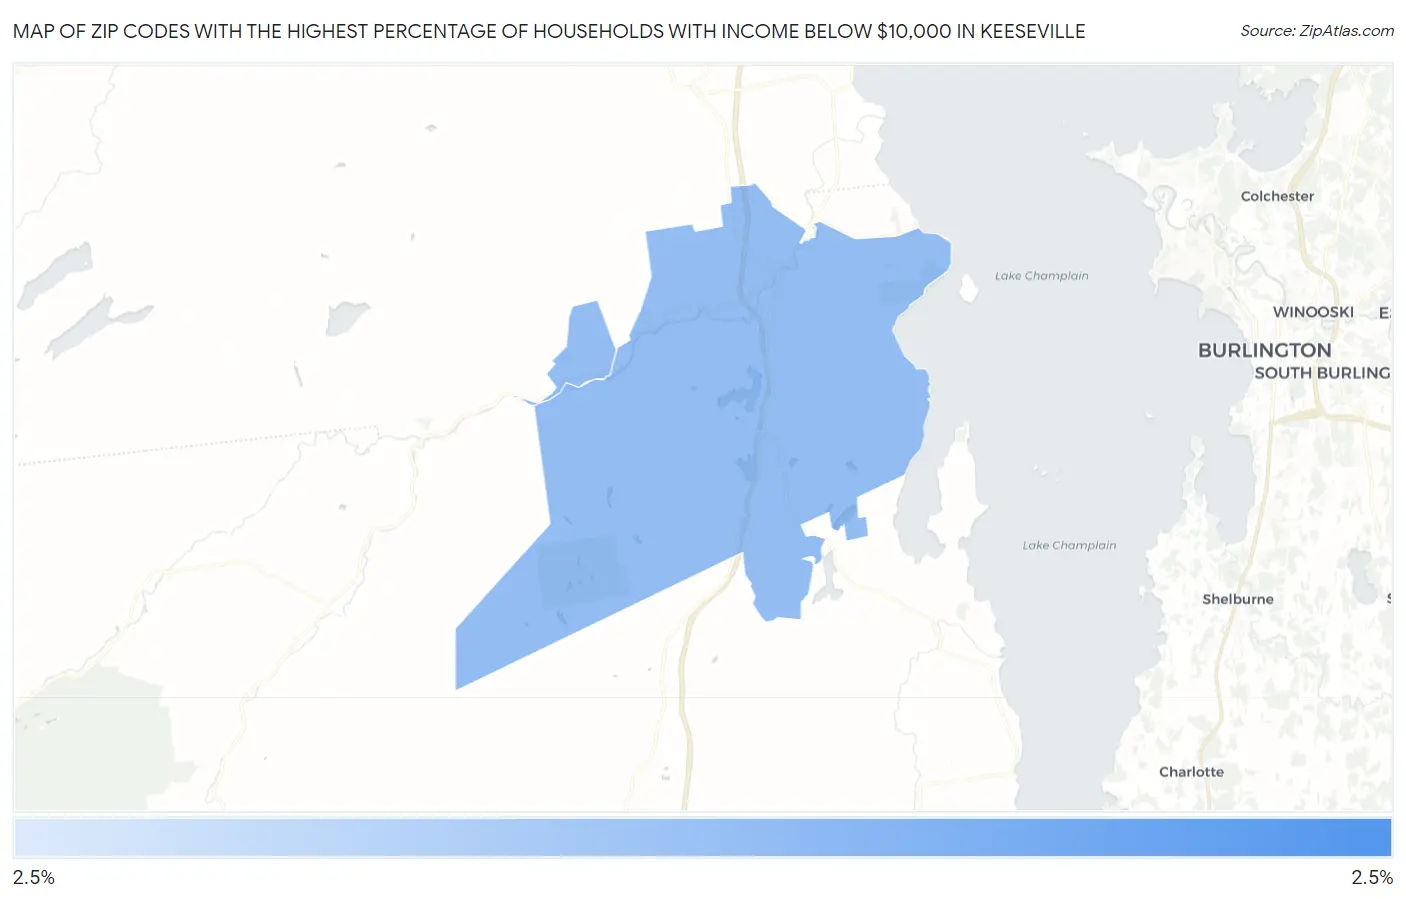
Map of Zip Codes with the Highest Percentage of Households with Income Below $10,000 in Keeseville
2.5%
2.5%
Zip Codes with the Highest Percentage of Households with Income Below $10,000 in Keeseville, NY
| Zip Code | Households with Income < $10k | vs State | vs National | |
| 1. | 12944 | 2.5% | 5.6%(-3.10)#1,091 | 4.9%(-2.40)#21,765 |
| 2. | 12924 | 2.5% | 5.6%(-3.10)#1,104 | 4.9%(-2.40)#21,946 |
1
Common Questions
What are the Top Zip Codes with the Highest Percentage of Households with Income Below $10,000 in Keeseville, NY?
Top Zip Codes with the Highest Percentage of Households with Income Below $10,000 in Keeseville, NY are:
What zip code has the Highest Percentage of Households with Income Below $10,000 in Keeseville, NY?
12944 has the Highest Percentage of Households with Income Below $10,000 in Keeseville, NY with 2.5%.
What is the Percentage of Households with Income Below $10,000 in Keeseville, NY?
Percentage of Households with Income Below $10,000 in Keeseville is 3.5%.
What is the Percentage of Households with Income Below $10,000 in New York?
Percentage of Households with Income Below $10,000 in New York is 5.6%.
What is the Percentage of Households with Income Below $10,000 in the United States?
Percentage of Households with Income Below $10,000 in the United States is 4.9%.