Zip Codes with the Highest Percentage of Households with Income Below $10,000 in Floral Park, NY
RELATED REPORTS & OPTIONS
Household Income | $0-10k
Floral Park
Compare Zip Codes
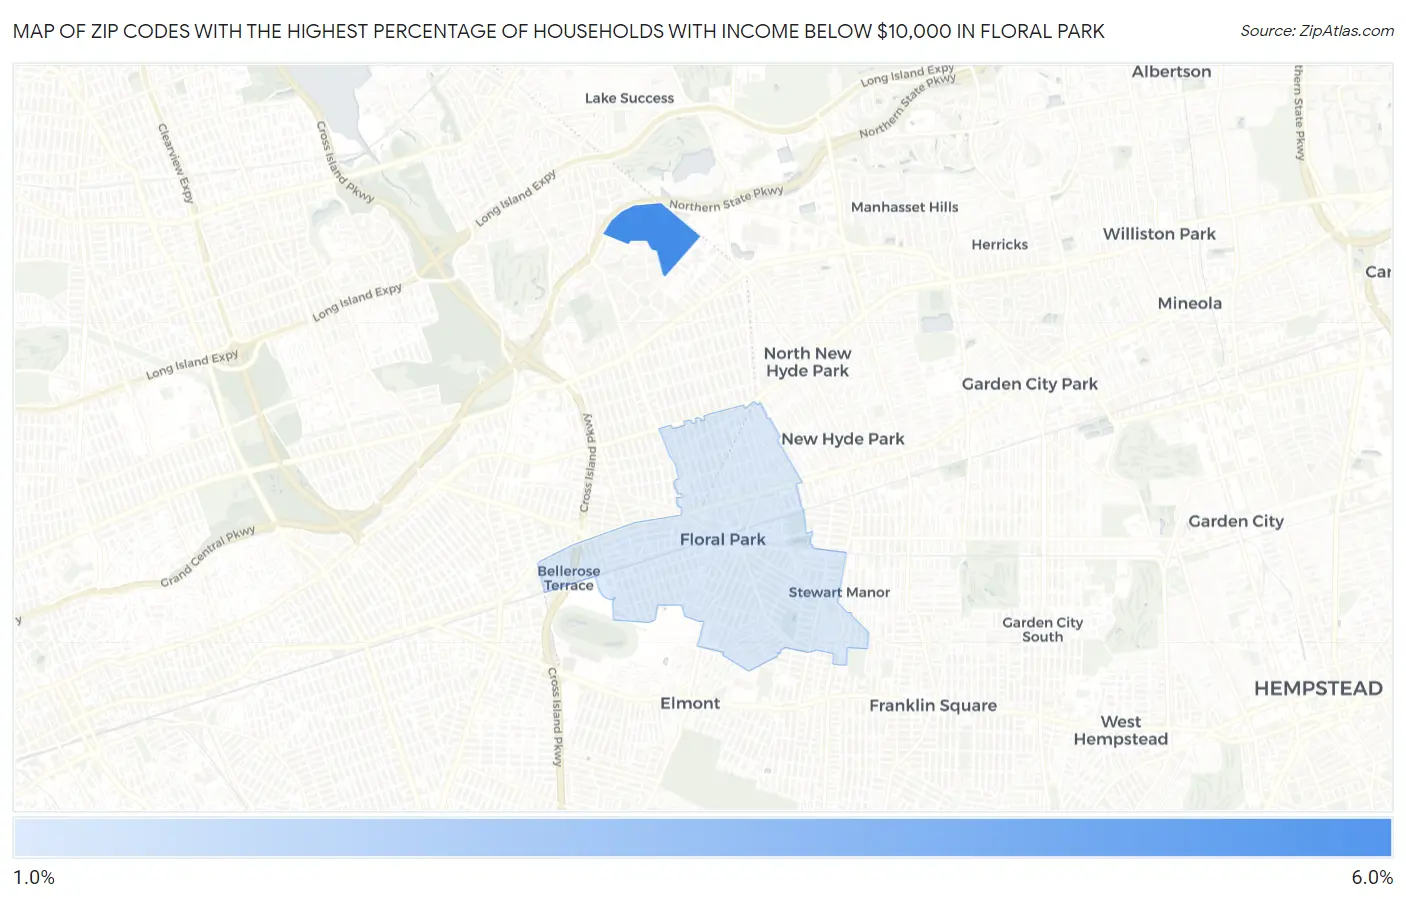
Map of Zip Codes with the Highest Percentage of Households with Income Below $10,000 in Floral Park
1.3%
5.1%
Zip Codes with the Highest Percentage of Households with Income Below $10,000 in Floral Park, NY
| Zip Code | Households with Income < $10k | vs State | vs National | |
| 1. | 11005 | 5.1% | 5.6%(-0.500)#548 | 4.9%(+0.200)#11,536 |
| 2. | 11001 | 1.3% | 5.6%(-4.30)#1,334 | 4.9%(-3.60)#26,018 |
1
Common Questions
What are the Top Zip Codes with the Highest Percentage of Households with Income Below $10,000 in Floral Park, NY?
Top Zip Codes with the Highest Percentage of Households with Income Below $10,000 in Floral Park, NY are:
What zip code has the Highest Percentage of Households with Income Below $10,000 in Floral Park, NY?
11005 has the Highest Percentage of Households with Income Below $10,000 in Floral Park, NY with 5.1%.
What is the Percentage of Households with Income Below $10,000 in Floral Park, NY?
Percentage of Households with Income Below $10,000 in Floral Park is 1.6%.
What is the Percentage of Households with Income Below $10,000 in New York?
Percentage of Households with Income Below $10,000 in New York is 5.6%.
What is the Percentage of Households with Income Below $10,000 in the United States?
Percentage of Households with Income Below $10,000 in the United States is 4.9%.